期末報告
Clawbacks 條款, 權益基礎薪酬與審計委員會之審計公費決定
計 畫 類 別 : 個別型計畫 計 畫 編 號 : MOST 103-2410-H-004-031-執 行 期 間 : 103年08月01日至104年08月31日 執 行 單 位 : 國立政治大學會計學系 計 畫 主 持 人 : 俞洪昭 共 同 主 持 人 : 程心瑤 計畫參與人員: 碩士級-專任助理人員:黃志斌 報 告 附 件 : 出席國際會議研究心得報告及發表論文 處 理 方 式 : 1.公開資訊:本計畫涉及專利或其他智慧財產權,1年後可公開查詢 2.「本研究」是否已有嚴重損及公共利益之發現:否 3.「本報告」是否建議提供政府單位施政參考:否中 華 民 國 104 年 12 月 15 日
據2004至2013年間的 1707 觀察值,本研究發現權益基礎薪酬與審 計公費之間呈現相反關係。這個結果意謂著權益基礎薪酬可能誘使 審計委員會妥協其獨立性,因此購買較少之審計服務。本研究進一 步發現,較低的審計公費導致會計師提供較少的審計努力與較低的 盈餘品質。這些發現具有管制面的意涵。 中 文 關 鍵 詞 : 審計委員會權益基礎薪酬, 會計師獨立性, 審計公費, 會計師選擇 英 文 摘 要 : Motivated by Section 301 of SOX and the widespread use of
stocks and options to compensate firms’ independent directors, I examine the relation between equity-based compensation paid to audit committee members and audit fees. Based on a sample of 1,707 firm-year observations during 2004-2013, I find a negative relation between audit committee equity incentives (measured by portfolio delta and vega) and audit fees, consistent with our prediction that larger equity incentives may induce audit committee members to compromise independence by paying lower audit fees. I further show that this lower audit fee level is associated with lower audit effort and lower earnings quality. These findings are robust to controlling for endogeneity, firms’ ex ante litigation risk, and relative power of CFOs and audit committees. These results bear important implications for regulators and investors. 英 文 關 鍵 詞 : Audit committee equity incentives, Auditor independence,
1
1. INTRODUCTION
We investigate whether and how equity-based compensation (i.e., stocks and options) paid to members of the audit committee (AC) is related to audit fees. Over the past decades, the pricing of audits has raised serious concerns because auditors may sacrifice independence to derive economic benefits from retaining a client (AICPA’s Cohen Report 1978;
Craswell and Francis 1999; Francis and Simon 1987; Francis et al. 2005; Johnstone and Bedard 2001; Magee and Tseng 1990). This potential impairment of independence has been criticized by regulators and market participants as one major reason for the recent accounting scandals. To address potential threats to auditor independence, Section 301 of the Sarbanes-Oxley Act (SOX) requires that ACs be directly responsible for the compensation and choice of auditors. The underlying reasons for the audit fee statutory requirement are that management may determine audit fees in the auditor’s favor when it makes auditor compensation decisions (Choi et al. 2010; Kinney and Libby 2002) and the auditor may view its role as serving management rather than users of financial statements, thus potentially compromising auditor independence. By empowering the audit committee to determine auditor compensation, regulators expect to eliminate management’s influence over the auditor and to better align the auditor’s incentives with those of the board and shareholders.
However, the widespread use of stocks and options to compensate firms’ non-executive AC directors (Engel et al. 2010)1 raises a potential concern not addressed by SOX that could
1We also document that, over the post-SOX period 2004-2013, the average percentage of firms that pay equity-based
compensation to their ACs is 99.95 percent. This finding provides strong evidence that use of AC equity compensation is more pervasive than we expect. We provide more details in Section 4.1.
2
adversely affect AC independence.2 Equity-based compensation could impair AC independence because it ties AC members’ wealth to the firm’s short-term and long-term financial performance. The objectivity of AC directors in determining appropriate audit fee levels may decrease when their compensation creates conflicts that induce them to compromise independence (Magilke et al. 2009). Prior empirical studies show that option compensation is associated with higher likelihood of restatements (e.g., Archambeault et al. 2008) and earnings management (e.g., Bedard et al. 2004). In addition, firms that demand less monitoring of financial reporting pay more equity-based compensation to their AC directors (Engel et al. 2010).
Unlike the findings discussed above, the corporate governance literature indicates that it may be beneficial to have outside directors own equity because equity ownership aligns their interests with those of shareholders (Fama and Jensen 1983; Monks and Minow 2011; Williamson 1984) and provides incentives for monitoring by outside directors (Beasley 1996). In addition, AC directors have strong economic incentives to maintain their reputation due to potential litigation exposure (Lennox and Park 2007; Naiker and Sharma 2009; Naiker et al. 2013).3 Further, some research finds that outside directors with poor monitoring records are disciplined by the labor market (Milgrom and Roberts 1992; Gerety and Lehn 1997). Additionally, equity-based compensation could help firms in attracting talented AC members who can effectively fulfill the duties delegated by SOX. These findings suggest that when AC directors receive more equity-based compensation, they are more likely to exercise due diligence to mitigate litigation risk and potential reputation loss.
2AC independence has received much attention from professional bodies and accounting academics because
independence is the cornerstone on which ACs can effectively exercise their delegated duty (e.g., Lennox and Park 2007; Menon and Williams 2004, 2008; Naiker and Sharma 2009; Public Oversight Board 1993; Srinivasan 2005). See Carcello et al. (2011a) for a detailed review of the literature on ACs.
3This is consistent with Yermack’s (2004) finding that 40% of total outside director incentives are related to
3
The preceding discussion indicates that, despite the requirement of SOX Section 301-(3) that all members of the AC be fully independent, the mixed results reported in the corporate governance and auditing literatures suggest that the net effect of equity-based compensation on AC independence remains an empirical question.4 We attempt to provide evidence on this relation.
Following Armstrong et al. (2013) and Core and Guay (2002), we measure AC equity-based incentives using portfolio delta and vega. Delta measures the sensitivity of equity holdings to changes in a firm’s stock price while vega measures the sensitivity to changes in the volatility of a firm’s stock return. Our hypotheses are predicated on a firm’s stock price (which is reflected in delta) and stock return volatility (which is reflected in vega) being related to the quality of its financial statements, which is influenced by how effectively the AC determines the audit fee level.
We identify four choices available to an AC that receives equity incentives. First, the AC may be more effective in monitoring a firm’s financial reporting because equity pay aligns AC members’ interests with those of shareholders. Because more effective oversight enhances firm’s internal governance, ACs are likely to demand less external monitoring from the auditor, suggesting lower audit quality and/or audit effort, and hence lower total audit fees. We refer to this as the alignment choice. Second, a more effective AC may require higher audit quality and/or audit effort to insure the credibility of the firm’s financial reports, implying higher audit fees. We refer to this as the monitoring choice. Third, AC independence may be compromised
4Prior studies have investigated equity-based compensation in areas such as the differential incentive effects of
stocks and options on managers’ behavior (e.g., Carpenter 2000; Ross 2004), short-term and long-term compensation on monitoring by the board of directors (e.g., Dalton et al. 2003; Hillman and Dalziel 2003), and choice between stocks and options (e.g., Kadan and Swinkels 2008). We do not explore or consider these issues. Instead, we regard stocks and options as two major components of equity-based compensation and test whether they jointly relate to AC effectiveness.
4
because stronger equity incentives tie AC members’ wealth to the firm’s stock performance, leading to ACs’ propensity to tolerate earnings management, perhaps to raise or maintain stock prices. Under this scenario, AC members may require lower audit quality and/or lower audit effort, which will be reflected in lower audit fees. We refer to this as the compromise choice. Fourth, ACs may have concerns that shareholders perceive them as less effective because they could benefit by not constraining earnings management. To convince shareholders that larger equity incentives do not exacerbate this potential agency problem, ACs may require higher audit quality and/or higher audit effort, resulting in higher audit fees. We refer to this as the agency
choice. We attempt to distinguish between these four choices in our empirical analysis.
Using a sample of 1,707 firm-year observations during 2004-2013, we regress firms’ audit fees on AC chairs’ equity portfolio delta and vega.5 We find a significant negative relation between AC chairs’ delta and audit fees, but do not find a significant relation between AC chairs’ vega and audit fees. These results are robust to controlling for firm, board, auditor, and AC characteristics that prior research has documented are related to audit fees, as well as to controlling for potential endogeneity. The evidence suggests that audit fees are lower when equity holdings tie AC chair’s wealth to stock price, as reflected in portfolio delta. In other words, higher stock price sensitivity may motivate the AC to choose a lower audit fee level. This result is consistent with the alignment and compromise choices, but not with the monitoring and agency choices.
Having documented a significant negative relation between AC equity incentives and
5We focus on the AC chair instead of the whole committee for several reasons. First, compensation data are available
for committee chairs but are often not available for other AC members. Second, because chairs are responsible for the effective functioning of the committees and establish procedures to govern the committees’ oversight work, they are usually more powerful, experienced, knowledgeable, and assume higher litigation risk. Therefore, AC chairs’ equity compensation is higher than that of other AC directors. Third, prior accounting and finance research generally computes equity delta and vega for a single director (e.g., CEO or CFO) rather than for a committee.
5
audit fees, we next conduct several tests to distinguish between the alignment and compromise choices. First, we use audit report lag and internal control weakness to capture audit effort and audit risk premium, respectively. The results show that, even though the auditor reacts to internal control weaknesses by increasing the risk premium, audit effort still decreases with AC equity portfolio delta. These results suggest that the decrease in audit fees is likely not due to a decrease in risk premium but rather to a decrease in audit effort and are consistent with the compromise choice. Second, if the alignment choice is valid, the AC should always be effective, regardless of whether the firm faces high or low litigation risk. However, we find a positive coefficient on equity delta for firms with high potential litigation risk. This result is not consistent with the
alignment choice. Third, we find a negative coefficient on equity delta after controlling for the
relative power of the CFO and the AC, which Beck and Mauldin (2014) show is related to audit fee determination. This result suggests that the findings in support of the compromise choice are not affected by the relative power of the CFO and the AC. Fourth, we examine whether firms whose ACs pay lower audit fees in year t-1 have lower earnings quality in year t. We find a negative relation between lagged audit fees and both discretionary accruals and accrual quality, suggesting that lower audit fees are associated with subsequent decreases in earnings quality. This result provides further evidence that firms whose ACs pay lower audit fees have a higher likelihood of future earnings management, consistent with the compromise choice. Fifth, if the
compromise choice is valid, we expect that the AC will prefer a non-industry expert auditor to
reduce the likelihood of detecting earnings management. The results show that ACs are less likely to hire national-level, city-level, and joint industry experts. In the last test, we control for management’s influence (Dhaliwal et al. 2015) in auditor selection and still find a negative relation between hiring an industry expert auditor and portfolio equity delta. This result indicates
6
that our auditor choice result is not sensitive to management influence. Overall, our empirical findings are consistent with the compromise choice, which predicts that larger equity incentives impair AC independence, leading to lower audit fees and appointment of non-industry-expert auditors.6
Our study makes several contributions to the literature. First, while recent research uses earnings management measures (e.g., Bedard et al. 2004), restatement likelihood (e.g., Archambeault et al. 2008), internal control weaknesses (e.g., Naiker and Sharma 2009), and approval for procuring non-audit services from the current auditors (e.g., Naiker et al. 2013) to capture AC effectiveness, no prior study has examined whether equity incentives relate to AC independence, which in turn influences the determination of audit fees and auditor choice. Our study provides a first attempt at addressing this question. Specifically, we document that equity incentives may adversely influence AC ability to independently determine audit fees and appoint auditors. Second, even though Section 301-(3) of SOX mandates that all AC members should be fully independent, it is possible that these members satisfy this requirement when they are newly appointed, but become less independent as they keep receiving equity-based compensation during their tenure. Therefore, the answers to the question of whether new regulations are needed
6Sengupta and Zhang (2015) report a positive relation between independent directors’ equity-based compensation
and firm’s disclosure quality (measured by management earnings guidance and information flow through analysts). Our empirical results differ from theirs in three important ways. First, Sengupta and Zhang (2015) adopt the ratio of equity-based pay to total pay to measure the effect of equity pay on independent directors. While this ratio captures the compensation mix effect, it may not measure how directors’ wealth changes due to the equity pay. Because portfolio delta and vega directly link equity incentives to stock prices and volatility of stock returns, they can better capture equity compensation’s wealth effect. Second, different from other independent directors, AC members play the dual and perhaps conflicting roles of simultaneously managing business operations and overseeing board decisions (e.g., Ezzamel and Watson: 1997; Magilke et al. 2009). A recent survey report (NACD 2014) indicates that “… Before SOX, board compensation tended to be one-size-fits-all, the same for every board member. After SOX, the increased demands on ACs drove initial compensation differentiation in an effort to recognize the impact on workload for those members. Before long, compensation committee pay followed suit, with the rise in pressure and visibility of that role. Today, it is common to find a three-tiered board compensation structure with ACs at the top, then compensation committees, and all remaining committees in a third group.” Finally, because management’s earnings guidance is not subjected to audit, the relation between firms’ disclosure quality and the determination of audit fees and auditor choice is remote.
7
to govern how ACs should be compensated to ensure their effectiveness over time have important policy implications for regulators. Finally, even though prior studies have shown that options paid to ACs are associated with lower earnings quality (e.g., Archambeault et al. 2008; Bedard et al. 2004; Campbell et al. 2015), they do not explore the underlying reason why equity compensation jeopardizes earnings quality. Also, the use of option values may not fully capture the wealth effect of equity on AC members. Our study looks into this “black box” by showing that stock and option payments may impair AC independence because these equity incentives tie AC members’ wealth to firms’ stock prices. Once ACs become less effective, they will purchase less audit effort by paying lower audit fees and hiring non-industry experts, resulting in lower quality of earnings.
The remainder of this paper is organized as follows. Section 2 reviews related research and develops our hypotheses. Section 3 describes the basic research design, including the dependent and independent variable measures, econometric models, and sample selection procedures. Section 4 discusses the empirical findings and Section 5 concludes.
2. PRIOR LITERATURE AND HYPOTHESIS DEVELOPMENT 2.1 Overview of Related Literature
2.1.2 Equity-based compensation and audit committee independence
While Section 301-(3) of SOX requires that members of an AC be fully independent, it is silent in how committee members should be compensated to maintain their independence in fact over time. Therefore, an investigation of the association between equity-based compensation and AC independence is important. Recent empirical studies examine this issue and provide some new evidence. For example, using pre-SOX data, Archambeault et al. (2008) find that firms whose AC directors receive both short-term and long-term options have a higher likelihood of
8
restatement. Short-term options induce committee members’ short-term orientation that possibly undermines their independence, whereas the payoffs from long-term options are highly uncertain and may be too small to induce committee members to monitor financial reporting effectively. In contrast, Engel et al. (2010) use both pre- and post-SOX data and find that firms are more likely to structure AC compensation as fixed pay when there is a high demand for monitoring. Specifically, AC compensation increases after SOX. Campbell et al. (2015) use post-SOX data and show that options (rather than stocks) paid to the AC members are positively associated with the likelihood of beating analyst earnings benchmarks. This evidence suggests that, even after SOX, option awards create an economic bond between ACs and firms’ market performance, leading to reduced monitoring effectiveness. Keune and Johnstone (2015) also use post-SOX data and report that short-term option compensation is more likely to motivate ACs to waive managers’ income-decreasing misstatements which, if corrected, would have caused the firms to miss analyst forecasts. In contrast, there is a positive relation between long-term option compensation and the likelihood that ACs will waive managers’ income-increasing misstatements when the firms report just missing, meeting, or beating analyst forecasts. The authors conclude that agency conflicts may arise when compensating ACs with options.
Our study differs from these recent studies in three important ways. First, the use of option values in Archambeault et al. (2008), Campbell et al. (2015), and Keune and Johnstone (2015) may not appropriately capture the total wealth effect of equity incentives (which includes both stocks and options) on AC independence. Equity holdings are a stock measure whereas option grants are a flow measure. Core and Guay (2002), Core et al. (2003), and others discuss why portfolio delta and vega are more appropriate measures. Moreover, recent studies examining the relation between executives’ equity incentives and earnings management stress the
9
importance of including both these measures in the empirical specification. Second, even though Engel et al. (2010) find that the demand for monitoring is an important determinant of AC compensation, they do not explore whether equity incentives impair or enhance the effectiveness of ACs. Finally, Archambeault et al. (2008), Engel et al. (2010), and Campbell et al. (2015) do not examine the association between AC independence and audit fees and auditor choice, which is the focus of our study.
2.1.3 Threats to audit committee effectiveness
Naiker and Sharma (2009) examine whether the presence of former audit partners on an AC harms the committee’s independence, and leads to oversight failure in internal control weaknesses. They find that former audit partners who are affiliated with a firm’s current auditors enhance AC oversight effectiveness, which in turn improves internal controls and financial reporting quality. In a related study, Naiker et al. (2013) examine whether the presence of former audit partners on the AC who are affiliated with the current auditors impairs the independence of both the AC and the auditors by increasing purchases of non-audit services. The authors empirically show that the presence of former audit partners on the AC is negatively associated with the procurement of non-audit services from the current auditor. Both studies conclude that the 3-year cooling period requirement specified by the NYSE and NASDAQ is not necessary.
Our study differs from these two studies in two notable ways. First, whereas both these studies use the presence of former audit partners affiliated with the current auditor as the threat to AC effectiveness, we examine whether equity-based compensation impairs or enhances the monitoring effectiveness of ACs. Given the widespread use of equity to compensate AC members (Engel et al. 2010), our results inform about the implications of AC compensation practices. Second, whereas Naiker and Sharma (2009) and Naiker et al. (2013) use internal
10
control weaknesses and the purchase of non-audit services, respectively, to capture the effectiveness of ACs, we examine how AC equity compensation relates to audit pricing and auditor choice decisions. Although SOX was passed more than a decade ago, there is little archival research using post-SOX data on factors related to audit fee determination and auditor selection by ACs. We provide empirical evidence on these issues.
2.1.4 Audit committees and audit fees
More effective ACs may be associated with lower audit fees due to auditors’ lower audit risk assessment or ACs’ lower demand for audit effort given their own monitoring effectiveness. However, more effective ACs may also be associated with higher audit fees due to higher demand for external monitoring to protect their reputational capital and reduce their litigation risk (Carcello et al. 2002; Carcello et al. 2011b). Using pre-SOX data, prior studies examine the association between AC characteristics and audit fees but provide mixed results. For example, some research finds that audit fees increase in AC percentage of outside directors, accounting or financial expertise (e.g., Abbott et al. 2003; Carcello et al. 2002), diligence (e.g., Lee and Mande 2005), experience, and size (e.g., Vafeas and Waegelein 2007). This is consistent with the notion that effective ACs demand greater audit effort. In contrast, other research reports that audit fees are negatively associated with AC expertise (e.g., Krishnan and Visvanathan 2009) and tenure (e.g., Chan et al. 2013). This result is consistent with the notion that effective ACs are associated with lower audit risk and lower demand for external monitoring.7
Two recent studies use post-SOX data to investigate the association between executives’ influences on ACs and audit fees. Bruyneseels and Cardinaels (2014) examine whether CEOs
7The existing literature also shows that audit fees are negatively associated with corporate governance. For example,
Bedard and Johnstone (2004) find that weak corporate governance increases audit risk, leading to increased audit effort and billing rates. Tsui et al. (2001) show that audit fees are negatively associated with the existence of independent boards, implying that board governance substitutes for, rather than complements to, external auditing.
11
appoint AC members from their social networks and whether such social ties impair the quality of ACs. They show that only non-professional (rather than employment and education) social ties harm the quality of ACs, leading to larger discretionary accruals, less demand for audit effort (proxied by audit fees), and lower likelihood of receiving a going-concern opinion and internal control weakness report. In contrast, Beck and Mauldin (2014) test whether the relative power of the CFO and the AC (measured by their corresponding tenures) relates to audit fees. Specifically, the authors utilize the 2008-2009 financial crisis as an exogenous shock to ensure that audit fee changes are not due to auditors’ endogenous assessment of AC or CFO quality. The empirical results indicate that, during the crisis period, there is a larger audit fee reduction when the CFOs are more powerful and a smaller audit fee reduction when the ACs are more powerful. These findings are consistent with conflicting CFO and AC goals in audit fee determination during the crisis period.
Our study differs from this strand of literature in several important ways. First, while prior studies focus on whether AC characteristics and executive influences affect AC determination of audit fees, we focus on equity incentives and test whether ACs receiving more equity pay demand a higher or lower level of audits. Second, because CEO social ties and CFO power8 are not publicly observable to market participants, it is not feasible for regulators to implement rules or standards to mitigate the adverse effects of these executive influences on AC effectiveness. In contrast, because all listed firms are mandated to disclose their director compensation in the proxy statements, AC equity-based compensation is publicly observable to investors. Therefore, our study provides evidence based on which regulators could possibly
8Even though less frequently studied, analogous measure conceptually exists for CFO power. For example,
Finkelstein (1992) suggests that CEO power consists of four major components: structural power, which is CEO’s formal position in a company, ownership power, which is CEO’s ownership in a company, expert power, which is CEO’s expertise and capability, and prestige power, which is CEO’s social networking ability. Therefore, tenure only captures CFO’s expert power but not the other three.
12
specify restrictions on AC compensation practices. Third, audit fees are generally determined by audit effort, which is reflected in audit hours, and risk premium, which is reflected in hourly rate charged (Bell et al. 2001). Thus, a decrease in audit fees may be due to a decrease in audit effort or risk premium, or both. However, many prior studies do not distinguish between these two audit fee determinants.9 We test these two determinants separately and show that it is the decrease in audit effort that drives the decrease in audit fees. Finally, prior research has not examined the association between AC effectiveness and auditor choice. Our study provides a first step in addressing this issue.
2.2 Hypothesis Development
We reason that when members of an AC receive larger equity incentives from the firm, they have four possible choices. First, following the basic concept of alignment theory (Lambert et al. 2007; Nyberg et al. 2010) and prior governance literature (e.g., Fama and Jensen 1983; Monks and Minow 2011; Williamson 1984), larger equity-based compensation may align AC members’ interests with shareholders’ interests (Keune and Johnstone 2015; Lambert 2001), and thereby lead to more effective ACs. Since more effective oversight enhances a firm’s internal governance system, ACs may demand less external monitoring from their auditors (Chan et al. 2013; Krishnan and Visvanathan 2009), suggesting a reduction in audit fees. We refer to this as the AC alignment choice.
Second, in contrast to the alignment choice, more effective ACs may also demand higher audit quality in order to enhance the integrity of firms’ financial statements (Abbott et al. 2003;
9A lack of distinction between audit effort and risk premium can also be found in research examining the effect of
audit fees on audit quality. On the one hand, some studies find that higher audit fees imply higher level of audit effort, leading to lower likelihood of restatements (Blankley et al. 2012). On the other hand, some studies indicate that higher audit fees are indicator of bribery and conspiracies between managers and auditors (Kinney and Libby 2002). DeFond and Zhang (2014) conclude that an increase in audit fees does not unambiguously indicate higher level of audit quality.
13
Carcello et al. 2011b; Knechel and Willekens 2006), maintain their reputation capital (Fama 1980), and avoid litigation exposure (Lennox and Park 2007; Naiker and Sharma 2009; Naiker et al. 2013). Prior research documents that ACs are sensitive to risk (e.g., Krishnan and Visvanathan 2009). Because ACs have a direct influence on the scope of auditors’ work (Beasley et al. 2009; Carcello et al. 2002), AC demand for high quality audits usually requires greater audit effort. This suggests an increase in audit fees. We refer to this as the AC monitoring choice.
Third, following the basic concept of entrenchment theory (Jensen and Ruback 1983; Shleifer and Vishny 1989), entrenched AC members may be more likely to tolerate managers’ earnings manipulation to drive up stock price so that they can earn personal gains from exercising options or selling stocks. Regulators and the press have expressed serious concerns about whether equity-based compensation compromises AC independence, because stocks and options tie AC members’ wealth to firms’ short-term and long-term financial performance (e.g., Barrier 2002; Millstein 2002; Wall Street Journal 2006). Prior studies also indicate that AC economic incentives may, under some circumstances, encourage self-interest rather than encouraging actions that benefit the interests of shareholders (e.g., Dalton et al. 2003; Hillman and Dalziel 2003). If AC members’ choice is consistent with this self-interest notion, they will be less likely to demand more external verification from the auditor, suggesting a reduction in audit fees. We refer to this as the AC compromise choice.
Fourth, somewhat similar to the third choice, AC members receiving more equity incentives may have concerns that shareholders perceive them as less effective because they could benefit from allowing earnings management. To convince shareholders that larger equity-based compensation does not increase agency problems, AC members may pay higher audit fees to buy higher quality audits or demand more audit effort. This suggests an increase in
14 audit fees. We refer to this as the AC agency choice.
The four scenarios discussed above lead to the following four (competing) hypotheses: H1a (Alignment choice): If higher equity incentives motivate ACs to be more effective
and to therefore demand less external monitoring from the auditor, then AC equity incentives will be negatively related to audit fees.
H1b (Monitoring choice): If higher equity incentives motivate ACs to be more effective
and to therefore demand more external monitoring from the auditor, then AC equity incentives will be positively related to audit fees.
H1c (Compromise choice): If higher equity incentives motivate ACs to be less effective in
overseeing managers’ reporting behavior and to therefore demand less external monitoring from the auditor, then AC equity incentives will be negatively related to audit fees.
H1d (Agency choice): If higher equity incentives motivate ACs to reduce perceived
agency problems and to therefore demand more external monitoring from the auditor, then AC equity incentives will be positively related to audit fees.
3. RESEARCH DESIGN 3.1 Audit Fee Model
We employ the following model (1) to examine the relation between AC equity incentives and audit fees (for brevity, we omit firm and year subscripts):
Ln(AF) = 0 + 1AC_DELTA +2AC_VEGA + 3SIZE + 4LEV + 5NEW_FIN
+ 6QUICK + 7RECINV + 8ROA + 9BM + 10GROWTH
+ 11FOREIGN + 12SEGMENT + 13LOSS + 14GC + 15STDCF
+ 16OTHER_BDSIZE + 17BDIND + 18BIG4 + 19Ln(NAS)
+ 20INITIAL + 21EXPERTISE + 22ACSIZE + Fixed effects + , (1) We provide detailed variable definitions in the appendix.
Model (1) relates our primary dependent variable, the natural log of audit fees (Ln(AF)), to AC chair’s equity incentives (AC_DELTA and AC_VEGA) and several control variables that
15
include previously identified determinants of audit fees. By including these variables, model (1) explicitly controls for the normal level of audit fees. Thus, the coefficients on AC_DELTA and
AC_VEGA (i.e., 1 and 2) represent the relation between abnormal audit fees and the component of delta and vega that is orthogonal to the control variables. A negative (positive) coefficient on AC_DELTA is consistent with hypotheses H1a and H1c (H1b and H1d).
The variables of interest are AC chair’s equity incentives, measured as portfolio delta and vega. Both variables are estimated following Core and Guay (2002), Armstrong et al. (2013), and Kim et al. (2015). Equity portfolio delta is the price sensitivity of portfolio value, estimated as the change in the dollar value of an AC chair’s equity holdings for a 1 percent change in stock price. Equity portfolio vega is the risk sensitivity of portfolio value, estimated as the change in the dollar value of an AC chair’s equity holdings for a 1 percent change in the firm’s stock return volatility. We estimate delta and vega separately for each component of the equity portfolio (i.e., stocks, new options granted in the current year, exercisable options, and unexercisable options) and aggregate all components to obtain portfolio delta and vega for an AC chair. Our test variables, AC_DELTA and AC_VEGA, are the natural logarithm of one plus AC chair’s equity portfolio delta and vega, respectively.
Model (1) controls for firm, board, auditor, and AC characteristics that prior studies have documented are associated with audit fees (e.g., Balsam et al. 2003; Kim et al. 2015; Kinney and Libby 2002; Lim and Tan 2008; Venkataraman et al. 2008).10 The firm-specific characteristics include firm size (SIZE), financing activities (LEV and NEW_FIN), short-term liquidity (QUICK and RECINV), profitability (ROA), future growth opportunities (BM and GROWTH), operational complexity (FOREIGN and SEGMENT), and operating risk (LOSS, GC, and STDCF). The board
16
characteristics include board size (OTHER_BDSIZE) and board independence (BDIND). The auditor characteristics include audit quality (BIG4), non-audit service fees (Ln(NAS)), type of audit engagement (INITIAL), and auditor industry expertise (EXPERTISE). The AC characteristic included is AC size (ACSIZE). See the appendix for detailed definitions of all the variables.
In addition to the variables listed above, we also include year and industry fixed effects to control for the potential effects due to macroeconomic, regulatory, and industry-specific factors on audit fees (Adams and Ferreira 2009). Because our tests rely on panel data, the residuals may be correlated across firms in each year and over time for each firm. Therefore, we cluster standard errors by firm and year (Petersen 2009).
3.2 Sample Selection
The initial sample consists of 3,946 firm-year observations with complete board characteristics and compensation data in BoardEx for the years 2004 through 2013.11, 12 We lose 2,231 observations when we merge this initial sample with Audit Analytics. We further exclude 105 observations representing firms in the financial services industry due to differences in their financial reporting characteristics. We also exclude 97 observations with missing data in
COMPUSTAT, resulting in a final sample of 1,707 firm-year observations. To control for the
potential effects of extreme values, we winsorize observations that fall in the top and bottom 1 percent of the sample distributions of the dependent and the continuous independent variables.
Table 1 shows the distribution of AC compensation by year. Panel A reports that, except for one firm in 2006, all other firms (99.95%) pay equity-based compensation to their AC
11We exclude years before 2004 because there is a substantial increase in audit fees due to required compliance with
Section 404-(a) of SOX beginning from 2004. This increase leads to a structural change (Kim et al. 2015) that may affect the relation between AC chairs’ equity incentives and audit fees.
12See Section 2 of Engelberg et al. (2013, 87-88) for details on BoardEx and the procedures followed for retrieving
17
members over the 12-year sample period. This result is consistent with the current trend of widespread use of stocks and options to compensate firms’ outside directors. The last two columns of Panel A indicate that the sample is evenly distributed across 2004~2013 except in the first year when there are fewer observations.
[Insert Table 1 Here]
Panel B presents the average amounts and proportions of total cash and equity-based compensation paid to the ACs in our sample. BoardEx only provides the total amount of equity compensation. Also, it does not provide separate meeting fees data but includes them in “Others” and “Total Compensation.” Therefore, the total cash compensation reported in Panel B does not include meeting fees and we do not decompose equity-based compensation into stock and option components. Panel B indicates that the average cash compensation and cash proportion increase over time. In contrast, the average equity-based compensation increases while the equity proportion decreases. The large increase in equity may reflect firms’ increased use of restricted stock and decreased use of stock options after the issuance of SFAS 123 (R), which requires the expensing of employee stock options (Brown and Lee 2007; Mercer 2008). Finally, the average total compensation paid in 2013 is almost double the amount in 2004. This substantial increase may indicate that the demand for AC monitoring has increased during our sample period (Miller 2010; NACD 2014).
Table 2 provides the sample distribution and descriptive statistics for our main variables of interest. Average audit fees remain roughly stable, ranging from a low of about $5.2 million in 2006 to a high of about $7.1 million in 2011. While AC chairs’ equity delta peaks in 2004~2006 and then decreases slightly afterward, their equity vega increases steadily and peaks in 2010~2013. In terms of industry distribution (not tabulated), the following three industries
18
account for more than 70% of our sample: Manufacturing—durables (30.76%),
manufacturing—nondurables (21.73%), and Transportation and Utilities (17.75%).
[Insert Table 2 Here]
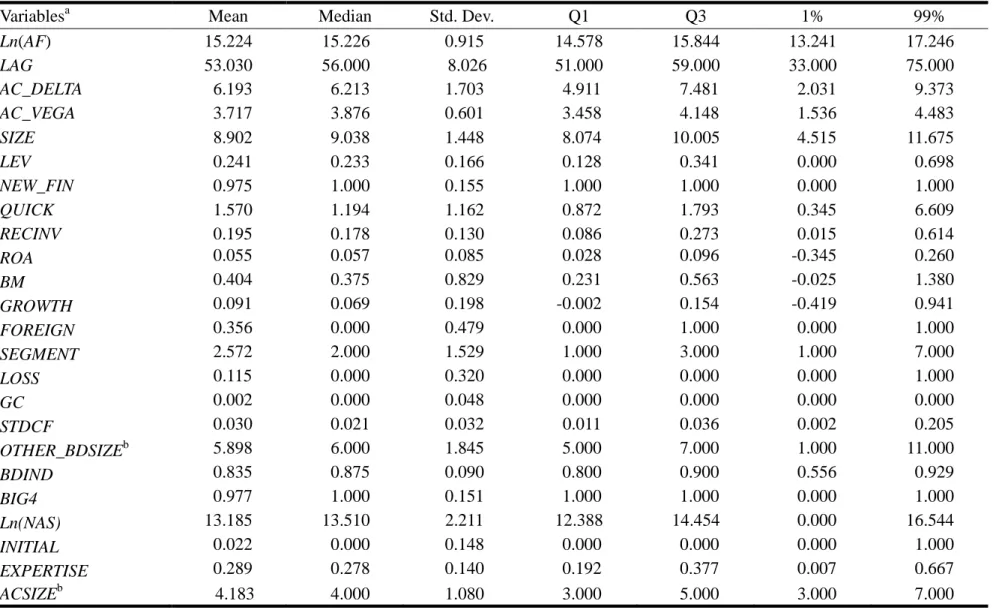
Panel A of Table 3 reports descriptive statistics for all the variables used in our study. The mean value of Ln(AF) is 15.224, comparable to 13.173 reported in Badertscher et al. (2014) and 14.095 reported in Kim et al. (2015). The mean and median audit report lag are 53.03 days and 56 days, respectively. The mean value is longer than Ettredge et al.’s (2006) 50 days (2003 sample) and shorter than Knechel and Payne’s (2001) 68.09 days and Tanyi et al.’s (2010) 62.57 days (ex-Andersen clients) and 56.08 days (other Big 5 clients with auditor changes). We note that our sample observations have 83.5% independent directors on their boards and almost 98% are audited by a Big 4 auditor, suggesting that our sample firms have fairly good internal and external governance. The auditor’s average industry market share is 28.9%, comparable to Gerakosand Syverson’s (2015) finding that in 2010 the market shares of EY, Deloitte, KPMG, and PwC are 25.21%, 21.35%, 18.93%, and 29.23%, respectively. Finally, the average AC has about four independent directors.
[Insert Table 3 Here]
We do not present a correlation matrix because of the large number of variables in the model. We do, however, note that AC_DELTA is negatively related to Ln(AF) (significant at the 0.01 level), indicating that audit fees are decreasing in AC equity incentives. Again, this is consistent with our hypotheses H1a and H1c. On the other hand, Ln(AF) is positively associated with OTHER_BDSIZE and BDIND (significant at the 0.01 level), suggesting that larger boards and boards with more independent directors are more likely to pay higher audit fees. Finally,
19
implying that auditors charge higher audit fees if clients are riskier due to low liquidity, financial difficulty, and high cash flow volatility. These results show that while AC equity incentives are negatively related to audit fees, board governance is positively related to audit fees.
4. EMPIRICAL RESULTS 4.1 Main Results
We report the estimation results of model (1) in the first column of Table 4. The adjusted R2 is 0.738 and the F-statistic is significant at the 0.01 level, indicating that our model has very good explanatory power for the variation in audit fees. The coefficient on AC_DELTA is significantly negative (at the 0.01 level) but the coefficient on AC_VEGA is insignificant. This result indicates that the higher the sensitivity of AC equity incentives to stock prices, the lower the audit fees. The coefficient on AC_DELTA is -0.022, suggesting that ACs with equity portfolio delta in the 75th percentile have audit fees that are, on average, 5.654% lower than audit fees of ACs with equity portfolio delta in the 25th percentile (-0.022 [7.4814.911] = -0.05654), which represents a reduction of $231,236 in total audit fees (e15.224 0.05654). Even though the empirical results are consistent with hypotheses H1a and H1c, they do not allow us to distinguish which of these two hypotheses better explains the observed underlying association between AC equity incentives and audit fees. We address this issue in the next section.
[Insert Table 4 Here]
Turning to the control variables, the coefficient signs are generally consistent with expectations. Audit fees are positively associated with firm size (SIZE), operational complexity (FOREIGN and SEGMENT), operating risk (LOSS and GC), and board governance (OTHER_BDSIZE and BDIND) (all are significant at the 0.05 level or better). In contrast, audit fees are negatively related to liquidity (RECINV) (significant at the 0.01 level), suggesting that
20
auditors regard firms with stronger liquidity as less risky and, therefore, charge lower audit fees. Different from prior studies, we find a significantly negative association between audit fees and firms’ financing activities (LEV and NEW_FIN). One possible reason for the negative association between audit fees and leverage (which measures clients’ long-term solvency risk) is that higher leverage provides incentive for lenders to monitor the firms (Ang et al. 2000) and stricter monitoring by lenders reduces audit risk and, therefore, lowers audit fees (Chaney et al. 2004). Nonetheless, we could not find any reason to explain the negative association between audit fees and firms’ new issuance of equity or debt. Also, consistent with prior studies, auditors that are industry leaders (EXPERTISE) charge higher audit fees (significant at the 0.01 level).
To evaluate potential multicollinearity concerns, we examine variance inflation factors (VIFs) among the independent variables. All of the VIFs are between 1.050 and 2.833, well below the 10.0 threshold suggested by Neter (1996), indicating that multicollinearity is not a problem in our analyses.
4.2 Further Analyses
4.2.1 Reduced audit effort or decreased risk premium?
Because audit fees are a function of audit effort and a risk premium, and audit effort is reflected in audit hours while risk premium is reflected in hourly rate charged (Bell et al. 2001), our finding that audit fees decrease with AC equity incentives may result from a reduction in audit effort and/or audit hourly rate. In practice, a reduction in hourly rate generally occurs when the auditor perceives that the client’s audit risk has decreased. In this case, we expect that audit quality is not compromised because the auditor will still exert sufficient audit effort. On the other hand, a decrease in audit effort may reduce the probability of the auditor detecting material misstatements in the client’s financial statements. Given these divergent reasons, we separate
21
audit effort and audit risk premium to distinguish which of these explanations underlies the observed negative relation between audit fees and AC equity portfolio delta reported in Table 4.13
We use material internal control weaknesses, ICW, as the proxy for audit risk premium for two reasons. First, the occurrence of material ICW is associated with lower earnings quality. Doyle et al. (2007) find that material ICW are associated with accruals that are not realized as cash flows, and Ashbaugh-Skaife et al. (2008) report that firms that remediated previously identified ICW have improved accrual quality. This evidence suggests that ICW facilitate earnings management and, therefore, reduce the reliability of financial reporting. Second, because earnings management is positively associated with auditor litigation risk (Barron et al 2001; Heninger 2001; Palmrose and Scholz 2004), auditors consider the risk of earnings management in their assessments of litigation risk and incorporate this risk into their pricing decisions (Bedard and Johnstone 2004; Houston et al. 1999; Johnstone and Bedard 2001). Third, since we have controlled for firms’ operating risks using LOSS, GC, and STDCF, any risk premium is likely to be attributable to firms’ internal control risk. In light of the above discussion, it is reasonable to assume that increased ICW gives rise to higher litigation risk, which in turn results in auditors charging a higher risk premium to reduce their exposure to future litigation. As shown in the second column of Table 4, the coefficient on ICW is positive and significant at the 0.01 level. This implies that auditors adjust the risk premium in response to clients’ ICW by charging higher audit fees. Therefore, we can rule out the possibility that the decrease in total audit fees is due to a reduction in audit hourly rate and the resulting risk premium.
We next test whether, after controlling for auditor risk premium adjustment, auditors
13DeFond and Zhang (2014) also emphasize that most audit fee studies do not address whether higher/lower fees are
due to increased/decreased effort or risk premia. This distinction is critical because additional effort increases audit quality, consistent with Caramanis and Lennox’s (2008) finding that increased audit hours reduce firms’ earnings management. In contrast, risk premia simply shift the expected litigation cost to the client.
22
reduce audit effort when ACs are compensated with equity pay. Following prior studies (e.g., Chan et al. 2012), we use audit report lag to proxy for audit effort. Knechel and Payne (2001) show that a lengthy audit report lag is due to more audit hours and effort being devoted to an engagement. Ettredge et al. (2006) also document that the reporting of internal control weaknesses is associated with longer audit report lag due to extended audit work. We use LAG, which is defined as the number of days between a firm’s fiscal year-end and the audit report date, as the dependent variable and regress LAG on our test variables AC_DELTA and AC_VEGA and the same set of control variables. The third and fourth columns of Table 4 indicate that the coefficients on AC_DELTA are negative and significant at the 0.05 level, regardless of whether we include ICW. Importantly, the coefficient on ICW is positive and significant at the 0.01 level. These results imply that, even though auditors react to firms’ internal control weaknesses by exerting more audit effort, larger equity incentives given to the ACs are still associated with lower audit effort. This result is consistent with hypothesis H1c, which predicts that the negative relation between audit fees and equity incentives is likely due to an ineffective AC decision to cut audit fees so that earnings management may not be easily detected.
4.2.2 Mitigating Endogeneity Concerns
The results in Table 4 show a negative relation between AC equity incentives and audit fees. However, the possibility of an endogenous relation between AC equity incentives and audit fees is a concern in our analysis. Prior studies identify three major sources of endogeneity that may arise in our setting. The first source is time-invariant unobservable heterogeneity, which arises if there are unobservable firm-specific factors that affect both AC equity compensation and the determination of audit fees. To address this endogeneity problem, we use a change model and include firm fixed effects (Kim et al. 2015; Nikolaev and Van Lent 2005).
23
The first column of Table 5 shows that the coefficient on AC_DELTA is negative and
significant at the 0.01 level but the coefficient on AC_VEGA remains insignificant. This result
is consistent with Table 4 and suggests that the change in delta has a significantly negative impact on the change in audit fees, while the change in vega has no significant impact. Similarly, the second column of Table 5 shows that the coefficients on AC_DELTA and ICW are
significantly negative and positive, respectively (at the 0.05 level or better). These results imply that the change in delta has a significantly negative impact on the change in audit effort, even though the change in internal control weaknesses significantly motivates more audit effort. Note that the coefficient on vega is significantly negative at the 0.05 level, suggesting that the relation between vega and audit effort may not be robust across different research design choices.
[Insert Table 5 Here]
We also re-estimate our regression models after including firm fixed effects. Columns (1) and (4) of Table 6 indicate that the results from the fixed effects regression are consistent with the change analysis results, suggesting that the negative relations between delta and audit fees and audit effort are robust to controlling for time-invariant unobservable heterogeneity.
[Insert Table 6 Here]
Although using change analyses and including firm fixed effects help address the time-invariant unobservable heterogeneity problem, they may not mitigate endogeneity arising when an omitted time-variant variable leads to both a change in equity compensation and a change in audit fees. We use an instrumental variables approach to address this second source of endogeneity. We use the average AC equity portfolio delta and average AC equity portfolio vega of other firms in the same 4-digit SIC industry as instruments because firms often rely on industry-wide compensation practice when setting AC pay, but industry-wide compensation
24
practice does not affect firms’ idiosyncratic audit risk and audit fees. Our choice of instruments is consistent with prior studies examining executive pay issues (e.g., Hanlon et al. 2003; Kim et al. 2015; Lev and Sougiannis 1996).
We implement the instrumental variables approach as follows. In the first stage, we regress our equity incentive measures on industry average delta (denoted by IND_DELTA) and industry average vega (denoted by IND_VEGA) and all the control variables used in the second stage regressions. The adjusted R2 are 0.393 and 0.415 when we use AC_DELTA and AC_VEGA as the dependent variables, respectively. The coefficients on IND_DELTA and IND_VEGA are both positive and significant at the 0.01 level. Stock and Yogo’s (2004) test for instrument validity suggests that both IND_DELTA and IND_VEGA are valid instruments because the F statistics for IND_DELTA and IND_VEGA are 24.31 and 22.89, which are much larger than the critical value of 9.53 suggested by Stock and Yogo (2004). In the second stage, we use the predicted equity incentive values obtained from the first stage regressions (denoted by
AC_DELTA_PRED and AC_VEGA_PRED) in place of the actual values and estimate regressions
of audit fees and audit effort on these two predicted equity incentive measures and all control variables. The results of the second-stage regressions are reported in columns (2) and (5) of Table 6. The coefficients on AC_DELTA_PRED are negative and significant at the 0.01 level, indicating that the negative relations between equity delta and audit fees and audit effort are robust to controlling for endogeneity using an instrumental variables approach.14
A third source of endogeneity is simultaneity, which arises when the variable of interest is also a function of the dependent variable. Specifically, dynamic endogeneity may exist in such
14Note that the instrumental variables approach is subjected to certain limitations. For example, the industry average
equity delta and vega may not be purely exogenous because other firms in the same 4-digit SIC industry may also have unobserved heterogeneities that are correlated with the unobserved heterogeneities of our sample firms, and these heterogeneities could affect both director compensation and audit fees (Kim et al. 2015). Therefore, the results reported in columns (2) and (5) of Table 6 should be interpreted with caution.
25
a way that the values of the variable of interest in year t are a function of the dependent variable in year t-1. This is a potential concern in our setting because past audit fees could be related to the current level of AC equity incentives. To address this potential endogeneity problem, we first include lagged audit fees as an explanatory variable in model (1), referred to as the dynamic
model in the following discussion. Next, we follow prior studies (e.g., Blundell and Bond 1998;
Kim et al. 2015; Wintoki et al. 2012) and adopt a system of two equations that include a dynamic model transformed into first-differenced form anda dynamic model in levels form. We then use dynamic GMM to estimate the following system of equations using1-year lagged audit fees as the instrument:15
AC_DELTAt (or AC_VEGAt) = a0 + a1Ln(AF)t-1 + Controls, (2-1)
Ln(AF)t = b0 + b1AC_DELTAt (or AC_VEGAt) + Controls. (2-2)
Columns (3) and (6) of Table 6 report the results from the dynamic GMM estimation. We continue to find significantly negative coefficients on AC_DELTA (significant at the 0.10 level or better), suggesting that the negative relations between equity delta and audit fees and audit effort hold after controlling for endogeneity based on the dynamic GMM estimator.
Overall, our results based on four commonly-used econometric methods (i.e., change models, firm fixed effects, instrumental variables, and dynamic GMM) to control for potential endogeneity indicate that our findings of a negative relation between AC equity incentives and
15Kim et al. (2015) emphasize that one major problem with dynamic GMM is the lag length of the instrument.
Importantly, longer lag length of the instrument makes it more exogenous but also reduces the strength of the instrument. While Kim et al. (2015) use 4-year lagged audit fees as the instrument, we use 1-year lagged audit fees because a literal adoption of Kim et al.’s (2015) approach will highly reduce our sample, leading to weak or even biased statistical inferences. To assess the strength of our 1-year lagged audit fees instrument, we use the Hansen test of exogeneity and find that the 2 = 26.8 is not significant (p = 0.172). This result cannot reject the null hypothesis that our instrument is exogenous. We also estimate a first-stage regression of the endogenous variables on the instrument and conduct an F test. We find that the F statistic for the first-stage regression is 15.05, which is significant at the 0.01 level and greater than the critical value of 10 suggested by Staiger and Stock (1997). The results of these tests indicate that our use of 1-year lagged audit fees is unlikely to result in biased GMM estimates.
26
audit fees reported in Table 4 are unlikely to result from endogeneity.
4.2.3 Firms’ ex ante litigation risk
Early studies on auditors’ legal liability indicate that the threat of litigation forces auditors to continually assess their lawsuit exposure and incorporate that assessment into the planning and pricing of audit services (e.g., Menon and Williams 1994; Palmrose 1988). Furthermore, prior studies show that stock price volatility and stock turnover directly affect litigation risk because both are directly related to measures of stockholder damages that drive plaintiff lawyers’ decisions to file lawsuits (e.g., Alexander 1991). Therefore, audit fees should be sensitive to litigation risk differences across client groups (Seetharaman et al. 2002). On the other hand, recent studies document that litigation risk affects firms’ equity-based compensation (e.g., Jayaraman and Milbourn 2009). These findings suggest that litigation risk affects both the value of AC equity incentives as well as the level of audit fees.
To examine whether our empirical results are sensitive to litigation risk, we use the model in Kim and Skinner (2012) to compute each firm’s ex ante litigation risk16 and separate the sample into high vs. low litigation risk groups based on the annual medians of these risk values. We then create a dummy variable HIGH_RISK that equals one if a firm is in the high litigation risk group in a given year, and zero otherwise. We estimate model (1) after adding
HIGH_RISK and its interactions with AC_DELTA and AC_VEGA. If equity incentives induce
ACs to demand a lower level of audit, then higher litigation risk will force ACs to pay more audit fees to buy higher level audits. We therefore predict that the coefficient on AC_DELTA
HIGH_RISK is positive. We lose 220 observations due to missing data for calculating
16We use Model (3) instead of Model (4) for two reasons. First, even though Model (4) is an extension of Model (3)
with two additional lags of annual abnormal stock returns, the addition of these two variables adds relatively little explanatory power/predictive ability, and little or no improvement in pseudo-R squared or area under the curve (AUC). Second, the inclusion of these two extra variables reduces the sample size substantially. Kim and Skinner (2012) regard this as a serious cost to researchers.
27
HIGH_RISK.
The first two columns of Table 7 indicate that the coefficients on AC_DELTA remain negative when we use audit fees and audit report lag as the dependent variables (significant at the 0.05 level or better). More importantly, the coefficients on AC_DELTAHIGH_RISK are positive
and significant at the 0.05 level. This evidence again supports hypothesis H1c because, if H1a is valid, the coefficients on AC_DELTAHIGH_RISK should be negative or zero.
[Insert Table 7 Here]
4.2.4 Relative power of CFO and audit committee
Beck and Mauldin (2014) report that, despite the AC being responsible for hiring the auditor and determining audit fees, more powerful CFOs continue to control the audit fee negotiations. Importantly, either the CFO or the AC influences audit fees more when the other is less powerful. These findings call into question the effectiveness of Section 301 of SOX with respect to the requirement for ACs to independently determine audit fees. To ensure that our empirical results are not affected by this potential confounding factor, we follow Beck and Mauldin (2014) and use AC chair tenure and CFO tenure to control for their relative power in determining audit fees. We sort all firm-year observations into quartiles based on AC chair tenure (AC_QUARTILE) and CFO tenure (CFO_QUARTILE). Each set of quartile values ranges from 1 to 4. We then create the variable RELATIVE_AC_CFO (which equals AC_QUARTILE
CFO_QUARTILE) to capture the relative power of the AC chair and the CFO. By definition, RELATIVE_AC_CFO ranges from -3 to +3. Positive values of RELATIVE_AC_CFO indicate
higher AC power relative to CFO power, while negative values suggest higher relative CFO power.
28
that the coefficients on AC_DELTA remain negative and significant at the 0.10 level or better. However, inconsistent with Beck and Mauldin (2014), the coefficient on RELATIVE_AC_CFO is positive but not significant. One possible reason underlying this inconsistency is that, because Beck and Mauldin (2014) compare audit fee changes in the recessionary (i.e., 2008-2009) and pre-recessionary periods (i.e., 2006-2007) to isolate the influence of ACs and CFOs on audit fees, their empirical results may not be applicable to the periods before and after the recession, which are included in our sample.
4.2.5 Earnings quality and audit fees
As reported in Tables 4 through 7, the empirical results are consistent with hypothesis H1c, which predicts that the negative relation between audit fees and equity incentives is likely due to ineffective AC decisions to cut audit fees, leading to a high likelihood that earnings management may not be easily detected. To test whether firms whose ACs pay lower audit fees have lower earnings quality, we further regress performance-adjusted discretionary accruals and accrual quality (Dechow and Dichev 2002) on lagged audit fees and a set of control variables that prior research indicates are related to these two accrual-based measures. Table 8 reports that there is a significantly negative relation between lagged audit fees and discretionary accruals and accrual quality (at the 0.05 level or better), suggesting that lower audit fees in year t-1 are associated with lower earnings quality in year t.
[Insert Table 8 Here]
4.2.6 Additional tests of the association between equity incentives and audit fees
We conduct two additional tests to assess the robustness of our primary results reported in Table 4. In the first test, we examine whether our results are sensitive to the effect of AS No. 5. AS No. 5 was implemented in 2007 and was associated with declines in audit fees for
29
accelerated filers (Doogar et al. 2010; Krishnan et al. 2011). To provide evidence that our results are not driven by decreases in fees surrounding the passage of AS No. 5, we divide our sample period into two sub-periods, 2004~2006 (pre-AS No. 5) and 2007~2013 (post-AS No. 5). We then re-estimate the audit fee and audit report lag regressions separately for each of these two subsamples. Unreported results show that the coefficients on AC_DELTA remain negative and significant at the 0.05 level or better in both subsamples, indicating that our main results are unlikely to be driven by the AS No. 5 effect.
In the second test, we examine whether our results are sensitive to using an alternative measure of AC equity incentives. This measure, labeled EBC%, reflects AC compensation mix, i.e., the percentage of AC members’ equity-based compensation to their total compensation. We re-estimate all the regressions after replacing AC_DELTA and AC_VEGA with EBC%. Panel B of Table 1 indicates that, on average, equity-based compensation accounts for 74.56 percent of total compensation. Unreported results show that EBC% is negatively associated with audit fees and audit report lag (significant at the 0.01 level), suggesting that AC compensation mix is important in determining appropriate audit fees.17 We also follow Kim et al. (2015) and use Ln(EBC), which is the natural log of the AC directors’ total equity-based compensation, as an alternative measure of AC equity incentives. The empirical results are similar to those obtained when we use EBC%.
4.2.7 Auditor choice decision and management influence
The statutory requirement that the auditor be appointed by the AC is a regulatory attempt to mitigate senior executives’ involvement in the choice of auditor (Dhaliwal et al. 2015).
17Because BoardEx includes AC meeting fees in “Others” and “Total Compensation,” we calculate EBC% using two
denominators: one is the sum of cash and equity-based compensation and the other is the total compensation provided by BoardEx. Both denominator measures give rise to similar results, indicating that our findings are not sensitive to the inclusion of meeting fees.
30
Therefore, if equity incentives motivate AC members to compromise their independence by reducing the demand for external audits, it is reasonable to assume that these ACs would prefer to hire a non-industry expert as the auditor. An industry expert’s knowledge of the industry is developed through extensive auditing experience, specialized staff training, and expensive investments in information technology. Relative to non-expert auditors, this industry knowledge enables expert auditors to provide higher quality audit service to clients (Dunn and Mayhew 2004; Gul et al. 2010). To test our prediction, we follow prior studies and use the following auditor choice model:
EXPERT = 0 + 1AC_DELTA + 2AC_VEGA + 3SIZE + 4LEV + 5NEW_FIN + 6RECINV + 7ROA + 8GROWTH + 9FOREIGN + 10SEGMENT
+ 11OTHER_BDSIZE + 12BDIND + 13INITIAL
+ 14ACSIZE + Fixed effects + v, (3)
where the definitions of the independent variables are listed in the Appendix.
The dependent variable EXPERT is an indicator variable that equals one if the firm hires an industry expert as its auditor, and zero otherwise. Consistent with prior studies (e.g., Balsam et al. 2003; Kim et al. 2015; Krishnan 2003; Lim and Tan 2008), we first use clients’ sales to estimate industry market share (MS) of an audit firm as follows:
∑
∑ ∑
The numerator is the sum of the sales of all Jik clients of audit firm i in industry k. The
denominator is the sales of all Jik clients in industry k, summed over all Ik audit firms in the
industry. We require a minimum of 20 clients in each two-digit SIC industry to estimate industry market share for an audit firm in a given year. We then follow prior studies (e.g., Chung and
31
Kallapur 2003; Francis et al. 2005) and define the auditor with the largest industry market share as the industry expert.18 Industry experts can gain larger market share mainly because clients appear to believe that industry leaders can provide higher quality audits (Craswell et al. 1995; Dunn and Mayhew 2004). Also, it is relatively easier for industry leaders to pursue new clients to maintain or expand their market shares (Dunn et al. 2011).
Conceptually, the above market share measure captures auditors’ industry expertise at the national level. Because industry expertise is often tied to individual auditors and their deep personal knowledge of clients, recent studies emphasize the importance of distinguishing industry expertise at the national and city-office levels (e.g., Francis et al. 2005; Francis and Yu 2009; Ferguson et al. 2003; Reichelt and Wang 2010). City level industry expertise is based on the auditor’s market share within a two-digit SIC industry for a particular city. Following Francis et al. (2005), a city is defined using the U.S. Census Bureau’s Metropolitan Statistical Area (MSA, 2010 edition). While Audit Analytics provides the geographical cities (not the MSA) from audit reports filed in the 10-K, geographic cities are categorized by MSA’s cross-map. An audit office is regarded as a city industry leader if it has the largest market share for a city-specific industry in a fiscal year.
Following Francis et al. (2005) and Reichelt and Wang (2010), we measure the dependent variable EXPERT using three proxies: NATIONAL, which equals 1 if the auditor is a national industry leader but not a city leader; CITY, which equals 1 if the auditor is a city industry leader but not a national leader; JOINT, which equals 1 if the auditor is both national
18Some prior studies define an industry expert as an auditor with a market share of 10% or more (e.g., Balsam et al.
2003; Dunn and Mayhew 2004; Neal and Riley 2004; Reichel and Wang 2010). We do not adopt this approach because these cutoff percentages are often arbitrarily determined and may lead to an imprecise measure of industry experts (i.e., several CPA firms may all be classified as industry experts when their market shares exceed the cutoff).