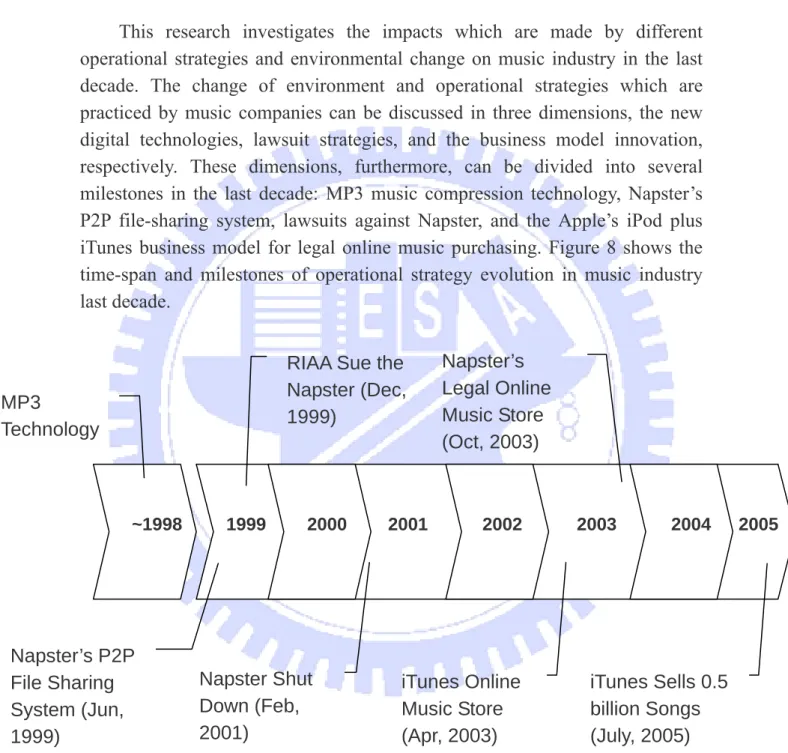
數位化時代音樂產業何去何從?-以生產力觀點進行全球音樂產業的實證
115
0
0
全文
(2) 數位化時代音樂產業何去何從? -以生產力觀點進行全球音樂產業的實證 How Music Industry Be Sustainable in an Era of Digitalization? -An Empirical Study in the Aspect of Productivity for Global Music Firms. 研 究 生:洪子鈞. Student:Z-Jim Hung. 指導教授:蔡璧徽. Advisor:Bi-Hui Tsai. 國 立 交 通 大 學 管 理 科 學 系 碩 士 班 碩 士 論 文 A Thesis Submitted to Department of Management Science College of Management National Chiao Tung University in partial Fulfillment of the Requirements for the Degree of Master in Management Science January 2007 Hsinchu, Taiwan, Republic of China. 中. 華. 民. 國. 九. 十. 六. 年. 一. 月.
(3) ABSTRACT This article adopts a point of view in productivity to investigate the impacts which are made by the new digital technologies, lawsuit strategies and the business model innovation on the performance of the global music industry, and makes a comparison between the effectiveness of different strategies which intrinsic music firms play during the environmental change. This thesis also tries to identify the key productivity affecting factors, and clarify the process that how these strategic events affect the music industry by the externalities. Thus 51 music related companies are chosen for representing the reactions of global music industry from 1997 to 2005; the Napster’s P2P file-sharing system, lawsuits against Napster, and the Apple’s iPod plus iTunes business model are concerned as the performance impact factors respectively in our research. Färe et al. (1992) first introduced the DEA-based Malmquist productivity index to measure the productivity change over time. In this research, therefore, researcher applies the DEA methodology and Malmquist indices to calculate the productivity change of each music firm year by year. In order to reflect the influence of digital music and online content selling, the effects of network externalities and music piracy rate are concerned in our DEA models. Following Tobit regression model is employed to identify the key productivity affecting factors, and clarify the process that how these strategic events affect the music industry by the externalities. The researcher supposes that these events will not only pose influences directly on the performance of music industry, but also via the network externalities chang in an indirect way. In the last part of this article, influences of each event period, including the appearance of Napster’s P2P file-sharing system, RIAA filing lawsuits against the Napster for the copyright violation, and the opening of Apple’s iTunes Online Music Store, are tested by Tobit models. All of these events, except the appearance of MP3 and P2P software, are positive effects upon the productivity in our hypotheses. Furthermore in our hypothesis, strategy of creating a new business model is expected more powerful than filing a lawsuit against piracy, and the Mann-Whitney rank test is employed for testing. Results show that music piracy rate is an important external factor for deteriorating the productivity of music industry, and the development of digital music technologies, MP3 and P2P, significantly reduce the productivity by. i.
(4) increasing the piracy rate. Henceforth fighting against music piracy and creating a legal digital music transaction platform are becoming critical solutions for reversing the recession of music industry in productivity. On the contrary, filing a lawsuit against music piracy is confirmed an effective solution for reducing the music piracy rate and therefore improving the productivity significantly. Apple’s iTunes Online Music Store may bring about a redistribution of interests within music industry, threatening some intrinsic firms, and changing the composition of music industry, so the effectiveness of this business model fall short of our expectation. However since the external environment of music industry is change, creating a right business model is more reasonable for consumers than just filing lawsuits against piracy; therefore managers should still endeavor to create their own blue ocean by finding out a reasonable new music trading model in the era of digitalization.. Keywords: Music Industry; Music Piracy; Productivity; Data Envelopment Analysis; Network Externalities. ii.
(5) 中文摘要 本研究探討過去十年間音樂數位化過程所造成的產業環境改變,對於全球音 樂產業經營績效的影響,並比較廠商實行各種不同競爭策略的執行成效。Färe 等人(1992)以 Cave 等人(1982)提出 Malmquist 生產力指數概念,建立衡量跨時期 效率之 DEA 模式。本研究以此基礎進一步將網路經濟下的外部性(Externality)因 素影響加入模型考量,利用傳統 CCR 模型加入外生變數(indiscretionary variable) 投入項,建構出修正過的 Malmquist 生產函數,並針對 1997 年至 2005 年間的音 樂產業資料進行生產力變動分析,觀察並驗證各種競爭策略的執行對於音樂產業 生產力變動的影響。 不同於以往短期事件日分析,本研究採用生產力變動觀點,檢驗音樂數位化 過程對於全球音樂產業經營績效的長期影響。並透過資料包絡分析法(Data Envelopment Analysis),以效率前緣的線性最佳生產效率邊界概念,對於音樂產 業的效率進行探討。此外研究模型亦考量網路經濟下的外部性(Externality)因素影 響(外部性因素包括:網路規模的成長、音樂盜版率的改善等外生環境變數)。利 用傳統 CCR 模型加入外生變數(indiscretionary variable)投入項,建構出修正過的 Malmquist 生產函數,對於 1997 年至 2005 年間的音樂產業資料進行生產力變動 分析,觀察並驗證各種競爭策略的執行對於音樂產業生產力變動的影響。最後本 研究利用 Tobit 迴歸模式以及無母數 Mann-Whitney 檢定,來釐清影響音樂產業 生產力變動的因素,並且對於影響音樂產業績效的外部性因素進行探討,以暸解 音樂廠商執行競爭策略時,對於其營運績效的影響過程,並將各項研究結果彙整 成一個有系統的過程論。 音樂廠商競爭策略包含:數位音樂科技的進步、廠商的法律訴訟策略以及創 造新的商業販售模式等三個構面;此三個競爭策略構面,可更進一步分解成多個 改變音樂產業結構的事件加以分析,包括:MP3 音樂壓縮技術的發明、Napster 推出點對點線上音樂分享系統、美國唱片產業協會(RIAA)對於 Napster 提出的侵 權訴訟、蘋果電腦發展的 iTunes 合法線上音樂販售模式。事件日的選擇參考 CNN、BBC 等國際頗具權威的新聞中心資料;廠商選擇則是根據美國 Standard & Poor 推出的 Compustat 資料庫中的產業編碼,以及參考過往文獻的取樣標準,篩 選出 51 家音樂產業公司進行研究。研究樣本公司歷史資料來源則是根據 Compustat 資料庫中所蒐集到的基本投入產出變數,投入項包括員工人數(以反映 勞動投入)、固定資產(以反映資本的投入項);產出項則以公司該年的銷貨收入作 為代表;而外生變物資料主要根據國際通訊聯盟(International Telecommunication Union) 所 公 佈 的 網 路 普 及 率 資 料 , 以 及 國 際 智 慧 財 產 權 協 會 (International Intellectual Property Alliance)所公佈的各國的盜版率指標為變數參考依據。. iii.
(6) 本研究證實盜版問題確實是影響近年音樂產業績效表現的重要因素。盜版率 會透過外部性對音樂產業的生產力產生直接影響。因此 MP3 與 P2P 軟體等數位 音樂技術的發展是把雙面刃,一方面能促進音樂的傳播,然而在不成熟的智慧財 產權保護機制下,同時是造成盜版問題日益嚴重的幫兇,進而透過效率前緣削弱 音樂產業的生產力表現,對音樂產業造成重大衝擊。法律訴訟是短期內遏阻非法 並增加既有廠商生產力的有效手段。然而長遠而言,在產業環境已經改變的條件 下,仍需盡速尋求合理的利益分享機制。創造新的商業模式或許會因為利益的重 新分配,對某些既有的產業造成衝擊,所以效果並不如法律訴訟立竿見影。然而 當產業面臨整體環境結構轉變時,新的商業模式卻能藉由改善外部環境(例如降 低盜版率,建構新的音樂傳播通路加速音樂的傳播等方式),為產業帶來轉機。 因此本研究建議音樂產業的管理者應盡速建立合法的傳播管道,創造屬於自己的 藍海,才能有效的促進音樂產業發展。. 關鍵字: 音樂產業; 音樂盜版;生產力評估;資料包絡分析;網路外部性. iv.
(7) ACKNOWLEDGMENTS. I would like to thank my advisor, Professor Bi-Hui Tsai for her teaching, supervision, and suggestions throughout the work. She offered valuable insight and was open to discuss anything I had on my mind. I would also like to express my sincere gratitude to Prof. Fuh-Hwa Franklin Liu for his valuable guidance in DEA methods and immeasurable patience which brought this thesis to fruition. Thanks are extended to my reader, Prof. Po-Young Chu for his remarkable insights and suggestions on the earlier draft, as well as for his kind solicitude throughout the program. The scholarly assistance from all the professors in the Management Science Department and the Industrial Engineering & Management Department is always greatly appreciated.. v.
(8) CONTENTS ABSTRACT ……………………………………………………………… CHINEST ABSTRACT …………………………………………………. ACKNOWLEDGMENTS ………………………………………….…… CONTENTS …………………………………..….……………………… LIST OF FIGURES ………………………………………………….….. LIST OF TABLES ……………………………………………………….. i iii v vi vii viii. CHAPTER 1. Introduction …………………………………………..………………...... 1 1.1 Purpose of this research ……………....……………………….……… 1 1.2 Background of the music industry .………….……………………..… 4 1.3 The MP3 and P2P phenomena ……….………….……….…………… 5 1.4 The lawsuit against Napster ………………………………………...… 7 1.5 The iPod+iTunes business model ……………....….……………..…… 8 2. Literature Review ……………………………………………………..… 11 2.1 DEA Method ……………………………….……………………….…. 11 2.1.1 Introduction of DEA ..………..…………………………………... 11 2.1.2 Advantages of DEA …………………………………………...….. 12 2.1.3 Basic DEA Models …………………………………………...…… 13 2.1.3.1 CCR Models …………………………………………..……… 13 2.1.3.2 BCC Models ……………………………………..…………… 20 2.1.4 Assessing Efficiency under Exogenously Fixed Input-Output Variables ……………………………………………….………… 24 2.1.5 Assessing Productivity Change by DEA: Malmquist Indices….. 29 2.2 The Tobit Model (Censored Regressions) ………………………….... 27 2.3 Mann-Whitney Test ……………………………………………….….. 34 3. Data ……………………………………………………………………..... 37 3.1 Events Selection …………………………………………………...….. 37 3.2 Sample Selection …………………………………………...……...….. 40 3.3 Variable Selection ………………………………….…….….……..…. 41 4. Hypotheses and Methodology ………………………...………………... 46 4.1 Hypotheses ………………………………..….…..…..……..….……... 46 4.2 Methodology …………………………………..…….………………… 47 4.2.1 Malmquist Indices in Exogenous-Variables Concerned CCR Input-Oriented Model …………………………………..………. 47. vi.
(9) 4.2.2 Tobit Regressions ……………………………………………..…... 50 4.2.3 Mann-Whitney Test ……………………………………………..…56 5. Empirical Results ………………………….………….…..…………...… 58 5.1 Production Frontier Analysis …….…….………….……..………..…. 58 5.2 Identify the Key Factors ……………………………………..…….…. 70 5.3 Hypotheses Testing ……………………………………….……............ 73 6. Conclusion ………………………………….……….………….……...… 91 6.1 Managerial implication …………………………………………...….. 91 6.2 Contribution ……………………………………………………..……. 92 6.3 Further Research ………………………………………….………….. 93 APPENDICES ……………………………………………………………... 98 Appendix 1 Firms and Operational Activities in Sample……………... 94 Appendix 2 Firms in Sample from 1997 to 2005 …………………….... 96 REFERENCE ……………………………………………………………… 98 CHINESE REFERENCE …………………………………..……………. 103 WEBSITES …………………………………………………………….…. 103. vii.
(10) LIST OF FIGURES Figure 1 The influences of new technology, lawsuit strategy and business model innovation on the performance of music industry...………………... 4 Figure 2 Music industry consolidation in 1980-2005 ………….…………... 5 Figure 3 The iTunes cut the connection between the consumers and the physical illegal music trading market ……………..……............................ 10 Figure 4 Measuring Technical Input Efficiency with Production Frontier ……………………….……………..…………………….………... 15 Figure 5 CRS and VRS Frontiers in DEA Models …………………….…. 23 Figure 6 Input Efficiency while Input 2 is Exogenously Fixed ………….. 24 Figure 7 Measure The Frontier Shift Over Two Periods ….……………... 28 Figure 8 Sequence of Music Industry Related Events ………………….... 37 Figure 9 Production Function of Sales in Music Industry .…………….... 42 Figure 10 Change of Exogenously Fixed Variables from 1995 to 2005..… 44 Figure 11 Process of strategic decisions affect the performance of music industry .………….…………….……….………………………………...… 73. viii.
(11) LIST OF TABLES Table 1 Sales of 99 cent songs from Apple’s online iTunes Store……..….. 9 Table 2 Summary of Major Events Involving Music Industry.……….…. 39 Table 3 Input and Output Variables in the DEA Models……….………... 43 Table 4 Correlation Analysis of Inputs and Outputs in DEA Models........ 45 Table 5 Sample Statistics in the DEA model from 1997 to 2005………..... 58 Table 6 Technical Efficiency Change of Music Firms from 1997 to 2005.. 62 Table 7 Frontier shift of Music Firms from 1997 to 2005…………………64 Table 8 Productivity Change (MPI) of Music Firms from 1997 to 2005 ...66 Table 9 Mean Malmquist Indices of Music Industries from 1997to 2005..68 Table 10 Estimated Tobit Models for Malmquist Indices...……………… 72 Table 11 Regression Analysis on MPI in Music Industry…………..……. 75 Table 12 Regression Analysis on TEC in Music Industry ……………...…76 Table 13 Regression Analysis on FS in Music Industry………………….. 77 Table 14 Regression Analysis on MPI in Music Retailing Industry……....79 Table 15 Regression Analysis on TEC in Music Retailing Industry …….. 80 Table 16 Regression Analysis on FS in Music Retailing Industry ..……... 81 Table 17 Regression Analysis on MPI in Music Publishing Industry….... 82 Table 18 Regression Analysis on TEC in Music Publishing Industry….... 83 Table 19 Regression Analysis on FS in Music Publishing Industry …...... 84 Table 20 Regression Analysis on MPI in Music Production Industry....... 85 Table 21 Regression Analysis on TEC in Music Production Industry…... 86 Table 22 Regression Analysis on FS in Music Production Industry…….. 87 Table 23 Summary of the Empirical Results……………………………... 88 Table 24 Mann-Whitney Tests in Malmaquist Indices for Different. ix.
(12) Business Strategies………………………………………………………….. 90. x.
(13) 1. Introduction This article adopts a point of view in productivity to investigate the impacts which are made by the new digital technologies, lawsuit strategies and the business model innovation on the performance of the global music industry, and makes a comparison between the effectiveness of different strategies which intrinsic music firms play during the environmental change. This thesis also tries to identify the key productivity affecting factors, and clarify the process that how these strategic events affect the music industry by the externalities. Argument of this research holds that music piracy rate is an important external factor for deteriorating the productivity of music industry, and the development of digital music technologies, MP3 and P2P, significantly reduce the productivity by increasing the piracy rate. Henceforth fighting against music piracy and creating a legal digital music transaction platform are becoming critical solutions for reversing the recession of music industry in productivity. On the contrary, filing a lawsuit against music piracy is confirmed an effective solution for reducing the music piracy rate and therefore improving the productivity significantly. In addition although creating a new business model, Apple’s iTunes Online Music Store for example, may bring about a redistribution of interests within music industry, threatening some intrinsic firms, and changing the composition of music industry, it reforms music piracy problem as well. In the long run, especially in the circumstance of external environment is change, creating a new business model is more effective and reasonable for consumers than just filing lawsuits against piracy; therefore managers should endeavor to create their own blue ocean by finding out a reasonable new music trading model in the era of digitalization. 1.1 Purpose of this research Based on the dramatic changes in the music industry, the purpose of this research is to investigate the impacts which are made by the new digital technology, such as the MP3 and P2P file-sharing systems, Lawsuit strategy, the RIAA sue the Napster for copyright violation, and the business model innovation, the Apple’s Online Music Store, on the productivity of the global music industry. According to our researche, furthermore, this thesis makes a comparison between the effectiveness of different strategies which intrinsic. 1.
(14) firms may play when the environment is changed, and try to clarify the essential difference of anti-piracy strategies. Considerable amount of researches and articles had discussed the negative and positive impact of technology change and business model innovation, such as MP3 downloading, P2P file-sharing, and the online music stores, on the performance of intrinsic firms in music industry. Navissi, Naiker, and Upson (2005), for example, used Napster as a proxy for diffuse piracy through the Internet and examine the effects of 11 prominent Napster-related events on the equity value of firms in the US music industry. Finally, the results of their research suggested that Napster’s service created wealth in the music industry. Another survey based on the aspect of consumer behavior and culture comparison to explain the music piracy, and tried to find out the best strategy of anti-piracy. Condry (2004) compared the music file-sharing behavior between the US and Japan, and found that a focus on fan participation in media success provides an alternative perspective on how to encourage flourishing music cultures. Asvanund, Clay, Krishnan, and Smith (2004) also claimed that solely shutting down individual file-sharing networks does little to change user behavior according to their discovery of the increasing free-riding behavior on P2P networks. Moreover, the real opportunity is to create blue oceans of uncontested market space, Kim and Mauborgne (2004) proposed this argument in their article published on the Harvard Business Review in October 2004. These previous studies have dropped us a hint that creating an effective business model may do much more advantages for music industry than just filing a lawsuit against piracy, hence. Nevertheless, the previous studies were lacking empirical evidences to prove this viewpoint. Consequently, our research makes some comparisons on the productivity change of the global music firms between these two strategies, filing a lawsuit on Napster and innovate an iTunes Online Music Store business model, and try to illustrate the results further. On the other hand, the network externality has been proofed of significant effects on the E-business and P2P file sharing network in the previous literatures. For example, the study Asvanund et al. (2004) suggested that the optimal size of the P2P network is bounded in their studies. While the network externality, or network size, will change the utilities of users and provides value to them (Strahilevitz, 2002; Saloner and Spence, 2002), it is considered an important attribute of the online music selling in our research. Our research, first, examines the efficiency change of individual firms, when. 2.
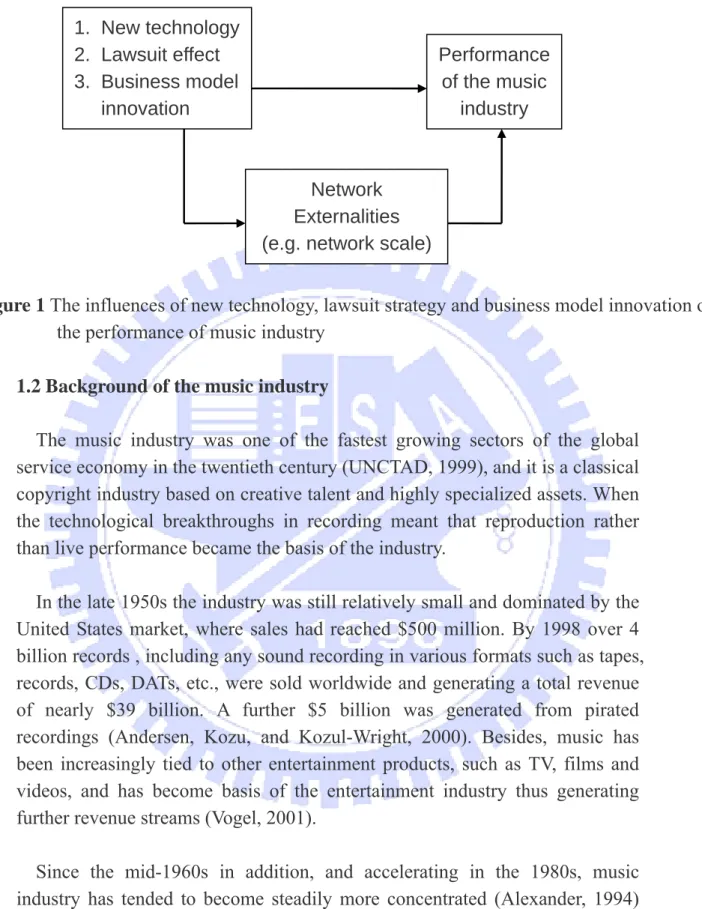
(15) the new digital music technologies, lawsuit against Napster, and the new business model of iTunes were launched, with DEA models and Malmquist indices. These approaches can not only measure the performance of a firm, but also reflect a long-term aspect that could never be discovered before by the traditional financial measurements. Accordingly, this study adopts such measurements of efficiency, other than traditional financial performance indexes, to demonstrate our assumptions, and the results of our study can be enriched. Furthermore, in order to extract the influence of the era of online content selling, effects of network externality and music piracy rate are concerned in our models. Since different strategic events, such as introducing a P2P file-sharing network, filing a legal action and launching a new business model, will impact the scale of the network, and piracy rate as well; and further, the performance of the music industry will be affected through these externalities change. Therefore, our research examines the efficiency change of individual firms and considers the externalities as external variables in our Data Envelopment Analysis model. Hence this study examines the productivity variation of 51 global music firms with DEA Malmquist methods, and tests the expected productivity effects of three milestones of digital music evolution, development of MP3 and P2P technologies, RIAA filing lawsuits against Napster for copyright infringement, and the opening of Apple’s iTunes Online Music Store, on these music firms by Tobit models. All of these events, except the appearance of MP3 and P2P software, are positive effects upon the productivity in our hypotheses. Researcher also applies a nonparametric approach to confirm the hypothesis that the business model innovation will improve the performance of music companies more than filing litigations. Meanwhile, this thesis tries to clarify the process that these events affect the industry through performance improvement and the externalities, such as network scales and piracy rate change. The researcher supposes that these events will not only pose influences directly on the performance of music industry, but also via externalities change in an indirect way, referring to Figure 1, and employs regression analyses to verify this assumption.. 3.
(16) 1. New technology 2. Lawsuit effect 3. Business model innovation. Performance of the music industry. Network Externalities (e.g. network scale) Figure 1 The influences of new technology, lawsuit strategy and business model innovation on the performance of music industry 1.2 Background of the music industry The music industry was one of the fastest growing sectors of the global service economy in the twentieth century (UNCTAD, 1999), and it is a classical copyright industry based on creative talent and highly specialized assets. When the technological breakthroughs in recording meant that reproduction rather than live performance became the basis of the industry. In the late 1950s the industry was still relatively small and dominated by the United States market, where sales had reached $500 million. By 1998 over 4 billion records , including any sound recording in various formats such as tapes, records, CDs, DATs, etc., were sold worldwide and generating a total revenue of nearly $39 billion. A further $5 billion was generated from pirated recordings (Andersen, Kozu, and Kozul-Wright, 2000). Besides, music has been increasingly tied to other entertainment products, such as TV, films and videos, and has become basis of the entertainment industry thus generating further revenue streams (Vogel, 2001). Since the mid-1960s in addition, and accelerating in the 1980s, music industry has tended to become steadily more concentrated (Alexander, 1994) under the dominance of a small number of very large international firms. As of 2006, this market is dominated by the “Big Four record labels”: Universal Music Group (UMG), Sony BMG Music Entertainment, which was merged by Bertelsmann Music Group (BMG) and Sony Music in 2004, EMI Group, and. 4.
(17) Warner Music Group. Currently it is estimated that over 85 per cent of the labels in the United States and approximately 80 per cent of the global market is controlled by four major media giants (RIAA, 2004; Wikipedia, 2006). The consolidation of the music industry is shown in figure 2 (Zhu and MacQuarrie, 2003).. Figure 2 Music industry consolidation in 1980-2005 Nowadays, a music group is consisting of music related companies, and is typically owned by an international conglomerate holding company, which often has non-music divisions as well. A music group controls and consists of music publishing companies, record (sound recording) manufacturers, record distributors, and record labels. Most of these corporations are highly diversified media conglomerates, in which music revenues account for between 12 per cent (Warner Music) and 24 per cent (UMG) of global revenues, and dominate over 80 per cent of the wholesale market by own distribution companies. Only EMI is the major music company that is not part of a conglomerate and remains primarily focused on music (Andersen, Kozul, and Kozul-Wright, 2000). This phenomenon increases the complexity of sample selection in our research. In our sampling, therefore, 51 companies operating different activities in the music industry, such as music publishing, music retailing, music distribution and music production, is chosen. 1.3 The MP3 and P2P phenomena. 5.
(18) The business model of selling the physical music copies, such as discs, tapes, LPs and CDs, has been changed, and the territories which were built by the world media giants have been shaken by several new media storing and data transmitting technologies, MP3s and P2P, in the final decade of the twentieth century. In 1987, the collaboration between Germany's Fraunhofer Institute and the University of Erlangen resulted in a music compression/ decompression algorithm, Moving Picture Expert Group 1 Audio Layer 3 or MP3, could shrink sound files by 90% without unduly sacrificing quality. In 1992 it was approved as a Motion Picture Experts Group (MPEG) standard and a standard for the compression of audio recordings. Because music can be copied from CDs and the sizes of the digital music files are significantly reduced with no perceptible loss of quality by the new MP3 technology, transmitting music files via Internet has become much easier than before. Moreover, consumers can play “free” digital music copies on personal computers and special MP3 devices. As a result, the MP3 format has proved significantly more popular than proprietary formats such as Microsoft's Windows Media Audio Player (WMA); and numerous illegal websites, such as MP3.com/music, download.com , listen.com., has been inspired to distribute unauthorized music. In the ongoing years, consumers accessed to a new generation of faster personal computers, modems and Internet connecting speed, it stimulated the larger-scale download of MP3 files. In the August edition of Wired magazine, in addition, Vito Peraino reported that about 846 million new CDs were sold in 1998, but at least 17 million MP3 files are downloaded from the net each day and adds up to almost 3 billion in the first six months of 1999 (Vito Peraino ,1999). In June 1999, Napster released its controversial peer-to-peer music file sharing software, with which users can share MP3 music files in their own computers directly with other users, to the public. Peer-to-Peer (P2P) technology is a completely new file transmitting methodology which is different from the Client/Server before. The server computers no longer store any content data, such as video files, but the profiles, name of file, size and connecting speed for example, of every end user, which called peers. With this brand-new technology the cyberspace itself became a huge virtual-database sharing myriad resources, hence the user number grew dramatically. By many. 6.
(19) accounts it was the fastest growing application in the Internet’s history, expanding from 30 users to 25 million users in its first 12 months of operation (Strahilevitz, 2002). Furthermore, many P2P file sharing systems have followed Napster, including OpenNap, Scour, iMesh, Gnutella, eDonkey, FreeNet, BitTorroent, and DirectConnect. As of June 2004 the most popular such network is Kazaa, which according to Download.com has been downloaded over 350 million times since its introduction in July 2000 (Asvanund et al., 2004). Consistent with the booming of the P2P file sharing technology, the phenomenon of illegal digital music files downloading has become much more serious and made a harsh impact on the economy. Research by the independent Pew Internet & American Life project suggests that about 36 million US citizens, equal to 27 per cent of US internet users, have downloaded either music or video files for free that they do not own in other forms, although figures for repeat downloading are less certain (Madden and Rainie, 2005). A perspective is provided by the music industry's claim in the IFPI Music Piracy Report 2005 that one in three music recordings worldwide is pirated, and a US$4.6 billion music pirate market has been created (London and Madrid, 2005). 1.4 The lawsuit against Napster In order to deterred the behavior of music piracy and reduced the economic loss by music downloading, the media groups did several actions, such as lawsuits, selling authorized online music, and alliance with another industries, last seven years (Molteni and Ordanini, 2003). One of the best-known anti-piracy strategies was the Recording Industry Association of America (RIAA) filing a federal lawsuit against Napster for copyright infringement in December 1999. RIAA did not sue Napster directly for the copyright infringement, but rather argued that Napster’s software enable its users to exchange copyright protected music files for free. Hence, RIAA alleged that Napster was liable for contributory and vicarious copyright infringement. The RIAA suit asked for damages of $100,000 per infringement, with estimated damages in excess of $100 million (Navissi et al., 2005). After approximately two years of intense debates and legal battles, a three-member panel of judges from the Ninth U.S. 7.
(20) Circuit Court of Appeals ruled that Napster knowingly encouraged and assisted its users to infringe the record companies’ copyrights, and the Napster was eventually ordered to shut down in February 2001 The most recent strategy adopted by copyright holders of bringing legal action against violators may be more successful, even though the proportion of users who are targeted is a small fraction of the total number of users. The success of this strategy depends on raising the implicit cost of sharing for users by raising their legal risks. Increased sharing costs will then raise their propensity to free-ride and may ultimately reduce the utility offered by illicit file trading over P2P networks enough to make the legitimate purchase of the music and attractive option for users. (Asvanund et al., 2004) Notwithstanding the copyright holders tried to limit unauthorized file sharing by lawsuits, this strategy could only increasing free-riding on another new P2P networks, for example Kazaa became the largest P2P file trading program in 2002, but could not help stopping the music pirating. Besides, shutting down individual file-swapping networks did little to change user behavior, because individual users can simply look for new networks where they can trade files (Asvanund et al., 2004; Condry, 2004). Then again, some researches pointed out that P2P file sharing systems can provide a platform for the consumers to download sample music files, it may potentially stimulate music purchases in a positive way (Navissi et al., 2005). 1.5 The iPod+iTunes business model Another anti-piracy strategy launched by the media groups and copyright holders recently is forging an alliance with the other industries, such as hardware producers, distribution channels, and internet companies, to “transform” the illegal downloading into authorized content trading. The iPod-plus-iTunes Music Store, which was the outcome of the cooperation between the five major media conglomerates and the Apple Computer, set a milestone of authorized music downloading services. In 2001, Apple Computer launched a new digital music mobile device, iPod, into the market. This new device included several important functions such as a 5G hard disc space, Advance Audio Code, the file compressing technology designed for music, and Digital Right Management, that can store a large. 8.
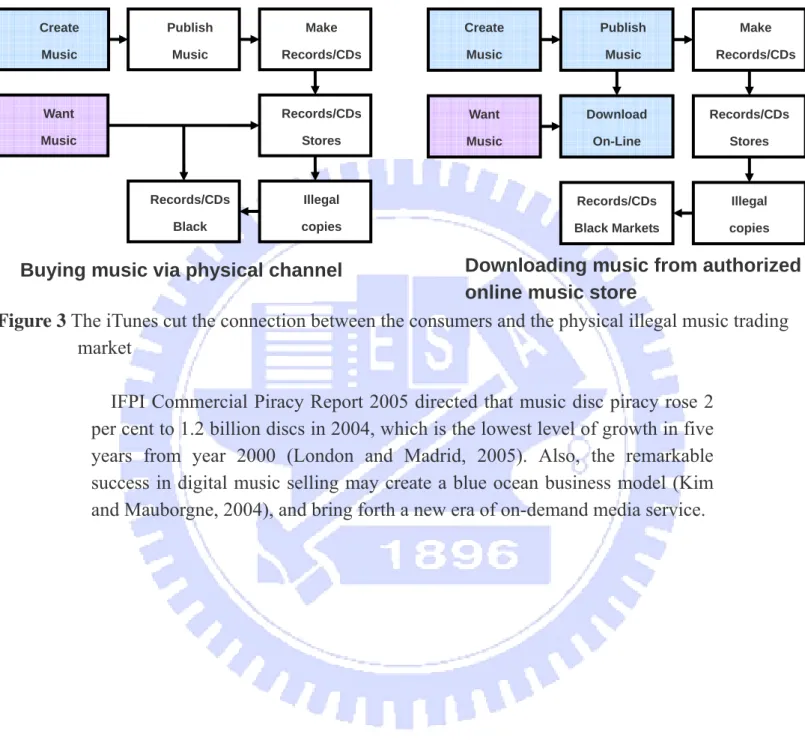
(21) number of the copyrighted digital music. After the Apple making an alliance with big five music giants the Apple’s iTunes Online Music Store was opened in April 2003. Therefore consumers can purchase authorized music only cost 99 cents per song via the iTunes Online Music Store, and download the digital music files into their iPods. In addition, the copyright holders can share 65 per cent of the profit in one song downloading from iTunes Store (Condry, 2004).The label receives 47 cents, while the artist, producer, and songwriter/publisher together receive only 18 cents. In contrast, the artists, songwriters and producers combined could expect about 12 to 18 per cent of the sale price of an album in the era of cassette tapes (Vogel, 2001). Table 1 Sales of 99 cent songs from Apple’s online iTunes Store USA Label 47 Artist Producer Publishing. 7 3 8. Service provider Distribution affiliate Bandwidth costs Credit card fees. 17 10 2 5. Total (cents / song) 99 Source: Billboard, 12 July 2003, p. 64. Because the price of the legal music downloading via iTunes was reasonable, the growth of sell in such music downloading service was quite startling. One million songs had been downloaded in the first week since the Online Music Store was launched, and 0.5 billion songs, according to the report on the website of Apple Computer, has been downloaded until July 2005. Since the emergence of successful music download services like iTunes is proving not only makes consumers paying for quality content, but the intentions to download illegal music files are diminishing. Figure 3 shows that. 9.
(22) this system gives consumers a legal platform to buy songs in a reasonable price, and the illegal music trading market will be no longer existed.. Create. Publish. Make. Create. Publish. Make. Music. Music. Records/CDs. Music. Music. Records/CDs. Want. Records/CDs. Want. Download. Records/CDs. Music. Stores. Music. On-Line. Stores. Records/CDs. Illegal. Records/CDs. Illegal. Black. copies. Black Markets. copies. Downloading music from authorized online music store Figure 3 The iTunes cut the connection between the consumers and the physical illegal music trading market Buying music via physical channel. IFPI Commercial Piracy Report 2005 directed that music disc piracy rose 2 per cent to 1.2 billion discs in 2004, which is the lowest level of growth in five years from year 2000 (London and Madrid, 2005). Also, the remarkable success in digital music selling may create a blue ocean business model (Kim and Mauborgne, 2004), and bring forth a new era of on-demand media service.. 10.
(23) 2. Literature Review. 2.1 DEA Method 2.1.1 Introduction of DEA Data envelopment analysis (DEA), first introduced by Charnes, Cooper, and Rhodes in 1978, is a linear programming based technique for measuring the relative performance extended Farrell’s (1957) idea of estimating technical efficiency with respect to a production frontier. The main advantage of frontier efficiency over other performance indicators is that it is an objectively determined quantitative measure that removes the effects of market prices and other exogenous factors that influence observed performance (Bauer et al.,1997). Furthermore, unlike most of the traditional econometric approaches, DEA does not require many restrictions on the underlying production technology, or an exogenous specification of the parametric form of the production correspondences. Thus DEA become a new tool in operational research for measuring technical efficiency. The resulting CCR model (Charnes, Cooper, and Rhodes, 1978), named after the three authors, is an optimization method of mathematical programming to generalize the Farrell (1957) single-input/ single-output technical efficiency measure to the multiple-input/ multiple-output case by constructing a relative efficiency score of similar Decision Making Units (DMUs) as the ratio of a single virtual output to a single virtual input on a constant returns to scale basis. In 1984, the CCR model was extended by Banker, Charnes, and Cooper (1984) (BCC) to include variable returns to scale. So the basic DEA models are known as CCR and BCC. Since 1978 over 1,800 articles, books and dissertation have been published (Gattoufi et al., 2004) and DEA has rapidly extended to returns to scale, dummy or categorical variables (Cook, Kress, and Seiford, 1996), discretionary and non-discretionary variables (Banker and Morey, 1986; Kao, 1994), incorporating value judgments (Banker and Morey, 1989), longitudinal analysis (Lang and Golden, 1989), weight restrictions (Thompson et al., 1986), stochastic DEA (Kao and Liu, 2000), non-parametric Malmquist indices (Färe et al., 1992), technical change in DEA and many other topics. Up to now the. 11.
(24) DEA measure has been used to evaluate and compare educational departments (Kao and Yang, 1992), health care (Banker, Conrad, and Strauss, 1988), prisons (Ganley and Cubbin, 1987), agricultural production (Fandel, 1998), banking (Oral and Yolalan, 1992), armed forces (Charnes, Clark, Cooper, and Golany, 1984), sports (Sueyoshi, Ohnishi, and Kinase, 1999), market research, transportation (Rouse, Putterill, and Ryan, 1997), courts, benchmarking, index number construction and many other applications. At the moment researchers follow wide ranges of DEA and related topics. The main research areas of DEA are: z z z z z z z z z z z z z. Returns to scale Dummy or categorical variables Discretionary and non-discretionary variables Incorporating judgment Longitudinal analysis Weight restriction Stochastic DEA Non-parametric Malmquist indices Technical change in DEA Dynamics of Data Envelopment Analysis Sensitivity DEA Applications Other topics. 2.1.2 Advantages of DEA DEA’s application for performance measurement is widespread and the multidimensional nature of corporate performance makes it an ideal application area. Data Envelopment Analysis has several advantages associated with its use. First of all, DEA gives a single measure of performance which can take into account all dimensions of corporate activity, and it has the ability to simultaneously handle multiple inputs and outputs without making judgments on their relative importance. Also, it ensures that companies being examined will only be compared to firms which are aiming to secure similar objectives, as indicated by their financial data. In this way, problems can be identified, and specified, by measuring the subject firm’s performance against its peers. DEA provides a set of targets for performance improvements that managers can. 12.
(25) utilize to improve the firm’s performance. In addition, the method allows managers to determine and focus on the most important factors in the firms’ operations. Charnes et al. (1994) describe DEA as a new way of organizing and analyzing data, which can result in new managerial and theoretical insights. They highlight the following properties of DEA which make it an attractive approach to data analysis: z z z z. z z z z z z. z z. Focus on individual observations in contrast to population averages. Produce a single aggregate measure for each DMU in terms of its utilization of input factors to produce desired outputs. Can simultaneously utilize multiple outputs and multiple inputs with each being stated in different units of measurement. DEA is a non-parametric approach which is value free and does not require specification or knowledge of a priori weights or prices for the inputs and outputs. Place no restriction on the functional form of the production relationship. The results of efficiency are Pareto optimal. Focus on revealed best-practice frontiers rather than on central-tendency properties of frontiers. Satisfy strict equity criteria in the relative evaluation of each DMU. Can accommodate judgment when desired. Produce specific estimates for desired changes in inputs and/or outputs for projecting DMUs below the efficient frontier onto the efficient frontier. Can adjust for exogenous variables. Can incorporate categorical variables.. 2.1.3 Basic DEA Models 2.1.3.1 CCR Models DEA was initiated by Charnes Cooper and Rhodes in 1978 in their seminal paper. The paper practiced and extended by means of linear programming production economics concept empirical efficiency put forth some twenty years earlier by Farrell (1957). CCR model (Charnes, Cooper, and. 13.
(26) Rhodes, 1978) has the ability to estimate the relative efficiency score, which is lied between 0 and 1, of similar Decision Making Units (DMUs) by constructing an efficient frontier and a weighted ratio of inputs and outputs on a constant returns to scale basis. This nonparametric approach calculates efficiency in two stages. First an empirical production frontier is found based on the observed inputs and outputs of the DMUs of interest. This frontier representing best practice, Known as the envelopment surface, acts as a benchmark for all DMUs in the analysis. The DMUs are similar production units operating within the same cultural environment. The second stage of the analysis involves the computation of the efficiency score for each DMU as indicated by its distance from the frontier. The efficiency score indicates the proportion by which the unit can increase its outputs without consuming any more inputs, or conversely the proportion by which it can decrease its inputs and maintain the current output level (Pareto optimal). There is an inherent assumption in that the processes considered can be operated fractionally and combined linearly, which means that the production possibility set consists of points representing the observed DMUs and all possible linear combinations thereof. The results of CCR model can be best illustrated by the two dimensional example of Figure 4.. 14.
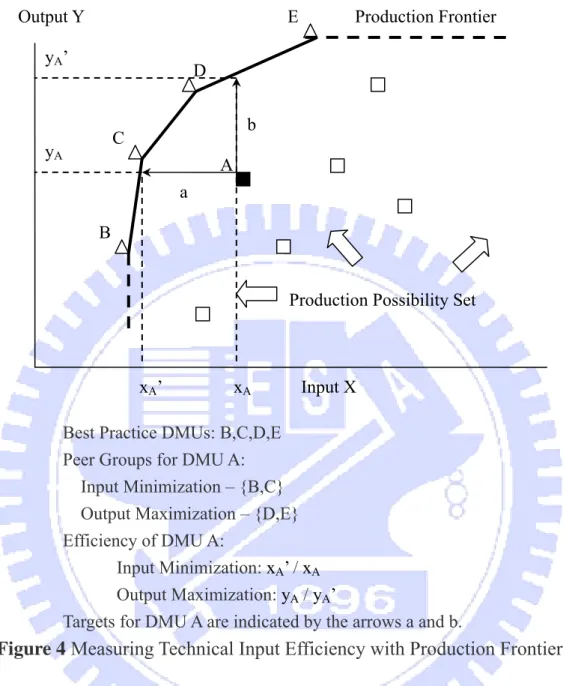
(27) E. Output Y yA’. Production Frontier. D b. C. yA. A a B. Production Possibility Set. xA’. xA. Input X. Best Practice DMUs: B,C,D,E Peer Groups for DMU A: Input Minimization – {B,C} Output Maximization – {D,E} Efficiency of DMU A: Input Minimization: xA’ / xA Output Maximization: yA / yA’ Targets for DMU A are indicated by the arrows a and b.. Figure 4 Measuring Technical Input Efficiency with Production Frontier Two alternative approaches are available in this model to estimate the efficient frontier. One is input-oriented CCR model, and the other is output-oriented CCR model. The following DEA model is an input-oriented model in multiplier form where the inputs are minimized and the outputs are kept at their current levels.. 15.
(28) s. max. hk =. ∑u y r =1 m. r. rk. ∑v x i =1. i ik. s. subject to. ∑u y r =1 m. r. rj. ∑v x i =1. ≤1. ( j = 1,L , n). i ij. vi ≥ ε > 0. (i = 1,L , m). ur ≥ ε > 0. (r = 1,L , s ). Where hk : the relative efficiency of object DMU k xij : the ith output for DMU j yrj : the rth output for DMU j vi : weight of ith input ur : weight of rth output N : number of DMUs m: number of input s: number of output ε : a non-Archimedean infinitesimal. Model above represents the relative efficiency score that the weighted output/input ratio is maximized on the restriction of the efficiency score cannot greater than one. However, this model can not be solved by linear programming solutions. As a result, Charnes Cooper and Rhodes (1978) added a constraint, m. ∑v x i =1. i ik. =1 , in this model to transform this model a linear programming one.. This model is shown below: max. s. hk = ∑ ur yrk r =1. subject to. s. m. r =1. i =1. ∑ ur yrj − ∑ vi xij ≤ 0 m. ∑v x i =1. i ik. ( j = 1,L , n). =1. vi ≥ ε > 0 ur ≥ ε > 0. (i = 1,L , m) (r = 1,L , s ). 16.
(29) Because the number of constraints, n+1, this model is more than variables, model should transform into the dual model, the envelopment form, in practice.. min subject to. ⎛. m. s. ⎞. r =1. ⎠. θ k − ε ⎜ ∑ si− + ∑ sr+ ⎟ ⎝ i =1. n. ∑x λ j =1. ij. n. ∑y j =1. rj. j. = θk xik − si− ,. λ j = yrk + sr+ ,. λ j ≥ 0,. i = 1,K ,m. + r. r = 1,K ,s. s ≥ 0,. r = 1,K ,s. j = 1,K ,n. − i. s ≥ 0,. i = 1,K ,m. θk is free. Where θ k : the technical input efficiency of object DMU k λ j : the improvable weight of inputs or outputs si− : slack of inputs sr+ : slack of outputs. Let us use the superscript * to denote the optimal value of a variable in this model. In the envelopment form CCR model, once θk has been minimized − + the model seeks the maximum sum of the slack values si and sr . If any one. of these values is positive at the optimal solution to the model it means that the corresponding input or output of DMU k can improve further, after its input levels have been contracted to the proportion θk*. On the other hand, if θk*= 1 − + and si *=0, i=1...m, sr *=0, r=1...s then DMU k is Pareto-efficient because the. model has been unable to identify some feasible production point which can improve on some input or output level of DMU k without detriment to some other input or output level. In practice, because of the difficulty of using a specific value for the model is solved in two phases. During the first phase θk is minimized, ignoring the slack values. This yield the minimum value θk* of θk . Then setting within θk =θk* the model is solved to maximize. m. i =1. 17. s. ∑s +∑s − i. r =1. + r. ..
(30) The alternative CCR approach is CCR output-oriented model, which maximizes the outputs of DMUs in their current inputs level. CCR output-oriented model in multiplier form is shown below: m. ∑v x. 1 = gk. min. i ik. i =1 s. ∑u y r. r =1. rk. m. subject to. ∑v x. i ij. i =1 s. ∑u y r. r =1. ≥1. ( j = 1,L , n). rj. vi ≥ ε > 0. (i = 1,L , m). ur ≥ ε > 0. (r = 1,L , s ). Where g k : the relative efficiency of object DMU k xij : the ith output for DMU j yrj : the rth output for DMU j vi : weight of ith input ur : weight of rth output N : number of DMUs m: number of input s: number of output ε : a non-Archimedean infinitesimal. Transform above model into the below one as the value-based form in order to complete the calculations: min subject to. m 1 = ∑ vi xij g k i =1 m. s. i =1. r =1. ∑ vi xij − ∑ ur yrj ≥ 0 s. ∑u y r =1. r. rj. ( j = 1,L , n). =1. vi ≥ ε > 0 ur ≥ ε > 0. (i = 1,L , m) (r = 1,L , s ). 18.
(31) Construct the dual model and get the CCR output-oriented model in envelopment form:. max subject to. s 1 ⎛ m ⎞ = φk + ε ⎜ ∑ si− + ∑ sr+ ⎟ gk r =1 ⎝ i =1 ⎠ n. ∑x λ j =1. ij. n. ∑y j =1. rj. j. = xik − si− ,. i = 1,K ,m. λ j = φk yrk + sr+ ,. λ j ≥ 0,. j = 1,K ,n. − i. i = 1,K ,m. + r. r = 1,K ,s. s ≥ 0, s ≥ 0,. φk is free. r = 1,K ,s. Where φk : the technical output efficiency of object DMU k λ j : the improvable weight of inputs or outputs si− : slack of inputs sr+ : slack of outputs. Let us use the superscript * to denote the optimal value of a variable. By definition, φk* is the technical output efficiency of DMU k, and the slack − + variables si and sr in model are interpreted in a similar manner to the slack. variables. They represent any additional output augmentations and/or input reductions feasible from the frontier points which can improve on any one of the input or output level of DMU k by the factor φk*. In the envelopment form CCR output-oriented model, once 1/φk has been maximized the model seeks − + the maximum sum of the slack values si and sr . If and only if φk*= 1 and. si− *=0, i=1...m, sr+ *=0, r=1...s then DMU k is Pareto-efficient because the model. has been unable to identify some feasible production point which can improve on some input or output level of DMU k without detriment to some other input or output level. In practice, model is solved by a two-phase process as was the case with model earlier. During the first phase 1/φk is maximized, ignoring the slack. 19.
(32) values. This yield the maximum value 1/φk* of 1/φk . Then setting within φk=φk* the model is solved to maximize. m. s. i =1. r =1. ∑ si− + ∑ sr+ .. It can be shown, see Cooper et al. (2000) section 3.8 that: The technical input efficiency measure θk* yielded by model and the technical output efficiency measure φk* yielded by in respect of DMU k are equal. As CCR models yield equal measures of efficiency under constant returns to scale, either one is sufficient for estimating the technical input or output efficiency of a DMU. However, in cases where inputs are controllable while outputs are exogenous it is more sensible to use CCR model which estimates technical input efficiency. In contrast, where outputs are controllable and inputs are exogenous it makes sense to use CCR model (Thanassoulis, 2001).. 2.1.3.2 BCC Models In 1984 Banker, Charnes, and Cooper (1984) (BCC) relaxed the assumption of constant returns to scale (CRS) in the CCR model and generated a variable returns to scale (VRS) model, named as BCC model, and VRS means that the scale of operation affects the input-output relationship. If (x, y) is a non-zero feasible input-output correspondence, the VRS assumption means that average productivity denoted by the ratio y/x is dependent on scale of production. Consider a set of DMUs (j=1,…,N) operating under VRS and let DMU k be Pareto-efficient. Solve CCR model in respect of DMU k and let the superscript * to a variable denote its optimal value CCR model, and the returns to scale condition can be identified by following criteria (Thanassoulis , 2001): z. If. n. ∑λ j =1. j. > 1 for all optimal solutions for CCR model then DRS. hold locally at DMU k; z. If. n. ∑λ j =1. j. = 1 for at least one optimal solutions for CCR model then. CRS hold locally at DMU k;. 20.
(33) z. If. n. ∑λ j =1. j. < 1 for all optimal solutions for CCR model then IRS hold. locally at DMU k; Also there are two alternative approaches, input-oriented approach and output-oriented approach, to estimate the efficient frontier in BCC model. The BCC input-oriented model below can be generated by adding a constraint, n. ∑λ j =1. j. = 1 , into CCR input-oriented model in envelopment form.. ⎛. s. ⎞. r =1. ⎠. m. θ k − ε ⎜ ∑ si− + ∑ sr+ ⎟. min. ⎝ i =1. n. subject to. ∑x λ j =1. ij. n. ∑y j =1. j =1. = θk xik − si− ,. rj. λ j = yrk + sr+ ,. j. =1. n. ∑λ. j. λ j ≥ 0,. j = 1,K ,n. si− ≥ 0,. i = 1,K ,m. sr+ ≥ 0,. r = 1,K ,s. i = 1,K ,m r = 1,K ,s. θk is free. And the dual model of above model, value-based model, is shown below: max. s. hk = ∑ ur yrk − u0 r =1. subject to. s. m. ∑u y − ∑v x r =1. r. rj. m. ∑v x i =1. i ik. i =1. i ij. − u0 ≤ 0. ( j = 1,L , n). =1. vi ≥ ε > 0 ur ≥ ε > 0. (i = 1,L , m) (r = 1,L , s ). u0 is free. The output-oriented BCC envelopment form model is shown as follow:. 21.
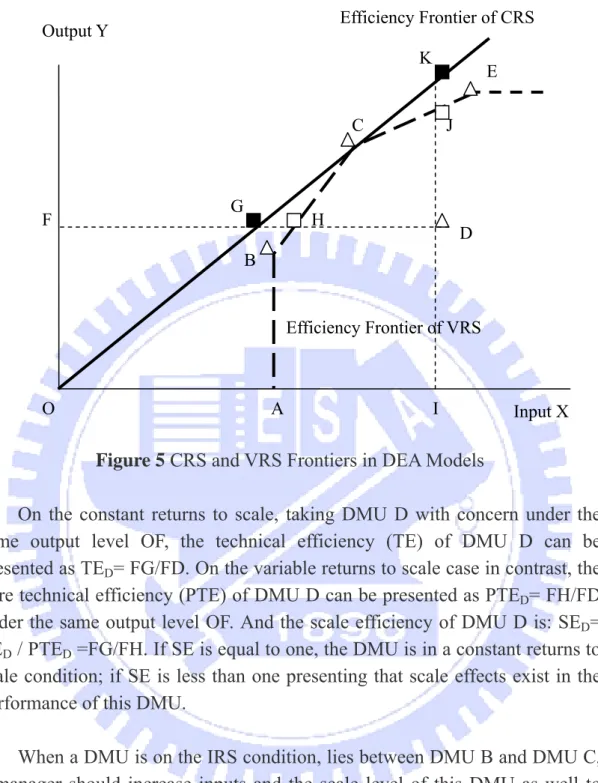
(34) s 1 ⎛ m ⎞ = φk + ε ⎜ ∑ si− + ∑ sr+ ⎟ gk r =1 ⎝ i =1 ⎠. max. n. subject to. ∑x λ j =1. ij. n. ∑y j =1. j =1. = xik − si− ,. rj. λ j = φk yrk + sr+ ,. j. =1. n. ∑λ. j. i = 1,K ,m. λ j ≥ 0,. j = 1,K ,n. si− ≥ 0,. i = 1,K ,m. sr+ ≥ 0,. r = 1,K ,s. φk is free. r = 1,K ,s. The output-oriented BCC value-based form model is shown as model below: min subject to. m 1 = ∑ vi xij + v0 g k i =1 m. s. i =1. r =1. ∑ vi xij − ∑ ur yrj + v0 ≥ 0 s. ∑u y r =1. r. rj. ( j = 1,L , n). =1. vi ≥ ε > 0 ur ≥ ε > 0. (i = 1,L , m) (r = 1,L , s ). v0 is free. Figure 5 shows different efficiency frontiers of DMUs on the CRS and VRS basis single input-output DEA model. The frontier of BCC model is constructed by lines in different slopes, and it reveals that the expanding ratio of outputs can be increase, decrease or keep constant with the increasing of inputs. On the other hand, the frontier of CCR model is in a line with a constant slope.. 22.
(35) Efficiency Frontier of CRS. Output Y. K. E. C. F. G. J. H. D. B. Efficiency Frontier of VRS. O. A. I. Input X. Figure 5 CRS and VRS Frontiers in DEA Models On the constant returns to scale, taking DMU D with concern under the same output level OF, the technical efficiency (TE) of DMU D can be presented as TED= FG/FD. On the variable returns to scale case in contrast, the pure technical efficiency (PTE) of DMU D can be presented as PTED= FH/FD under the same output level OF. And the scale efficiency of DMU D is: SED= TED / PTED =FG/FH. If SE is equal to one, the DMU is in a constant returns to scale condition; if SE is less than one presenting that scale effects exist in the performance of this DMU. When a DMU is on the IRS condition, lies between DMU B and DMU C, a manager should increase inputs and the scale level of this DMU as well to improve the efficiency. In addition, when a DMU is on the DRS condition, lies between DMU C and DMU E, a manager should decrease inputs and the scale level of this DMU as well to improve the efficiency. Thus managers can identify the reason of inefficiency caused by inappropriate inputs or outputs scale, and perceive the ideal scale size to operate a DMU through BCC model (Thanassoulis, 2001).. 23.
(36) 2.1.4 Assessing Efficiency under Exogenously Fixed Input-Output Variables Basic DEA models, CCR and BCC model, measure the efficiency of a DMU in terms of the maximum radial contraction to its input levels or expansion to its output levels feasible under efficient operation. However, such measures are not suitable in contexts where at least one of the variables to be radially contracted or expanded is exogenously fixed, in the sense that it is not controllable by the DMUs. One of the modified-DEA models has the ability to handle exogenously fixed or non -discretionary inputs and outputs though. Banker and Morey (1986) extended basic DEA models, that they can be used for assessing efficiency under exogenously fixed input-output variables as a result, and illustrated the impact of a non-discretionary input in an analysis of fast food restaurants. Figure 6 helps to illustrate their approach.. Input 2 U1 C. A. U2. U4 D. B. U3 O. Input 1. Figure 6 Input Efficiency while Input 2 is Exogenously Fixed Figure 6 depicts a set of DMUs operating a CRS technology using two inputs to secure one output. Output has been standardized to one unit. Assume that input 1 is controllable by the DMU but input 2 is exogenously fixed. The basic input-oriented DEA model uses B as an efficient referent point for DMU. 24.
(37) U2 and so the efficiency measure it yields is: OB/OU2. This measure, however, reflects the uniform contraction to its input levels per unit of output, where the implied reduction to the level of input 2 is CD. But this reduction to the level of input 2 is not feasible while input 2 is exogenously fixed. The extension to the basic DEA model put forth by Banker and Morey (1986) assesses the efficiency of DMU U2 with reference to the maximum feasible contraction to input 1, which is not exogenously fixed, controlling for the level of input 2, which is exogenously fixed. Thus the Banker and Morey (1986) extended DEA model would measure the efficiency of DMU U2 in Figure 6 with reference to point A. The resulting efficiency measure will be CA/CU2. Models below show respectively the modifications to the basic input oriented CRS and VRS DEA models developed by Banker and Morey (1986) for dealing with exogenously fixed input-output variables in the general case. The corresponding output oriented models can be deduced by analogy. Model relates to DMUs (j=1…N) using m inputs to secure s outputs. The inputs are partitioned into two subsets {D} and {not D} consisting respectively of discretionary (i.e. under managerial control) and non-discretionary (i.e. exogenously fixed) inputs. If the DMUs operate under CRS then the technical input efficiency of DMU k isθk*, where θk* is the optimal value of θk in:. min. ⎛. s ⎞ si− + ∑ sr+ ⎟ r =1 ⎝ i =1,i∈{D} ⎠. n. subject to. m. ∑. θk − ε ⎜. ∑x λ j =1. ij. j. = θk xik − si− ,. n. n. ∑x λ =∑λ x j =1. ij. n. ∑y j =1. rj. j. j =1. j ik. − si− ,. λ j = yrk + sr+ ,. λ j ≥ 0,. j = 1,K ,n. si− ≥ 0,. i = 1,K ,m. + r. s ≥ 0,. i ∈{D} (under managerial control) i ∉ {D} (exogenously fixed). r = 1,K ,s. r = 1,K ,s. θk is free. 25.
(38) Where hk : the relative efficiency of object DMU k xij : the ith output for DMU j yrj : the rth output for DMU j vi : weight of ith input ur : weight of rth output D: subset of the discretionary inputs N : number of DMUs m: number of input s: number of output ε : a non-Archimedean infinitesimal. Above model differs from the basic DEA CCR model for assessing technical input efficiency under CRS in three respects. Firstly, θk measures the radial contraction feasible only in respect of the discretionary rather than all inputs. Secondly, the slacks of exogenously fixed inputs are not reflected within the summation term in the objective function. Thus the efficiency measure arrived at by means of this model reflects the extent to which DMU k can contract radially only those of its inputs which are not exogenously fixed. Finally, the non-discretionary input levels of DMU k on the right hand side of respective constraints in model are multiplied by. n. ∑λ j =1. j. . This ensures that the. most productive scale size yielded by the model in respect of DMU k does not require larger levels on the non-discretionary inputs than those of DMU K. Assume now that DMUs relating to model above operate a VRS technology. Then to assess the pure technical input efficiency of DMU k model below is used.. 26.
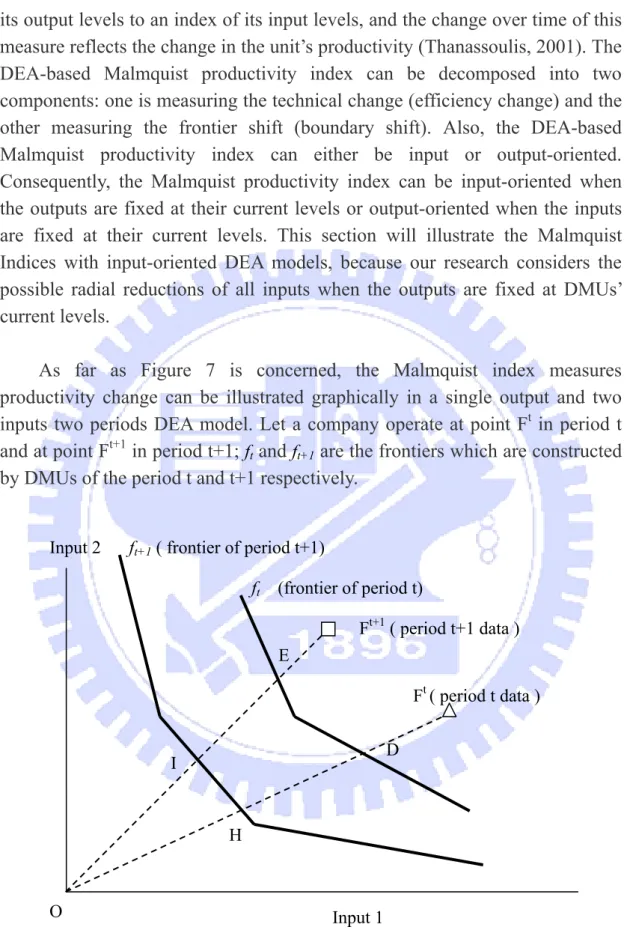
(39) min subject to. ⎛. s ⎞ si− + ∑ sr+ ⎟ r =1 ⎝ i =1,i∈{D} ⎠ m. ∑. θk − ε ⎜ n. ∑x λ j =1. j. = θk xik − si− ,. j. = xik − si− ,. ij. n. ∑x λ j =1. ij. n. ∑y j =1. rj. λ j = yrk + sr+ ,. j. =1. n. ∑λ j =1. i ∈{D} (under managerial control) i ∉ {D} (exogenously fixed). λ j ≥ 0,. j = 1,K ,n. si− ≥ 0,. i = 1,K ,m. + r. s ≥ 0,. r = 1,K ,s. r = 1,K ,s. θk is free. Model differs from the basic CCR model for assessing technical input efficiency under VRS in two aspects. Firstly, θk measures the radial contraction feasible only in respect of the discretionary rather than all inputs. Secondly, the slacks of exogenously fixed inputs are not reflected within the summation term in the objective function. Thus the efficiency measure arrived at by means of above model reflects the extent to which DMU k can contract radially only those of its inputs which are not exogenously fixed. As the input variables, employees, capital assets, domestic piracy rate, and internet population, in our sample data can be divided into two categories, under managerial control and exogenously fixed. Our research will adapt the CCR input-orient model, which is modified by exogenously fixed inputs, to construct the Malmquist indices and inspect the productivity movement between two periods. The methodology of Malmquist indices, which can present the cross-period productivity change, will be illustrated in the next section.. 2.1.5 Assessing Productivity Change by DEA: Malmquist Indices DEA-based Malmquist productivity index, which was first introduced by Färe et al. (1989), measures the productivity change over time. In multi-input multi-output contexts a unit’s productivity is defined as the ratio of an index of. 27.
(40) its output levels to an index of its input levels, and the change over time of this measure reflects the change in the unit’s productivity (Thanassoulis, 2001). The DEA-based Malmquist productivity index can be decomposed into two components: one is measuring the technical change (efficiency change) and the other measuring the frontier shift (boundary shift). Also, the DEA-based Malmquist productivity index can either be input or output-oriented. Consequently, the Malmquist productivity index can be input-oriented when the outputs are fixed at their current levels or output-oriented when the inputs are fixed at their current levels. This section will illustrate the Malmquist Indices with input-oriented DEA models, because our research considers the possible radial reductions of all inputs when the outputs are fixed at DMUs’ current levels. As far as Figure 7 is concerned, the Malmquist index measures productivity change can be illustrated graphically in a single output and two inputs two periods DEA model. Let a company operate at point Ft in period t and at point Ft+1 in period t+1; ft and ft+1 are the frontiers which are constructed by DMUs of the period t and t+1 respectively.. Input 2. ft+1 ( frontier of period t+1) ft (frontier of period t) Ft+1 ( period t+1 data ) E Ft ( period t data ) D. I. H. O. Input 1. Figure 7 Measure The Frontier Shift Over Two Periods Take the frontier of period t, ft ,in Figure 7 as concern, the technical input. 28.
(41) efficiency of company F is OD/OFt in period t and OE/OFt+1 in period t+1. Thus its productivity change based on the frontier period t is the ratio of the efficiencies, (OE/OFt+1)÷(OD/OFt) , in two periods. The productivity change based on the frontier period t+1 is the ratio of the efficiencies, (OI/OFt+1)÷(OH/OFt), likewise. The geometric mean of these two ratios is taken to measure the productivity change of this company. Thus the productivity change of the company operating at Ft in period t and at Ft+1 in period t+1 in Figure 7 is {[. OE OD OI OH 1/ 2 OI OD OE OD 1/ 2 ÷ ÷ ] × [ t+1 ÷ ]} = [ t+1 ÷ ]×[ ] t+1 t t t OF OF OF OF OF OF OI OH 'Catch-up' 'Boundary shift' component. component. The catch-up term in above equation is a measure of how much closer to the boundary the company is in period t+1 compared to period t. OI/OFt+1 measures the distance of the company from the t+1 efficient boundary and OD/OFt its distance from the efficient boundary in period t. If the catch up term is one the company has the same distance in periods t+1 and t from the respective efficient boundaries. If the catch up term is over one the company has moved closer to the period t+1 boundary than it was the period t boundary and the converse is the case if the catch up term is under one. The boundary shift term measures the movement of the boundary between period t and t+1 at two locations: The ratio OE/OI measures the distance of the two boundaries at the input mix of the company in period t+1. The ratio OD/OH measures the distance of the two boundaries at the input mix of the came company in period t. The boundary shift term is over one because both of the foregoing ratios are over one, which represents productivity gain by the industry and the input levels in period t+1 is lower than in period t. In contrast, if the boundary shift term under one would signal that the industry has registered productivity loss as input level would on average be higher in period t+1 compared to period t, controlling for output. Moreover, the productivity would neither gain nor loss on average while the boundary shift term is equal to one. These concepts would be presented in following mathematical forms. Suppose there are n DMUs, each DMUj ( j =1,2…,n) produces a vector of outputs y tj = ( y1t j ... ysjt ) by using a vector of inputs xtj = ( x1t j ...xmjt ) at each time. 29.
(42) period t, t=1,…,T. The CCR DEA model can be expressed as (Charnes et al., 1978): Θ1 = θ kt ( xkt , ykt ) = minθk ,λ θ k j. n. subject to. ∑x λ j =1 n. t ij. ∑y j =1. t rj. j. ≤ θk xikt ,. λ j ≥ yrkt ,. λ j ≥ 0,. i = 1,K ,m r = 1,K ,s. j = 1,K ,n. t Where xkt = ( x1tk ...xmk ) and ykt = ( y1tk ... yskt ) are the input and output vectors. of DMU k among others. If Θ1=1, then DMU k is efficient, on the empirical production frontier (EPF), in time period t; otherwise, if Θ1<1, then DMU k is and y t+1 the technical inefficient. Similarly, by replacing x tj and y tj with x t+1 j j. efficiency, θ kt +1 ( xkt +1 , ykt +1 ) , for DMU k at the time period t+1 can be calculated.. Θ4 = θ kt +1 ( xkt +1 , ykt +1 ) = minθk ,λ θ k j. n. subject to. ∑x j =1 n. t +1 ij j. ∑y j =1. λ ≤ θk xikt +1 ,. t +1 rj j. λ j ≥ 0,. λ ≥ yrkt +1 ,. i = 1,K ,m r = 1,K ,s. j = 1,K ,n. From t to t+1, DMUk’s technical efficiency may change and the EPF may shift. Based upon CCR model, the radial Malmquist productivity index can be calculated via (Färe et al., 1994a, b). (i). Comparing x tj to EPF at time t, namely, calculating Θ1= θ kt ( xkt , ykt ) ;. (ii). to EPF at time t, namely, calculating Θ4= Comparing x t+1 j. 30.
(43) θ kt +1 ( xkt +1 , ykt +1 ) ;. (iii). Comparing x tj to EPF at time t+1, that is, calculating Θ2= θ kt +1 ( xkt , ykt ) through the following linear program: Θ2 = θ kt +1 ( xkt , ykt ) = minθk ,λ θ k j. n. subject to. ∑x. t +1 ij j. j =1 n. ∑y j =1. λ + λn +1 xikt ≤ θk xikt ,. t +1 rj j. λ + λn +1 yrkt ≥ yrkt ,. λ j ≥ 0,. (iv). i = 1,K ,m r = 1,K ,s. j = 1,K ,n + 1. Comparing x t+1 to EPF at time t, namely, calculating Θ3= j θ kt ( xkt +1 , ykt +1 ) through the following linear program: Θ3 = θ kt ( xkt +1 , ykt +1 ) = minθk ,λ θ k j. n. subject to. ∑x λ j =1 n. t ij. ∑y j =1. t rj. j. + λn +1 xikt +1 ≤ θk xikt +1 ,. λ j + λn +1 yrkt +1 ≥ yrkt +1 ,. i = 1,K ,m r = 1,K ,s. j = 1,K ,n + 1. λ j ≥ 0,. The Malmquist productivity index (MPI) is defined as (Färe et al., 1992) θ t ( xt , y t ) × θ kt +1 ( xkt , ykt ) 1/ 2 Θ1 × Θ2 1/ 2 MPI k = [ t k t +1 k t +k1 ] =[ ] . θ k ( xk , yk ) × θ kt +1 ( xkt +1 , ykt +1 ) Θ3 × Θ 4 MPIk, a geometric mean of two Caves et al.'s (1982) Malmquist productivity indices, measures the productivity change between periods t and t+1. Färe et al. (1992) define that MPIk >1 indicates productivity gain; MPIk <1 indicates productivity loss; and MPIk =1 means no change in productivity from time t to t+1. Furthermore, Färe et al. (1992) decompose Malmquist productivity index into two components:. 31.
數據
+7


相關文件
為配合政府推動六大新興產業及十大重點服務業之發展與開拓就業
七、實務能力培養,與產業接軌:學校除重視實務能力的培養外,為使學生進入職場時擁
Professional Learning Community – Music
培養創意 發展音樂 培養評賞音樂 認識音樂 及想像力 技能與過程 的能力 的情境. 價值觀 與 態度
理解並欣賞幾何的性質可以透過坐標而轉化成數與式的 關係,而數與式的代數操作也可以透過坐標產生對應的
培養創意 發展音樂 培養評賞音樂 認識音樂 及想像力 技能與過程 的能力 的情境. 價值觀 與
培養創意 發展音樂 培養評賞音樂 認識音樂 及想像力 技能與過程 的能力 的情境. 價值觀 與
Heal the World Michael Jackson You Raise Me Up Secret Garden Climb Every Mountain Rodgers & Hammerstein You are My Hiding Place Selah. God Will Make a Way
