Music Classification Using Significant Repeating
Patterns
Chang-Rong Lin, Ning-Han Liu, Yi-Hung Wu, Arbee L.P. Chen* Department of Computer Science
National Tsing Hua University Hsinchu, Taiwan 300, R.O.C. alpchen@cs.nthu.edu.tw
Abstract. With the popularity of multimedia applications, a large amount of
music data has been accumulated on the Internet. Automatic classification of music data becomes a critical technique for providing an efficient and effective retrieval of music data. In this paper, we propose a new approach for classify-ing music data based on their contents. In this approach, we focus on mono-phonic music features represented as rhythmic and melodic sequences. More-over, we use repeating patterns of music data to do music classification. For each pattern discovered from a group of music data, we employ a series of measurements to estimate its usefulness for classifying this group of music data. According to the patterns contained in a music piece, we determine which class it should be assigned to. We perform a series of experiments and the results show that our approach performs on average better than the approach based on the probability distribution of contextual information in music.
Keywords:Music classification, Repeating patterns, Feature extraction.
1 Introduction
As the amount of music data increases, classification of music data has become an important issue. In [2][6], the machine learning techniques including naïve Bayesian, linear, and neural network are employed to build classifiers for music styles. As a result, they identify emotional classes of music styles such as lyrical and frantic. Chai and Vercoe [4] classify folk music into groups based on melody, where each group corresponds to the music of a particular country. They first build a hidden Markov model for each country based on training data. After that, a music piece can be classi-fied by the probabilities associated with the model.
Tzanetakis et al. [15] also make efforts in music classification focusing on the fea-tures derived from audio signals. In [14], they further derive a feature named pitch
histogram based on a multiple pitch detection algorithm for polyphonic signals. In
that work, the symbolic representation, i.e. MIDI, is used as the ground truth for evaluating the results of audio analysis. Furthermore, Whitman and Smaragdis [16] combine audio-based music classification with metadata-based approach. Their ex-perimental results indicate that the combination of these two approaches performs
* The corresponding author
better than the individual ones. The similarity measures based on audio features have been discussed in the literature [3][11].
In this paper, we first find useful information for classification from the symbolic representations of music data. A similarity measure considering human perception of music is then designed to measure the similarity degree between two music objects. Finally, we consider a broader coverage of music with seven classes to do perform-ance evaluation (in contrast, [4] only considers the folk music of three countries).
To represent the music data, a variety of symbolic features, e.g. pitch, duration, starting and ending times of each note, can be considered. According to [5][6][8], two features, rhythm and melody, are most useful in content-based music retrieval. Music with the same style often exhibits similar rhythm and melody [13]. Therefore, we adopt them as two representations of music data in this paper. For each of them, we derive the repeating patterns of each music piece. A repeating pattern [9] refers to a consecutive sequence of feature values that appear frequently in a music piece. It is generally agreed in musicology that the repeating pattern is one of the most important features in music representations. In this paper, we make repeating patterns useful for music classification by further incorporating constraints (i.e. length and frequency) to the repeating patterns. The repeating patterns that satisfy the constraints are called
significant repeating patterns (abbreviated as SRP).
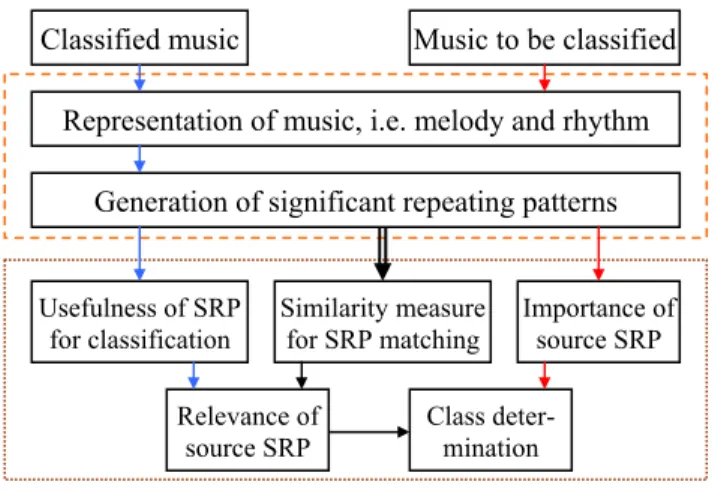
Figure 1 shows the flowchart of our approach for music classification, which con-sists of two stages, i.e. feature extraction and SRP-based classification. In the first stage, a number of music data, e.g. MIDI files, are collected from the World Wide Web and classified into seven classes manually. After that, we extract the two fea-tures, i.e. melody and rhythm, from the music data and represent them as symbolic sequences. For each class, we derive a set of class SRP’s on each feature. For the music object to be classified, we generate its SRP’s in a similar way. We call the SRP generated from the music object to be classified the source SRP.
Fig. 1. The flowchart of our approach
A source SRP is relevant to a class if there exists a class SRP of the class, whose similarity degree with the source SRP is larger than a similarity degree threshold. For
Classified music Music to be classified Representation of music, i.e. melody and rhythm
Generation of significant repeating patterns Usefulness of SRP for classification Similarity measure for SRP matching Importance of source SRP Relevance of source SRP Class deter-mination
a relevant source SRP, the most similar class SRP is called its target SRP. In the sec-ond stage, we determine how relevant a source SRP is to a class as follows:
1. For each class SRP of a class, its usefulness for classifying music data into each
class is first estimated.
2. For each source SRP, a similarity measure is used to identify the corresponding
target SRP in each class.
3. By combining the above information, to what degree a source SRP is relevant to
each class can be computed.
Except for the relevance to each class, the importance of a source SRP with respect to the music object to be classified is also computed. In this way, each source SRP is associated with two kinds of information. We combine them to estimate how possible a music piece belongs to a class. As a result, the music piece will be assigned to the class with the highest score. The experiment results indicate that our approach outper-forms the previous work.
The remaining of this paper is organized as follows. Section 2 describes the details of feature extraction. After that, the approach of SRP-based classification is presented in Section 3. Section 4 shows the experiment results with a discussion. Finally, this paper is concluded in Section 5.
2 Feature Extraction
2.1 Representations of MusicGiven a collection of MIDI files, we first select a representative track for each music piece manually. After that, the feature values of melody and rhythm are extracted from the representative tracks by using a MIDI parser. As a result, we represent each music piece by two symbolic sequences as follows.
Rhythm stands for a sequence of beats in music and often brings people various
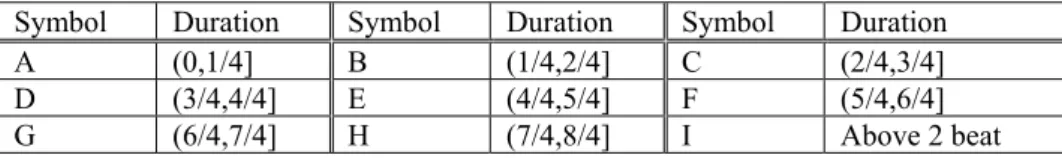
kinds of perception. For example, a rhythm with fast tempos may make some people nervous but others excited. According to the duration of a note, we classify each note into one of the nine types in rhythm, where each type is notated as a distinct symbol called beat symbol. Table 1 shows the set of beat symbols we use in this paper. Ex-cept for symbol I, the range of each beat symbol covers exactly a quarter of a beat. In this way, the rhythm of a music piece can be represented by a sequence of beat sym-bols, called the rhythmic sequence. As shown in Figure 2, the rhythmic sequence of an example is notated as “BBDBBDBBBBBBD”.
Table 1. The set of beat symbols
Symbol Duration Symbol Duration Symbol Duration
A (0,1/4] B (1/4,2/4] C (2/4,3/4]
D (3/4,4/4] E (4/4,5/4] F (5/4,6/4]
Fig. 2. The rhythmic sequence of an example
Melody is a sequence of pitches in music. A music piece with certain styles often
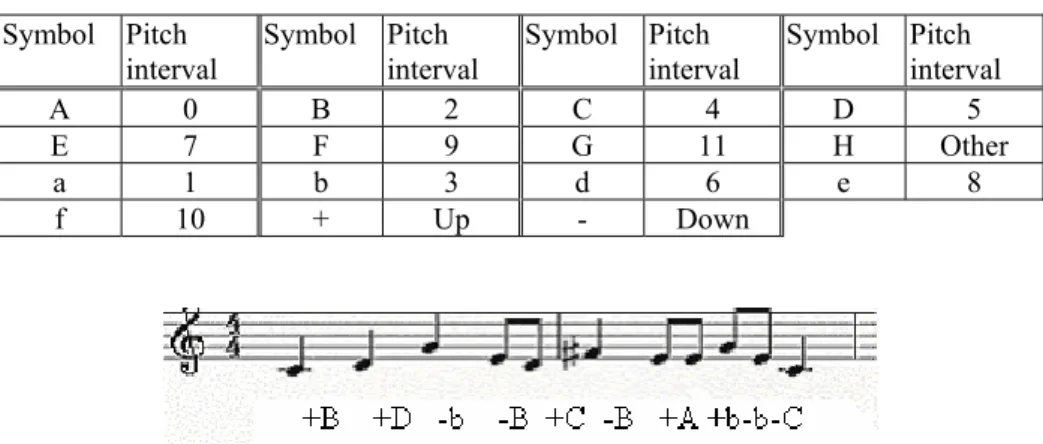
contains specific melodies because the composer is used to showing a style by using similar melodies. A pitch interval stands for the difference between the pitch values of two consecutive notes. It is straightforward to transform a melody into a sequence of pitch intervals. According to the length of a pitch interval, we classify each pitch interval into one of the thirteen types in melody, where each type is notated as a dis-tinct symbol called pitch symbol. Table 2 shows the set of pitch symbols we use in this paper. Each type of pitch intervals has two orientations, i.e. from low to high and the inverse. Therefore, we provide a plus or minus sign for each pitch symbol to indi-cate the orientation. In the set of pitch symbols, we distinguish the major intervals from the minor ones because they often bring people different kinds of perception, e.g. happiness and sadness. In this way, the melody of a music piece can be repre-sented by a sequence of pitch symbols, called the melodic sequence. As shown in Figure 3, the melodic sequence of an example is notated as “+B+D-b-B+C-B+A+b-b-C”.
Table 2. The set of pitch symbols
Symbol Pitch
interval Symbol Pitch interval Symbol Pitch interval Symbol Pitch interval A 0 B 2 C 4 D 5
E 7 F 9 G 11 H Other
a 1 b 3 d 6 e 8
f 10 + Up - Down
Fig. 3. The melodic sequence of an example
2.2 Generation of Significant Repeating Patterns
Based on the above representations, a repeating pattern means a consecutive sequence that appears frequently in the rhythmic or melodic sequence of a music piece. Hsu, Liu, and Chen [9] propose an algorithm for finding repeating patterns from a music
piece. In this paper, we adapt this algorithm to the needs of music classification by considering the following constraints:
Maximum length: Long sequences tend to contain duplicate information. Therefore,
the maximum constraint on the sequence length will reduce duplicate information and the extra costs for pattern discovery.
Minimum length: Short sequences often have little information about the music and
therefore its classification. The minimum constraint on the sequence length will alle-viate the unnecessary loads due to a large amount of short sequences.
Minimum frequency: The frequency of a sequence stands for the number of its
oc-currences in the music. The more frequency a sequence has in the music, the more representative it will be. And the minimum constraint on frequency will diminish unimportant sequences to make the discovered patterns more significant.
3 SRP-based Classification
3.1 Usefulness of SRP for ClassificationAfter feature extraction, we have already generated a set of SRP’s with their frequen-cies in each music piece. Let Fx,m denote the frequency of the SRP x for the music
piece m. Due to the various lengths of different music, the SRP with a high frequency in one music piece is not necessarily more important than the one with a low fre-quency in the other. To cope with such a discrepancy, we divide the frefre-quency Fx,m by the sum of frequencies for each SRP contained in m to compute the importance of x with respect to m, which is called the support and denoted by Sup(x,m). Moreover, for SRP x in class C, we sum up its support in every music piece belonging to C to compute its importance with respect to C, which is called the aggregate support and denoted by ASup(x,C). The following formulas are provided for these computations, respectively.
( )
∑
∈ ∀ = m SRP m SRP m x F F m x Sup , , , (1)( )
∑
∈ ∀ = C music music x Sup C x ASup , ( , ) (2)Owing to the various numbers of music data in different classes, the SRP with a high aggregate support in one class is no necessarily more important than the one with a low aggregate support in the other. Therefore, we further normalize the aggre-gate support of SRP x in class C to compute the normalized support, denoted by
NSup(x, C), as follows, where Min(C) and Max(C) respectively stand for the
( )
,( )
(,) (())11 + − + − = C Min C Max C Min C x ASup C x NSup (3)Finally, we evaluate the usefulness of each SRP for classification based on its nor-malized supports in different classes. Due to the various distributions of SRP’s over the classes, the SRP with a higher normalized support is not necessarily more impor-tant than the one with a lower normalized support in the same class. Therefore, for each SRP, we first sum up its normalized supports in all classes to get its total
sup-port. After that, we estimate the usefulness of SRP x for classifying music into class
C, which is called the pattern weight and denoted by PW(x, C), via the following formula, where TS(x) means the total support of SRP x.
( )
( )
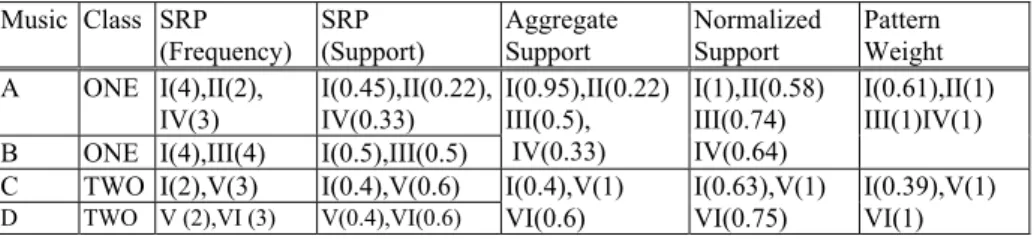
) ( , , x TS C x NSup C x PW = (4) Example 1.In Table 3, we illustrate how to estimate the pattern weight of a SRP step by step. Take SRP I as an example. By formula (1), its supports in music A, B, and C are 0.45, 0.5 and 0.4, respectively. Moreover, by formula (2), its aggregate supports in class ONE and TWO are 0.95 and 0.4, respectively. After applying formulas (3) and (4), its pattern weights for class ONE and TWO are 0.61 and 0.39, respectively. From the pattern weights, it is evident that SRP I is more useful for class ONE than class TWO. In the next section, the pattern weights will be used to estimate the relevance of a source SRP to each class.
Table 3. The SRP’s generated from four music pieces in two classes
Music Class SRP (Frequency) SRP (Support) Aggregate Support Normalized Support Pattern Weight A ONE I(4),II(2), IV(3) I(0.45),II(0.22), IV(0.33)
B ONE I(4),III(4) I(0.5),III(0.5)
I(0.95),II(0.22) III(0.5), IV(0.33) I(1),II(0.58) III(0.74) IV(0.64) I(0.61),II(1) III(1)IV(1) C TWO I(2),V(3) I(0.4),V(0.6)
D TWO V (2),VI (3) V(0.4),VI(0.6)
I(0.4),V(1) VI(0.6) I(0.63),V(1) VI(0.75) I(0.39),V(1) VI(1)
3.2 Similarity Measures for SRP Matching
As described in Section 1, after feature extraction, we have a set of SRP’s derived from the classified music and the source SRP’s derived from the music to be classi-fied. Given a source SRP, we adopt the dynamic programming approach [10] to measure the similarity (i.e. the inverse of edit distance) between it and each SRP in a class to identify the corresponding target SRP. Furthermore, we assign each symbol (i.e. beat symbol or pitch symbol) a numerical value in order that the difference be-tween two distinct symbols can be computed by a simple subtraction. In addition, the value assignment is based on human perception for the changes of rhythm or melody.
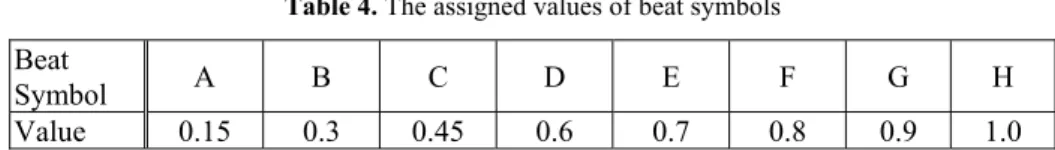
Table 4. The assigned values of beat symbols
Beat
Symbol A B C D E F G H
Value 0.15 0.3 0.45 0.6 0.7 0.8 0.9 1.0 For the rhythmic sequences, we assign each beat symbol in Table 1 a numerical value as Table 4 indicates. According to our observation, the beats of grace note is usually fast, which will not cause a large difference between two similar rhythmic sequences, so the beat symbol with a shorter duration is assigned a smaller value. Moreover, the value assignment makes a larger difference between two beat symbols with shorter durations (e.g. A and B) because human cannot distinguish the difference easily between two longer durations.
For the melodic sequences, we also assign each pitch symbol in Table 2 a numeri-cal value as Table 5 shows. The pitch symbol with a shorter interval is assigned a smaller value because the shorter interval means fewer variables to the sense of hear-ing. Moreover, we assume that human distinguishes long intervals better than short ones, so the value assignment makes a larger difference between two pitch symbols with longer intervals (e.g. G and H). In the musicology, the major intervals and the minor ones tend to bring people different kinds of perception. Therefore, in our ap-proach, different values are assigned to both types of pitch symbols, respectively.
Table 5. The assigned values of pitch symbols
Pitch Symbol A B C D E F G H
Value 0.1 0.2 0.3 0.4 0.55 0.7 0.85 1.0
Pitch Symbol a b d e f
Value 0.25 0.35 0.6 0.75 0.9
The assignments of numerical values can serve the dynamic programming ap-proach as the costs of insertion, deletion and substitution for computing the edit dis-tance, denoted by D(x,y), between two SRP’s x and y. Due to the lack of space, the computation of edit distance is omitted in this paper. Based on the edit distance, the pattern similarity between two SRP’s x and y, denoted by PS(x,y) is computed by the following formula, where α is set to 1 for rhythmic sequences and 0.5 for melodic sequences, and mleng is the maximum constraint on sequence length.
( )
( )
mleng y x D y x PS , =1−α∗ , (5)The above formula will keep the value of PS(x,y) in the range between 0 and 1. Moreover, the value of PS(x,y) is larger when the value of D(x,y) is smaller. In this way, given a source SRP, we choose the SRP with the maximal value of pattern simi-larity as the target SRP for each class. If more than one SRP has the maximal value, we choose the one with the maximal value of pattern weight or the longest one. Fur-thermore, when the maximal value of pattern similarity in a class is smaller than the predefined similarity threshold, there will be no target SRP in that class. In this way, the source SRP that is not similar to any SRP in a class will have no impact on the determination of that class. Finally, we estimate how a source SRP x is relevant to a
class C by the following formula, which result is named the evidence and denoted by E(x,C).
( )
x,C PS( )
x,y PW( )
y,C, wherey is the target SRPof x in CE = ∗ (6)
Example 2.
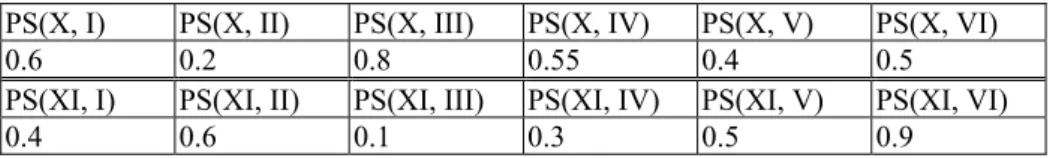
Consider Table 3 as an example. Assume that the music to be classified contains two source SRP’s X and XI. The values of pattern similarities are computed by formula (5) and shown in Table 6. For SRP X, the target SRP for class ONE is SRP III because of the maximal value of pattern similarity. Similarly, SRP I is the target SRP for class TWO. Finally, we compute E(X,ONE) and E(X,TWO) by formula (6) and obtain the values of evidence 0.8 and 0.234, respectively. For SRP XI, the target SRP’s for class ONE and TWO are II and VI, respectively.
Table 6. The values of pattern similarities (similarity threshold=0.45)
PS(X, I) PS(X, II) PS(X, III) PS(X, IV) PS(X, V) PS(X, VI) 0.6 0.2 0.8 0.55 0.4 0.5 PS(XI, I) PS(XI, II) PS(XI, III) PS(XI, IV) PS(XI, V) PS(XI, VI) 0.4 0.6 0.1 0.3 0.5 0.9
3.3 Class Determination
In the previous section, we have obtained the evidence of each source SRP, indicating how it is relevant to a class. On the other hand, for the music to be classified, we also apply formulas (1) to compute the support of each source SRP. Moreover, we treat it as a class that contains only one music piece and therefore the aggregate support is equal to its support. In this way, we can employ formula (3) to compute the normal-ized support of each source SRP.
As a result, each source SRP is associated with two kinds of information. The evi-dence indicates its relevance to a class, while the normalized support means its impor-tance with respect to the music to be classified. Therefore, we combine them to esti-mate the possibility that music m belongs to class C, which is called the classification
score and denoted by CS(C|m).
(
)
∑
(
)
(
)
∈ ∀ ∗ = m SRP m SRP NSup C SRP E m C CS | , , (7)For the music to be classified, we compute a classification score for each class by the above formula. Finally, the music will be assigned to the class with the highest score.
Example 3.
Following Example 2, let the frequencies of the two source SRP’s X and XI be 4 and 2, respectively. From Table 3, we can calculate the evidences and the normalized supports as shown in Table 7. By formula (7), we can compute the classification score of each class and choose the one with the highest score (i.e. class ONE in this example) as a result.
Table 7. An example of class determination
Class Source SRP
(Fre-quency) Target SRP E(x,C) NSup(x,m) CS(C|m)
ONE X(4) III 0.8 1
ONE XI(2) II 0.6 0.75 1.25
TWO X(4) I 0.234 1
TWO XI(2) VI 0.9 0.75 0.909
4 Experiment Results
To evaluate the performance of our approach, we make a series of experiments to analyze the impacts of different features and thresholds. In addition, we also compare our approach with the one proposed by Chai and Vercoe [4]. In our experiments, we consider seven classes of music, including Blue, Country, Dance, Jazz, Latin, Pop, and Rock music. Furthermore, we select five hundred pieces of music from The New
Zealand Digital Library [17] and then manually classify them based on the expertise
collected from the World Wide Web. Each piece of music only belongs to one class. From these music, we select four fifth of them to derive the SRP’s for training and utilize the others for testing. The precision and recall are computed as the averages of five different tests. The definitions of precision and recall are given as follows, where Nc is the number of correctly classified data, Nt is the number of testing data, and Nd is the minimum number of testing data that are required to make Nc data classified correctly. d c t c N N Recall , N N Precision= = 4.1 Impacts of Features 0 10 20 30 40 50 60 70 80
BLUE COUNTRY DANCE JAZZ LATIN POP ROCK
CLASS P R E C IS IO N (% ) MELODY RHYT HM
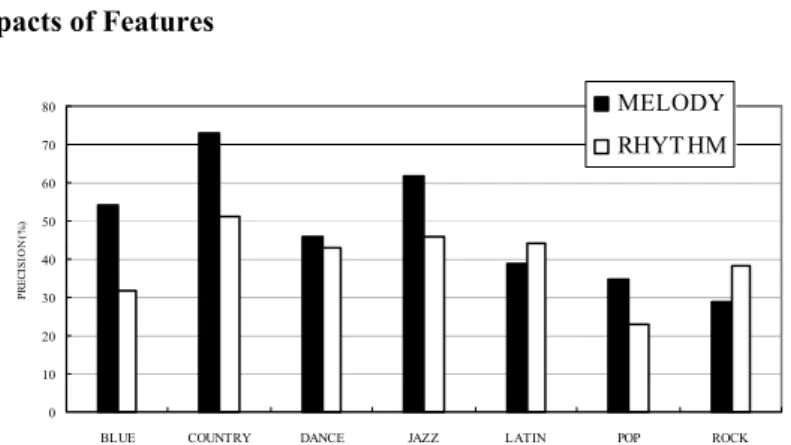
In this experiment, we examine the influence of features on the precision of our ap-proach with respect to the individual classes. According to the previous trials, we set the minimum constraint on frequency to 3 for rhythm and 2 for melody, and the con-straints on sequence length from 4 to 16. The experimental results are shown in Fig-ure 4, where three classes “COUNTRY”,”JAZZ”, and ”BLUE” have the best preci-sion (over 50%) for melody. The reason is because music in these classes often con-tains particular melodies. On the other hand, only two classes “ROCK” and “LATIN” have better precision for rhythm than for melody. The reason is because music in these classes often impresses people a strong sense of rhythm. The class “POP” has the worst precision for rhythm because it includes various kinds of music with differ-ent tempos.
4.2 Impacts of Similarity Threshold
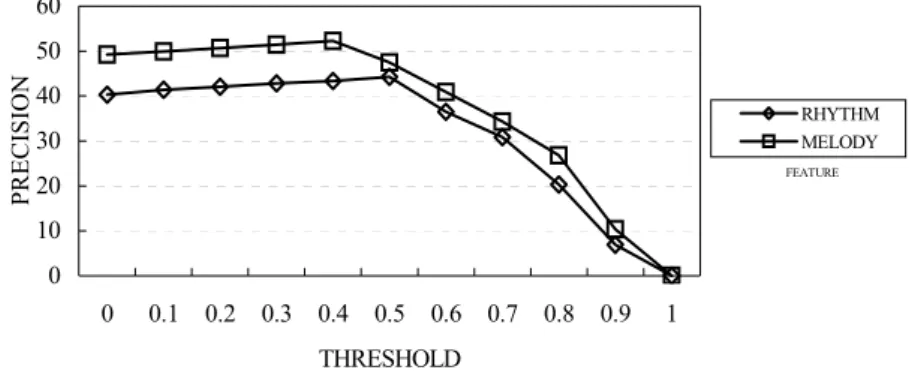
In this experiment, we set up different thresholds on pattern similarity for identifying the target SRP of each class. As shown in Figure 5, we have the best precision when the similarity threshold is set to 0.4 for melody and 0.5 for rhythm. The reason is because the best set of target SRP’s are selected under these cases. When the similar-ity threshold gets higher, fewer SRP’s can be chosen and it is not helpful for classifi-cation. The extreme case occurs when the similarity threshold is set to 1, where no target SRP is selected and the precision becomes 0.
FEATURE 0 10 20 30 40 50 60 0 0.1 0.2 0.3 0.4 0.5 0.6 0.7 0.8 0.9 1 THRESHOLD PRECISION RHYTHM MELODY
Fig. 5. Impacts of similarity threshold
4.3 Comparison with the HMM-based Approach
In this experiment, we compare our approach with the one proposed by Chai and Vercoe [4]. We adopt the pitch interval as the feature and implement the 6-state left-to-right HMM for seven classes based on their approach. The settings of our approach are the same as the previous experiments. As Figure 6 shows, our approaches based on either melody or rhythm perform on the average precision better than the HMM-based approach. The reason is because the HMM-HMM-based approach can succeed only when all the contextual information in music is useful to determine the music style. In general music, such a condition may not be satisfied.
SRP (melody) SRP (rhythm) HMM
Precision (%) 49.18 40.24 33.70
Fig. 6. The comparisons on the average precision
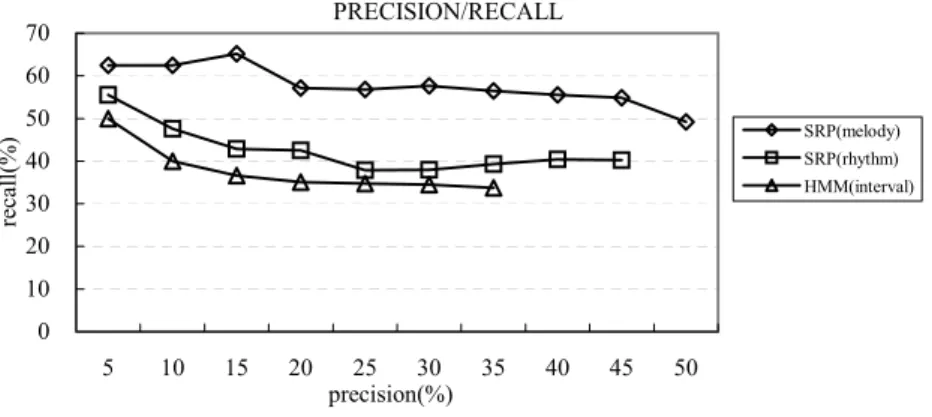
In Figure 7, the diagram of precision and recall is presented. It indicates that our approach based on melody is the best, while the HMM-based approach is the worst. Note that there is no experimental result of SRP(rhythm) when precision is 50% in Figure 7, because the classification by this feature can not generate 50% precision when all the test data are used. The fewer experimental results of HMM-based ap-proach than the ones of the SRP(melody) in Figure 7 bases on the same reason.
PRECISION/RECALL 0 10 20 30 40 50 60 70 5 10 15 20 25 30 35 40 45 50 precision(%) recall(%) SRP(melody) SRP(rhythm) HMM(interval)
Fig. 7. The diagram of precision and recall
5 Conclusion
In this paper, we propose a novel method for classifying music data by contents. We respectively extract rhythm and melody from music data and adapt the methods of finding repeating patterns to the needs of music classification. Given a music piece, we present a scheme for generating significant repeating patterns. A way to estimate the usefulness of SRP for classification is also proposed. For the music to be classi-fied, we incorporate human perception and musicology into the similarity measures for SRP matching. Finally, we provide a complete procedure for determining which class a music piece should be assigned to. The experiment results indicate that some classes achieve better precision for a particular feature. Moreover, our approach per-forms on average better than the HMM-based approach.
In the current implementation, we manually select the representative track from each MIDI file. To provide an automatic way of track selection is necessary. The determination of music class can be equipped with more facilities from musicology. In addition to the repeating patterns, other kinds of patterns, such as the sequential patterns defined in the field of data mining[1][12] may also be useful in music classi-fication. We are currently working on it and aim for a method that combines the vari-ous types of patterns to achieve better accuracy of classification.
6 Acknowledgements
This work was partially supported by the MOE Program for Promoting Academic Excellence of Universities under the grant number 89-E-FA04-1-4, and the NSC under the contract number 92-2213-E-007-094.
References
[1] R. Agrawal and R. Srikant, “Mining Sequential Patterns,” Proceedings of IEEE Confer-ence on Data Engineering, pp: 3-14, 1995.
[2] C. Anagnostopoulou and G. Westermann, “Classification in Music: A Computational Model for Paradigmatic Analysis,” Proceedings of the International Computer Music Conference, 1997.
[3] J. J. Aucouturier and F. Pachet, “Music Similarity Measures: What’s the Use?” Proceed-ings of International Symposium on Music Information Retrieval, 2002.
[4] W. Chai and B. Vercoe, “Folk Music Classification Using Hidden Markov Models,” Proceedings of International Conference on Artificial Intelligence, 2001.
[5] C. C. Chen and Arbee L.P. Chen, “Query by Rhythm: An Approach for Song Retrieval in Music Database,” Proceedings of IEEE Workshop on Research Issues in Data Engi-neering, pp: 139-146, 1998.
[6] R. B. Dannenberg, B. Thom, and D. Watson, “A Machine Learning Approach to Musi-cal Style Recognition,” Proceedings of International Computer Music Conference, 1997. [7] S. Downie and M. Nelson, “Evaluation of a Simple and Effective Music Information
Retrieval Method,” Proceedings of ACM SIGIR Conference, pp: 73-80, 2000.
[8] A. Ghias, H. Logan, D. Chamberlin, and B.C. Smith, “Query by Humming: Music In-formation Retrieval in an Audio Database,” Proceedings of ACM Conference on Multi-media, pp: 231-236, 1995.
[9] J. L. Hsu, C. C. Liu, and Arbee L.P. Chen, “Discovering Nontrivial Repeating Patterns in Music Data,” Proceedings of IEEE Transactions on Multimedia, pp: 311-325, 2001. [10] S. Moshe, Dynamic Programming, Marcel Dekker Inc., 1992.
[11] J. Paulus and A. Klapuri, “Measuring the Similarity of Rhythmic Patterns,” Proceedings of International Symposium on Music Information Retrieval, 2002.
[12] J. Pei, J. W. Han, B. Mortazavi-Asi, and H. Pinto, “PrefixSpan: Mining Sequential Pat-terns Efficiently by Prefix-Projected Pattern Growth,” Proceedings of IEEE Conference on Data Engineering, 2001.
[13] D. Pogue and S. Speck, Classical Music for Dummies, IDG books worldwide Inc., 1999. [14] G. Tzanetakis, A. Ermolinskyi, and P. Cook, “Pitch Histograms in Audio and Symbolic
Music Information Retrieval,” Proceedings of International Symposium on Music In-formation Retrieval, 2002.
[15] G. Tzanetakis, G. Essl, and P. Cook, “Automatic Musical Genre Classification Of Audio Signals,” Proceedings of International Symposium on Music Information Retrieval, 2001.
[16] B. Whitman and P. Smaragdis, “Combining Musical and Cultural Features for Intelligent Style Detection,” Proceedings of International Symposium on Music Information Re-trieval, 2002.
[17] I. Witten (project leader) et al., “The New Zealand Digital Library Project,” http://nzdl2.cs.waikato.ac.nz/, University of Waikato, New Zealand, April 2000.