國立交通大學
工業工程與管理學系
碩士論文
混合式啟發式解法求解多產品裝瓶產線批量與
排序問題 – 以巴拿馬啤酒公司為例
A hybrid-heuristic solution approach for the Lot size and
Sequencing Problem of Multi-Product Bottling Lines
A Case Study of Panama Beer Company
研 究 生:葉若雅
Student: Patricia A. Escobar W.
指導教授:姚銘忠
博士
巫木誠
博士
A hybrid-heuristic solution approach for the Lot size and Sequencing Problem of
Multi-Product Bottling Lines
A Case Study of Panama Beer Company
研 究 生: 葉若雅
Student: Patricia A. Escobar W.指導教授:姚銘忠 博士
Advisors: Dr. Ming-Jong Yao巫木誠 博士
Dr. Muh-Cherng Wu國 立 交 通 大 學 工 業 工 程 與 管 理 學 系
碩 士 論 文
A Thesis
Submitted to Department of Industrial Engineering and Management College of Management
in Partial Fulfillment of the Requirements for the Degree
Master of Science in
Industrial Engineering and Management
Hsinchu, Taiwan, Republic of China July 2014
i
混合式啟發式解法求解多產品裝瓶產線批量與排序問題
– 以巴拿馬啤酒公司為例
研 究 生: 葉若雅
Student: Patricia A. Escobar W.指導教授: 姚銘忠 博士
Advisors: Dr. Ming-Jong Yao
巫木誠 博士
Dr. Muh-Cherng Wu
國立交通大學
工業工程與管理研究所
摘要
本研究旨在協助巴拿馬啤酒公司之生產計畫者,於多產品裝瓶生產線之批量與排程。 本研究建立一個混合整數規劃模型其符合個案公司決策分析之情境,問題旨在決定各 生產計畫期間內,各產品批量與三條裝瓶生產線上之生產順序,以最小化生產計畫期 間內之總成本(包含生產,存貨,整備之成本),且能滿足各產品的需求。本研究考量 該公司裝瓶生產線特性之相關因素如:生產速率限制、產能、整備時間與存貨策略。 本研究提倡運用混合式啟發式演算法(又稱為 GA-LP 法)其 結合基因演算法(Genetic algorithm)及線性規劃(Linear programming),基因演算法是著眼於解決排序問題,而線 性規劃則是處理批量決策。本研究運用該公司二十週的實際數據,比較 GA-LP 法與該 公司原先的生產規劃進行效益評比, 結果顯示不僅可以在更短的時間完成生產規劃, 且可降低總成本達 21%;故本研究提出之 GA-LP 法,可以作為多產品裝瓶生產系統之 生產規劃者在批量與排程有效的決策輔助工具。 關鍵字:啤酒工業,批量,排程,混合整數規劃,基因演算法ii
A hybrid-heuristic solution approach for the Lot size and Sequencing Problem of
Multi-Product Bottling Lines
A Case Study of Panama Beer Company
研 究 生:葉若雅
Student: Patricia A. Escobar W指導教授:
姚銘忠 博士
Advisors: Dr. Ming-Jong Yao;巫木誠 博士
Dr. Muh-Cherng Wu國立交通大學
工業工程與管理研究所
Abstract
摘要
This study was motivated to support the production planners in the lot sizing and sequencing of multiple products on the packaging lines of the Panama Beer Company. We formulate a mixed integer programming model that matches with the decision-making scenarios in the company. The problem aims at the determination of the lot size of each product, and the sequence of production in the three packaging lines for each period, so as to minimize the total costs (including the production, inventory and setup costs) in the planning horizon, while meeting the demand of each product. We took into account the limitations on the production rate, capacity, setup times, and inventory policies to fit the characteristics of the packaging lines in the Panama Beer Company. In order to solve the problem, we propose a hybrid-heuristic (called GA-LP) that combines Genetic Algorithm (GA) and Linear Programming (LP) in which GA is used to solve the sequencing problem, and LP aims to solve the lot sizing problem. We evaluated the effectiveness of the proposed hybrid-heuristic by comparing the obtained solutions with the historical production plans. We conduct our experiments with the real-world data for a planning period of twenty weeks, and our results showed that the proposed GA-LP approach not only solved the production plan efficiently in a much shorter run time, but also led to an improvement of 21% in the total cost. Therefore, the proposed GA-LP approach may serve as an effective tool that supports the production planner in the lot sizing and sequencing of bottling production systems.
iii
Acknowledgement
First, I would like to thank God for giving me the opportunity to return to Taiwan for my graduate studies, and for helping me to prove to myself that I can do whatever I want as long as I work hard for it.
Thanks to my family for their unconditional support, for sending their best wishes and affection. Mom, all my achievements will always be devoted to you. To Dr. Ming-Jong Yao for trusting in my capabilities and be a source of knowledge to finish this project successfully; I feel honored for being one of your students.
To Cervecería Nacional, S.A. for gave me the opportunity to base my work in their processes.
To Pablo, thank you for being an essential part of my life these years. Without you this journey would have been much more difficult, you are and will always be one of my main sources of motivation.
To Ivi, thanks for being my pio pio partner, my friend and family in Hsinchu. God always puts people in my path for good reasons.
And to all my friends around the world thanks for always send your best wishes. Thank you dear Taiwan, you've become a huge part of my life story. You will be always in my heart. ¡Hasta Pronto!
iv
Contents
摘要 ...i Abstract ... ii Acknowledgement ... iii List of Figures ... viList of Tables ... vii
1. Introduction ... 1
1.1 Beverage Industry ... 1
1.2 Industrial Setting ... 2
1.3 Panama Beer Company ... 3
1.4 Purpose of Study ... 7
1.5 Thesis Structure ... 8
2. Literature Review ... 9
2.1 Lot Sizing and Scheduling for Packaging Companies ... 9
2.2 Summary ... 17
3. Decision-Making Scenario and Mathematical Model ... 19
3.1 Beer Packaging Process & CSD Packaging Process ... 19
3.2 Decision-Making Scenario ... 23
3.2.1 PBC Characteristics ... 23
3.2.2 Statement of Problem ... 32
3.2.3 Assumptions ... 34
3.3 Mathematical Model ... 35
4. Proposed Solution Approach ... 43
4.1 Overview of Methodology ... 43
4.2 Sub-problem in Genetic Algorithm ... 45
4.3 Implementation of Genetic Algorithm... 48
4.3.1 Representation of Individuals ... 48
4.3.2 Initialization ... 50
4.3.3 Fitness Evaluation and Selection Process ... 51
4.3.4 Genetic Operators ... 52
5. Case Study ... 58
5.1 Data Collection ... 58
v
5.3 Computational Study ... 60
6. Results and Discussions ... 64
6.1 Parameter Setting in Genetic Algorithm ... 65
6.1.1 Number of Generations ... 65
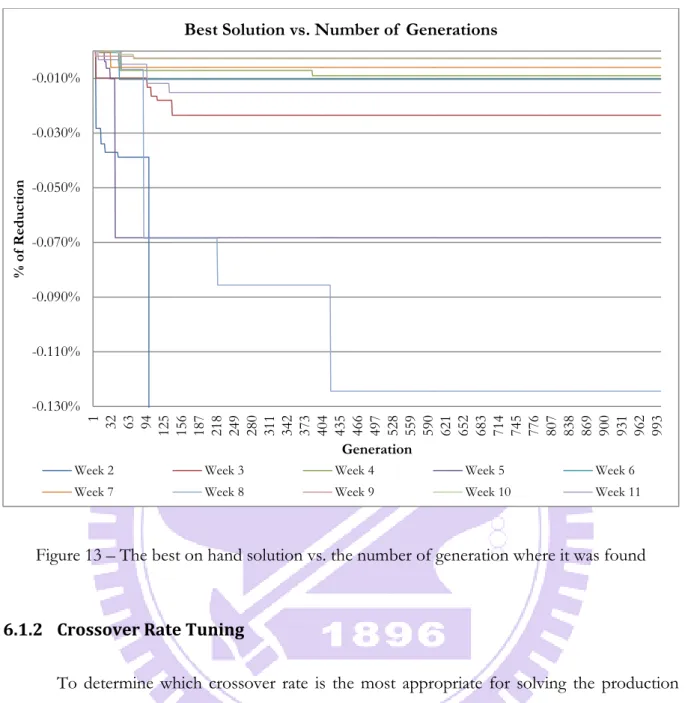
6.1.2 Crossover Rate Tuning ... 66
6.1.3 Mutation Rate Tuning ... 74
6.2 Comparison and Analysis of Results ... 75
6.2.1 Results ... 75
6.2.2 Case with modified parameters ... 81
6.3 T-test ... 84
6.4 Observations and Discussions ... 86
7. Conclusions and Future Works ... 90
7.1 Conclusions ... 90
7.2 Future Works... 92
References ... 94
Appendix ... 96
A. General Description of Brewing Process ... 96
B. Panama Beer Company Planning Process ... 97
C. PBC production cost, idle time cost and changeover cost description ... 98
D. Data Collection Gantt chart ... 99
E. Data of Panama Beer Company for Base Scenario ... 100
F. Solution Approach Flow Chart ... 104
G. Panama Beer Company Total Costs ... 105
H. GA-LP Results ... 106
H.1 Total Costs ... 106
H.2 Percentage of Reduction ... 108
H.3 Product’s demand vs inventory levels ... 109
vi
List of Figures
Figure 1 - Sales of Glass Returnable Bottles ... 6
Figure 2 – Macro-periods vs. micro-periods ... 13
Figure 3 - Individual Representation in Toledo et al.’s (2014) GA ... 15
Figure 4 - Individuals in a population are stored in a binary-tree structure. ... 16
Figure 5 – Beer Packaging Process ... 21
Figure 6 - Carbonated Soft Drinks Packaging Process ... 22
Figure 7 – The flowchart of the proposed Genetic Algorithm. ... 44
Figure 8 – An example of an individual. ... 49
Figure 9 – An example of a population of 2 individuals ... 51
Figure 10 - Parent 1 (top) and Parent 2 (bottom) ... 53
Figure 11 - Child 1 (top) and child 2 (bottom) ... 54
Figure 12 - Original Individual (top) and Mutated individual (bottom) ... 56
Figure 13 – The best on hand solution vs. the number of generation where it was found ... 66
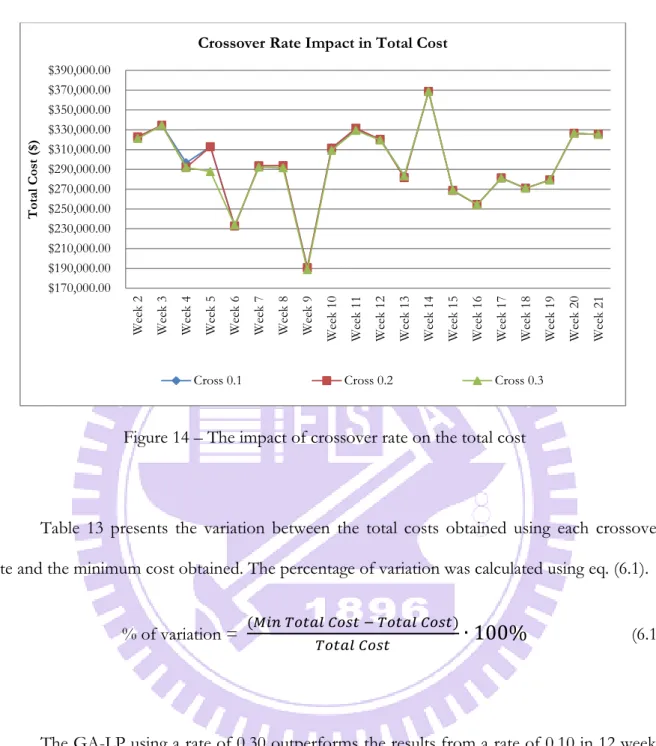
Figure 14 – The impact of crossover rate on the total cost ... 68
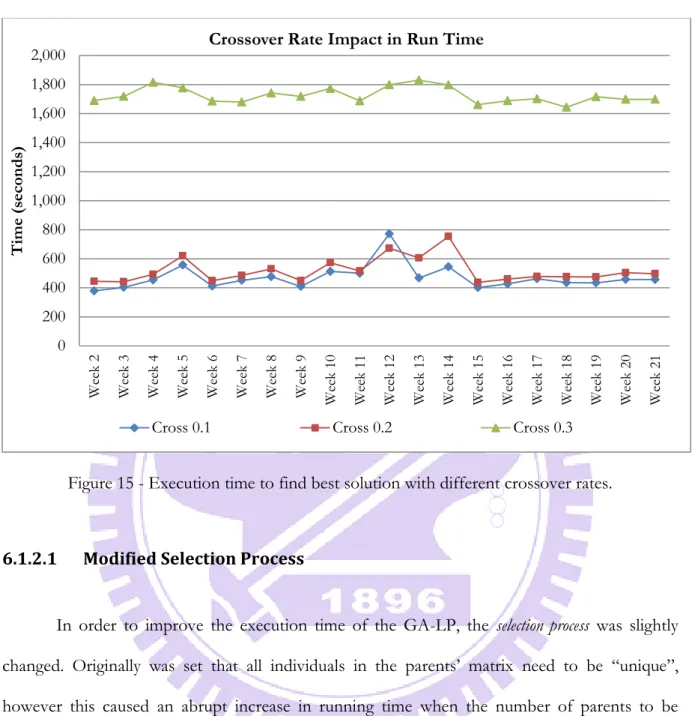
Figure 15 - Execution time to find best solution with different crossover rates... 70
Figure 16 – The impact of crossover rates on the total run time. ... 73
Figure 17 - Total Cost vs. Crossover Rate. ... 73
Figure 18 - Mutation Rate impact in Total Cost per week. ... 74
Figure 19 - Total Cost vs. Mutation Rate. ... 75
Figure 20 – The total cost of the AS-IS approach and the GA-LP approach ... 77
Figure 21 – The run time spent of the GA-LP approach for solving each instance. ... 78
Figure 22 – The comparison of the inventory holding costs ... 79
Figure 23 - The comparison of the idle time costs ... 80
Figure 24 - The comparison of the production costs ... 80
Figure 25 - The comparison of the set up costs ... 81
Figure 26 - The comparison between the AS-IS approach and the GA-LP approach with modified parameters. ... 83
vii
List of Tables
Table 1 - Research done for various type of beverage industry ... 10
Table 2 - List of Products bottled in Returnable Bottles ... 24
Table 3 - Production Lines’ Capabilities ... 25
Table 4 - Current production assignment of beer products. ... 27
Table 5 - Current team assignment sequence for production ... 28
Table 6 - PBC teams Capacity per week (hours) ... 29
Table 7 - Minimum Lot Size defined for every product in every line ... 29
Table 8 - Frequency of production of every item ... 31
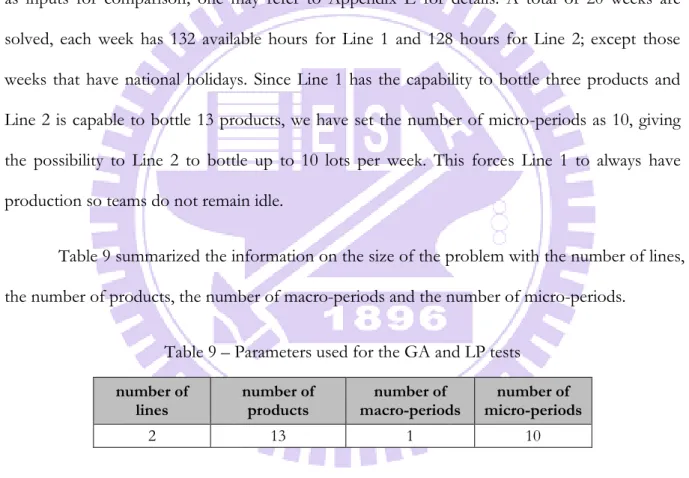
Table 9 – Parameters used for the GA and LP tests ... 64
Table 10 – The numbers of the variables and constraints in our model ... 64
Table 11 – Crossover rates used for Genetic Algorithm and Linear Programming ... 66
Table 12 – The impact of crossover rate (CR) on the total cost. ... 67
Table 13 - Variation between crossover rates. ... 69
Table 14 - Parameters used for GA-LP with modified Selection Process. ... 71
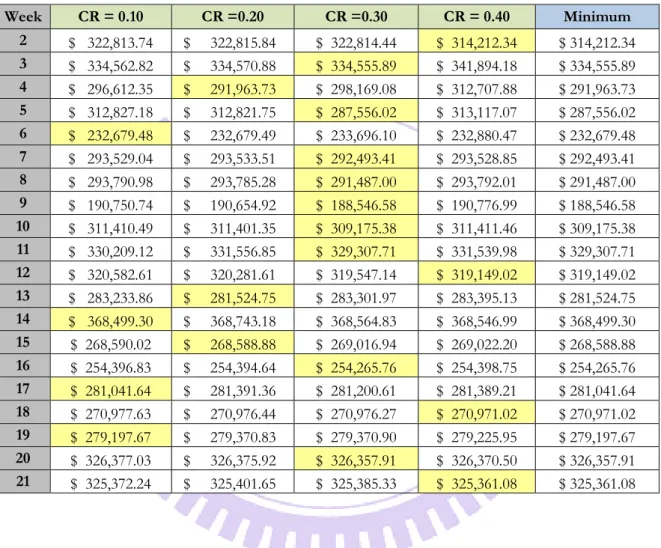
Table 15 – The impact of crossover rate on the total cost. ... 71
Table 16 – The variation between the crossover rates ... 72
Table 17 – The tested mutation rates for tuning ... 74
Table 18 – The cost profile of Panama Beer Company for 20 weeks. ... 76
Table 19 – The best combination of parameters for the GA-LP approach. ... 76
Table 20 – The cost profile for the best solution obtained from the GA-LP approach. ... 78
Table 21 - The results of the AS-IS approach in PBC and the GA-LP approach ... 79
Table 22 – The violation of the Minimum Lot Size and Safety Stock policies... 82
Table 23 – The modified parameters for the Minimum Lot Size policy ... 82
Table 24 – The results of t-test for comparing the GA-LP and AS-IS approaches ... 85
Table 25 – The results of t-test for comparing the GA-LP and AS-IS approaches using modified parameters ... 85
Table 26 – The shortage of products in Weeks 13, 14 and 16 ... 87
1
1. Introduction
1.1 Beverage Industry
The beer and carbonated soft drinks (CSD) industry is one of the biggest industries around the world, and as every other industry, is passing through many evolutions based on consumers’ preferences. In Panama, the carbonated soft drinks industry is dominated by two large producers that own the most recognized brands worldwide. The overall quality of product depends directly on the relationship between the concentrate producer which owns the brand, and its bottlers (Ferreira, Morabito, & Rangel, 2008). In the case of Panama, the factories established in the country are mainly for the bottling and distribution of the final products.
On the other hand, the Panamanian beer industry generates more than US$ 390 million per year, and is also controlled by two major companies. In 2011, the industry present a growth of 5.1% compared to the previous year (Capital Financiero, 2012). These companies have their own brands and also distribute international brands. For those company-owned products, the manufacturing process starts when the malt grain is received, then raw materials pass through all production processes, and finally delivered to the distribution centers.
In such environment of intense competition and changes in customer’s preferences, companies have a big challenge in maintaining the brand strength and keeping market share, and at the same time, to improve their operations.
To improve efficiency of the production system, one of the key factors is to use more efficient production plans. It is necessary to adopt optimization-based programs to generate efficient production plans due to the diversity in the portfolio of products and the constant changes in their demand (Ferreira, Morabito, & Rangel, 2008).
2
1.2 Industrial Setting
This research focuses on a Panamanian beverage manufacturing plant that produces, pack and delivers 13 different stock keeping units (SKUs) in returnable bottles. The manufacturing process starts with the reception of raw material from suppliers. The planning department receives weekly the customer’s orders and demand forecasts for the next 12 months. Based on this information the senior planners generate the production plan for the next two months, weekly production scheduling and material requirement orders. The Company mandates inventory policies that the production system must maintain a specific amount of material and finished products in the warehouses, so as to meet customers’ demand with a high service level.
Once the production plan is done, the brew house, which is one of the major areas of manufacturing process, starts the brewing process that consists in many steps including malting, milling, mashing, lautering, boiling, fermenting, conditioning, and finally the filtering process (Microbrewery, 2008). Appendix A depicts the typical brewing process. Once the beer is filtered it is stored in huge tanks called bright beer tank (BBT) and it is ready to be transferred to the packaging lines. These lines can pack several beers brands in different sizes and containers. All BBT are connected with all packaging lines, this means that production process can be run smoothly with one or more tanks. However, since not every packaging line has the same throughput rates, packing capabilities, production capacity or setup times, it makes the lot sizing and sequencing a complex problem.
Carbonated soft drinks (CSD) are enormously popular beverages consisting primarily of carbonated water, sugar, and flavorings. The production process of CSD may be divided into two major areas: the mixing area and packaging area. The former prepares the concentrate or syrup in tanks of different capacities. Two different liquid flavors cannot be prepared in the same tank at the same time, and by quality standards any tank must be completely empty and sterilized
3
before a new lot can be prepared in that tank. Once ready this syrup is sent to packaging line where is mixed with carbonated water and then bottled in returnable bottles or pet containers. The difference with beer area is that CSD filling lines can receive liquid flavor from only one tank during the production, so generally tanks are prepared in the exact quantity required. However, if another line is going to produce the same flavor, this tank can provide the liquid flavor to it.
The production planning is based on different factors such as, demand, product preparation capacity, packaging lines rates, changeovers, inventory policies, quality constraints, the demand based run strategy, and working hour’s availability. Packaging lines can be treated as single unit because it is a continuous flow and generally its packaging rate is defined by the filling machine, so the highest throughput rate that the line can achieve is equal to the filler rate (Toledo, Franca, & Morabito, 2002). This study solves the lot sizing and sequencing problem in the packaging lines, while meeting the demand of all products.
The production lot sizing and sequencing/scheduling problem has been studied in different industries such as the milk production (Javanmard & Kianehkandi, 2011), plastics compounding plant (Leung, 2009), wine bottling (Berruto, Tortia, & Gay, 2006) or the petroleum industry (Hagem & Torgnes, 2009). These studies reflect that mathematical models are studied and applied to improve their planning processes when facing lot sizing and sequencing problems in the real world.
1.3 Panama Beer Company
Panama Beer Company (PBC), which is a subsidiary of a multinational organization, has been in beer business for over 100 years and currently is the biggest brewery in the country. It
4
manufactures six worldwide recognized brands of soft drinks, three brands of beers, and one brand of malt and water. Additionally, distributes two international beer brands, two milk brands, and juices. Its market share was 68% in the beer segment, 33% in soft drinks segment and 89% in malt segment in 2012 (Cerveceria Nacional S.A., 2012).
PBC has a Vision of being the leaders in the beverage market by having the highest growth potential and profitability brand portfolio, working with the best talent and always being a market-oriented organization. Its Mission is to own and promote the local and international brands preferred by the consumers.
PBC’s manufacturing plant is located in Panama City, and it has an annual capacity of 2,295,412 hectoliters for beer products and of 1,223,722 hectoliters for carbonated soft drinks (CSD). It consists of three critical departments: brewing, packaging and utilities.
Brewing Department consists of a “kitchen” area, fermentation tanks, conditioning tanks and the filtering process. All these areas are managed by Brew House Director, and reports directly to Plant Director.
Utilities Department is in charge of supply indispensable utilities to brew house and packaging lines such as treated water, steam, pressure, electricity, etc. The head of this department is the Utilities Director, who also reports directly to Plant Director.
PBC Packaging Department is the largest beer bottling plant in Panama. This area packs beer products and soft drinks products, in different types of containers such as returnable bottle, cans, kegs and pet. These production lines are under Packaging Director’s supervision. Since this project is focus on Packaging Department the structure of it is briefly described.
It consists of six production lines divided into two areas: beer and CSD. Both areas together have one director, two managers, six shifts’ team leaders and around seventy two
5
operators.
The beer packaging area is formed by four production lines, each having different capabilities. Below is a brief description of each:
Line 1: bottles 2 SKUs from the beer segment and 1 from the malt segment in returnable bottle. This line has the highest throughput rate.
Line 2: bottles 5 SKUs from the beer segment and 1 from the malt segment in returnable bottle. This line has the greatest flexibility for beer packaging.
Line 3: packs 8 SKUs from the beer segment, 17 SKU from the CSD segment and 2 from the malt segment in aluminum cans. This is the only production line for cans.
Line 4: packs 2 SKUs from the beer segment in kegs. This line is operated mainly by hand. It is also the smallest and simplest of the factory.
CSD packaging area consists of two lines:
Line 5: bottles 7 SKUs from the CSD segment in returnable bottle.
Line 6: bottles 33 SKUs from the CSD segment in PET, 3 from the malt segment and 3 from the water segment. Currently this line works at full capacity, 7 days per week, 24 hours per day.
In the last two years sales volume of beer and soft drinks packed in returnable bottles (RB) started to go down; presenting a decrease of 18% in sales in the first quarter of the last fiscal year (April ‘13 ~ July ‘13) compared to the same period of previous year (April ‘12 ~ July ‘12), also referring to Figure 1. Until the end of August 2013, the total demand had been covered using seven full dedicated teams divided between the three RB lines, working together seven shifts per day and six days per week. The change in demand from RB to cans and PET packages resulted in low utilization of the three RB lines, causing an increment of idle time in lines and
6
personnel.
Figure 1 - Sales of Glass Returnable Bottles (Hl are not shown due to confidentiality issues)
Plant managers decided to make a radical change in the production plans of the three RB lines and a head count reorganization. Through a capacity vs. demand analysis, PBC estimated that six shifts per day (six days per week) were enough to meet RB products’ demand. Due to reduction in production requirement, managers calculate that six teams and one special team for line cleaning and changeover periods, are capable to cover the changes. With this new scheme some teams are required to work alternately between the lines.
Currently the plant is working with three crews assigned full time to line 1, and three teams working alternately between lines 2 and 5. Planning Department had to re-define the planning parameters and proposed new approaches to schedule production lines. The planners usually employ spreadsheet-based tools (e.g., MS-Excel) to generate production plans with mostly manual adjustments from their subjective judgment. So, following their intuition and experience, they have decided that Line 1 will bottle all demand requirements of three SKUs from beer and malt segment, and Line 2 will fulfil the other three SKUs from beer segment. In
200,000 400,000 600,000 800,000 1,000,000 1,200,000 1,400,000 1,600,000 F10 F11 F12 F13 F14 H e cto lite rs (H l)
Sales of Glass Returnable Bottles (HL)
CSD Malt Beer
18% reduction YTD Jul F14
7
Appendix B shows a flow diagram indicating the information flow of the detailed scheduling planning process currently used in PBC.
This thesis is mainly concerned about the lot sizing and production scheduling encountered in PBC’s packaging lines for returnable bottles. These are Line 1, Line 2 and Line 5, which are in charge of bottled 13 different SKUs. For practical purposes, we name Line 5 as named Line 3 for our following presentation.
1.4 Purpose of Study
Generally, beverage plants have several lines that pack different products, in different containers, at different rates and with different capacities. Due to variety in products portfolio, managers pursue for the highest possible flexibility to meet market preferences, with the highest possible customer service level and the minimal associated costs. PBC has stated that the objective of their weekly production scheduling is to minimize the production costs, inventory holding costs, idle time costs and setups costs incurred.
However, the planners made their decision usually relying on subjective opinions from their experience and spreadsheet-based tools rather than an integrated and systematic approach/software. This practice is not the ideal way to solve planning problems, especially in the presence of strong fluctuations of demand between seasons (Christou, Lagodimos, & Lycopoulou, 2007). Also, the planners need to assign teams between Lines 2 and 3 since the labor capacity (i.e., the number of headcounts) was reduced due to the re-organization. The planners usually derived production plans for different packaging lines separately and conducted team assignment with subjective judgment. Obviously, there exists significant room for improving the efficiency of production plans in PBC.
8
Therefore, this study is motivated to propose a mathematical model and an effective solution approach for solving the (weekly) production planning and scheduling problem for PBC’s packaging lines. The proposed model shall take into account the constraints from production capacity and inventory policies, as well as the issue of team assignment between Lines 2 and 3. We also use the historical data from PBC to develop our case study, in which we will evaluate the effectiveness of our solution approach by comparing the obtained solution with the historical production plans.
We hope that the proposed solution approach will assist the planners in the optimal the optimization of scheduling and lot size decisions with a shorter planning process time. Also, the proposed solution approach shall allow the planners to conduct sensitivity analysis by simulating different scenarios (demand changes, capacity limitations, etc.) and evaluating impact from different inputs/parameters.
1.5 Thesis Structure
The rest of the thesis is organized as follows: Chapter 2 presents literature review; Chapter 3 describes the decision-making scenario, the assumptions and the proposed mathematical model; Chapter 4 introduces the proposed solution approach; Chapter 5 presents our case study, which is based on PBC’s real and historical data. We have further discussion on the results from the case study in Chapter 6. Chapter 7 addresses our conclusions and the directions for future works.
9
2. Literature Review
2.1 Lot Sizing and Scheduling for Packaging Companies
The aim of production planning is to generate a plan based on demand forecasts, that include the products that need to be produced, the inventory levels that need to be met, and the resources available to complete all tasks for a specific planning horizon (for several days, weeks or months). For operational level, Planning Department delivers a production schedule that is detailed by hours, shifts or days, and shows which product need to be produced, in which machines and its sequence (Krajewski, Ritzman, & Malhotra, 2010).
In this study, we are interested in solving the lot sizing, machine assignment and sequencing/scheduling problem in bottling production system in beverage industry. Many studies have been developed by considering similar scenarios, in which some are focus on only one decision, and others propose models and algorithms to solve simultaneously two or more decisions. Table 1 summarizes the reviewed studies in the literature.
Learning from the literature, one may know that the production system of each industry has its own characteristics (including the operational restrictions, the implementation of production processes, and the special feature of facilities), and the constraints accommodating the characteristics must be included to ensure feasibility of the production plan/schedule obtained from the mathematical model. Christou et al. (2007) derived a model for solving the production planning problem for a multi-product production system with packaging lines for juice industry. Their approach was done by decomposing the production planning problem in a hierarchical way. They divided it in 3 levels, the first one is an aggregate planning taking in consideration monthly schedule, the second level is weekly production planning, and the third
10
one is the daily production planning. In this paper, the attention is focus on the first level of the problem, which they called multi-commodity aggregate production planning (MCAP). The constraints considered in this model are capacity constraints and product expiration date. However, the authors made strong assumptions such as, all production lines have the same throughput rate for any type of product.
Table 1 - Research done for various type of beverage industry
Paper Year Product
Topic Covered Lot
Sizing Scheduling
1
Proposta de um Modelo conjunto de Programacao e Dimensionamento de Lotes
Aplicado a uma Industria de Bebidas. Toledo, C.F.M., Franca, P.M, Morabito, R.
2002 Drinks Soft X X
2 Wine Bottling Scheduling Optimization Berruto, R., Tortia, C., Gay, P. 2006 Wine X
3
Hierarchical Production planning for multi-product lines in the beverage industry.
Christou, I.T., Lagodimos, A.G., Lycopoulous, D.
2007 Bottled drinks
Juices X
4
Solution Approaches for the Soft-Drink integrated production lot sizing and
scheduling problem.
Ferreira, D., Morabito, R., Rangel S.
2008 Drinks Soft X X
5
Optimum Production Scheduling for a Beverage Firm Based in Accra. Amponsah, S.K., Ofosu, J.B.,
Opoku-Sarkodie, R.
2011 Beverage X
6 Line Based on Mixed Integer Programming Optimal Scheduling in a Milk Production Javanmard, H., Kianehkandi.
2011 Milk X X
7
A genetic algorithm/mathematical programming approach to solve a two-level
soft drink production problem. Toledo, C.F.M
11
Berruto et al. (2006) studied the scheduling optimization problem for a wine bottling company in Italy. They considered the scheduling process divided in two decisions; first one is to decide the lot sizes per week of every product and it is done by solving mathematical model. The second one is regarding the sequence of production; this decision is made by bottling manager.. He focused on the first one and considered that the bottling plant has a single machine, with the constraints from warehouse capacity, manpower costs, and others. He used one month as the planning horizon, but divided in 4 weeks.
Amponsah et al. (2011) brought a case study based on a beverage company located in Ghana. For this study, the authors consider a production facility that produces a single product that has a given capacity and covers warehouses demands. The objective function looks for minimizing the production costs while meeting all demands and satisfying production capacity constraints. They point out that the production cost includes the storage cost and the manufacturing cost of the product in their model. The problem is formulated as a balanced transportation problem where the time periods when production takes place is considered as sources and the time periods in which units will be shipped as destinations. The planning horizon in their production is one year, where each period is a month.
Javanmard et al. (2011) formulated a mixed integer linear programming (MILP) model for solving the scheduling and lot sizing problem in a single milk production line of a plant located in Iran. This case is similar to PBC’s case because it includes all typical constraints encountered in the production scheduling such as inventory limitations, machine capacity, and shifts restrictions, but also considers the sequence-dependent setup times and costs. The objective function of their model is to minimize all major sources of variable costs that depend on the production schedule, namely, changeover cost, inventory cost and labor cost. Unfortunately, the authors did not present their mathematical model for the problem in this
12
paper.
Toledo et al. (2002) investigated a problem which is very similar to the one concerned in this thesis. Their paper, written in Portuguese, studies the lot sizing and scheduling problem for a production system with parallel machines that are constrained by their capacity and the setup times and costs being sequence-dependent. They took three Brazilian soft drink companies as reference cases and formulated a model that synchronized decisions between the Preparation Room and Bottling Department. Therefore this is considered as a two-level problem. Both stages are formulated based on (Fleishmann & Meyr, 1997) and (Meyr, 2002) models. The two constraints that connect between Stage 1 and Stage 2 play important roles there. They showed preliminary computational results using GAMS/CPLEX solver, however pointing out that the solver could be inefficient in finding optimal solution via or unable to solve in short time period if the number of items and/or periods increase. Their study has been extended by various researchers. Kimms et al. (2005) presented an extension of Toledo et al.’s (2002) model to solve the same problem using the same software, however concluded that they still have difficulties in obtaining good solutions for large-size instances. Ferreira et al. (2008) proposed a model similar to the one presented by Toledo et al. (2002). They presented two strategies for solving the problem, namely, a relaxation approach and a relax-and-fix heuristic with the assistance of CPLEX solver.
All models presented by these authors are based on the General Lotsizing and Scheduling
Problem (GLSP) proposed in (Fleishmann & Meyr, 1997) for single machine and its extension for
parallel machines presented by Meyr (2002).
Fleishmann et al. (1997) formulated a mixed integer programming model (MIP) that addressed to the integration of the lot-sizing and scheduling decisions in production planning subject to capacity constraints. The demand is deterministic and given over a finite time planning
13
horizon. This model is to minimize inventory holding and sequence-dependent setup costs with all demand being met without backlogging.
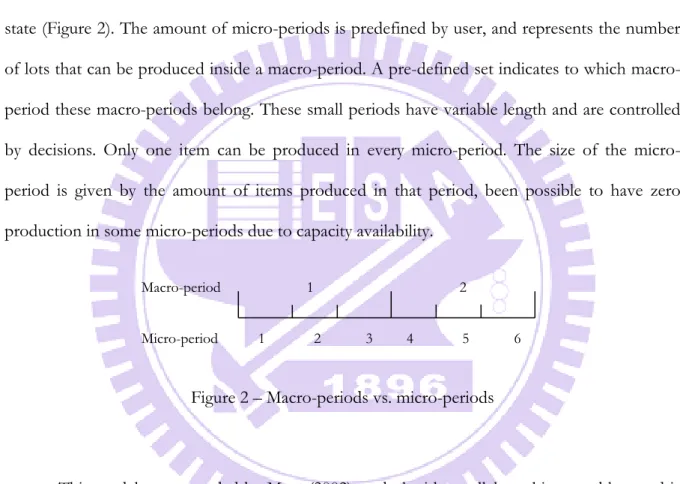
Fleishmann (1997) proposed a two-level planning framework, where the planning horizon is divided in macro-periods, which in turn are further divided into micro-periods. Macro-periods are fixed time duration defined by users. Demand and holding costs are given in these periods. Micro-periods are within the macro-periods, and define the changes of the system state (Figure 2). The amount of micro-periods is predefined by user, and represents the number of lots that can be produced inside a period. A pre-defined set indicates to which macro-period these macro-macro-periods belong. These small macro-periods have variable length and are controlled by decisions. Only one item can be produced in every period. The size of the micro-period is given by the amount of items produced in that micro-period, been possible to have zero production in some micro-periods due to capacity availability.
Figure 2 – Macro-periods vs. micro-periods
This model was extended by Meyr (2002) to deal with parallel machines problem and is called General Lotsizing and Scheduling Problem for Parallel Production Lines (GLSPPL). The formulation presents that the limited capacity of the production lines may be further reduced by sequence-dependent setup times. For example, if there is a case where one macro-period is composed by three micro-periods, in the first micro-period can be produced a lot with 500 units and in the second 200 units. The setup time between lots also needs to be considered and it depends on the product needed to make the changeover. The sum of production times of all lots
Macro-period Micro-period
1 2
14
and the setup times must be less than total capacity of the respective macro-period.
Toledo et al. (2002) developed their model by adding two constraints that connect first stage (syrup room) with the second stage (packaging), however the formulations of both stages are almost the same as Meyr’s (2002), but including some adjustments to fit their problem definition. Ferreira et al. (2008) also made some changes to the model based on their solution approach; their objective function only considered inventory holding costs and setup costs. We note that the work in this thesis is based on Meyr’s (2002) idea, and section 3.3 presents further discussion on the mathematical formulation of the proposed model.
One can find plenty of literature about the application of Genetic Algorithm (GA) for solving the lot-sizing and scheduling problems. GA is a very popular search methodology inspired by biological evolution process (Sivanandam & Deepa, 2008). Boukef et al. (2007) presented a particular data structure (i.e., a kind of encoding) to solve flow-shop scheduling problems for the agro-food and pharmaceutical industries. Their solution approach aimed to minimize total costs related to each specific industry, such as manufacturing costs, delays costs, expired products’ costs, or distribution discount costs. They employed a multi-objective optimization solution approach to deal with many criteria at the same time. Their individual representation contains information about the number of machines, the beginning time of production, the ending time of production and the product to be manufactured. They conclude that GA has a good capacity to find global optimal solution. Sikora (1996) presented an approach to solve lot-sizing and scheduling with sequence-dependent setup times. The individual representation is a string of paired values; one is the type of product and the other lot size for each (basic planning) period. He claimed to obtain better results compared to other heuristics.
Recently, Toledo et al. (2014) published a recent paper, in which the framework of their solution approach is similar to the one proposed in this thesis. They used C++ for the coding
15
their genetic algorithm in which they called a solver in CPLEX library for solving a Linear Programming (LP) problem for the evaluation of individuals. Their approach is similar to ours in two aspects: (1) using GA to take care of the optimization of the sequencing of production lots for multiple products and (2) employing a LP solver for solving the lot sizing problem. However, the way of modeling and the implementation of the solution approach in Toledo et al. (2014) is considerably different from ours presented in this paper. First, they significantly simplified the LP model by eliminating the micro-periods. They re-defined the LP model using the following outlines:
The objective function only considers inventory holding and stock out costs.
They eliminate first-stage (syrup room) constraints.
The constraints that deal with sequencing decisions are eliminated.
The number of variables that represent lot size decision is reduced, by replacing it with a variable that represents the total lot size of product to be produced in one macro-period. If the GA defines one product to be produced twice or more in the same macro-period, the final lot size is divided evenly among the number of occurrences.
Also, Toledo et al. (2014) designed their GA according to their new encodings for the solutions. Every individual is represented by 2-D matrix M x T, where M represents the number of machines and T the number of periods. Each matrix entry (gene) contains a possible production sequence. Figure 3 illustrates an example where M and T equals 2.
16
Once a sequence is given, the setup costs and setup time’s information can be obtained. With the sequence and setup information they generate a LP problem by decoding two categories of input parameters: the number of times a product is produced in one period and the total time spent for changeovers. The LP model is formulated for the decision-making only in the packaging stage, but based on the sequence of tanks preparation in the syrup room.
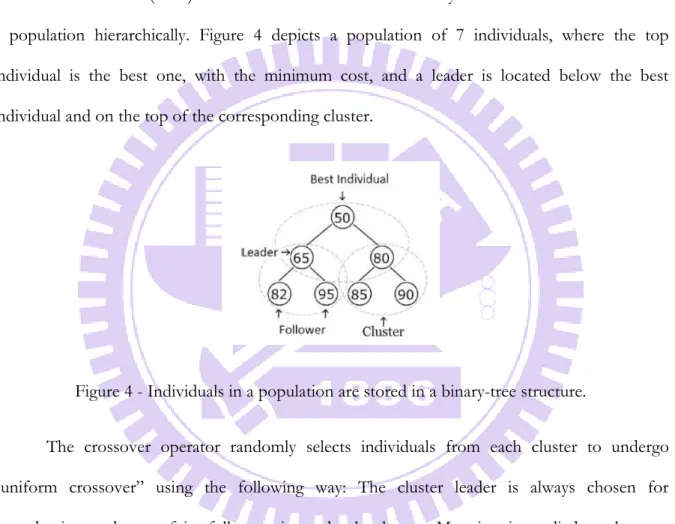
Toledo et al.’s (2014) GA used the data structure of binary tree to store the individuals in a population hierarchically. Figure 4 depicts a population of 7 individuals, where the top individual is the best one, with the minimum cost, and a leader is located below the best individual and on the top of the corresponding cluster.
Figure 4 - Individuals in a population are stored in a binary-tree structure.
The crossover operator randomly selects individuals from each cluster to undergo “uniform crossover” using the following way: The cluster leader is always chosen for reproduction and one of its followers is randomly chosen. Mutation is applied to the new children according to some mutation rate. They used seven different mutations operators, where the one to be executed is randomly chosen at every iteration. Replacement takes place as the fitness of a child is better than the fitness of its parents. Also they execute a repair algorithm to arrange the new tree. Toledo et al.’s (2014) GA set the total time elapsed (at one hour in their study) as the stopping criterion. They made comparisons with the other two solution approaches proposed by them previously, and the new approach gained improvement in total cost and
17
computational performance in most cases.
2.2 Summary
Following the review in section 2.1, we recommend Meyr’s (2002) should be one of the most classical models since it catches well the characteristics of the production systems in consumer goods industries. Because it considers several production lines that partially offer same services, they can be used alternatively. The objective function considers inventory holding costs, production costs and setup costs. The production capacity is limited, and the setup times and costs are sequence-dependent. Since the scenario described above is similar to the one in Panama Beer Company problem, we decided to formulate our mathematical model in this thesis base on their GLSPPL model.
Note that the formulation of our model will be adjusted to fit the special characteristics and limitations in PBC’s case. First, one of the key differences shows in the objective function since the production cost and setup costs are defined differently and, and the cost for idle time is included. Also, the issue of capacity-sharing between Lines 2 and 3 need to be taken into accounts, by (virtually) treating Lines 2 and 3 as a single machine being capable of producing all the products assigned to Line 2 and 3. Changeovers between products packed in Line 2 and Line 3 are set as the sum of the amount of hours required to finish production in one line plus the amount of hours required to set up the other line. We also take the average time of breakdowns per period as a parameter to include the idle time due to unexpected failures in our model since theses breakdowns may reduce available capacity of the packaging line. PBC’s regulations mandates minimum production lot size and inventory policies so that inventory level at the end of every period will not drop to zero. In fact, PBC always keeps products at warehouses to face possible plant disruptions or unexpected changes in demand – one may refer to Chapter 3 for
18
details.
The proposed solution approach in this study will be different from those presented by Toledo et al. (2002) and Ferreira et al. (2008). As mention in the previous section, Toledo et al. (2002) encountered problems when trying to solve their model with GAMS/CPLEX because the computational time increases very fast when the number of products and periods increase. Ferreira et al. (2008) presented two approaches. The first approach is called “relaxation approach” (RA) that solves just one-stage at a time, and the second “relax-and-fix” (RF), where integer variables are partitioned in subsets, and the variables of only one subset are defined as integers and the others are defined as continuous for each iteration. After the sub-model is solved, they verify its feasibility -- if it feasible, they fix those integer variables and repeat the process for the other subsets until solving all subsets. Their model and algorithms were coded in the AMPL modelling language and CPLEX was employed to solve the sub-models needed in the RA and the RF algorithms. Their RA approach outperformed Toledo’s et al. (2002) using the real-world data from a company.
In order to solve the problem, we propose a hybrid-heuristic that combines genetic algorithm and Linear Programming, which is similar to Toledo’s et al. (2014) approach. However, the problem definition and the proposed solution approach in our study are significantly different. The data structure of our GA is completely different, thus the implementation of GA totally changes. We solve the lot sizes of all products precisely for every micro-period in the planning horizon using the LP solver. We will explain all the details in Chapter 4. We will verify the effectiveness of the proposed solution approach by comparing it with the PBC’s historical data. Chapter 6 presents our experiments, analyses and discussion and suggestions for improvement.
19
3. Decision-Making Scenario and Mathematical Model
3.1 Beer Packaging Process & CSD Packaging Process
At the end of every week, the Planning Department releases the next week’s schedule to the packaging lines and the brew house. The packaging process starts when all materials, machines and brew house are set to run. The team leader constantly communicates with the warehouse supervisors to ensure the delivering of the required amount of crates with empty bottles during the production.
The packaging process of beers is made by continuous flow production lines. Generally, beer factories offer their products in different types of containers. The most common containers are returnable glass bottles, non-returnable glass bottles, cans, and kegs. As mention before, this thesis focuses on the Returnable Bottle (RB) production lines. Since Panama’s factory uses RB, they have set a previous process that is done in their warehouses. Before crates are sent to manufacturing plant, these crates need to be checked and cleaned as much as possible because usually there are crates and bottles that are out of specification, e.g., cracked or chipped ones, as well as the ones that comes with material difficult to remove, such as cement.
The bottles come in crates which in turn are grouped in pallets. They are delivered to the depalletizer by hoists. The empty crates move through conveyors until reaching the unpacker, which is in charge of separating the empty bottles from the crates. The empty crates are sent through the conveyors to the crates washer and the bottles are sent to the washer. Inside the washer, the first step is the pre-rinse; follow by the immersion of bottles in caustic soda to sterilize. Immediately, they pass through water jets of high pressure to remove any residue of label, caustic soda or any other foreign object. Once the bottles are out of the washer, they start
20
to accumulate in a buffer and are continuously moving to the electronic inspector. This machine assures that every bottle fulfills all quality requirements. Since the electronic inspector is considered as a critical machine to maintain the product safety, every two hours the operator need to put “fake bottles” to make sure that it is properly rejecting out-of-specification bottles, namely those being chipped, broken, having objects within, sediments or caustic soda residues.
After this inspection, the bottles passed directly to the filler, which is ready with the final product to be filled in and sealed with steel crowns with corrugated edges, twist offs, or pull tabs. The filler is the key machine of the whole packaging line and the performance of the line. The quality of the final products depends directly of the filling operation. The machines before the filler are designed in order to provide a continuous supply of bottles, and the machines after the filler are designed to allow the interrupted discharged of filled and sealed bottles. The optimal efficiency of the line is considered when the filler runs without stops during the production period and the bottles satisfy all quality specifications. Once the bottles are filled and sealed, they need to pass through codification and level inspection to assure the right quantity of liquid (Cerveceria Nacional S.A., 2008). Next is pasteurization, which is considered one of the most critical processes for quality assurance. PBC uses tunnel pasteurization. Bottles run into a tunnel where hot water is sprayed on the product. The temperature of product is carefully controlled, so the bottles are heated until the center of the package reaches a specific temperature. The bottles are held at this temperature for around 15~20 minutes and then starts to move into the cooling zone of the tunnel. This process is critical because if the temperature is not well controlled, the beer can be over heated, which jeopardizes the flavor of the beer. The bottles then are transported through conveyors to the labeler. Finally, the bottles are packed together into the crates and full crates are sent to palletizer. Hoists pick up the finish pallets and transport them to the warehouse. Figure 5 shows a simple description of the packaging process for beer products.
21
Figure 5 – Beer Packaging Process
The packaging process of soft drinks is made also by production lines. Some processes can differ depending on type of container. If the products are packed in pet containers, the process highly differs from beer packaging lines. However, in this study, we consider PBC’s RB line for CSD; this process is very similar to the previous description. The main difference is that the liquid is prepared in the blenders prior to the filling process. This machine mixes the syrup concentrate and treated water. Also soft drinks do not need to pass through pasteurization process; therefore bottles are transported directly to the packing machine after the codification is done. Finally, the crates are palletized and transported to the warehouse for distribution. Figure 6 displays the packaging process of carbonated soft drinks.
22
Figure 6 - Carbonated Soft Drinks Packaging Process
As mention before, packaging production lines can be treated as single unit because it is a continuous flow and its velocity is defined by the filling machine, so the highest throughput rate that the line can achieve is equal to the filler rate (Toledo, Franca, & Morabito, 2002). However, not necessarily all lines have the same processing rates for every product because it directly depends on the type of container to be filled. In the next section, PBC’s main characteristics that need to be considered for the mathematical model are presented.
23
3.2 Decision-Making Scenario
3.2.1 PBC CharacteristicsProduction scheduling is not an easy task for the planners because they need to consider many factors, which make this task more difficult when they are not equipped with a computational tool to assist them. These factors can vary depending on the industry. Beverage industry involves the production of large batches using repetitive process. Production lines are shared among different products and factories usually work according to a make-to-stock policy. PBC sales department sends the planners the sales numbers for the next week every Monday morning and the projected forecast for the next two months. These Excel files are updated daily, however for planning purposes the information updated until Wednesday is the one used for production scheduling of the brew house and the packaging department. Sales are expressed in terms of hectoliters (Hl) for each SKU. This is the unit of measure that is going to be used throughout this thesis to express production quantity. The material requirement plan and distribution plan also is generated from this data.
As described in the previous section, packaging lines are arranged in a specific sequence of operations. This sequence depends on the type of products that are going to be manufactured in every line. There is no difference in sequence for products that belongs to the same family. All types of beers and malta pass through the same stages in a returnable bottle line and all CSD pass through the same stages in its production line. Therefore it can be said that the flow pattern is a “flow shop”.
PBC has three lines dedicated to returnable bottle products. Every line has different capability to produce a set of products. In this case are considered 13 different SKUs which are listed in Table 2.
24
Table 2 - List of Products bottled in Returnable Bottles
SKU Product Description Type
1 Atlas 24 x 330 ml Beer
2 Balboa 24 x 330 ml Beer
3 Malta 24 x 250 ml Malta
4 Balboa 24 x 590 ml Beer
5 Atlas 24 x 590 ml Beer
6 Miller Lite 24 x 300 ml Beer
7 7UP 24 x 355 ml CSD 8 Pepsi 24 x 355 ml CSD 9 Ginger Ale 24 x 284 ml CSD 10 Mirinda Manzana 24 x 355 ml CSD 11 Squirt 24 x 355 ml CSD 12 Mirinda Fresa 24 x 355 ml CSD 13 Orange Crush 24 x 355 ml CSD
Line 1 is the largest packaging line in the plant. However, it is capable to produce only three types of SKU. Although Line 2 has a lower production rate compared to Line 1, it has greater flexibility because it can produce all products from the beer and malt segment. Line 3 is exclusively designed to bottle CSD products; this last process is different from beer process, however it uses almost the same types of machines. Table 3 summarizes the packaging capabilities of each line where the “X” mark means that a line is capable to bottle the respective product.
25
Table 3 - Production Lines’ Capabilities
SKU Product Description L1 L2 L3
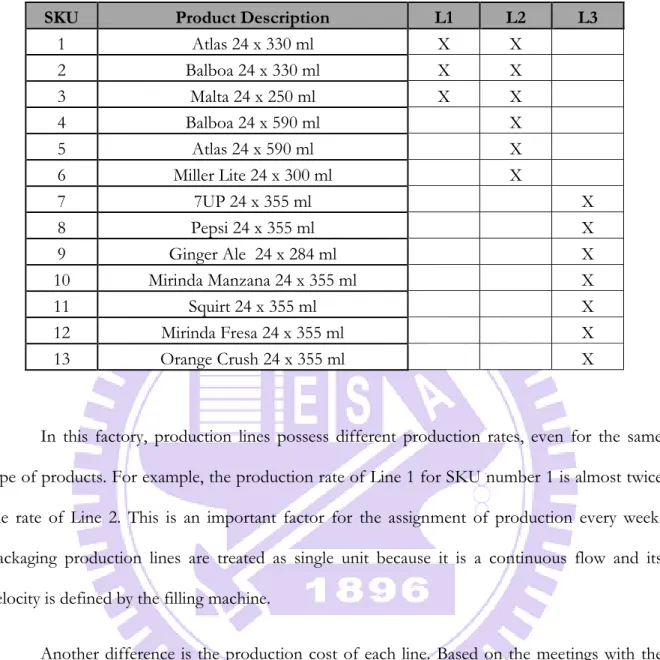
1 Atlas 24 x 330 ml X X 2 Balboa 24 x 330 ml X X 3 Malta 24 x 250 ml X X 4 Balboa 24 x 590 ml X 5 Atlas 24 x 590 ml X 6 Miller Lite 24 x 300 ml X 7 7UP 24 x 355 ml X 8 Pepsi 24 x 355 ml X 9 Ginger Ale 24 x 284 ml X 10 Mirinda Manzana 24 x 355 ml X 11 Squirt 24 x 355 ml X 12 Mirinda Fresa 24 x 355 ml X 13 Orange Crush 24 x 355 ml X
In this factory, production lines possess different production rates, even for the same type of products. For example, the production rate of Line 1 for SKU number 1 is almost twice the rate of Line 2. This is an important factor for the assignment of production every week. Packaging production lines are treated as single unit because it is a continuous flow and its velocity is defined by the filling machine.
Another difference is the production cost of each line. Based on the meetings with the Packaging Director, the costs that are directly impacted by the lot sizing and scheduling decisions for packaging production lines are: electricity consumption, steam consumption, material inputs such as caustic soda, additives, and lubricants, and water consumption. These values are calculated every two years according the variance of cost and the consumption in lines. For practical purposes PBC has established a fix cost for every production line; one may refer to the details of which costs are considered in production costs in Appendix C. Commonly in packaging lines there is an amount of waste that is loss during the process. This waste is caused
26
by different reasons such as, unexpected breakdowns in any machine, wrong adjustment in conveyors that caused bottles to fall down, handling issues, etc. Every line has different percentages of product loss, therefore managers calculate the total production cost of each line by adding the production fix cost and the amount of product waste during production. The percentage of product loss used is the average of the past 6 months. The total production costs can be calculated as follow:
Total Production Cost = (Fix Production cost of Line L ($)/Hl) * (Amount of Bottled Product j in Line L (Hl)) + (Cost of product J ($/Hl)) * (Amount of Bottled Product (Hl) * fix % of product loss of Line L)
The setup times include the cleaning time and the time for machines adjustments. It is a factor that strongly influences the production sequence, because the setup time is sequence-dependent, that is, the time length of the setup depends on which product was produced previously. In PBC’s case, the setup time varies from half hour to 5 hours, depending on the line and the production sequence. These changeovers also imply a loss of the previous packaged product, where every line has a different (fix) amount of hectoliters that are loss every time a changeover is done. Thus the total setup cost can be calculated with the following equation:
Total Setup Cost = (Fix Changeover Cost of Line L ($/hour)) * Setup hours (hour) + (Cost of Previous Product ($/Hl)) * (Fix Amount of Product Loss per Changeover (Hl))
As mention in Chapter 1, PBC recently made a restructuration of headcount and working hours. With this new scheme factory is working with a schedule where Line 1 fills all demand requirements of three SKUs from beer and malt segment, and Line 2 fulfils the other three SKUs from beer segment. Table 4 shows specifically which beer products are currently being
27
processed in Line 1 and Line 2.
Table 4 - Current production assignment of beer products.
SKU Product Description L1 L2
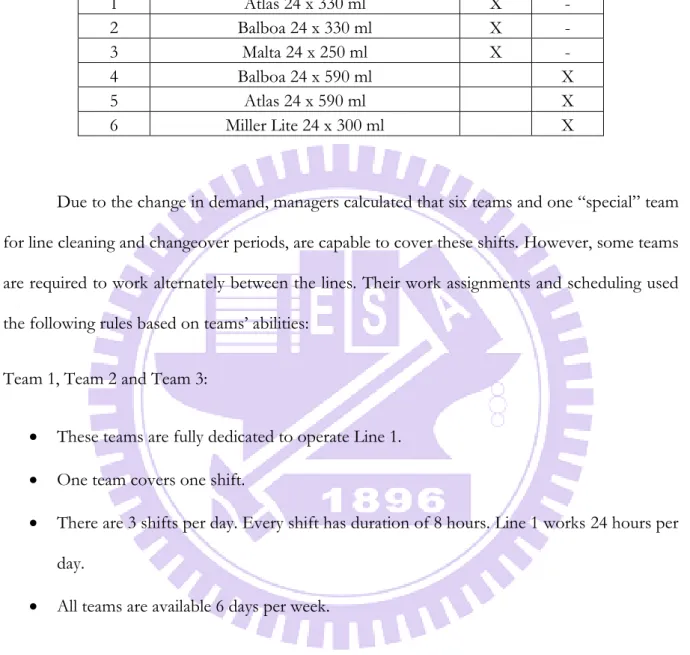
1 Atlas 24 x 330 ml X - 2 Balboa 24 x 330 ml X - 3 Malta 24 x 250 ml X - 4 Balboa 24 x 590 ml X 5 Atlas 24 x 590 ml X 6 Miller Lite 24 x 300 ml X
Due to the change in demand, managers calculated that six teams and one “special” team for line cleaning and changeover periods, are capable to cover these shifts. However, some teams are required to work alternately between the lines. Their work assignments and scheduling used the following rules based on teams’ abilities:
Team 1, Team 2 and Team 3:
These teams are fully dedicated to operate Line 1.
One team covers one shift.
There are 3 shifts per day. Every shift has duration of 8 hours. Line 1 works 24 hours per day.
All teams are available 6 days per week.
Team 4, Team 5 and Team 6:
These teams need to operate Line 2 and Line 3.
One team covers one shift. This means that Line 2 and Line 3 cannot run at the same time.
28
hours per day.
All teams are available 6 days per week.
The six teams have the same costs; therefore can be assigned indifferently to the shifts. This constraint is important because the production of beer and malta can be divided between Line 1 and Line 2. On the other hand, the availability of Line 2 directly depends on the production schedule of Team 4, Team 5 and Team 6, which in turn also need to cover shifts of Line 3. The managers decide (usually by experienced) that teams need to work in the sequence shown in Table 5. However, it is flexible to changes.
Table 5 - Current team assignment sequence for production
Line Team Shift Monday Tuesday Wednesday Thursday Friday Saturday
Line 1
Team 1 Shift 1 L1 L1 L1 L1 L1 L1
Team 2 Shift 2 L1 L1 L1 L1 L1 L1
Team 3 Shift 3 L1 L1 L1 L1 L1 Maintenance L1 (12 hrs)
Line 2 & Line 3
Team 4 Shift 1 L2 L3 L3 Maintenance L3 (8 hrs) L2 L2
Team 5 Shift 2 L2 L3 L3 L2 L2 L2
Team 5 Shift 2 L2 L3 L3 L2 L2 Maintenance L2 (8 hrs)
Although all teams work 6 days per week, it is necessary to consider the number of hours dedicated to the weekly maintenance of production lines, because they reduced the available time for production. The data of available hours for teams is shown in Table 6.
29
Table 6 - PBC teams Capacity per week (hours)
Line 1 Daily Weekly Maintenance Available Time Productive Teams (1, 2, 3)
Available Hours 24 144 12 132
Line 2 & Line 5 Daily Weekly Maintenance Available Time Productive Teams (4, 5, 6)
Available Hours 24 144 16 128
Since the setup and production costs are high, the company defined a Minimum Lot Size policy that mandates the minimum lot size to be produced every time a line starts up a production lot. Table 7 presents the real values of the company. Currently, these values are being revised by the managers due to reduction in demand of RB products. However, the author will use these values until the new ones are approved.
Table 7 - Minimum Lot Size defined for every product in every line
Minimum Lot Size Qmin L1 Hl Qmin L2 Hl Qmin L3 Hl
1 Atlas 24 x 330 ml 7128 3168 2 Balboa 24 x 330 ml 7128 3168 3 Malta 24 x 250 ml 2508 1680 4 Balboa 24 x 590 ml 708 5 Atlas 24 x 590 ml 1699.2 6 Miller Lite 24 x 300 ml 3888 7 7UP 24 x 355 ml 203.3 8 Pepsi 24 x 355 ml 508.1 9 Ginger Ale 24 x 284 ml 229.9 10 Mirinda Manzana 24 x 355 ml 304.8 11 Squirt 24 x 355 ml 397.4 12 Mirinda Fresa 24 x 355 ml 304.8 13 Orange Crush 24 x 355 ml 301.5
At the same time PBC has policies that regulate the maximum amount of inventory maintained in the warehouses in order to control the inventory holding costs. This measurement
30
is called “days of coverage” and the unit is days. It indicates the number of days that current inventory and production is able to respond to future demand. They set a minimum “days of coverage” which can be considered as the replenishment point and a maximum “days of coverage” which can be considered as the maximum amount of items that can be stored in the warehouses. The planners try to maintain the “coverage” between these two values by trial-and-error, however most of the time they prefer to keep the maximum coverage to be “safe”. For example if the policy says that for product 1, a minimum amount of coverage that need to be cover is 6 days (1 week), this means that inventory at the end of the planning horizon at least need to have enough products to cover next week’s demand.
The inventory policy is maintained due to the reliability of production lines or unexpected fluctuations in demand. Normally, lines are interrupted by unexpected breakdowns, which reduce the capacity of production. Therefore the average breakdown time is another important parameter that needs to be considered in the mathematical formulation.
According to the parameters of Planning Department and demand analyses, PBC’s managers consider that some products need to be produced in a weekly manner, others every two weeks, three weeks or four weeks. Table 8 shows the current frequency of production of every item. This characteristic helps the planners to determine the number of lots that need to be considered in every week. However, this schedule is not followed exactly, because the final decision depends on demand of specific periods.
31
Table 8 - Frequency of production of every item
SKU Product Description Every Week 2 weeks Every 3 weeks Every 4 weeks Every
1 Atlas 24 x 330 ml X 2 Balboa 24 x 330 ml X 3 Malta 24 x 250 ml X 4 Balboa 24 x 590 ml X 5 Atlas 24 x 590 ml X 6 Miller Lite 24 x 300 ml X 7 7UP 24 x 355 ml X 8 Pepsi 24 x 355 ml X 9 Ginger Ale 24 x 284 ml X 10 Mirinda Manzana 24 x 355 ml X 11 Squirt 24 x 355 ml X 12 Mirinda Fresa 24 x 355 ml X 13 Orange Crush 24 x 355 ml X
Quality constraints are also taken into consideration by the planners for the final scheduling. These are the requirements to keep certain international standards of beer and CSD production. For Line 1 a major sterilization need to be done if this has been running a product for more than 72 hours; this sterilization lasts 4 hours. Line 2 has the same restriction, but the sterilization lasts 3 hours. And for Line 3, a major sterilization is required after 36 hours of continuous production; this procedure lasts 3 hours. These sterilizations are in addition to those strictly required every time a changeover is done. Since demand of RB products are going down is very rare that PBC production lines has runs that last more than 36 or 72 hours. Therefore, for simplicity purpose these parameters are not considered in our mathematical model.
Besides the limitations that exist within the packaging system, the production lines are also constrained by the brewery, utilities supply and packaging material.
The brewery and the syrup room are in charge for the supply of beer and liquid concentrate respectively. Utilities department provides steam, treated water, compressed air, and
32
refrigeration systems. Materials such as glass bottles, crates, labels, glue, caustic soda, lubricants, caps, pallets and others, are supplied by the Materials Storage Department. In this thesis all these supplies are assumed infinite, so we consider no constraint from them.
3.2.2 Statement of Problem
Since the aim of this thesis is to solve PBC’s lot sizing and scheduling problem, the principal characteristics considered for the formulation of our mathematical are summarized in this section.
We had made some considerations about the capacity-sharing issue between Lines 2 and 3. Based on Meyr’s (2002) formulation, the lot sizing and scheduling problem can be solved for the PBC problem by changing or adding some constraints to represent the company’s characteristics and restrictions. We must consider the fact that Lines 2 and 3 cannot operate simultaneously. Therefore to simulate PBC’s problem, it’s been established that for modeling purposes a (virtual) Line 2 will represent a line which has the capability to bottle all products produced in Lines 2 and 3. Thus its production capacity will be the sum of teams’ availability. The lot size and the number of changeovers in every period will be constrained by the production capacity.
The simulation of changeovers between products packed in Lines 2 and 3 is done by adding the amount of hours required to complete the production in one line and the amount of hours required to start up the other line. With this parameter the real situation can be simulated due to necessity of moving a team from one line to the other. Teams will shift from one line to the other when the sequence in production goes from a beer product to a CSD product, and vice versa.
33
The setup times are sequence-dependent. Product sharing between Lines 1 and 2 is also a characteristic of this problem. The solution approach will help to decide in which production line is less expensive to assign the lot of a specific product. The setup costs are included as part of the objective function.
The proposed model also follows the characteristics of the packaging lines, which usually suffer from reliability issues (viz. by adding downtime due to breakdowns). This reduces capacity availability.
Since the setup and production costs are high, the company defines a Minimum Lot Size policy that the minimum quantity needs to be produced every time the line starts up a production lot of a specific product. Following this, designated constraints for this issue will be included in the mathematical model.
A very particular characteristic of this company is that they do not expect to reduce the total inventory level to zero. This company have inventory policies, that set a minimum amount of inventory that need to be at the end of every week is the warehouse. Usually these amount need to cover from 1 to 3 weeks of future demand. This type of policies is established due to the reliability of production lines or unexpected fluctuation in demand, since these are fast-moving goods. The objective function also includes the inventory holding costs associated with the amount of inventory at the end of every week.
The output of our solution approach will be the lot sizes for every product and the scheduling in each line that minimizes the total costs. We will verify the effectiveness of the proposed solution approach by comparing it with the AS-IS approach using PBC’s historical data.