Perceptual factors underlying user preferences toward product
form of mobile phones
Ming C. Chuang
a, Chien C. Chang
b, Shang H. Hsu
b,*
a
Institute of Applied Arts, National Chiao Tung University, 1001 Ta-Hsueh Road, Hsinchu 300, Taiwan, ROC
b
Department of Industrial Engineering and Management, National Chiao Tung University, 1001 Ta-Hsueh Road, Hsinchu 300, Taiwan, ROC
Received 2 January 1999; accepted 30 June 1999
Abstract
This study examined the relationship between user preference perception of mobile phones and their form design elements. Subjects were asked to judge 26 mobile phone designs by using a user preference rating scale for 11 image words. The determining factors for user preference, including image words for design trends and product design elements, were specified through the semantic differential method. It was found that users prefer mobile phone designs with soft and compact images. Design reference models composed of relative weights of design elements were then proposed for specific design trends. In accordance with the design reference model, optimal solutions for preference and design trends of ‘‘soft’’ and ‘‘compact’’ were obtained through a specific algorithm. Concrete examples were illustrated and verified. The user’s preference database can serve as the styling benchmark to help designers adopt a proper design and development perspective for the intended end users.
Relevance to industry
Important design elements and design trends related to the user’s preference for mobile phones were extracted from the study. The optimal design solutions obtained from the database can serve as the styling benchmark for designers and managers in making design strategy, by which the time and cost of product development can be reduced. # 2001 Elsevier Science B.V. All rights reserved.
Keywords: User’s preference; Semantic differential method; Product form design; Styling benchmark
1. Introduction
User preference is one of the important user requirements. There is a close tie between user’s preferences and the success of a product (Baxter, 1995). The design of profitable, high-quality
products depends on a detailed understanding of consumer preferences (Swift, 1997). However, it is a challenging task for designers to transfer the user’s implicit preference into specific design specifications. Intuitively, the user’s preferences are often referred to as the degree to which the user likes a product. In fact, the user’s preference is a multidimensional psychological construct that might be composed of perceptive, affective, and
behavioral dimensions. With regard to the
*Corresponding author. Tel.: 5726731; fax: +886-3-5722392.
E-mail address:shhsu@cc.nctu.edu.tw (S.H. Hsu).
0169-8141/01/$ - see front matter # 2001 Elsevier Science B.V. All rights reserved. PII: S 0 1 6 9 - 8 1 4 1 ( 0 0 ) 0 0 0 5 4 - 8
perceptual dimension, the design elements of a product form play a key role in affecting user’s preferences.
To study the perceptual dimension of user’s preferences, the semantic differential method (Osgood et al., 1957) is one of the most frequently used methods. It quantitatively deals with how people feel about a product with the aim of translating the perceptual database into the specification of product design. Many researchers have applied this method to study product forms, styles, colors, and other attributes in product design. For example, Caplan and Faulkner (1982) conducted a study on disc camera conceptual design and extracted three factors for the subject’s preferences: product visual (finish) characteristics, ease of holding, and location of the shutter release. Furthermore, Faulkner et al. (1983) evaluated the subject’s preferences for different camera config-urations. They found that users could be categor-ized into three groups. Each subject group put different amounts of emphasis on these preference factors. The characteristics of the users’ prefer-ences can serve as a design reference model for product design and development. In addition, Veryzer (1997) proposed a design perception model that can generate the product character-istics from user’s responses to models, prototypes, and other media. The data can be further translated into a sentientality index that measures the degree to which elements convey certain sensations. The results proved beneficial in helping managers judge the effectiveness of a particular design language. Moreover, Nakada (1997) stu-died the relationship between design elements and Kansei sensibility values in the design of earth moving machinery and arrived at a conclusion that consumers prefer machinery conforming to func-tional images such as funcfunc-tional, sturdy, solemn, and masculine.
On the other hand, Swift (1997) explored several research methodologies, including conjoint analy-sis and quality function deployment that quantify consumer perceptions and came out with a rich database of precise objectives shared by designers, engineers, and marketers. Such a quantitative database offered a helpful guide for product development in areas ranging from ergonomics
and performance to materials and aesthetics. These studies dealt with the way people perceive the product and have proved suitable for practical application in many areas. Similar research has, however, not been carried out on the product form and consequently designers do not have enough information to go on in developing new products. Besides, how to apply effectively the quantitative database of user’s preferences and how to keep balance on the associated factors for product design remain unanswered.
In this study, the semantic differential method was used to explore important design elements and design trends suitable for user’s preferences. It was hypothesized that user’s preferences could be defined as a function of styling images and that the styling image could be represented as a function of design elements. To verify a user’s preference database, a series of design solutions was obtained through a specific algorithm. More-over, concrete images of mobile phones were developed according to the morphological cate-gories of the optimal solutions. These solutions can serve as the styling benchmark for designers and managers in new product design and devel-opment process. Furthermore, the user preference database can support designers in the control of development costs, and help them adopt a proper perspective of product style for the intended end users.
2. Method
The semantic differential method was used to explore the user’s preference about product form of mobile phones. The experiment consisted of two parts: (1) a pilot test to construct the measurement scale for preference study and (2) the semantic differential test to measure the user’s preference and image perception toward mobile phone de-sign.
2.1. Constructing the measurement scale for the preference study
To construct a feasible test, one needs to select the representative mobile phone samples and the
evaluation image words. Five senior designers, with an average design experience of more than ten years, participated in the pilot test. Each subject was asked to evaluate 40 mobile phones accord-ing to a saccord-ingle adjective pair in every page of questionnaires on a nine-point scale for 24 adjective pairs (Table 1). The result was then coded for cluster analysis. In dealing with the subject’s judgement, it is a tradeoff between the number of evaluation tasks and the precision of performance requirement. A balanced cutting point in the hierarchical dendrogram of the cluster analysis, therefore, was chosen from which 11 adjective pairs (Table 2) and 26 sample mobile phones were picked for the semantic differential test.
2.2. The semantic differential test to measure user preference and image perception
Subjective evaluations were conducted to clarify the relationships between mobile phone design and image word pairs from Table 2 on the basis of the preliminary experiment results. The data were then quantified and incorporated into the design reference models.
Materials: Twenty-six black and white mobile phone photographs and 11 right-hand-sided image words (in Chinese) were used for the semantic differential test. These mobile phone samples were
presented in full-scale front and side views. In the semantic differential test, the preference and image words were scored according to a nine-point scale. The attribute scale is defined by a bipolar pair of descriptive adjectives, with an image word on the right and its antonym on the left. On the evaluation scale, a nine-point score means that the subject has a very strong preference or image impression of the mobile phone sample, while a one-point score for the least preference or image impression.
Subjects: One hundred and two subjects (62 males, 40 females in the age range 19–25), most of whom are college students in Taiwan, participated in the subjective evaluation task.
Procedure: Each subject was asked to evaluate 26 mobile phones according to the image word pair in every page. The evaluations were con-ducted individually and each subject was allowed to proceed at his or her own pace. To prevent the centralization of the rating scores which often occurs in such a subjective evaluation task, the subjects were told to obey the following three-step procedure:
Step 1: Classify all the mobile phone samples into three groups, each of which represents low, median, and high degree of each image word pair and preference. For example, for the preference score, there will be three piles of mobile phones; one for ‘‘very strong preference’’, another for
Table 1
The 24 image word pairs for the pilot test
Sharp-edged–curvatured Traditional–modern Common–novel Heavy–handy Hard–soft Simple–complicated Ordinary–individualized Indistinct–distinct Conventional–futuristic Large–compact Normal–particular Idle–active
Unrealistic–practical Tardy–streamlined Masculine–feminine Popularized–professional Nostalgic–avant-garde Obedient–rebellious Hand-made–hitech Disagreeable–harmonious Plain–luxurious Coarse–delicate Plagiaristic–creative Rational–emotional
Table 2
The 11 image word pairs obtained from cluster analysis of pilot test
Traditional–modern Heavy–handy Hard–soft Nostalgic–avant-garde
Large–compact Masculine–feminine Obedient–rebellious Hand-made–hi-tech Coarse–delicate Plagiaristic–creative Rational–emotional
‘‘moderate preference’’, and the other for ‘‘least preference’’.
Step 2:Assign a score to each sample according to the degree of impression of the preference or image word by placing a check mark along the scale. For the low-degree pile, evaluation scores should fall in the range of one to three points; median-degree pile four to six points, and high-degree pile seven to nine points.
Step 3: The samples that possess the same degree of preference or image word impression should be assigned the same score.
3. Results and discussions
The raw data of evaluation and preference scores of the subjects were analyzed to extract the mobile phone design the users prefer and the design elements that affect the user’s perception and preference. Finally, a conjoint analysis was performed to develop the design reference model for mobile phones.
3.1. Identify the most preferred mobile phone samples
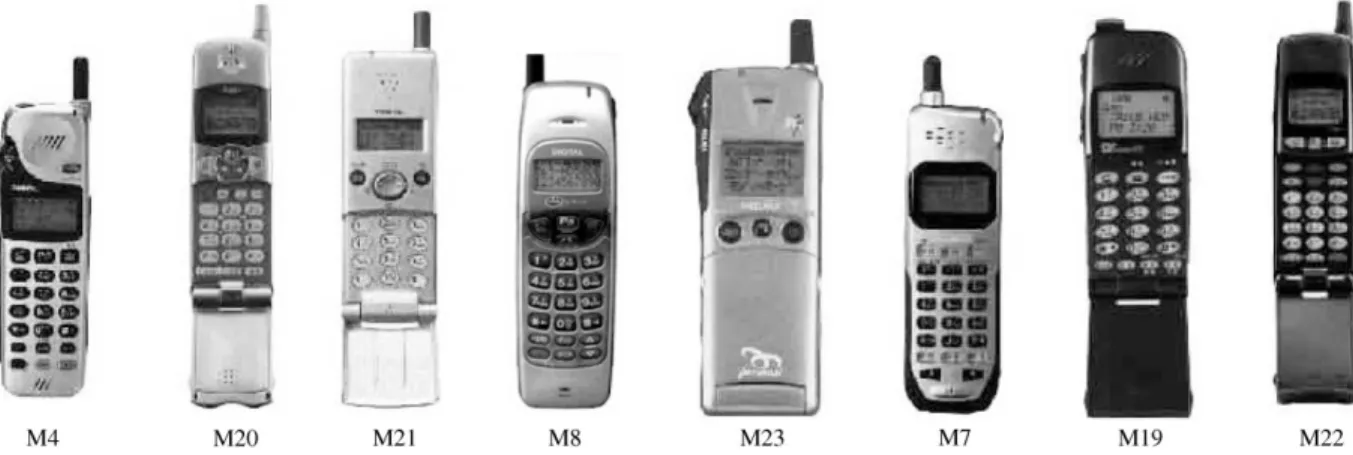
Among the 26 mobile phone samples, eight were rated with the strongest preference scores (pre-ference 57.0) in terms of the nine-point semantic scale (Fig. 1). These eight mobile phones give
designers helpful insights of the types of product form users prefer. Analyzing the product form of these 26 mobile phones in terms of their global shape and features, one can build up a morpho-logical chart (Table 3). The result suggested that 6 design factors and 24 design factor levels could be employed to represent the mobile phone design. A specific design category, therefore, could be obtained for each of the most preferred mobile phones. The extraction of the design elements of these preferred mobile phones reflected that the users prefer mobile phones composed of the following features:
(1) A soft-curvatured or asymmetrical body; (2) Elliptical or rounded rectangular digital keys; (3) An unbalanced display, function keys
ex-cluded;
(4) No cover or with a cover of the same width as the body.
3.2. Identify the design trends for mobile phone A correlation analysis was performed to check the relationship between the preference and image words. The results indicated that the image word ‘‘soft’’ (r=0.894) as well as the related words ‘‘feminine’’ (r=0.815), ‘‘delicate’’ (r=0.788), and ‘‘emotional’’ (r=0.691) has the highest positive relationship with user’s preference. This indicates that the higher the degree of a soft and delicate
image a mobile phone has, the higher the degree of users’ preference towards a mobile phone design.
Furthermore, a stepwise multiple linear analysis was performed to find the linear function of the user’s preference upon the basis of evaluative image words. The result reflected that the user’s preference could be expressed as: ~Yp¼ 0:998 þ 0:640X3þ 0:226X5(RSQ=0.828), where X3 repre-sents the evaluation score of the image word ‘‘soft’’, and X5represents that of the image word ‘‘compact’’.
Moreover, a factor analysis of the subjects’ perceptions reflected that these image words could be grouped into three factors: evaluation factor, shape factor, and activity factor, among which the subject’s preference, soft and compact impres-sions could be considered the typical ingredients that dominate their perception. The image words of soft and compact as well as the degree of preference were, therefore, suggested to serve as criteria to evaluate a mobile phone design. 3.3. Develop design reference models
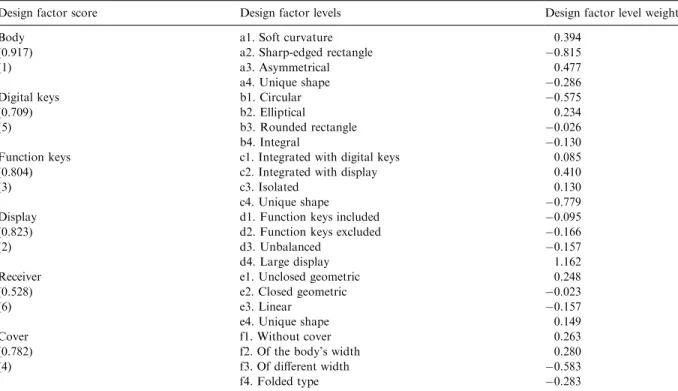
In this study, the design features of mobile phones were classified according to 6 design factors and 24 design factor levels (Table 3). The score assigned to each image word was then analyzed through conjoint analysis that allows one to identify the relative weight of design factors and design factor levels in the perception of preference as well as soft and compact images. 3.3.1. Morphological analysis of the mobile phone samples
To analyze the design elements of the 26 mobile phone samples, a morphological analysis was performed. Six items of mobile phone compo-nents, defined as the design factors, including the body, digital keys, function keys, display, receiver, and cover, were decided. Every item was then divided into four factor levels (Table 3). In specifying the component category assignment, the category range covers most types of mobile phones and there are at least two samples for each design factor level. Furthermore, the design factor levels are mutually exclusive. For a given mobile
Table 3 Morph ologic al analysis of 26 mo bile phone sam ples Design factors Design facto r level 1 Design facto r level 2 D esign fa ctor leve l 3 Design factor level 4 A. Body a1. Sof t curvatu re a2. Sharp -edged rectang le a3. Asym metrical a4. Unique sha pe B. Dig ital ke ys b1. Circular b2. Elliptical b3. Roun ded rectang le b4. Inte gral C. Func tion ke ys c1. Integrate d with digi tal keys c2. Integrate d with display c3. Isol ated c4. Unique shape D. Display d1. Funct ion keys inc luded d2. Function keys exclud ed d3. Unba lanced d4. La rge display E. Rec eiver e1. Unclose d geom etric e2. Closed geom etric e3. Linea r e4. Unique shape F. C over f1. W ithout co ver f2. Sam e w idth as the body f3 . Differen t width from the bo dy f4. Fold ed ty pe
phone sample, there is only one factor level assigned the value of 1 for each design factor, while the value of 0 is assigned to the other factor levels. The indicating values of these mobile phones serve as the independent variables for conjoint analysis.
3.3.2. Identify the relative importance of design factors
The relationship between image words and design elements can be specified as the numerals seen in Table 4. These data indicate whether each design factor has a positive or negative influence on the user’s preference. The distribution pattern reflects the relative importance in influencing the user’s preference. To develop a new mobile phone strongly preferred by the users, the referent with the design pattern (a3b2c2d4e1f2) might be cho-sen. Such a mobile phone features an asymmetrical body (a3), elliptical digital keys (b2) integrated
with function keys (c2), a large display (d4), an unclosed geometric receiver (e1), and a cover of the same width as the body (f2). This design pattern confirms that of the typical mobile phone samples preferred by the users (Fig. 1). For a mobile phone like this, one can expect a preference score of 7.504, the sum of the category weight of these design factor levels and the constant value. In the nine-point semantic scale, such a mobile phone falls in the very positive range of the evaluation scale. To calculate the predicted pre-ference score, a quantitative design repre-ference model will be applied.
3.3.3. Identify the relationship between design trends and design elements
Table 5 lists the relative weight on which each product component will affect the image of ‘‘soft’’ and ‘‘compact’’. The component category (a1b2c2d4e1f1) that features a soft-curvatured
Table 4
The weights of design factors and design factor levels for user’s preference
Design factor score Design factor levels Design factor level weight
Body a1. Soft curvature 0.394
(0.917) a2. Sharp-edged rectangle ÿ0.815
(1) a3. Asymmetrical 0.477
a4. Unique shape ÿ0.286
Digital keys b1. Circular ÿ0.575
(0.709) b2. Elliptical 0.234
(5) b3. Rounded rectangle ÿ0.026
b4. Integral ÿ0.130
Function keys c1. Integrated with digital keys 0.085
(0.804) c2. Integrated with display 0.410
(3) c3. Isolated 0.130
c4. Unique shape ÿ0.779
Display d1. Function keys included ÿ0.095
(0.823) d2. Function keys excluded ÿ0.166
(2) d3. Unbalanced ÿ0.157
d4. Large display 1.162
Receiver e1. Unclosed geometric 0.248
(0.528) e2. Closed geometric ÿ0.023
(6) e3. Linear ÿ0.157
e4. Unique shape 0.149
Cover f1. Without cover 0.263
(0.782) f2. Of the body’s width 0.280
(4) f3. Of different width ÿ0.583
body (a1), elliptical digital keys (b2) integrated with function keys (c2), a large display (d4), an unclosed geometric receiver (e1) without cover (f1) might be chosen for soft image. This design pattern is almost the same as that of the typical mobile phone samples preferred by the subjects except that the body is soft curvatured rather than asymmetrical and that it does not have the cover. For a mobile phone like this, we can expect an evaluation score of 7.526 for soft image. In the light of this, the design pattern that is strongly preferred by the users is also suitable for soft image.
Likewise, the design pattern (a2b2c2d3e1f2) can be assigned to a compact mobile phone. Such a mobile phone will be equipped with a sharp-edged rectangular body (a2), elliptical digital keys (b2) integrated with function keys (c2), an unbalanced display (d3), an unclosed geometric receiver (e1), and a cover of the same width as the body (f2).
The predicted score for the compact style is 7.714. The subjects, however, do not prefer this design pattern in that its predicted scores for preference and soft will be 4.893 and 5.474 only. The difference is due to the fact that the sharp-edged body (a2) has a remarkably negative effect on the user’s preferences (weight=ÿ0.815) and soft im-age (weight=ÿ0.796). To meet the soft and compact design trends, as well as the user’s preference toward product form, designers should be careful in working out a solution that can satisfy all of these requirements. In other words, it is necessary for designers to bring a compromise to all the design elements in a single product. 3.3.4. Build the quantitative design reference model
To predict the degree of preference for the images of mobile phones, one can apply the formula from conjoint analysis. In the formula, the constant and the weight of each design factor
Table 5
The weights of design factors and design factor levels for soft and compact images
Design factor levels Soft image Compact image
Design factor score Design factor level weight Design factor score Design factor level weight
a1. Soft curvature 0.659 0.114
a2. Sharp-edged rectangle Body ÿ0.796 Body 0.325
a3. Asymmetrical (0.897) ÿ0.196 (0.821) ÿ0.455
a4. Unique shape ÿ0.032 ÿ0.162
b1. Circular ÿ1.017 ÿ0.700
b2. Elliptical Digital keys 0.432 Digital keys 0.266
b3. Rounded rectangle (0.820) ÿ0.120 (0.755) 0.028
b4. Integral 0.048 ÿ0.365
c1. Integrated with digital keys 0.143 ÿ0.064
c2. Integrated with display Function keys 0.803 Function keys 0.723
c3. Isolated (0.769) ÿ0.198 (0.748) 0.294
c4. Unique shape ÿ0.770 ÿ0.775
d1. Function keys included ÿ0.432 ÿ0.832
d2. Function keys excluded Display 0.006 Display ÿ0.102
d3. Unbalanced (0.578) 0.095 (0.805) 0.631
d4. Large display 0.539 0.485
e1. Unclosed geometric 0.391 0.493
e2. Closed geometric Receiver ÿ0.205 Receiver ÿ0.305
e3. Linear (0.735) ÿ0.340 (0.712) ÿ0.236
e4. Unique shape 0.225 0.282
f1. Without cover 0.279 0.332
f2. Of the body’s width Cover 0.126 Cover 0.523
f3. Of different width (0.853) ÿ0.871 (0.811) ÿ0.284
level will be picked for the design reference model. For these samples, the predicted user’s preference score can be expressed as
~
Yp¼ 4:693 þ WAAT þ WBBT þ WCCT
þWD DT þ WE ET þ WF FT; ð1Þ
where ~Yp represents the predicted user preference score WA¼ ½ 0:394 ÿ0:815 0:477 ÿ0:286 ; WB¼ ½ ÿ0:575 0:234 ÿ0:026 ÿ0:130 ; WC¼ ½ 0:085 0:410 0:130 ÿ0:779 ; WD¼ ½ ÿ0:095 ÿ0:166 ÿ0:157 1:162; WE¼ ½ 0:248 ÿ0:023 ÿ0:157 0:149; WF¼ ½ 0:263 0:280 ÿ0:583 ÿ0:283 ;
AT is the transpose of matrix A½ a1 a2 a3 a4; BT is the transpose of matrix B½ b1 b2 b3 b4; CT is the transpose of matrix C½ c1 c2 c3 c4; DT is the transpose of matrix D½ d1 d2 d3 d4; ET is the transpose of matrix E½ e1 e2 e3 e4; FT is the transpose of matrix F½ f1 f 2 f3 f4:
All design factor levels are equal to 0 or 1; for each design factor level, there is one and only one whose value is 1.
Assigning the preferred design pattern to the linear function, one can get the predicted user preference score. As mentioned above, the design pattern (a3b2c2d4e1f2) will be chosen because these design elements have the greatest positive weights and contribute to the highest preference score (7.504).
For the image of a soft mobile phone, likewise, the predicted evaluation score can be expressed as
~
Ys¼ 4:423 þ WAAT þ WBBT þ WCCT
þWDDT þ WEET þ WFFT; ð2Þ
where ~Ysrepresents the predicted soft image score, WA¼ ½ 0:659 ÿ0:796 ÿ0:196 ÿ0:032 ; WB¼ ½ ÿ1:017 0:432 ÿ0:120 0:048; WC¼ ½ 0:143 0:803 ÿ0:198 ÿ0:770 ; WD¼ ½ ÿ0:432 0:006 0:095 0:539; WE¼ ½ 0:391 ÿ0:205 ÿ0:340 0:225 ; WF¼ ½ 0:279 0:126 ÿ0:871 ÿ0:446 ;
AT, BT, CT, DT, ET, and FT are the same as those in Formula (1).
Correspondingly, the predicted evaluation score for the image of a compact mobile phone can be expressed as
~
Yc¼ 4:753 þ WAAT þ WBBT þ WCCT þ WDDT
þ WEET þ WFFT; ð3Þ
where ~Yc represents the predicted compact image score, WA¼ ½ 0:114 0:325 ÿ0:455 ÿ0:162 ; WB¼ ½ ÿ0:700 0:266 0:028 ÿ0:365 ; WC¼ ½ ÿ0:064 0:723 0:294 ÿ0:775 ; WD¼ ½ ÿ0:832 ÿ0:102 0:631 0:485; WE¼ ½ 0:493 ÿ0:305 ÿ0:236 0:282 ; WF¼ ½ 0:332 0:523 ÿ0:284 ÿ0:044 ;
AT, BT, CT, DT, ET, and FT are the same as those in Formula (1).
These formulas can be defined as design reference models for the design trends of soft and compact mobile phones. Specially, they can help designers make decisions on the optimal design solutions in a large problem space.
4. Application of the design reference models The objective of the design reference model is to build the styling benchmark from the optimal solutions for mobile phones. More importantly, the design team can better understand the solu-tions selected by competitors by analyzing the benchmark data.
4.1. Identify the styling benchmark for mobile phone design
In this study, the advantage of morphological and conjoint analyses is that the problem space is
clearly defined: all possible design solutions can be calculated. Meanwhile, the problem is that the number of possible solutions, which is decided by the product of the number of categories for all items, is often very huge. In most design cases, it amounts to thousands or even millions and will cause a heavy workload for designers. To cope with such a problem, a specific algorithm was used to work out the styling benchmark, which is a search for best practices that will lead to superior performance (Baxter, 1995; Oliver et al., 1997), for further development. From the benchmark data, the optimal design solutions can be specified.
For the mobile phone design, the total number of solutions is up to 4096 (46=4096). To simplify the problem, the cover pattern is set to be f1 (without cover). The relative weights of this design factor level are of the first for soft image and of the second for preference and compact image (not too much different from the first ones, though, see Tables 4 and 5). This reduced the total number of solutions to 1024.
To search for the styling benchmark, designers need to find the solutions that meet the require-ments of the image words ‘‘soft’’ and ‘‘compact’’ as well as user’s preferences. As mentioned earlier, these two image words may play different roles in affecting the user’s preference. Different weights should be assigned to them. From the regression analysis, the correlation coefficient of the image word ‘‘soft’’ and the user’s preference is 0.894, and that of the image word ‘‘compact’’ and the user’s preference is 0.594. This means that higher priority should be assigned to the soft image rather than the compact one. This was done by checking the simple additive weighted (SAW) scores made up
of the soft and compact columns. During the decision making procedure, relative weights were assigned to the image of soft (0.6=0.894/(0.894+ 0.594)) and compact (0.4=0.594/(0.894+0.594)) in order to generate the SAW score by the original image words. Namely, the SAW score for a design solution will be equal to the sum of 60% of the ‘‘soft’’ image score and 40% of the ‘‘compact’’ image score. The procedure of the styling bench-mark searching is as follows:
Step 1: Arrange the total design solutions in a decreased ranking order of the first priority image word (soft).
Step 2: Find the score of the second priority image word (compact) for those options that have the strongest image of the first image word. Repeat this step if there are other image words to consider. Step 3:Calculate the SAW scores of the design solutions according to the correlation of the image words and user preference. Select the solutions that have high scores for both image words, i.e., the intersection of the two design trends.
Step 4: Verify these solutions with the pre-ference score, the solutions of those prepre-ference scores which are also high will be the optimal solutions.
Step 5: Classify the optimal solutions into several groups for references.
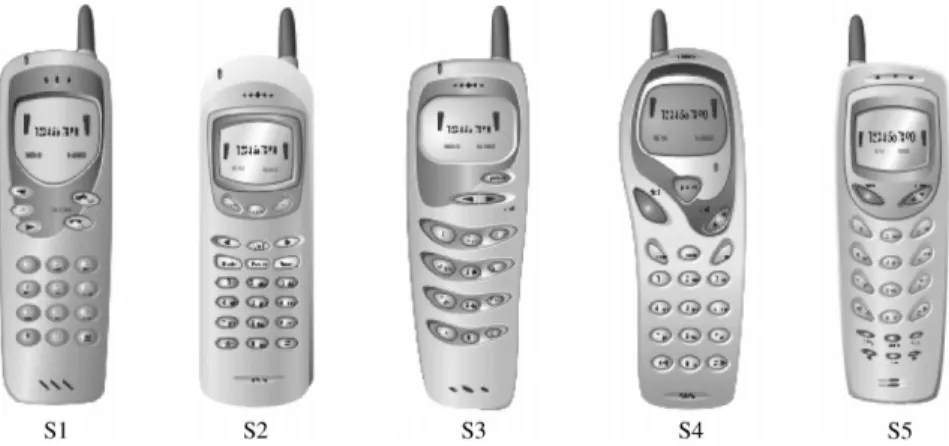
From Step 1, 25 design solutions with scores higher than 6.5 were selected. Among them, 14 solutions whose SAW scores were higher than 6.5 were chosen in Step 3. Finally, 7 design solutions (Table 6) were selected by the criteria of preference for the final references regarding the requirements of preference and soft and compact images. These design solutions were selected as the mobile phone
Table 6
The styling benchmarks for the soft and compact mobile phones
Solution no. Design pattern Soft score Compact score SAW score Preference score
S1 a1b2c2d4e1f1 7.526 7.166 7.333 7.404 a1b2c2d4e4f1 7.360 6.955 7.150 7.305 S2 a1b3c2d4e1f1 6.974 6.928 6.909 7.144 a1b3c2d4e4f1 6.808 6.717 6.726 7.045 S3 a1b4c2d4e1f1 7.142 6.535 6.854 7.040 S4 a3b2c2d4e1f1 6.671 6.597 6.597 7.487 S5 a1b2c3d4e1f1 6.525 6.737 6.566 7.124
styling benchmarks. The benchmark data provide the design team with an improvement strategy that goes beyond the industry and help make a product that can compete in the markets (Magrab, 1997).
Based upon the design patterns, these design solutions fall into five groups (Table 6). The images for these five alternative ideas were generated and, after several refining cycles, devel-oped into the images shown in Fig. 2. To verify these styling benchmarks, the design solutions were compared with the mobile phone samples that were strongly preferred and evaluated with higher soft and compact impressions.
4.2. Evaluation of the design solutions
The evaluation of design solutions was made by comparing them with four reference mobile phones, the most preferred or soft mobile phones
in the semantic differential test, samples M2, M4,
M7, and M8. Thirty-three college students
participated in the evaluation task. A nine-point scale was used to assess preference, soft and compact impressions, one for least preference, and nine for strongest preference. The raw data obtained were analyzed through a Duncan’s multiple range test (MRT) to examine if there existed significant differences between these design solutions and the reference mobile phone samples. Table 7 illustrates the ranking order and Duncan grouping of preference, soft, and compact evaluation for the design solutions and reference samples.
Generally speaking, all the design solutions, with the exception of solution S2, were rated better than the reference samples. Moreover, the ranking order for preference, soft, and compact evalua-tions showed that no single design solution was
Fig. 2. Alternative images of optimal solutions to mobile phone designs. Table 7
The Duncan grouping of preference, soft, and compact evaluation for the design solutions and reference samples
Preference perception
Soft impression
always on the top rank. For example, solution S1 was rated in the third place for preference, but was ranked the second for soft impression, and top one for compact image.
In terms of preference evaluation, design solutions S4, S5, and S1 were significantly more preferred than solution S2, and reference samples M7, M8, and M2. No significant difference, however, was found between S4, S5, S1, and S3. The result confirmed the ranking orders of the soft and compact image assessments, in which S2 falls behind the other four solutions. But there existed no significant difference between solutions S2, S3, and reference samples M7, and M8 for preference evaluation.
For soft image, solutions S3, S1, S4, and S5 belong to one group; references samples M8, M2, M4 and solution S2 belong to another; reference samples M4 and M7 belong to the other. A statistical difference was found for soft impression, the design solutions S3, S1, S4, and S5 being rated softer than solution S2 and the reference samples M2, M4, M7, and M8. Such a difference arose because these four design solutions were made up of softly curvatured bodies, elliptical or geometrically transformed elliptical digital and function keys, and curvatured displays. However, no significant differences were found between any two of these four design solutions. With regard to design solution S2, it was softer than reference sample M7. Nonetheless, there existed no significant difference between solution S2 and reference samples M8, M2, and M4. This is because S2 was equipped with a rounded rectangular body, digital keys and a sharp-edged display.
The assessment of compact style divided the solutions and reference samples into four groups: one for S1; one for S3, S4, S5, and M4; another for S5, M4, and S2; the other for S2, M8, M2, and M7. The result reflected significant differences between solution S1 and solutions S3, S4, S5, and S2, and between solution S1 and reference samples M2, M4, M7, and M8 because of its fewer digital keys and closely packed layout. Besides, there were significant differences between S3, S4, S5 and S2, M2, M8, M7. But the result indicated no significant difference between solutions S3, S4, S5 and reference sample M4. As for solution S2,
no significant difference was found when it was
compared with reference samples M8, M7,
and M2. S2 was considered to be less compact because of its regular pattern of digital and function keys. Among these solutions, S1 was considered to have the strongest compact impres-sion because it has a softly curvatured body and elliptical digital keys. More importantly, its func-tion keys are integrated into a layout close to the display, which reduces the number of rows of digital buttons. On the contrary, design solution S2’s function keys are set in two rows and aligned to the digital keys, which makes it look less compact.
In general, design solutions S4, S5, and S1 were given stronger preferences than the reference samples. Design solution S2 was less preferred than sample M4 but about the same as samples M2, M7, M8. From the preference ranking order, design solutions S4 and S5 were most favored with almost the same degree of preference (preference scores=6.30 and 6.21). Designers, therefore, are encouraged to further combine these two solu-tions, or to develop them into two series of mobile phones. Obviously, it is important for designers to apply the concept of hybridization for the optimal solutions. The technical requirements, brand identity constraints, color, finish, texture and other related specifications should be taken into con-sideration.
5. Conclusions
Eleven image words and 26 mobile phone samples were employed as the stimuli to investi-gate the user’s preference toward the product form for mobile phone design. One hundred and two users participated in the semantic differential test and graded the mobile phone samples according to their first impression of the specific image word and preference. Several multivariate analyses were then performed to examine the relationship between the users’ personal assessments of mobile phones and their design elements. The results indicated that the users prefer mobile phone designs with a style of ‘‘soft’’ and ‘‘compact’’ images. More importantly, the determining factors
of the user preferences were explored to build up the design reference models for mobile phone design. Different design elements, as the results of conjoint analysis reflected, carry different weights in affecting the users’ perception. Finally, a computational approach to search for the optimal solutions for preference as well as for the design trends of soft and compact was proposed. These optimal solutions obtained from the com-piled database can be employed as styling bench-marks for later design development of mobile phones.
The results feature efficiency and variety for generating design ideas. Further investiga-tion, however, is necessary for other products. Moreover, the design trends of a specific product
must be dealt with, especially those that
may conflict with each other. When one design trend is positively related to user’s preferences but the other is negatively related to the preference score, the effect of a specific design element might be deleted. Consequently, the output image might not meet either of the target images. Similar situations should be further considered for the case of three or more design trends.
References
Baxter, M., 1995. Product Design, Practical Methods for the Systematic Development of new Products. Chapman & Hall, London.
Caplan, S., Faulkner, T., 1982. Disc Camera Configuration and user Preference, The third national symposium on factors and industrial design and in consumer products, The Ohio state University, columbus, Ohio, 267-275
Faulkner, T., Rice, T., Heron, W., 1983. The influence of camera configuration on preference. Human Factors 25, 127–141. Magrab, E.B., 1997. Integrated Product and Process Design
and Development, The Product Realization Process. CRC Press, New York, pp. 8–12.
Nakada, K., 1997. Kansei engineering research on the design of construction machinery. International Journal of Industrial Ergonomics 19, 129–146.
Oliver, N., Gardiner, G., Mills, J., 1997. Benchmarking the design and development process. Design Management Journal, Spring 1997, 72–77.
Osgood, C.E., Suci, C.J., Tannenbaum, P.H., 1957. The Measurement of Meaning, Urbana. University of Illinois Press, Champaign, IL.
Swift, P.W., 1997. Science drives creativity: a methodology for quantifying perceptions. Design Management Journal, Spring 1997, 51–57.
Veryzer, R.W., 1997. Measuring consumer perceptions in the product development process. Design Management Journal, Spring 1997, 66–71.