國立政治大學資訊管理學系
博士學位論文
指導教授 : 苑守慈博士
中小企業服務創新價值網路模式設計:
顧客導向與意象模式方法
Value Network Design for Cluster SMEs
Service Innovation: A Customer- Driven and
Imagery Based Approach
研究生 :謝沛宏
II
Acknowledgements
In the four years of Ph.D. study, I have learned many things about academic research and life attitudes. I was lucky enough to have many people supporting me in these years. Especially, when I considered studying Ph.D. program, my family and my advisor, Professor Soe-Tsyr, Yuan, encouraged me to make up my mind. During these years, Professor Yuan taught me to become a researcher with innovative and creative thinking. Without them, I cannot have this achievement. I deeply thank them for their help.
I would like to thank my committee members, Professor Tung-Jung Sung (DT, NTUST), Professor Nai-Yi Hsiao (PA, NCCU), Wei-Yuan Hsu (IM, NTU) and Hsin-Lu Chang (IM, NCCU), for their valuable comments and suggestions on my research and dissertation. Additionally, I am grateful to my Ph.D. classmates and my ex-colleague in NARL for sharing their research and life experiences.
Also, thank AeSL lab Ph.D. members (Andrew, Allen, Katrina, and Alfred), uVoyage members (ShihMing, Charla, and Anderson) and ImageCons members (Kenny, Claude, Diana, Sherry and Claire) for their suggestions, experience sharing and support in these years. I wish you all have a colorful life.
Again, thank my grandmother, father, mother and sister. I will try my best to start my new career. I hope I can not only achieve my goals in my life, but also contribute my capabilities to the society.
I TABLE OF CONTENTS
CHAPTER 1 INTRODUCTION ... 3
1.1 MOTIVATION ... 4
1.2 RESEARCH QUESTIONS AND SIGNIFICANCE ... 7
1.3 RESEARCH OBJECTS ... 9
1.4 OVERVIEW OF RESEARCH METHODOLOGY ... 10
1.5 CONTENT ORGANIZATION ... 12
CHAPTER 2 LITERATURE REVIEW ... 16
-2.1 SERVICE DOMINANT LOGIC AND SERVICE VALUE NETWORK ... 17
-2.2 IMAGE THEORY FOR VALUE REPRESENTATION ... 28
2.3 THE CLUSTER SMES... 30
2.4 THE DEVELOPMENT OF TOURISM AND CLUSTER SMES ... 33
2.5 SUMMARY ... 39
CHAPTER 3 RESEARCH METHODOLOGY... 41
3.1 THE RESEARCH PROCESS ... 42
3.2 CASE STUDY AND INTERVIEW FOR LEISURE AGRICULTURE SERVICE ... 45
-3.3 SYSTEM DYNAMICS APPROACH FOR MACRO EVALUATION OF TOURISM ECOSYSTEM ... 53
CHAPTER 4 ROLES OF SMES IN CLUSTER INNOVATION ... 55
4.1 DEVELOPMENT OF THE LEISURE AGRICULTURE INDUSTRY ... 56
4.2. THE PROPOSITIONS FOR THE EVOLUTION OF SME ROLES ... 59
4.3 DEVELOPMENT OF THE PROPOSITIONS ... 61
4.4 SUMMARY ... 78
-CHAPTER 5 VALUE EVOLUTION AND VALUE NETWORK DESIGN IN SERVICE ECOSYSTEM ... 80
-5.1 THE SERVICE ECOSYSTEM FOR VALUE CREATION IN SERVICE DOMINANT LOGIC ... 81
-5.2 THE DESIGN OF CUSTOMER-DRIVEN AND IMAGERY-BASED VALUE NETWORK ... 90
-5.3 THE PROPOSITIONS AND PROOFS IN CUSTOMER-DRIVEN AND IMAGERY-BASED VALUE NETWORK DESIGN APPROACH ... 96
-5.4 CUSTOMER-DRIVEN AND IMAGERY-BASED VALUE NETWORK DESIGN ... 105
5.5 SUMMARY ... 109
-CHAPTER 6 THE DESIGN OF IMAGERY-BASED SERVICE COOPERATION AND RECOMMENDATION PLATFORM FOR CLUSTER SMES ... 110
-II
6.2 UVOYAGE SERVICE PLATFORM ARCHITECTURE ... 116
6.3 THE SERVICE JOURNEY IN UVOYAGE SERVICE PLATFORM ... 127
6.4 SUMMARY ... 131
CHAPTER 7 EVALUATION OF ARTIFACTS ... 132
7.1 SYSTEM DYNAMICS EVALUATION FOR CIVNDA DESIGN CONCEPT ... 134
7.2 INTERVIEWS AND FOCUS GROUP FOR CIVNDA AND UVOYAGE SERVICE PLATFORM DESIGN . 145 7.3 DISCUSSION ... 164
CHAPTER 8 DISCUSSION AND IMPLICATIONS ... 172
8.1 DISCUSSION ... 172
8.2 IMPLICATIONS ... 190
CHAPTER 9 CONCLUSION REMARKS ... 193
9.1 CONCLUSION ... 193
9.2 RESEARCH CONTRIBUTIONS ... 196
9.3 RESEARCH LIMITATIONS ... 198
9.4 FUTURE RESEARCH DIRECTIONS ... 199
REFERENCES ... 201
APPENDIX IMAGE MODELING, MIXING AND MATCHING IN UVOYAGE ... 213
A.1 COLOR IMAGERY SCALE ... 213
A.2 THE DETAIL DESIGN IN IMAGE MODELING MODULE ... 215
A.3 THE DETAIL DESIGN IN IMAGE MIXING MODULE ... 218
A.4 DETAIL DESIGN IN IMAGE MATCHING ... 221
APPENDIX B SME ALLIANCE SERVICE FORMATION IN UVOYAGE ... 223
B.1 GOAL COMPREHENSION MODULE ... 224
B.2 CANDIDATES GENERATION MODULE ... 227
-III LIST OF FIGURES
Figure 1.1 Information System Research Framework ... - 11 -
Figure 1.2 Summary of the Study to Design Science Framework ... - 14 -
Figure 1.3 The Dissertation Outline ... - 15 -
Figure 2.1 Conceptual Model of Service Value Network ... - 21 -
Figure 2.2 Relationships between Different Images ... - 29 -
Figure 2.3 Components of Destination Images ... - 37 -
Figure 3.1The Research Process ... - 44 -
Figure 3.2 Scenery in Pillow Leisure Agriculture Area (1) ... - 48 -
Figure 3.3 Scenery in Pillow Leisure Agriculture Area (2) ... - 48 -
Figure 3.4 Scenery in Pillow Leisure Agriculture Area (3) ... - 49 -
Figure 3.5 Scenery in Pillow Leisure Agriculture Area (4) ... - 49 -
Figure 3.6 System Dynamics Steps ... - 54 -
Figure 4.1 The Relational Diagram of the Tour Regional Development ... - 65 -
Figure 5.1 The Material Balance Principle ... - 82 -
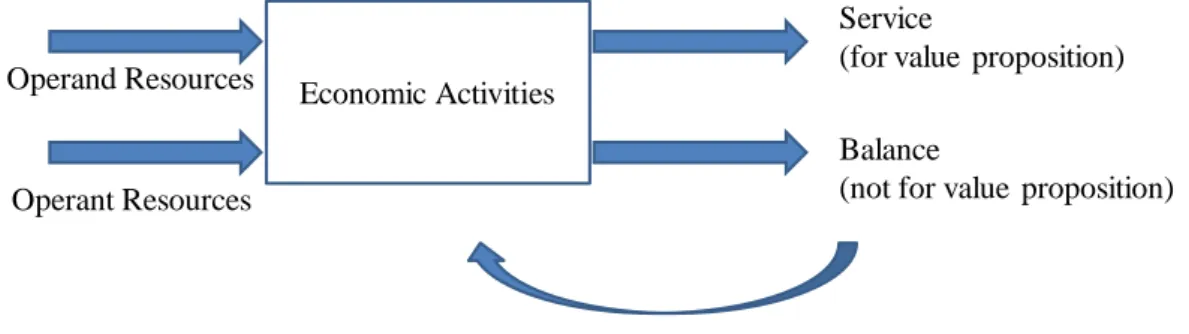
Figure 5.2 Input and Output of Traditional Economic Activities ... - 85 -
Figure 5.3 Input and Output of Economic Activities under SDL ... - 86 -
Figure 5.4 The Service Ecosystem for Value Creation in Service Dominant Logic ... - 88 -
Figure 5.5 Relationships of Components in CIVNDA ... - 92 -
Figure 5.6 Relationships of Images between Different Businesses and Cooperation Goal ... - 99 -
Figure 5.7 Example for Customer-driven and Imagery-based Value Network ... - 108 -
Figure 6.1 Relationships among the Underlying Theories uVoyage Conceptual Framework ... - 112 -
Figure 6.2. uVoyage Conceptual Framework ... - 115 -
Figure 6.3 uVoyage Service Platform Architecture ... - 119 -
Figure 6.4 The Service Interactions and Journey between Businesses and Tourists... - 128 -
Figure 6.5 The Service Interactions and Journey between Destinations and Tourists ... - 128 -
Figure 6.6 uVoyage Snapshot – B2C Search and Recommendation ... - 129 -
Figure 6.7 uVoyage Snapshot – B2B Cooperation Proposal (1) ... - 130 -
Figure 6.8 uVoyage Snapshot – B2B Cooperation Proposal (2) ... - 130 -
Figure 7.1 The Evaluation Design ... - 133 -
Figure 7.2 The Model for Regional Tourism Ecosystem Development ... - 136 -
Figure 7.3 The Simulation Model for Regional Tourism Ecosystem Model Development ... - 137 -
Figure 7.4 Average Numbers of Tourists in the Region in the Three Cases ... - 143 -
Figure 7.5 The Attraction of Unique Destination Images in the Three cases ... - 143 -
Figure 7.6 The Numbers of Tourists in the Three Cases ... - 144 -
Figure 7.7 The Amount of Regional Tourism SMEs in the Three Cases ... - 144 -
IV
Figure 7.9 The Role of CIVNDA in Tourism Region Development ... - 169 -
Figure 7.10 The Service Imagery-based Regional Development Model ... - 170 -
Figure 8.1 The Evolution of Brand Image and Service Imagery ... - 176 -
Figure 8.2 The Diffusion of Service Imagery ... - 180 -
Figure 8.3 The Generalization of Service Imagery ... - 182 -
V LIST OF TABLES
Table 2.1 The Logic Shift from GDL to SDL ... - 18 -
Table 2.2 Stages for Network Value Analysis ... - 22 -
Table 2.3 Studies on Value Network from the Economics or Social Psychology Perspective ... - 26 -
Table 2.4 Characteristics of Industry Clusters ... - 31 -
Table 2.5 Summary of National Tourism Development Policies ... - 35 -
Table 3.1 Rigor of the Study ... - 46 -
Table 3.2 Respondent Information of Interview in in the First Stage ... - 51 -
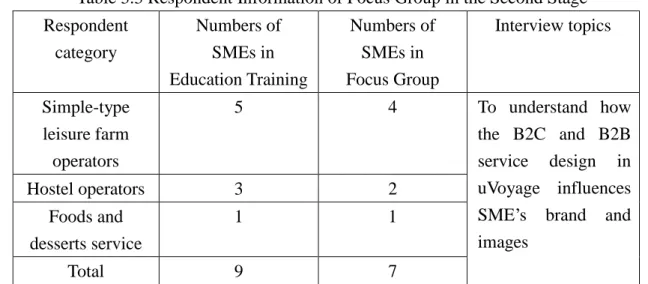
Table 3.3 Respondent Information of Focus Group in the Second Stage ... - 52 -
Table 3.4 Respondent Information of Focus Group in the Third Stage ... - 52 -
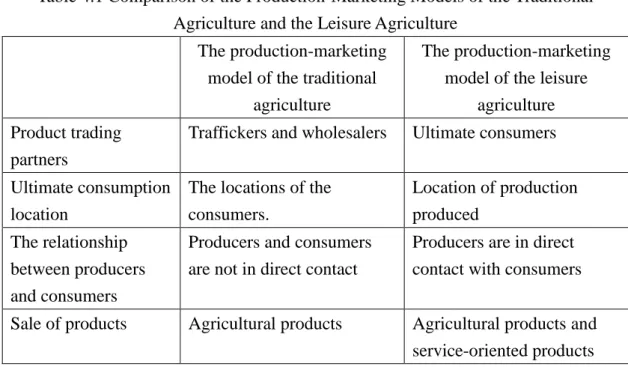
Table 4.1 Comparison of the Production-Marketing Models of the Traditional Agriculture and the Leisure Agriculture ... - 58 -
Table 4.2 Wants-Needs Analysis Chart ... - 62 -
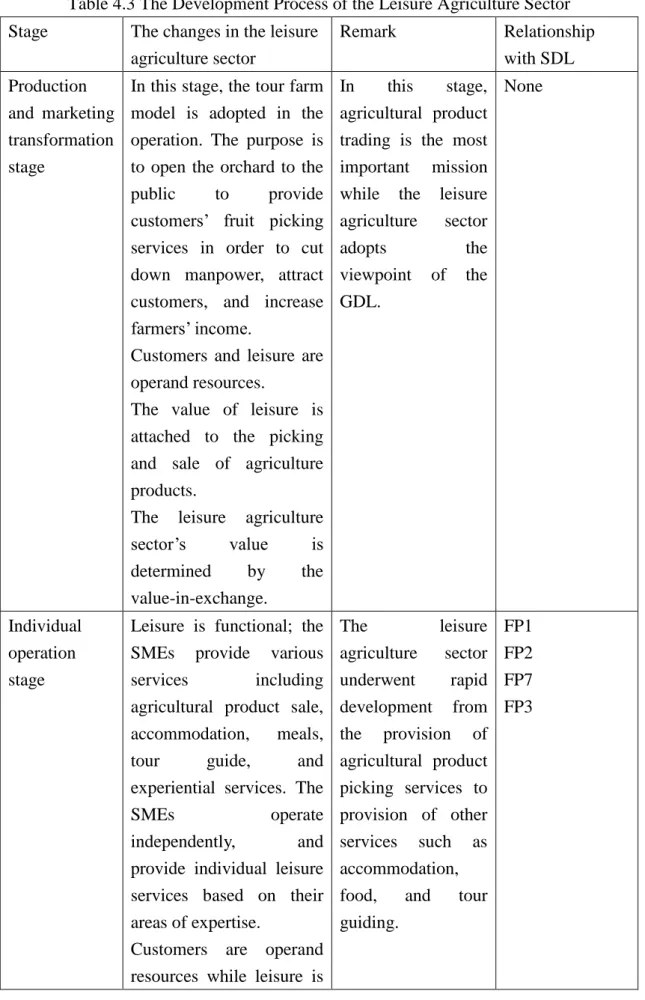
Table 4.3 The Development Process of the Leisure Agriculture Sector ... - 66 -
Table 5.1 Components in Customer-Driven and Imagery-Based Value Network... - 92 -
Table 6.1 Alliance Feasibility Measurement Index... - 126 -
Table 7.1. Parameters for the Regional Tourism Ecosystem Model ... - 138 -
Table 7.2 The Summary of the Interviews and Focus Group Data in Mt. Pillow Leisure Agriculture Area ... - 146 -
Table 7.3 Important Stakeholders in the Interviews ... - 147 -
Table 7.4 Summary of Findings in the Development of a Value Network with Different Stages ... - 151 -
Table 7.5 Summary of Findings in the Different Operation Strategy in Yilan ... - 160 -
Table 7.6 The Difference between Brand Image and Service Imagery ... - 168 -
Table 8.1 The Evolution of Brand Image and Service Imagery ... - 179 -
Table 8.2 Summary of Required Expectation of the Information System Development in Different Evolutionary Stages of Regional SMEs Roles ... - 189 -
- 1 -
Value Network Design for Cluster SMEs Service Innovation:
A Customer- Driven and Imagery Based Approach
Abstract
Evolution of the global economic system has significantly impacted on customer behaviors. The service economy era has accompanied rapid growth of the service industry. This work focuses on service innovation enhancement for cluster SMEs, which play important roles in the global economic system. These SMEs, which have specific knowledge and capabilities, are keys to improving customer service experiences. However, the entire service system has evolved, as have customer behaviors. In addition to understanding how service value is created, interactions between economic, social, and environmental systems during value creation are also crucial for the sustainable development of service industries. For service systems consisting of SMEs, the design of a value network for clustered SMEs still faces huge challenges in finding key value propositions and assessments for value creation.
To assess service value, relationships, and customer feedback from both economic and social psychology perspectives, this research proposes a novel service ecosystem for value creation in service dominant logic and customer-driven and imagery-based value network design approach (CIVNDA) grounded in service dominant logic and image theory. The CIVNDA (1) provides a framework for designing and configuring a service value network that can identify the roles and value propositions of each partner; (2) provides a novel service imagery representation to characterize services of businesses from a customer psychological
- 2 -
perspective; and (3) generates appropriate partners for specific cooperation goals and service journey designs.
Due to the importance of information technology in service innovation, integration, and provision, this research also implements an ICT-based service platform—uVoyage using color image scale and metaphor theory. Tourism is selected as the study industry to evaluate the effects of the CIVNDA and the uVoyage service platform. Interview and focus group results (1) show that four different evolutionary stages of tourism SMEs exist when adapting to the current service economy era; (2) indicate how the CIVNDA and uVoyage platform facilitate value co-creation for tourism SMEs during different evolutionary stages; and (3) demonstrate how the features of service imagery differ from brand images and can be utilized to bridge gaps between product design and customer-driven service design.
This research can contribute to our understanding of service system ecology and service value evaluation in service value network designs consisting of SMEs in the tourism, design, cultural, and creativity service industries. The proposed concept of service imagery also guides future innovative research and outcomes of service value network design.
Keywords: Service System Design, Value Network, Service Imagery, Service Innovation, Service Science
- 3 -
Chapter 1 Introduction
The development of human economics, society, and the environment has followed the trend of sustainable development since 1987 (World Commission on Environment and Development, 1987). Sustainable development means “development that meets the needs of the present without compromising the ability of future generations to meet their own needs” (Costanza et al., 1997; Kates et al., 2004). The interactions among economics, society and the environment system have shifted the dominance and focus of economic theory (Mulder and Van Den Bergh, 2001). The core concept of the sustainable development evolutionary approach has made evolutionary economics one of the mainstream economic areas (Nelson, 1995). In other words, the evolutionary economy is concerned with understanding changes in the environment and social system for long-term economic development and co-evolution with the environment (Norgaard, 1984).
The industrial revolution changed the methods in which industries manufacture goods, and human life has improved rapidly due to increased production efficiency. Mass production following industrialization facilitated the production of large amounts of standardized products for consumers. The paradigm of human economic activities has gradually shifted from the manufacturing sector to the service sector. With the advent of a service economy, the output value of economic activities is progressively measured by their benefit to customers, and the complexity and activities in economic networks (i.e., value networks) are increasing. The way of value creation evolves from value chain to value networks in the service economy (Vargo and Lusch, 2004, 2008). Economic, social and environmental actors are involved and interact in the value creation process in the value network.
- 4 -
A value network represents delivered output value, relationships, and the structure of businesses (Allee, 2002; Peppard and Rylander, 2006). Analysis and design of a value network can improve value creation (Basole and Rouse, 2008; Peppard and Rylander, 2006). The challenge in value network modeling is to provide a systematic method that can construct an ecosystem (Tian et al., 2009; Blau et al., 2010). A service ecosystem involves the interaction between economic, social and environment system. The evolution of economic system and changes in customer behavior would influence the definition of value and value creation in a service ecosystem. This research investigates methods for enhancing the synergy of value networks for long-term sustainability of a cluster through imagery-based value quantification and integration in value networks. To achieve this goal, a novel value network design approach along with the information and communication technology (ICT) service system architecture for industrial clusters is applied and evaluated through the lens of service science, management, and engineering (SSME).
1.1 Motivation
1.1.1 The Role of SME in Service Economy
Small- and medium-sized enterprises (SMEs) are disadvantaged in today’s global economic system. The size of an enterprise can be classified based on its number of employees, annual turnover, and balance sheet statistics (European Commission, 2005). An enterprise with no more than 250 employees and generates more than €50 million in annual turnover or €43 million on its annual balance sheet is considered a medium-sized enterprise. In Taiwan, an enterprise with fewer than 200 employees and less than NT$80 million in capital is an SME. Thus, SMEs have limited financial and human resources, which result in a lack of investment in both technology and
- 5 -
management skills when compared with those of multi-national enterprises (MNEs). However, SMEs are the main drivers of innovation in developed economic systems (OECD, 2009). These SME are characterized by low production and cost and a high degree of flexibility. Local knowledge and culture can be used to create better service experiences than those offered by MNEs. Additionally, the sustainability of SMEs is positively related to job security and economic growth (OECD, 2008a, 2008b, 2010).
Cooperation is an important strategy for SMEs to maintain growth and innovation capabilities by overcoming disadvantages associated with resources, capabilities, and financing, and by sharing risk with partners and competing with MNEs (Merrifield, 2007; Lu and Beamish, 2001; Pitelis and Pseiridis, 2006). Relationships between cooperative SMEs make cluster SMEs in economic networks, which have high performance in terms of resource access and low operating cost (Navickas and Malakauskaite, 2009). Additionally, clusters help enterprises enhance productivity, technical innovation, and competitive performance (Karlsson et al., 2005). The growth of cluster SMEs facilitates the development of regional economies and creates beneficial economic networks.
Generally, three clusters have been identified (Gordon and McCann, 2000). The pure agglomeration, industrial complex, or social network clusters have different characteristics based on relationships among enterprises in the cluster. Cluster SMEs provide resources and information and contribute to innovation capability to maintain the cluster. However, the service economy impacts relationships among businesses, including those among SMEs. When the value chain in the traditional economic system is extended to value networks in the service industry, the characteristics of cluster SMEs are transformed to embrace the service economy. Furthermore, the
- 6 -
transformation of economic systems can impact both social and environmental systems. An investigation of the transformations of cluster SMEs will contribute to our understanding of cluster features.
1.1.2 Service Science in Service Economy
Service science is an interdisciplinary knowledge that studies the design and implementation of service systems. A service system is a platform integrating technology, and operand and operant resources for value co-creation. The term “service” is defined as an economic activity that creates benefit for customers. A service system designed for service provision is concerned with how to co-produce value within a value network (Spohrer et al., 2007). Since the service economy changes the global industrial structure, the service industry has grown rapidly. Services, instead of products, have become the primary output of many economic systems. Thus, service-dominant logic (SDL) is a foundational theory in service science (Vargo and Lusch, 2004, 2008). To understand an economic system under influence by a service economy, service science research provides knowledge of service system evolution and value co-creation, which can be applied to improve service systems (Spohrer and Maglio, 2008; Spohrer et al., 2007). Additionally, with advances in ICT, the study of service science is also integrated with ICT system engineering. Service systems with ICT enable efficient improvements in resource integration, service productivity, and service innovation.
As members of economic systems, SMEs are also affected by trends in the service economy. The shifting logic of output value determination from goods-dominant logic (GDL) to SDL redefines the business model and value provision of enterprises (Vargo and Lusch, 2004, 2008). For SMEs to deal with this
- 7 -
shifting logic, service science and ICT-enabled design and development of service systems are believed to be important topics for exploration.
1.2 Research Questions and Significance
When the global economic system is transforming into customer-centric, the structure and relationships inside economic systems also evolve. For instance, the industrial revolution rapidly increased product delivery efficiency, and advances in ICT allow people to communicate instantaneously without geographic constraints. Both examples have a huge impact on the structure and relationships in the global economic system. The service economy should not be an exception. Therefore, existing cluster SMEs also evolve with economic systems. When value creation in the service economy differs from that in the traditional economy, the balance between the growth of economic, social, and environmental systems can change. This research attempts to answer three research questions to understand the evolution of service ecosystems and cluster SMEs and to identify methods that improve productivity, innovation capabilities, and the growth of a cluster SME. These three research questions are as follows.
1. What is the evolutionary path of a cluster SMEs when adapting to trends in the service economy?
This research question is used to understand why an SME joins a cluster and the benefit a cluster provides to SMEs in different economic system stages. Answering this research question requires that one study the background and characteristics of cluster SMEs and construct propositions related to the evolutionary path of cluster SMEs. Analyzing cluster SMEs in a service economy is the first step in configuring
- 8 -
the innovative value network design for cluster SMEs.
2. How does one design a value network for cluster SMEs with productivity, innovation, and growth improvements in a service economy?
For cluster SMEs competing with clusters in an entire economic network, overcoming drawbacks of SMEs and enhancing the contributions of cluster SMEs to the economic system are necessary tasks. A value network describes the roles of and relationships among each participant, and is the value output in an SME cluster. Thus, value network analysis can be utilized to identify a cluster’s bottlenecks. Notably, the efficiency of a value network can be improved using a novel design approach.
In this research question, the elements of and relationships in a value network must first be identified and modeled. Image theory (Beach, 1990), which addresses psychological value cognition, is used to model both tangible and intangible output values. Image theory provides a good foundation for modeling service value using imagery. Consequently, this research question also has three sub-questions. What are the characteristics of output value from cluster SMEs? How can one describe and quantify tangible and intangible value output from cluster SMEs? How does one encourage interactions among SMEs for value co-creation? The proposed value network design approach in this research is based on answers to these sub questions.
3. How does one design an ICT-based service system that facilitates a value network to enable value co-creation in cluster SMEs?
In a service economy, output from economic activities is both tangible goods and intangible services. The application of ICT has been proven to improve manufacturing processes, reduce transaction costs, and enhance goods delivery. Value co-creation
- 9 -
among enterprises in a value network is strongly emphasized in SDL. Notably, ICT efficiently enhances output from service systems and deals with the increasing complexity during the extension of a value network. Resources and value can then be effectively integrated and delivery in the ICT-enabled value network (Basole and Rouse, 2008). Therefore, the design of service system architecture is crucial to value co-creation in cluster SMEs.
1.3 Research Objects
The objects of this research are the evolution of a service ecosystem and the evolutionary path of cluster SMEs during service economy transformation. Based the understanding of how cluster SMEs evolve, a novel value network design approach for cluster SMEs is proposed. The design of the value network should analyze the characteristics of service value of each business from customer service experiences on the Internet and the service value of cooperative services according to business characteristics. Additionally, ICT-based service system development toward a value network design can cause artifacts to improve service industry growth based on a study of service ecosystem evolution. In short, this research contributes to literature in the following ways:
Propose a conceptual framework of a service ecosystem to describe the shift from GDL to SDL in the value creation process, and a model of the evolutionary path of cluster SMEs in one industry on the basis of SDL. A pilot study is conducted to analyze other service industries. The characteristics of evolutionary stages of the cluster SMEs in the proposed model are determined to understand the differing needs in SDL adaption. The conceptualization of service value creation in the service ecosystem provides a theoretical contribution to service science in service
- 10 -
value network design and service innovation.
Propose a novel value network design approach and configuration that can facilitate resource integration among SMEs at the value level and predict benefits of SME cooperation. Customers are also involved in the value co-creation process in the entire value network design by contributing preferences for images for service value evaluation. Once co-created value can be presented and evaluated, the adoption by cluster SMEs of SDL would run smoothly.
The implementation of the ICT-based service system, based on the imagery-based value network design approach, produces valuable artifacts for service science management and engineering (SSME) to examine the effect of ICT on the value co-creation process.
1.4 Overview of Research Methodology
This research uses the information system (IS) research framework proposed by Hevner (2004) as its research methodology. The seven guidelines of this methodology (Table 1.1) indicate that research should produce viable artifacts from relevant business problems based on relevant theories and methodologies. The artifacts from well-designed evaluations can contribute to theoretical refinements through the rigorous processes. The goals of this research are to apply a novel value network design approach and implement a technology-based service system to characterize the evolution of cluster SMEs. Therefore, the IS research framework provides a foundation to test artifacts of the implemented service system.
The leisure agricultural service, which is a sector of the tourism industry, is selected as the focus business environment. Transformation from production to
- 11 -
service in recent years in leisure agriculture is the research background. In Taiwan, since the first farm tour in 1965 (Taiwan Leisure Farming Society, 2004), the number of leisure agriculture operators has increased to 5,829 at by end of 2005 from 1965. This rapid growth indicates that leisure agriculture has become a major operating model for transforming traditional agriculture (Tuan, 2007). For each research question, the model of cluster SME evolution, the imagery-based value network approach, and ICT-based service system architecture are constructed first to produce artifacts for evaluation. The artifacts produced from evaluation data should contribute to Taiwan’s tourism industry, service science research, and related theories.
Figure 1.1 Information System Research Framework (Hevner et al., 2004)
- 12 -
Table 1.1 Guidelines of Design Science Research (Hevner et al., 2004)
Guideline Description
Guideline 1: Design as an Artifact Design-science research must produce a viable artifact in the form of a construct, a model, a method, or an instantiation.
Guideline 2: Problem Relevance The objective of design-science research is to develop technology-based solutions to
important and relevant business problems. Guideline 3: Design Evaluation The utility, quality, and efficacy of a design
artifact must be rigorously demonstrated via well-executed evaluation methods.
Guideline 4: Research Contributions
Effective design-science research must provide clear and verifiable contributions in the areas of the design artifact, design foundations, and/or design methodologies. Guideline 5: Research Rigor Design-science research relies upon the
application of rigorous methods in both the construction and evaluation of the design artifact.
Guideline 6: Design as a Search Process
The search for an effective artifact requires utilizing available means to reach desired ends while satisfying laws in the problem
environment. Guideline 7: Communication of
Research
Design-science research must be presented effectively both to technology-oriented as well as management-oriented audiences.
1.5 Content Organization
The dissertation comprises nine chapters. Figure 1.3 shows the dissertation outline. Chapter 2 is the theoretical foundations. The contents in Chapter 2 are the knowledge base in the entire IS research framework. Chapter 3 details the methodology of this research. The contents of Chapter 4 are for the research question 1 which indicates the relevant business questions in the service economy environment. A case study for the research question 1, the development process model of SME in
- 13 -
service innovation, and related proposition and implication are included. In Chapter 5, this research presents two design artifacts: the service ecosystem for value creation in service dominant logic and the propositions for customer-driven and imagery-based value network design. Chapter 6 describes the ICT-based service system design - the uVoyage framework and service system architecture as the third design artifact. The underlying theories of each module in uVoyage system are also explained. The design of uVoyage service system aims to create artifacts to evaluate the customer-driven and imagery-based value network design in Chapter 5. Chapter 7 reports the evaluation and data collection for the entire research design by using system dynamics approach, interview and focus group. In Chapter 8 the findings and implication in the entire study are discussed. Finally, Chapter 9 concludes this research, limitation, and future research directions.
According to design science framework, artifacts should be found to contribute both the business environment and knowledge base. The artifacts, the evolutionary stages of tourism SME cluster development and service imagery, were found from the study of the service ecosystem for value creation in service dominant logic, customer-driven and imagery-based value network design approach (CIVNDA) and uVoyage design. Figure 1.2 illustrates the summary of the contents in this research in design science framework. For the contributions to business environment, the design of CIVNDA and uVoyage service platform is dedicated to tourism industry and also other service industries consisted of cluster SMEs in the improvement of value network design. For theoretical contributions, this research proposes a service ecosystem (Figure 5.4) to comprehend how service values are created, what are the roles of the economic system, social system and environment system in service value creation processes and why service value, recyclable resources and wastes are created
- 14 -
in the ecosystem.
The study of cluster SMEs in tourism further derives the four stages of cluster SMEs evolution to explain the phenomena of the product-based to service-based economy transformation. And this research also proposes a new concept - service imagery which is different from brand image and destination image for service value representation. With the combination of service imagery, CIVNDA and uVoyage design, this research is believed to have contributions to the service industry. To detail the connections between the artifacts and the service industry, in this chapter, this research discusses the artifacts and the impact to the service industry.
Figure 1.2 Summary of the Study to Design Science Framework
Cluster SMEs -Leisure agriculture service in Tourism Environment Strategy: - Productivity - Innovation - Growth Technology -uVoyage Service Platform
•Service Ecosystem for Value Creation in Service Dominant Logic •Value Network Design - CIVNDA •uVoyage service experiences IS Research •Case Study •Interview •System Dynamics •Focus Group Assess Refine Knowledge Base •Service Science - SDL - Value Network •Image Theory •Destination Image •Metaphor Theory •Color-Image Model Apply to Tourism and Service Industry
Additions to Knowledge Base
- 15 -
Chapter 1 Introduction
Chapter 2 Literature Review
Chapter 3 Research Methodology Chapter 4 Roles of
SMEs in Cluster Innovation
Chapter 5 Value Evolution and Value
Network Design in Service Ecosystem
Chapter 6 The Design of Imagery-Based Service
Cooperation and Recommendation Platform for Cluster
SMEs Chapter 7 Evaluation of Artifacts
Chapter 8 Discussion and Implications
Chapter 9 Conclusion Remarks
- 16 -
Chapter 2 Literature Review
Service industry is flourishing in the global economic system. In response to the trend of service economy, the research of service science aims to develop scientific theories to improve service systems. Service dominant logic (SDL) is one of the foundational theories in service science discipline. The insight of SDL redefines the relationships between service providers and customers, the logic of value creation and service provisioning (Vargo and Lusch, 2004). The concept of service value networks is extended from value chains in the viewpoint of SDL (Lusch et al., 2008). Studies on service value network involve the dynamic interactions among businesses and customers, value linkage in both B2B and B2C relationships and other enablers (e.g., ICT and government policy). In this research, the design of imagery-based value network is the primary focus. Therefore, in this chapter, SDL and value network related studies will be described first. To identify the value created in an imagery-based value network, the image theory is subsequently illustrated from the psychological viewpoint for both operant and operand inputs. The previous studies of cluster enterprise and their evolution logic differentiating from SDL will also be provided. In addition, the past research on SME cluster in the specific domain of tourism will be described as well. At last, a discussion of why the imagery-based value network design approach for SME clusters is required to be carried out to advance the state of the art in either value network design or cluster SME evolution.
- 17 -
2.1 Service Dominant Logic and Service Value Network
2.1.1 Service Dominant Logic
Changes in consumer behavior have increased the importance of service value and competitive strategy leading to their importance surpassing that of tangible physical products, thus making the consumer market more service-oriented. Vargo and Lusch (2004) believe that the structure of the consumer market has evolved from product-based to service-based. The focus of consumer market development lies in transforming the traditional Goods-dominant logic (GDL) into the SDL, where the SDL is considered an evolutionary process of the consumer market. SDL stresses that services are a process rather than an output unit; the focus thus lies in operant resources (such as knowledge, skill and customer) rather than operand resources (such as natural resources); the value of service lies in collaboration involving the provider and consumer (value-in-use) rather than the creation and delivery process from the producer to the customer (value-in-exchange) (Vargo and Lusch, 2004, 2008).
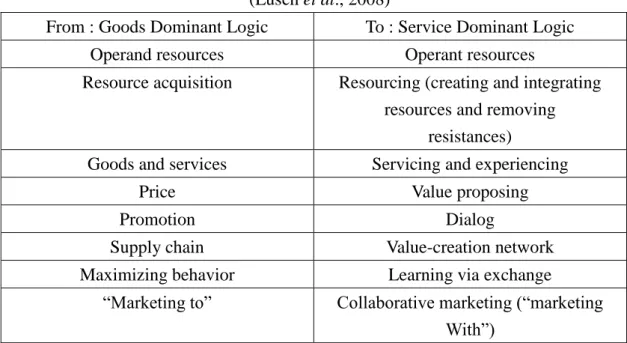
Table 2.1 shows the differences between GDL and SDL. The value of service provided is no longer only determined by producers. Instead, producers propose their value proposition to consumers and the service value is determined after consumers’ service experiences (Vargo and Lusch, 2004; Sandstrom et al., 2008). Therefore, in order to create attractive value proposition, the interactions between firms are necessary, but are not only exchange operand resources only. Firms can share their operant resources including the needing from their customers to create innovative service (Vargo and Lusch, 2004; Vargo et. al, 2009). Consequently, an original value chain among firms would extend to a value network which enables more innovative services driven by customers (Lusch et al., 2008; Lusch et al., 2009). The value
- 18 -
co-creation process in SDL then is able to foster both growth and innovation among cooperated firms (Michel et al., 2007).
Table 2.1 The Logic Shift from GDL to SDL (Lusch et al., 2008)
From : Goods Dominant Logic To : Service Dominant Logic
Operand resources Operant resources
Resource acquisition Resourcing (creating and integrating resources and removing
resistances)
Goods and services Servicing and experiencing
Price Value proposing
Promotion Dialog
Supply chain Value-creation network
Maximizing behavior Learning via exchange
“Marketing to” Collaborative marketing (“marketing With”)
Vargo and Lusch(2004, 2008) also mention that SDL has ten foundational premises (FPs). FP1 indicates that services are the basis for all transactions, and thus involve the application of operant resources, such as knowledge and skill. Tangible physical products are considered sales channels provided by services (FP3). From the perspective of the GDL, goods produced by enterprises can create value, and consumers are the users of the value of those goods. However, the SDL takes a different perspective. SDL stresses “resource integration” (FP9) and “creation of value” (FP6) where the customer is considered an operant rather than an operand resource. The SDL implies a process-oriented logic. The emphasis is on generating value-in-use rather than the traditional value-in-exchange viewpoints. Therefore, the SDL stresses that each value is unique and determined by the beneficiary (FP10). When an enterprise is able to integrate operant and operand resources, the environment can in turn produce value. This signifies the existence of a variety of
- 19 -
transactional relationships (FP8). The enterprise is unable to control value, but it can provide the orientation of value (FP7).
These foundational premises revealed the existence of value in a complex and operant service system environment, and that the subjects not only include enterprises and customers, but also environmental groups and other relevant personnel. Moreover, Vargo and Lusch also emphasized that services possess different characteristics to physical products, including intangibility, simultaneity, heterogeneity, and perishability. Services can be considered a subjective interactive process between provider and receiver, involving the transfer and use of knowledge and skills, as well as early and later stages of the operation. Traditionally, quality services involve highlighting customization and avoiding standardization. However, advances in digital technology have enabled customized service and standardization. Particularly, quality services enable breakthroughs in traditional service characteristics (e.g. intangibility, simultaneity and perishability).
The insight of SDL contributes to the research in the development of service economy. In this research, SDL provides the theoretical foundation about how the value creates. The concept of value-in-use indicates that the service value is driven by customers after their service experience. Service providers should keep improving their services based on customer’s feedback and design excellent services for competitive advantages. In addition, the improvement of service design depends on not only the efforts from service providers but also their partners. Traditional supply chain in GDL primary emphasizes on the resource integration and management. The synergy of supply chain among business cooperation mainly contributes to the service delivery process which is only part of the entire service processes. SDL, on the other
- 20 -
hand, concerns about the new resources created to benefit customers (e.g., innovative services, distinguished service experiences) based on value co-creation (including business cooperation) which can enhance the entire service processes. With the increasing complexity of business cooperation under SDL, value chain accordingly is evolved into service value network. Therefore, service value network instead of traditional supply chain becomes crucial to compose attractive value propositions for customers.
2.2.2 Service Value Network
In SDL, businesses offer service to customers rather than products. A service integrates both operand and operant resources and service value determination is from service experiences. In other words, a service provision combines both intangible value (i.e. knowledge, competence) and tangible value (i.e. financial capital, physical resources) from suppliers and is measured by customers after delivery. The increasing complexity in business to business relationships and business to customer relationships reconfigures the economic system. Therefore, the changes from products to service make firms to extend the traditional value chain focused on manufacturing to value network. A value network is defined as “a set of roles and interactions in which people engage in both tangible and intangible exchanges to achieve economic or social good” (Allee, 2008). The participants in a service value network are independent but have complementarity (Peppard and Rylander, 2006). Characteristics of a value network contain “co-produce service offering”, “exchange service offerings” and “co-create value” (Lusch et al., 2009). In other words, a service value network comprises more than one value chain.
The roles in a service value network contain consumers, service providers, tier 1 and 2 enablers, and auxiliary enablers (Basole and Rouse, 2008). The relationships in
- 21 -
a service value network are divided into B2B, B2C and C2C relationships. These relationships are influenced by social, technological, economic and political context. Figure 2.1 shows the conceptual model of service value network.
Figure 2.1 Conceptual Model of Service Value Network (Basole and Rouse, 2008)
In the service value network conceptual model, the role of service providers is the integrator and provides service which customers expect. Customers consume service and determine service value. Service providers depend on enablers to supply resources and help service design. Tier 2 enablers provide resources to tier 1 enablers and tier 1 enablers directly supply resources to service providers. Auxiliary enablers such as government and information technology and four contexts influence the entire ecosystem. Under SDL, service providers in a value network deliver service to customers and receive benefit after service experienced by customers. Service providers and enablers in a value network convert their operant and operand resources to value proposition to customers together. Then the value proposition is converted into service value via customers. In other words, service providers, enablers and
- 22 -
customers co-create service value. In a broader sense, the B2B relationships enable B2C service value and B2C relationships determine B2B service value (Basole and Rouse, 2008). As soon as customers decide the B2C service value, the B2B service value between each service provider and enabler is also determined.
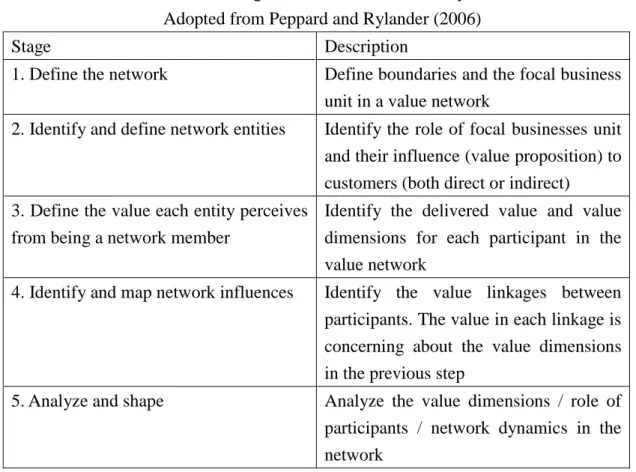
The network structure highly influences the firm performance and industry evaluation (Madhavan et al., 1998; Todeva and Knoke, 2005). Value network analysis (VNA) offers a viewpoint to comprehend the roles, relationships and interactions in a value network for value creation (Allee, 2008). Peppard and Rylander (2006) proposed a five stages network value analysis to show where the value created in a value network. The five stages are described in Table 2.2.
Table 2.2 Stages for Network Value Analysis Adopted from Peppard and Rylander (2006)
Stage Description
1. Define the network Define boundaries and the focal business unit in a value network
2. Identify and define network entities Identify the role of focal businesses unit and their influence (value proposition) to customers (both direct or indirect) 3. Define the value each entity perceives
from being a network member
Identify the delivered value and value dimensions for each participant in the value network
4. Identify and map network influences Identify the value linkages between participants. The value in each linkage is concerning about the value dimensions in the previous step
5. Analyze and shape Analyze the value dimensions / role of participants / network dynamics in the network
In all NVA stages, understanding what kind of value delivered precisely to each participant in the value network is the most important (Peppard and Rylander, 2006).
- 23 -
Due to value propositions which consume operant and operand resources having functional and emotional types (Sandstrom et al., 2008), the value creation after service experience has functional outcome and emotional outcome. Therefore, the value consists of intangible and tangible part and the measurement of value for different customers become dynamic and complex.
From organization theory viewpoint, a sustainable network which is an analogy to an organization must be effective to achieve the wanted results and efficiency to maintain itself (Jarillo, 1986). In other words, the existence of a network among business relies on the performance (e.g., lower transaction cost, profit) and shares outcome to network members for their satisfaction. Components in a network include links (relationships) and connection nodes (businesses). From effectiveness and efficiency viewpoint, the network design seeks for both the lowering of transaction cost and the growing of profitable among network members (Jarillo, 1986). In the analysis of network, economic researchers focus on appropriate allocation of cost to evaluate the network efficiency (Economides, 1996). The service value of the network then depends on the creation of network externalities which bring more transaction between businesses and customers (Economides, 1996; Lazzarini et al., 2001). Network externalities occur when innovation happens to benefit the nodes or the expected numbers of customers buying increases (Lazzarini et al., 2001). Therefore, from the economics perspective, customer increasing in a network means the raise of service value to other customers (Stabell et al., 1998). The design of network from the economics perspective then seeks for the network efficiency and effectiveness by achieving allocation efficiency (Jackson and Wolinsky, 1996; Conte et al. 2010) or Nash Equilibrium under game theory (Lederer, 2001).
- 24 -
On the contrary, from the social psychology standpoint, the source of value is not the same with the economic viewpoint. Service value in value network is from the connected business relationships which aim for the growth of network performance (Holm et al., 1996). In this sense, the social exchange theory and social network theory is applied for measuring service value from relationships (Holm et al, 1996; Allee, 2000; Lazzarini et al., 2001). This approach measures value from the social exchange theory which integrates psychology, sociology and economics (Homans, 1958). Social exchange theory views social behavior as an exchange of material and non-material goods. Holm et al (1996) indicated that a set of connected businesses relationships made value creation possible in a network. For the value definition in service value network from the social psychology aspect, Allee’s work in 2008 converted all intangible value such as customer satisfaction, relationships or influence in a value network into deliverables In other words, both tangible and intangible value can be expressed as the deliverables (e.g., document as a tangible deliverable and psychological counseling as an intangible deliverable) which are the actual received value of participants in the value network (Allee, 2008). In this viewpoint, intangible value is generated from the difference between benefits which are the favors extended from others and their cost while tangible value is from the difference between revenue and cost.
Tian et al. (2008) and Caswell et al. (2008) further extended Allee’s work by integrated game theory to model the interactions and relationships in a service value network. They tried to integrate both economic and social psychological related theories to construct a service system model and calculate the service value by formulating the relationships among entities in the service system for understanding the value offering and transferring. By observing service system behaviors about
- 25 -
value, customer’s satisfaction and the gaps between expected value and perceived value can be compared for increasing value and reducing cost.
Allee in 2000 argued about the creating of value from value network instead of value chain which is close to the idea in SDL. Among these research, Allee (2008) and Caswell et al. (2008) concerns intangible value, especially in Allee’s research which primary focused on how intangible and tangible value merge for value network analysis. On the other hand, Conte et al. (2010) and Tian et al. (2008), emphasized on the interactions among firms in a value network. Although the game theory served as a grounding theory for Caswell’s work and Tian’s work, Caswell only used the game theory to address the outcome of business’s choices on whether or not to cooperate with specific partners, and Tian’s work applied the game theory to model the detailed preference of businesses. Caswell et al. (2008) viewed service value as benefits including tangible value (revenue) and intangible value (value of relationships) minus opportunity cost. Tian et al. (2008) aimed for modeling a service ecosystem and assessed service value from revenue and cost.
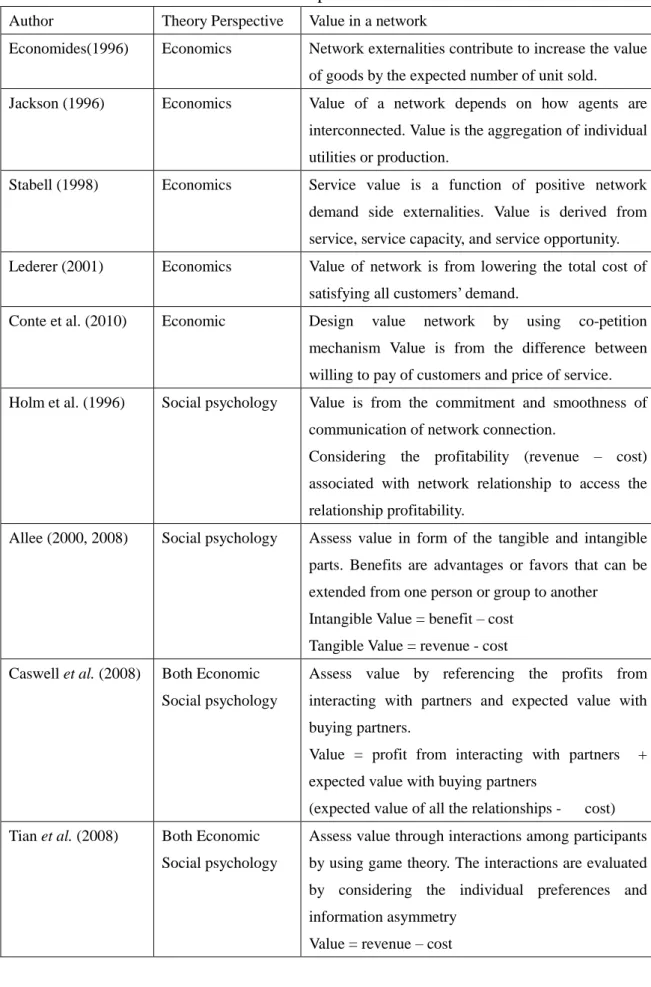
Table 2.3 shows how a value is expressed in a value network from the economic or social psychology perspective in network related studies. Generally speaking, the value definition emerges from considering the increase of benefits and the decrease of cost to social relationships and intangible assets. In recent years, there are also some studies integrating both economic and social psychology perspective in value network design.
- 26 -
Table 2.3 Studies on Value Network from the Economics or Social Psychology Perspective
Author Theory Perspective Value in a network
Economides(1996) Economics Network externalities contribute to increase the value
of goods by the expected number of unit sold.
Jackson (1996) Economics Value of a network depends on how agents are
interconnected. Value is the aggregation of individual utilities or production.
Stabell (1998) Economics Service value is a function of positive network
demand side externalities. Value is derived from service, service capacity, and service opportunity.
Lederer (2001) Economics Value of network is from lowering the total cost of
satisfying all customers’ demand.
Conte et al. (2010) Economic Design value network by using co-petition
mechanism Value is from the difference between willing to pay of customers and price of service.
Holm et al. (1996) Social psychology Value is from the commitment and smoothness of
communication of network connection.
Considering the profitability (revenue – cost) associated with network relationship to access the relationship profitability.
Allee (2000, 2008) Social psychology Assess value in form of the tangible and intangible
parts. Benefits are advantages or favors that can be extended from one person or group to another Intangible Value = benefit – cost
Tangible Value = revenue - cost
Caswell et al. (2008) Both Economic
Social psychology
Assess value by referencing the profits from interacting with partners and expected value with buying partners.
Value = profit from interacting with partners + expected value with buying partners
(expected value of all the relationships - cost)
Tian et al. (2008) Both Economic
Social psychology
Assess value through interactions among participants by using game theory. The interactions are evaluated by considering the individual preferences and information asymmetry
- 27 -
Among these research, Allee (2008) and Caswell et al. (2008) concerns intangible value, especially in Allee’s research (2008) which primary focused about how intangible and tangible value merge. However, the implementation of Allee’s approach in intangible value assessment needed the participants answering questions in a spreadsheet which contained different measurement scales. The mixing measurement scales (such as “agree” to “disagree” and high to low level) make the final value be hard to compare with each other. The investigation of each asset from filling a spreadsheet also takes time and human resource for analysis. Additionally, both Caswell et al. (2008) and Tian et al. (2008) referenced Allee’s approach as approaches measuring intangible value. Modeling value through participant interactions also have to deal with intangible value. Caswell et al. (2008) and Tian et al. (2008) tried to calculate actual service value by using price in practice. Nevertheless, the investigation and evaluation of price in each service, relationships and the customer’s feedback are not easy. Obviously, there should have an approach to implement the assessment of service value, relationships and customer’s feedback in an effective way from both economic and social psychological perspective.
This research works to contribute a new approach to implement the service value assessment for estimating the service value from the customers’ perspective. In this research, the service value assessment refers to both Allee’s work and the foundation concept of resource consumption in economics. While SDL indicates that service value is determined by customers, the service benefits by definition should be subjective to different customer’s perceptions. So, how to effectively describe the different cognitions from customers and then understand the service value is a key point for service value network design as discussed in this research. In the next section, the image theory is introduced for value representation.
- 28 -
2.2 Image theory for Value Representation
In economic system, businesses and customers consume the output from economic activities. There are important issues to concern. For instance, how do businesses and customers make their decisions to choose products or services? What is the value of chosen products or services to businesses and customers? Image theory describes how human images affect decision makers in terms of goals and value cognition and strategy planning (Beach, 1990). In other words, when businesses or customers participate in economic activities in an economic system, there are some goals for businesses or customers to achieve. Images can be schemata to explain the decision behaviors of businesses or customers.
Image theory defines image as a cognitive structure in human’s mind which is affected by human’s knowledge (Beach, 1990). There are three kinds of images: value image, trajectory image and strategic image (Beach, 1990). Among these three images, value image represents the principles of decision makers which affect the new goal generation and action to achieve the goal. Trajectory image consists of goals to achieve. Strategic image comprises plans (sequence of behaviors), tactics (actions required by plans) and forecast (projected outcome). Figure 2.2 shows the relationships between three kinds of images. For a decision maker making up his mind to do something, in image theory, a decision maker screens possible candidates first. The compatibility test examines whether the candidates violate the decision maker’s principle or not. In single candidate scenario, compatibility test results in adopting the candidate or not. In contrast, if multiple candidates after compatibility test have more than one survivor, profitability test which involves different choice strategies is applied to select best candidates.
- 29 -
Figure 2.2 Relationships between Different Images (Adopt from Nelson, 2004)
Researchers use image theory for studying the motivating behavior of customers and marketing strategies (Nelson, 2004). In marketing research, brand image is extended as perceptions about a brand as reflected by the brand associations held in consumer memory (Keller, 1993). Brand associations relate to service attribute, customer benefit and customer attitude toward a brand. In other words, the strength of brand images depends on the intensity of association. Therefore, brand images influence customer’s mind and decision which are close to the concept of value image in image theory. In tourism research, destination image is considered as the destination branding which includes products, communities, cultural and natural attractions (Prebensen, 2007). The causal relationship between positive images which construct the branding for destination identification to the willingness to pay more was also identified (Han, et al., 2009). Images can represent the benefits of customer perceived (Nelson, 2004). In this research, service value can be represented by using images analyzed and created from customers’ feedbacks. With appropriate analysis of customer’s experiences, images can disclose service features and value for each entity in a service value network. Imagery-based service value network design is believed to have potential to fulfill specific customer’s needs related to images.
Value Image Trajectory Image Strategic Image Behaviors Decision Frame
Principles Goals Plans
Tactics Forecast
- 30 -
2.3 The Cluster SMEs
SMEs and MNEs can be service providers or enablers in a value network. The role of SMEs is the complementrity to MNEs in the economic system (Bannock, 2004). For industry development, cooperation and cluster, one of B2B relationships, is essential (Pitelis and Pseiridis, 2006). Since SMEs tend to be local, cooperation among SMEs is more likely to cluster than network due to the location restriction. Porter (1998a) has defined cluster as a group of enterprises or related corporate bodies located in close geographical proximity or interrelated. Such enterprises and corporate bodies are linked by their commonality and complementarity. In other words, the agglomerations of SMEs into cluster integrate their complementary resources to enable the development of region and industry. Porter’s industry cluster theory implies that cluster can increase productivity and reduce production costs, and can also drive the direction and pace of innovation.
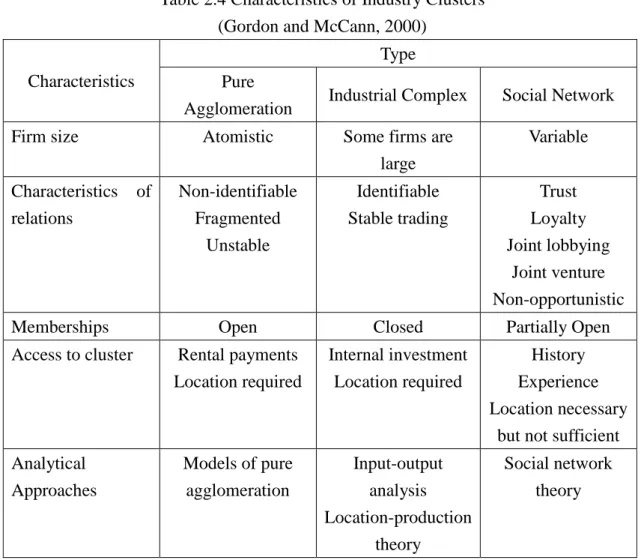
Furthermore, Gordon and McCann (2000) have classified three types of clusters from transaction cost perspective and identified the characteristics of type. Generally speaking, the goal of industry clusters is to enable enterprises to achieve the enhancement of productivity, degree of technical innovation and, competitive performance. Table 2.4 lists the characteristics of different industry clusters.
The differences in there types of clusters are categorized into four dimensions in Table 2.4. The characteristics of relations among three types are fundamentally different due to the different access way. Pure agglomeration clusters usually have open memberships for businesses in the same region. In other words, the organization of a pure agglomeration cluster is loosely coupled like in Taiwan night market. The only criterion to join a pure agglomeration cluster is in the same location, even only
- 31 -
renting a little space. Therefore, the relationships among businesses in a pure agglomeration cluster may be unidentifiable, fragmented or unstable due to open membership. The model of pure agglomeration describes the relations between businesses which creates a little cooperation, low loyalty in partnerships, atomized and competitive environment (Gordon and McCann, 2000).
Table 2.4 Characteristics of Industry Clusters (Gordon and McCann, 2000)
Characteristics
Type Pure
Agglomeration Industrial Complex Social Network
Firm size Atomistic Some firms are
large Variable Characteristics of relations Non-identifiable Fragmented Unstable Identifiable Stable trading Trust Loyalty Joint lobbying Joint venture Non-opportunistic
Memberships Open Closed Partially Open
Access to cluster Rental payments Location required Internal investment Location required History Experience Location necessary
but not sufficient Analytical Approaches Models of pure agglomeration Input-output analysis Location-production theory Social network theory
By contrast, industrial complex clusters have identifiable and stable trading relations among business. The realistic example of industrial complex clusters is like a science park. Businesses in this cluster concern about the geographical location for spatial transaction cost reduction. So, businesses in an industrial complex cluster may establish a tightly supply chain for cost-saving. Economy theories such as
- 32 -
input-output analysis and location-production theory are used for analysis the demand, supply and final consumptions of products produced in an industrial complex cluster (Gordon and McCann, 2000). The third kind of cluster model, social network, is not only formed base on location but also trust relationships among businesses. This kind of cluster is just like an agriculture tourism region in Taiwan. The businesses in an agriculture tourism region have strong interpersonal relationships and aims for mutual benefits. The detail linkages among businesses (e.g., trust, cooperation and investment) can be identified through social network analysis.
Among these three types, cluster SMEs should not be industry complex type due to the limitation of firm size. Therefore, cluster SMEs should be classified into either agglomeration or social network type according to Table 2.4. There is no differential relevance in the success of innovation among three types of clusters (Gordon and McCann, 2000). In other words, the characteristics of clusters do not affect the innovation activities in clusters. However, in service industry, the relationship among businesses changes from supply chain to service value network under the effect of service economy. The function of cluster is no longer for complementary resource sharing but also integrates for creating new resources from the SDL viewpoint. Therefore, although the characteristics of clusters do not limit innovation activities, the limitation in both capabilities and resources in SMEs restrict the development of cluster SMEs. Under this circumstance, using value network analysis for understanding the value creation from service experiences and design effective service value network may improve the performance of service innovation in cluster SMEs.
- 33 -
2.4 The Development of Tourism and Cluster SMEs
In tourism industry, there is also a value network formed among SMEs and MNEs. In this network, MNEs are responsible for maintain service selling channels and manage the network while SMEs are the real players that provide the actual tourists services (Gilmore et al., 2008; Pansiri, 2008; OECD, 2008a). However, because SMEs have less capability on marketing, they can’t attract as many tourists as MNEs by themselves. Even though MNEs which have more than 250 employees, they only take on about 0.1 to 0.2 percent of the total tourism enterprises, their entire turnover is almost as much as the sum of total tourism SMEs (OECD, 2010) (in which SMEs of less than 10 employees are about 80% of the enterprises).
Tourism SMEs earn less profit than MNEs because of their deficient roles in tourism value networks although they do have the positive impact on the development of regional niche characteristics. High flexibility, local knowledge and distinguished services are their advantages to create better tourists’ experiences and then increase tourist’s satisfaction (Wanhill, 2000). But low management, marketing and information technology capabilities make tourism SMEs suffer from the disadvantages of low marketing visibility and competiveness. To convert these disadvantages and exert their strength, information technology plays an important role because it can reinforce the innovation capability of tourism SMEs to generate innovative services and business model (Buhalisa and Law, 2008; Zelenka, 2009; Hjalager, 2010; Ma et al., 2003). For example, internet and community, destination management system and recommendation system are applied in some tourism SMEs to create new innovative business model in tourism. Therefore, in tourism ecosystem, not only infrastructure and business education, but also information technology is
- 34 -
needed to support the SMEs innovation for well development.
The OECD reports indicate that sustainable development is the main strategy in national tourism policy (OECD, 2008b, 2010; Connell et al., 2009). There are some different details among the entire strategies and policies of OECD countries because they have diverse conditions in their tourism industries. This study is references to the national tourism development policies in Australia, New Zealand, South Korea, Italy, Mexico, Slovak, Switzerland and Turkey which have dissimilar degrees of tourism development and policies. Among these countries, two mainstream directions of tourism development policies are identified: innovative entrepreneurial guidance and destination business management assistance. Policies for innovative entrepreneurial guidance are including include encouraging the investments on innovation services, creation of job opportunities and financial support for entrepreneurship. Policies for destination business management focus on the upgrades of business management skills, distinguished service characteristics generation and reinforcement of destination management, such as cooperation among SMEs for better service journey provision.
In exercising the policies, information technology is often viewed as an auxiliary enabler in tourism development (Touray and Jung, 2010). Information systems such as destination management system help SMEs communicate with tourists and manage resources and business cooperation effectively and efficiently. Internet and online communities are important sources to understand customer needs and feedbacks. Tourism recommendation systems can also facilitate tourists to find tour services. Table 2.5 is the summary of policies from eight countries (Australia, New Zealand, South Korea, Italy, Mexico, Slovak, Switzerland and Turkey) in tourism development.