國
立
交
通
大
學
財務金融研究所
碩
士
論
文
自由現金流量、每股盈餘、國家間公司治理與公司績
效---以世界前六大經濟市場為研究樣本
Free Cash Flow, EPS, Country Corporate Governance and Firm
Performance---Evidence from Top Six World Economic Markets
研 究 生:李詠晴
指導教授:王淑芬 博士
周幼珍 博士
自由現金流量、每股盈餘、國家間公司治理與公司
績效---以世界前六大經濟市場為研究樣本
Free Cash Flow, EPS, Country Corporate Governance and Firm
Performance---Evidence from Top Six World Economic Markets
研 究 生:李詠晴 指導教授:王淑芬博士
周幼珍博士
Student:Yung-Ching Lee Advisor:Dr. Sue-Fung Wang
Dr. Yow- Jen Jou
國 立 交 通 大 學
財務金融研究所
碩 士 論 文
A Thesis
Submitted to Department of Finance College of Management National Chiao Tung University In partial Fulfillment of the Requirements
for the Degree of Master
in Finance June 2010
Hsinchu, Taiwan, Republic of China
自由現金流量、每股盈餘、國家間公司治理與公司績
效---以世界前六大經濟市場為研究樣本
學生:李詠晴
指導教授: 王淑芬 博士
周幼珍 博士
國立交通大學財務金融研究所碩士班
摘
要
資本市場上大都以每股盈餘做為公司評價的依據,然而其存在著盈餘管
理的問題,因此若以自由現金流量為評價基礎,是否可以解決盈餘管理問
題。有鑑於此,本研究利用 2003 年至 2007 年全球前六大經濟市場,包括
美國、日本、德國、英國、法國與中國,經由 panel regression 檢視每股盈
餘與自由現金流量和公司績效之關聯,接著進一步以本益比區分為高低成
長機會進行群組分析,顯示每股盈餘和自由現金流量對以會計基礎的公司
績效而言,不論國家別或是成長機會別皆呈顯著正向相關。所以進一步利
用 Vuong 模型檢視,結果顯示每股盈餘解釋能力均比自由現金流量還要好。
由檢視每股盈餘和自由現金流量對公司績效的關係中發現存在著國家間的
差異,故公司績效可能也與國家間的公司治理有關。所以進一步考量國家
間的公司治理因素進行分析。本研究為第一篇綜合探討每股盈餘、自由現
金流量、國家間公司治理與公司績效間的關係,並指出每股盈餘對公司績
效的解釋能力,顯著優於自由現金流量,且公司在低國家風險、良好法治
環境與股東權利較強的國家,具有較好的公司績效。美國在全球六大經濟
市場中具有最強的股東權利、最佳法治環境、最低的國家風險與最高的公
司績效。
ii
Free Cash Flow, EPS, Country Corporate Governance and Firm
Performance---Evidence from Top Six World Economic Markets
Student:
Yung-Ching LeeAdvisors:Dr.
Sue-Fung WangDr.
Yow- Jen JouInstitute of Finance
National Chiao Tung University
ABSTRACT
The capital markets frequently advocate examining the accrual earning per share (EPS) for the purpose of valuing the corporate. But it may have problems of earning management. Therefore, a recently important firm performance index, Free cash flow, may more suitable for valuing the firms. We choose the top six world economic markets---USA、Japan、Germany、 UK、France、China to study. First we use panel regression to examine the relationship between EPS and FCF on firm performance, and then we separate low and high-growth opportunities firms by P/E ratio for group analysis. These results suggest that both EPS and FCF have significantly positive relationship on ROA no matter by countries and growth, so we use the method provided by Vuong, and the result shows EPS has better explanatory power on firm performance. From the effect of EPS and FCF on firm performance, we find the effect on firm performance has different results between countries, cross-country variations in firm performance may cause by the corporate governance factors. Therefore, we add the country-level corporate governance factors to discuss. This is the first paper attempt to examine the relationship between EPS 、FCF、 country corporate governance and firm performance. From the results, we find that EPS has more positive explanatory power for firm performance than FCF, and firms in country which with lower country risk, better quality of law enforcement, and stronger shareholder’s right will lead to have better firm performance. Therefore, U.S. is the country which has the highest shareholder’s right, the best quality of law enforcement, the lowest country risk and the best firm performance in the six economic markets.
誌謝
本論文得以順利完成,首先必須感謝我的指導教授王淑芬博士與周幼珍
博士,兩位恩師在論文研究的路途上給予我耐心的指導與悉心的關愛,使
我得以學習研究之精髓,在這兩年碩士生涯中能夠成長茁壯。此外,我也
要感謝我的口試委員杜玉振博士、辛敬文博士、陳聖賢博士,諸位口試委
員在口試中惠予我許多良好的建議,讓本論文得以更臻完善。再來,我要
感謝同在恩師王淑芬博士門下的學習夥伴思蓉、修豪、育倫、民發、健佑,
在我論文研究的過程中謝謝有你們的一路學習陪伴、相互砥礪。
感謝所有交大財金所師長們,在這兩年中因為有您們的教導,我才能不
斷在學習的道路上向前邁進;感謝所有交大財金所 97 級的同學們,在碩士
生涯中能與你們相遇,一同學習奮鬥、分享喜悲,將成為我人生中最美好
的回憶。此外,我要特別感謝從大學一起到研究所的冠文,因為有妳,我
在陌生的環境中也感到熟悉與放心,感謝妳一路以來的照顧與關懷,給了
我莫大的力量。再來我要感謝同在宿舍的好友們,冠文、文盈、怡樺、玫
竹、怡錞、宛余、婷怡、紀純,在為了學業與論文奮鬥的夜晚總是有妳們
同在,大家彼此扶持激勵分享彼此的點點滴滴,是我繼續前進的最大動力。
最後,我要感謝我最摯愛的爸爸、媽媽、妹妹,與男友建銘,沒有你們
不斷的支持、關懷與付出,也沒有今日的我,感謝你們在這段艱辛的路程
上默默地陪伴在我身旁,傾聽我的壓力與迷惘,感謝有你們不斷鼓勵我,
在我徬徨時總是張開雙臂成為我的避風港,你們是我完成碩士生涯里程碑
的最大精神支柱,在此深深獻上我最真摯的感激之情。
李詠晴 謹誌
國立交通大學財務金融研究所
中華民國九十九年六月
目錄
中文摘要………i
Abstract…………...…….……….ii
目錄………..iii
表目錄………..iv
1. Introduction ... 1
2. Methodology ... 5
2.1 Data ... 5
2.2 Variable definitions ... 7
2.3 Models ... 8
3. Regression results ... 10
3.1 Earnings Per Share and Firm Performance ... 10
3.2 Free Cash Flow Per Share and Firm Performance ... 11
3.3 EPS, FCF, Growth and Firm performance ... 12
3.4 Test the explanatory power of EPS and FCF ... 14
3.5 EPS, FCF, Corporate Governance and Firm performance... 15
4. Conclusion ... 17
Reference ... 19
表目錄
Table 1. Description of variables ... 26
Table 2. The top six world economic markets ... 27
Table 3. Mean statistics by variables ... 29
Table 4. Earnings Per Share and Firm Performance ... 30
Table 5. Free Cash Flow Per Share and Firm Performance ... 31
Table 6. EPS, FCF, Growth and Firm performance ... 32
Table 7. Vuong's Z-statistic ... 33
1. Introduction
Free cash flow (FCF) is the cash flow that firms are free to use based on the maintaining the existing production capacity of enterprises. Warren Buffett1 is the world's legendary stock investor, his unique, concise investment philosophy and strategies make him success. One of his eight investment principles is to investment firm which with low capital expenditure and high FCF, because FCF considered capital expenditures that the business required to fully maintain it long-term competitive position. Comparing to after-tax income, FCF could reflect the earnings belong to the shareholders more. That’s why Warren Buffett has referred to the FCF of a company as owner earnings. FCF has received much attention in recent years, and number of extensive use of FCF is limited to financial advice, credit ratings, investment banks and other institutions. This alternative view of FCF is often defined in the popular press: ‘Free cash flow is gaining in popularity as a tool investors can use to gauge a company's relative value.’, and ‘Free cash flow is a snapshot of past performance, it tends to have a strong relationship to future earnings.’(Forbes, 2006).
Financial statement analysis, firm managers, and investors frequently advocate examining the accrual earning per share (EPS) for the purpose of valuing the corporate (Chan, Chan, Jegadeesh and Lakonishok, 2006). EPS is the summary measure of corporate performance that produced under the accrual basis of accounting. For wide range of users, it becomes an important firm performance index.
However, EPS contain the component of the accruals2. Previous studies find that accruals improve the ability to measure the firm performance (Holthausen and Leftwich, 1983; Watts and Zimmerman, 1986; Holthausen, 1990; Healy and Palepu, 1993; Krishnan, 2003). But it may have problems, the managers would use their discretion to opportunistically manipulate accruals, earnings will become less reliable and cash flow could be preferable.
1 Warren Buffett is one of the most successful investors in the world, the primary shareholder and CEO of
Berkshire Hathaway.
2
Thus, accruals principle gives the managers space to do the earning management (Healy, 1985; Teoh, Welch and Wong, 1998; Collins and Hribar, 2000).
Dechow(1994) examine three measurement intervals(quarterly, annual and four-yearly) by using Vuong’s Z-statistic3 to analyze earnings and cash flow which is a better estimate for valuing firm performance. The results are (1) over short measurement intervals earnings are more strongly associated with stock returns than are realized cash flows, and the ability of realized cash flow to measure firm performance improves relative to earnings as the measurement interval is lengthened. (2) Earnings have higher association with stock returns than do realized cash flows in firms experiencing large changes in their working capital requirements and their investment and financing activities. Under these conditions, realized cash flows have more severe timing and matching problems and are less able to reflect firm performance. Brown and Sivakumar (2003) compare the value relevance of two operating income. One of the two operating income is pro-forma (recurring operating) earnings reported by managers and analysts, and the other one is obtained from firms’ financial statements. They use a Vuong’s Z-statistic to determine whether one valuation equation has a significantly larger adjusted R-square.The results suggest that operating earnings reported by managers and analysts are more value relevant than a measure of operating earnings derived from firms’ financial statements, as reported by Standard and Poor’ s. Shuto(2007) investigates the relation between discretionary accounting choices and executive compensation in Japanese firms. They also use a Vuong’s Z-statistic to compare the explanatory power of reported earnings for executive bonuses with that of nondiscretionary earnings (pre-managed earnings). The results show that the use of discretionary accruals increases executive compensation.
Shivakumar (2000) also finds evidence consistent with accruals earnings management around SEOs, he shows that the stock market does not react inefficiently to the upwardly
3
managed earnings, but that investors rationally undo these effects. He argues that the earnings management is not designed to fool or mislead investors, but is itself a rational response to the market’s anticipation that firms will upwardly manage earnings around the SEO.
Jensen (1986, 1989), Stulz (1990) and Gul and Tsui (1998) suggest that debt ratio plays an important role in agent problem. The low-growth opportunities firms with high debt ratio may reduce the opportunities that managers to do overinvestment, decreasing the agent cost in low-growth opportunities and high free cash flow firm. Jensen (1986), Richardson (2006) and Banker, Huang and Natarjan (2009) apply debt to equity ratio as leverage, so does our study. Myers and Majluf (1984) develope pecking order theory and show how this asymmetry leads firms to prefer internal funds to external funds. When the former are exhausted and there exists a deficit in funds, firms will prefer safer debt to riskier equity.
Opler and Titman (1994), Majumdar and Chhibber (1999), and Weill (2008) find that leverage is negative with firm performance. Because it may generate a spurious negative correlation between leverage and performance since the poorly performing firms might be required to increase their borrowing to cover their losses. Therefore, leverage will add in our analysis to examine its effect on firm performance. Opler and Titman (1994), Maury (2006) mentioned that firm size is positive related to firm performance. When company size is large, means the company has in the mature stage, and it has more adaptability of industry changes than small scale.
For above reasons, this study wants to examine the EPS and FCF in firm valuation with control variables, like size and leverage. In addition, we will separate low and high-growth opportunities firms by P/E ratio to do the group analysis. For the global perspective, we choose the top six world economic markets bases on GDP to study, because sum of top six economic markets' GDP are almost 60% of sum of all the country in the world. Therefore, top six economic markets can be a proxy of the whole world. In this paper, if both EPS and FCF are significant to firm performance, we will apply the method of these literatures to analyze
which EPS or FCF has better explanatory power for firm performance.
Apart from these factors, corporate valuation may be driven by corporate governance (La Porta, Lopez-De-Silanes, Shleifer and Vishny (LLSV), 2002; Claessens and Fan, 2002; Lemmon and Lins 2003; Brown and Caylor, 2006; Chua, Eun and S. Lai, 2007; Bhagat and Bolton, 2008). Chua, Eun et al. (2007) provided a comprehensive analysis of corporate valuation around the world. To facilitate the comparison of corporate valuation across countries, Tobin’s Q is the variable as valuation measure. The main finding are the more transparent accounting, less corruption, lower country risk all contribute significantly to corporate valuation. Also, Tobin’s Q varies directly with shareholder’s rights, and enforcement of insider trading laws, and they have significant positive relationship with firm performance.
LLSV (2002) investigate the relationship between investor protection and corporate valuation, and document that investor protection affect corporate valuation, and poor shareholder protection is penalized with lower valuations. Claessens and Fan (2002) and Lemmon and Lins (2003) also show that firm value increases as the ownership of large shareholder increase. Lee and Ng (2003) investigate the relation between corruption and international corporate values, and find that there exists a significant negative relationship between country-level corruption and corporate valuation, it indicated that firm in lower corruption will has better firm performance. Morey, Gottesman, Baker and Godridge (2009) find country risk are significantly link with higher valuation. This study will add the corporate governance factors to construct the whole corporate evaluation more integrity.
We use two main performance measures: Tobin’s Q and ROA. Previous study, Klapper (2004) and Wright, Kroll, Mukherji and Pettus (2009), also use Tobin’ Q and ROA as firm performance. Tobin’s Q is a measure of market valuation of firm, it is a market-based firm performance; and ROA is a measure of operating performance, it is an accounting-based firm performance.
The remainder of this paper is organized as follows. Section 2 describes the methodology including the sample selection and the research models. Section 3 presents and discusses the results and section 4 provides a summary of our main results and conclusions.
2. Methodology
2.1 Data
The sample is drawn from all exchange-listed firms in top six world economic markets(USA、Japan、Germany、United Kingdom、France、China), and exclude banks and financial firms(those with SIC code from 6000 to 6999) during the 5-year period, from 2003 to 2007. There are 28,765 observations of the top six world economic markets.
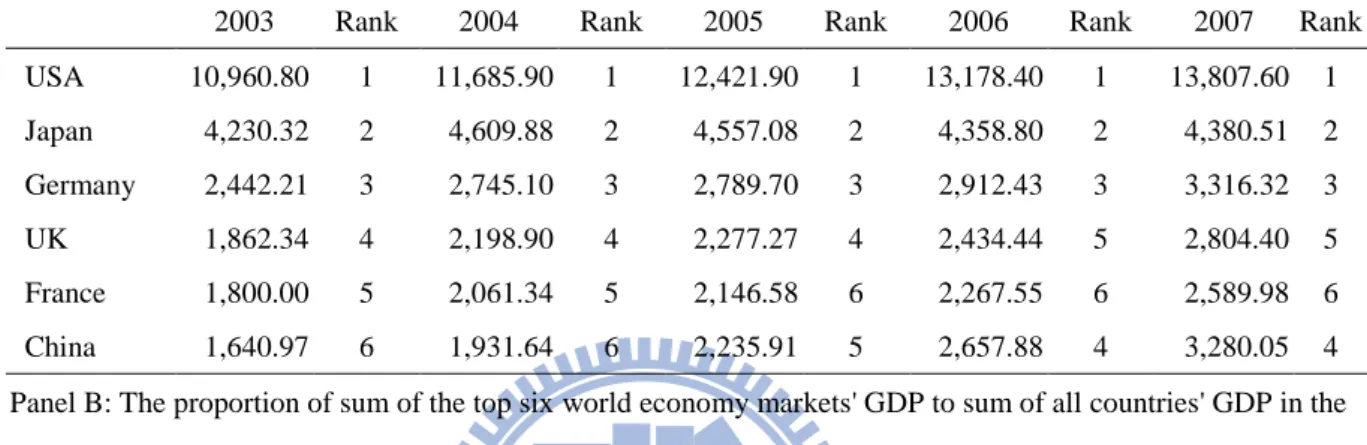
Table 1 shows the top six world economic markets’ GDP data over 2003-2007. This paper want to investigate whether EPS or FCF which reflect firm value better and add corporate governance to inspect. For global perspective purpose, we choose the top six world economic markets bases on GDP to study.
Panel A shows the rank of top six economic markets bases on GDP over the sample period 2003-2007. The data come from IMD World Competitiveness Online Database, and the database collect the world wield annual GDP data from World Bank. From 2003 to 2007, USA is the world top 1 economic market of the world, and its GDP is almost three times as high as the world top 2 economic market, ranges from 10960.80 billion dollars to 13807.60 billion dollars; Japan is the world top 2 economic market, ranges from 4230.32 billion dollars to 4380.51 billion dollars; The world top 3 economic market, Germany, ranges from 2442.21 billion dollars to 3316.32 billion dollars; UK, France, and China their ranks changes between fourth and sixth.
Panel B provides the sum of top six economic markets' GDP to sum of all countries' GDP in the world. There are 57 world main countries’ GDP data that IMD World
Competitiveness Online Database is collected. The row of panel B named Total_six means sum of top six economic markets' GDP in each year, and the row of panel B named Total_world means sum of 57 world main countries’ GDP in each year. As can be seen from the last row of panel B, sum of top six economic markets' GDP are almost above 60% of sum of the countries’ GDP in the world. Therefore, top six economic markets can be a proxy of the whole world.
[Insert Table 1 here]
The firm-level accounting data, e.g., book value of asset, book value of liability, market value of equity, earning per share, free cash flow per share, and debt to equity ratio. These data come from Compustat Global Vantage that provides fundamental financial and price data for both active and inactive publicly traded companies, and it goes back annually to 1950, and Global Vantage goes back to 1993.
The country-level corporate governance data, e.g., role of law, shareholder's right, and corporate boards measures. The three variables come from IMD World Competitiveness Online that provides a worldwide reference point on the competitiveness of nations, ranking and analyzing how an economy creates and sustains the competitiveness of enterprises. These indexes form IMD World Competitiveness Online all be scored from 0 to 10. In addition, we obtain Corruption measures for each country form Transparency International. Transparency International is a global civil society organization. They provide Corruption Perceptions Index (CPI), first released in 1995, is the best known of TI’s tools. The Corruption Perceptions Index is also score from 0 to 10. We further obtain the Country risk measures for each country form Euromoney. Euromoney is a magazine that reports international banking finance and capital markets news, analysis, and issues country risk ranking every September.
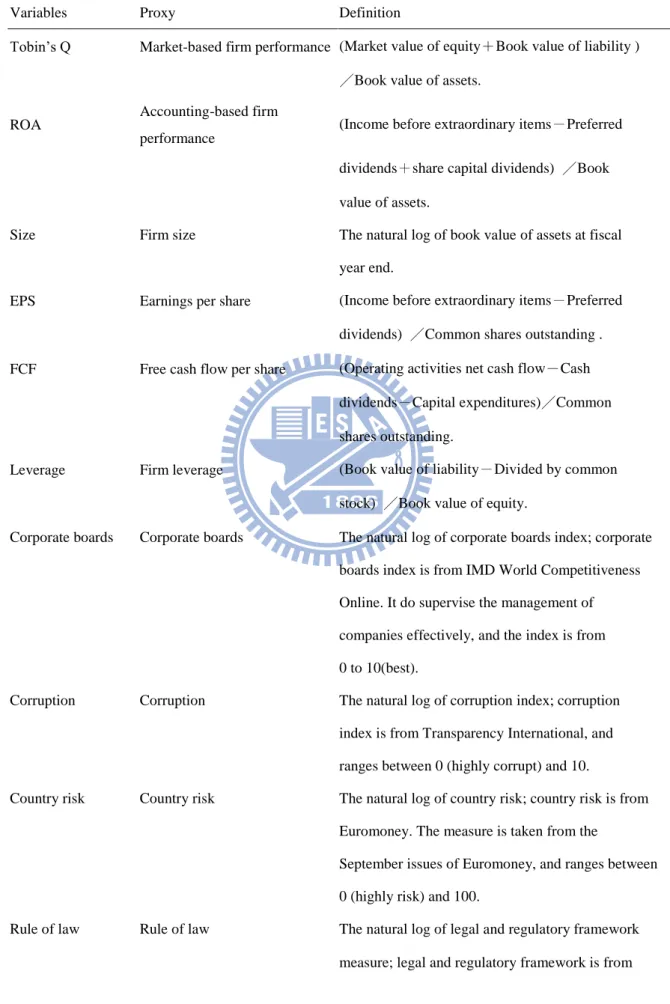
2.2 Variable definitions
All the financial statement variables are firm-level data, and the corporate governance variables are country-level data. The variables are defined as follows:
[Insert Table 2 here]
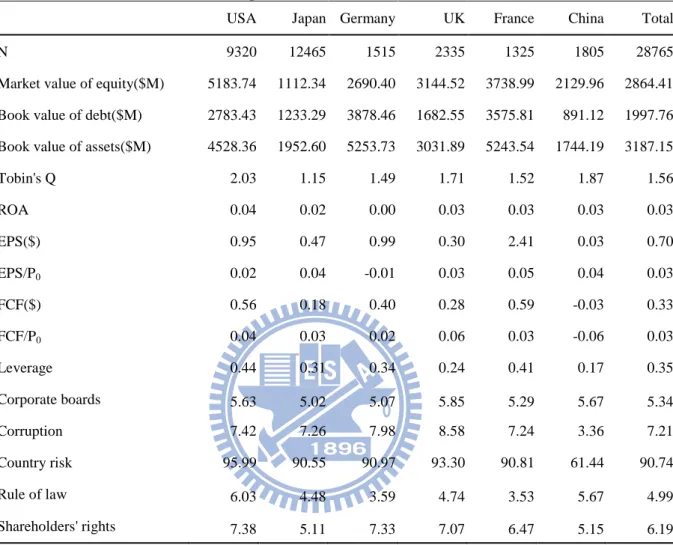
In Table 3, we present the descriptive statistics on entire samples of variables. All the variables are averaged of the sample period on each country, and the data come from Compustat. The market value of equity, book value of debt and book value of assets are reported in millions of dollars, averaged over 2003 though 2007. The market value of equity of USA, UK and France are higher than average of the six countries samples (Total4); the book value of debt of Germany, France and USA are higher than all the countries average; the book value of assets of Germany, France and USA are higher than all the countries average.
Klapper (2004) and Wright et al. (2009) use Tobin’ Q and ROA as firm performance, ROA is accounting-based and Tobin’s Q is market-based. There are two counties’ Tobin’ Q, USA and China, higher than the total average; and there are four counties’ ROA higher or equal to the total average, they are USA, UK, France and China.
The financial statement variables contain EPS, FCF and Leverage, and these data also come from Compustat. USA, France and Germany have larger period average EPS and FCF than the Total average. In order to measure the corporate performance the EPS will be scaled by stock price from the beginning of the year (Warfield, Wild and Wild, 1995; Gabrielsen, Gramlich and Plengborg, 2002; Korczak and Korczak, 2009), so we do the same for FCF. Except USA and Germany, the other countries’ scaled EPS are more than the six countries samples average. For scaled FCF, excluding Germany and china, the other counties have larger value than Total. We use debt to equity ratio as leverage, and compared to 0.35, the
4
average of those countries, USA and France have higher leverage.
We have five country-level corporate governance measures. The first is Corporate Board, which is an index from IMD World Competitiveness Online to represent the degree of the board supervise the management of companies efficiency. USA, UK and China are more efficient than the other countries. The second is corruption, which is an index form Transparency International. The index is between zero to ten, lower score means higher corruption. China is the most corrupt country in the six economic markets, the corruption index of the other countries are higher than the total samples average, 7.21. The third is country risk, which is an index come from Euromoney, and the index is from zero to ten. The higher the score, the lower of country risk. China also is the highest country risk country of all the six. The fourth is rule of law, which is the legal and regulatory framework index from IMD World Competitiveness Online. USA and China are the higher legal countries, their value are larger than the total six countries average, 4.99. The fifth is shareholder’s right, which is the index formed by IMD World Competitiveness Online. Japan and China have lower period average score than the total sample average, 6.19, so these two countries have lower shareholder’s right than the others.
[Insert Table 3 here]
2.3 Models
Our study proceeds in three parts. In the first part of this paper, we use panel regression to investigate both the effects of EPS and FCF on firm performance with control variables in each country and total samples. There are two proxies of firm performance, ln(Tobin’s Q) and ROA. Tobin’s Q is a market-based firm performance; and ROA is an accounting-based firm performance. We also investigate the relationship between EPS, FCF, growth and firm performance. EPS will be scaled by stock price from the beginning of the year for measuring
firm performance (Warfield et al., 1995; Gabrielsen et al., 2002; Korczak et al., 2009), and we do the same on FCF. When a firm at high-growth, it will need to investment so capital expense will increase that FCF will decrease. Therefore, this study uses P/E ratio to separate low and high-growth opportunities firms to do group analysis. The 1/3 of all sample high P/E firms defined as high-growth opportunities firms; 1/3 of all sample low P/E firms defined as low-growth opportunities firms.
With both EPS and FCF are positive and significant with firm ROA, so the second part of this paper wants to examine do the explanatory powers of EPS and FCF on valuing firm performance as firm ROA have difference? For this purpose, EPS and FCF are set up as a competing model to explain firm ROA. This paper use a recent development in model selection techniques, previous studies (Dechow, 1994; Brown and Sivakumar 2003; Shuto, 2007) also use the method is provided by Vuong (1989). Vuong’s Z- statistic could compare the explanatory power of EPS and FCF on firm performance. The positive and significant Z- statistic indicates that the first model is the model of choice, because the residuals of the second model are larger than the first model. This indicated that EPS has a significantly larger adjusted R-square.
The third part of this paper, we investigate the relationship between EPS, FCF, corporate governance factors, and firm performance by using panel regression. The results in first part of the paper shows the effect on market-based firm performance is different between countries, so we argue that despite accounting data factors, corporate governance factors between countries may affect firm performance. Therefore, we add the country-level corporate governance factors, like corporate board, corruption, country risk, rule of law and shareholder’s right to discuss.
3. Regression results
In this section we report the panel regression results of the relationship between (1) EPS and firm performance. (2) FCF and firm performance. (3) EPS, FCF, growth and firm performance. And then, we use Vuong’s z-statistic to examine whether EPS or FCF has better explanatory power on firm performance. Finally, we use the panel regression to provide results of the relationship between EPS, FCF, corporate governance and firm performance.
3.1 Earnings Per Share and Firm Performance
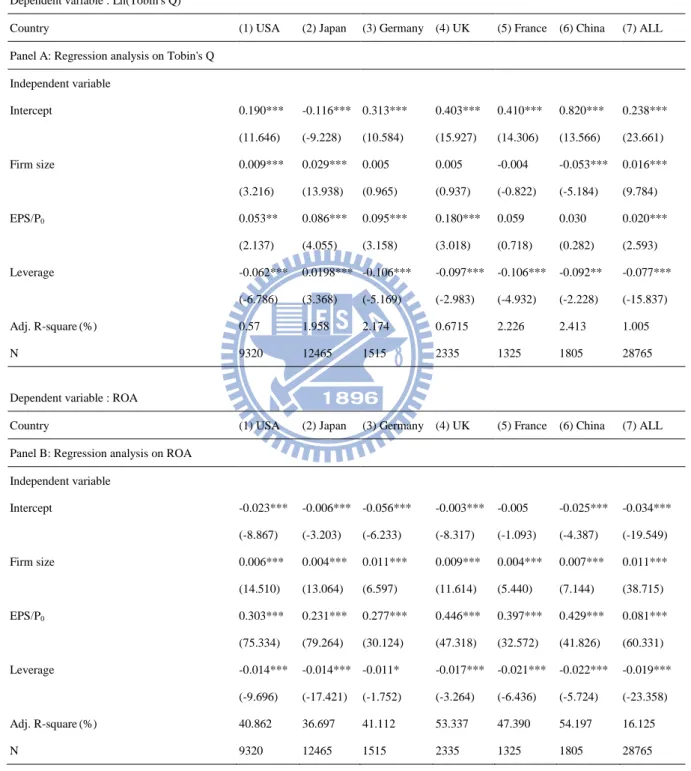
In Table 4, we investigate the relationship between EPS and firm performance. Both in Panel A and Panel B, the Model (1) to (6) show the results between different countries, including USA、Japan、Germany、UK、France and China. Model (7) is the result of the six countries’ total samples.
Panel A uses the natural log of Tobin’s Q as the dependent variable and wants to find relationship with EPS and other financial statement variables. EPS is positive and significant effect on firm Tobin’s Q in USA, Japan, Germany and UK (Model (1) to (4)), but it not significant in the other countries and total samples. Firm size, which defined as the natural log of total assets, is positive and significant with firm Tobin’s Q in USA, Japan and total samples. But in China, firm size has negative and significant effect on firm Tobin’s Q. The possible reason is that the larger the size of the company, the greater the need of external funding, which shares more dispersed, and china have the lowest shareholders’ right, the agent problem will be more obvious, thus reducing the firm performance. Leverage, which defined as debt to equity ratio is found to have significant effect and negative relationship effect on firm Tobin’s Q at almost all models. When a firm borrows money to finance projects, it faces enormous interest payments, and high debt ratio. Therefore, lower the leverage, the firm’s capital structure may be sounder, the firm can provide greater protection
to creditors and shareholders, and then firm performance will better. But there is a positive and significant relationship with corporate Tobin’s Q in Japan. The possible reason is that firms could eliminate information asymmetry by leverage, so the higher leverage will have higher Tobin’s Q. The results shows that firm size, EPS, leverage have no consistent relationship on market-based firm performance in top world six economic markets.
Panel B also shows a similar relationship between EPS and firm performance, the difference is the dependent variable is using ROA to substitute. EPS have positive and significant relationship in all models, and all models are significant at 1% level. Therefore, EPS has strong and positive relationship with firm performance when dependent variable is ROA. In Panel B, firm size is positive and significant at 1% level in all models, which indicates that larger firm size lead to higher firm performance. Leverage has negative and significant effects on accounting-based firm performance, ROA. The results shows that firms with large scale, higher EPS and lower leverage will have better accounting-based firm performance in top six world economic markets.
[Insert Table 4 here]
3.2 Free Cash Flow Per Share and Firm Performance
The results of the effect of FCF on firm performance are summarized as Table 5. Both in Panel A and Panel B, the Model (1) to (6) show the result between different countries, and the Model (7) is the result of the six countries’ total samples.
Panel A want to find the relationship of FCF on firm performance with control variables by using the natural log of Tobin’s Q as the dependent variable. In USA and UK (Model (1) and (4)), FCF is negative and significant at 5% level on firm Tobin’s Q, positive and significant at 10% level in Japan, but not significant in the other countries and total samples. Firm size, which defined as the natural log of total assets, has a significant positive
relationship with firm Tobin’s Q in USA, Japan, UK and total samples. But in China, firm size is also negatively significant related to a firm Tobin’s Q. Leverage is defined as debt to equity ratio, and it has significant effect and negative relationship effect on firm Tobin’s Q at almost all models. In Japan, it is also has a positive and significant relationship with corporate Tobin’s Q. The results shows that firm size, FCF, leverage have no consistent relationship on market-based firm performance in top world six economic markets.
In Panel B, this includes a similar relationship between FCF and firm performance, and using ROA as the dependent variable. It shows that FCF has positive and significant relationship in all models, and they are significant at 1% level. That indicated FCF has strong and positive relationship with firm performance when dependent variable is ROA. Firm size is positive and significant at 1% level in all models, and shows that larger firm size lead to higher firm performance. Leverage has negative and significant effects on ROA at almost all models. From the results, we find that firms with large scale, higher FCF and lower leverage will have better accounting-based firm performance in top six world economic markets.
[Insert Table 5 here]
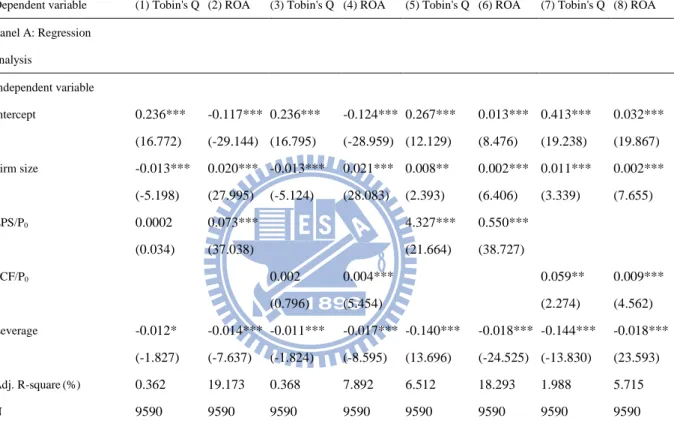
3.3 EPS, FCF, Growth and Firm performance
In Table 6, we investigate the relationship between EPS, FCF, growth and firm performance. We apply the method provided by McConnell & Servaes(1995)to separate low and high-growth opportunities firms, it ranks by P/E ratio. The 1/3 of all sample high P/E firms defined as high-growth opportunities firms; 1/3 of all sample low P/E firms defined as low-growth opportunities firms. Previous studies (Faccio and Lasfer, 1999; Ahn, Denis and Denis , 2006) also use the method to divide the sample firms into low and high-growth groups.
significantly associated with firm Tobin’s Q, which is market-based of firm performance. This indicated that low-growth opportunity firm with large scale will have lower market-based firm performance. When firm go in to low-growth, it may already be in a mature stage and the opportunity for future growth will relatively lower. Besides, when the firm size larger the demand of external fund may increase. It may cause ownership incline towards dispersion, and the managers may acquire some shares, which will make agency problem appear easier (Lee and Chuang, 2009). Therefore, the larger the firm size may cause lower firm performance in low-growth group. In Model (1) and (3) EPS and FCF is not significant related to firm Tobin’s Q, it indicated that when firm at low-growth state, EPS and FCF does not reveal the market-based firm performance.
In high-growth opportunity firm, firm size, EPS, FCF are positive and significant on firm performance in each model. This indicated that high-growth opportunity firm with large size, higher EPS and higher FCF will have higher firm performance no matter market-based or accounting-based.
In high-growth and low-growth opportunity firm, leverage is negative and significant on firm performance in each model. The results shows that firm with lower leverage may create higher market-based and accounting-based firm performance no matter in high-growth or low-growth opportunity firm.
Comparing Model (2) and (6) to Model (4) and (8), we find both EPS and FCF have significant and positively relationship on ROA. This indicated that no matter in low-growth or high-growth stage, firm with higher EPS and higher FCF will have higher accounting-based firm performance.
When using ROA as accounting-based firm performance, both EPS and FCF are positively significant at 1% level. The adjusted R2 in Table 4 and Table 6 show that EPS are more strongly associated with ROA than FCF. However, only simply to compare R2 does not provide statistically reliable evidence that EPS is superior to FCF. Previous study (Dechow,
1994; Brown and Sivakumar 2003; Shuto, 2007) use the method provided by Vuong (1989) for model selection to test the null hypothesis that the two models are equally close to explaining the "true data generating process" against the alternative that one model is closer. In order to formally discriminate between the EPS and FCF on ROA, so we use the likelihood test that provided by Vuong (1989) to find that EPS or FCF which has better explanatory power for firm performance.
[Insert Table 6 here]
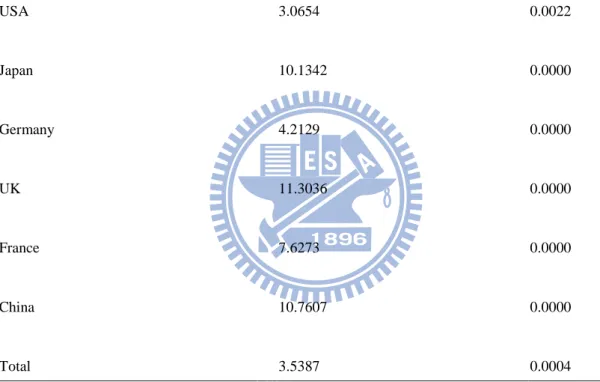
3.4 Test the explanatory power of EPS and FCF
Table 7 shows the results of Vuong’s test of the two models at each sample group. Panel A provided each Vuong’s Z-statistics at the top six world economic markets and total samples. All sample groups in Panel A have positive Vunog’s Z-statistics. The positive and significant Z- statistic indicates that the EPS is better to reflect the firm performance, because the residual of the model is smaller than the other. The results in Panel A provided that EPS is a better estimate for valuing firm performance than FCF across the top six world economic markets and the total samples.
Panel B shows each Vuong’s Z-statistics at the low-growth firm and high-growth firm samples. Both low-growth firms and high-growth firms have positive and significant Vuong’s Z-statistics. It means that EPS has a better explanatory power on firm performance than FCF no matter at low-growth firm or high-growth-firm samples.
According to Table 7, we find that EPS has better explanatory power for firm performance across the six countries and the whole samples. Even adding the condition of growth, EPS is still the better estimate for firm performance.
Previous studies find the managers would use their discretion to opportunistically manipulate accruals, earnings will become less reliable and cash flow could be preferable. So that accruals principle gives the managers space to do the earning management (Healy, 1985;
Teoh et al. 1998; Collins and Hribar, 2000).
But our results do not consistent with these study(Healy, 1985; Teoh et al. 1998; Collins and Hribar ,2000), the result in Table 6 shows EPS is still the better estimate for firm performance, the results suggest that accruals are performing a useful role in mitigating timing and matching problems in cash flow, so that EPS better summarizes firm performance.
[Insert Table 7 here]
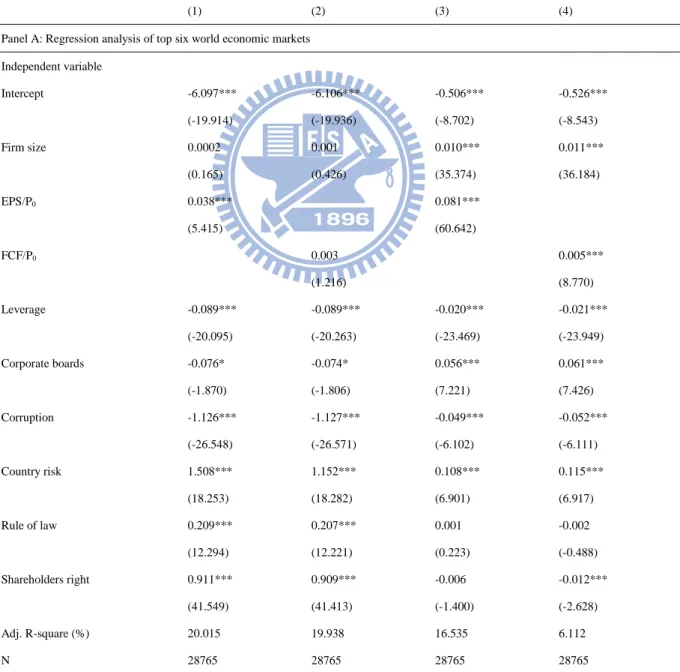
3.5 EPS, FCF, Corporate Governance and Firm performance
From Table 4 and Table 5, we find the effect on firm performance has different result between countries, so firm performance may cause by the country-level corporate governance factors. And previous studies suggest that corporate valuation may driven by corporate governance (LLSV, 2002; Claessens and Fan, 2002; Lemmon and Lins 2003; Brown and Caylor, 2006; Chua, Eun et al., 2007; Bhagat and Bolton, 2008). Therefore, we add the country-level corporate governance factors, like corporate board, corruption, country risk, rule of law and shareholder’s right to discuss.
Table 8 shows the effect of country-level corporate governance factors on firm performance. Panel A is regression analysis of top six world economic markets. The corporate board is negative and less significant related to market-based firm performance, Tobin’s Q, at 10% level, but positive and significant on accounting-base firm performance, ROA, at 1% level. Therefore corporate board may be positively significant on firm performance, that indicated that when the corporate board work more efficient the better of the firm performance. The corruption score has a negative and significant relationship with firm performance, both accounting-based and market-based. This indicated that if the country more corrupt, it will has better firm performance. This is not consistent with previous study provided by Lee and Ng (2003) and Chua, Eun et al. (2007). In Model (1) to (4), country risk
is positively significant with firm performance, both accounting-based and market-based measurement. It is important to note that if the country with lower country risk, it will perform better performance. It is consistent with Chua, Eun et al. (2007) and Morey, Gottesman et al. (2009) that country risk are significantly link with higher valuation.
Rule of law has significant and positive relationship on market-based firm performance at 1% level. It indicated that the more legality country will has greater firm performance. Shareholder’s right is positive and significant at 1% level on market-based firm performance in Model (1) and Model (2). This shows that firm performance increase as the shareholder’s right increase. It is not only consistent with LLSV (2002) ,and Chua, Eun et al. (2007) that investor protection affect corporate valuation, and poor shareholder protection is penalized with lower valuations, but also consistent with Gompers, Ishii, and Meyrick(GIM,2003) that shareholder’s right is positively with firm performance.
But the result of firms in country which with higher corruption will have higher performance is not consistent with previous literature. We argue that China is different from the rest of the sample because it has the lowest mean corruption index and china has been one of BRICs5 recently, comparing to the other well-developed five countries china is with highly potentiality and growth. Therefore, we exclude china to examine the regression analysis of top five world economic markets in Panel B. From the results, we suggest that the corruption index is not significant with firm performance when drop out the samples of China.
From these results, we find that firms in country which with lower country risk, higher corruption, better quality of law enforcement, and stronger shareholder’s right will lead to have better firm performance. Also, Table 8 shows firm size is positive related to ROA, accounting-based firm performance, it is consistent with Maury (2006) that firm size has
5 In economics, BRIC (typically rendered as "the BRICs" or "the BRIC countries") is a grouping acronym that
refers to the related economies of Brazil, Russia, India, and China. Goldman Sachs argued that, since they are developing rapidly, by 2050 the combined economies of the BRICs could eclipse the combined economies of the current richest countries of the world.
positive relationship on firm performance. In Model (1) to (4), leverage is negative and significant on firm performance, both the Tobin’s Q and ROA. It is consistent with Opler and Titman (1994), Majumdar and Chhibber (1999), and Weill (2008) that leverage has negative relationship with firm performance. This indicated that firm with higher leverage will has lower firm performance. From the view of pecking order theory, rich-profit firms could meet the funding requirements through the earnings generated from operations, these companies do not use too much debt, so the stronger the performance, debt levels will be lower.
[Insert Table 8 here]
4. Conclusion
Previous study suggest that accruals principle gives the managers space to do the earning management, so they argue that earnings will become less reliable and cash flow could be preferable. Recently, FCF becomes an important firm performance index. Therefore, this paper wants to investigate EPS and FCF which has better explanatory power on firm performance. The results suggest that both EPS and FCF are positive and significant on accounting-based firm performance, ROA, no matter by countries and growth. However, only simply to compare R2 does not provide statistically reliable evidence that EPS is superior to FCF on firm performance. Therefore, we use the method provided by Vuong (1989), and the result shows EPS has better explanatory power for firm performance no matter by countries or growth.
We also find that in low-growth opportunity firms, the larger the firm size may cause lower firm performance, Tobin’s Q, which is market-based of firm performance. This indicated that when firm go in to low-growth, it already be in a mature stage and the opportunity for future growth will relatively lower. Besides, when the firm size larger the demand of external fund may increase. It may cause ownership incline towards dispersion,
and the managers may acquire some shares, which will make agency problem appear easier (Lee and Chuang, 2009). Additionally, we find that EPS and FCF do not have significant relationship on market-based firm performance in low-growth opportunity firms.
From both the effects of EPS and FCF on firm performance, we find the effects on firm performance have different results between countries, cross-country variations in firm performance are not driven only not only by financial statement factors, but it may cause by the country-level corporate governance factors, and previous study documents that corporate valuation may driven by corporate governance (LLSV, 2002; Claessens and Fan, 2002; Lemmon and Lins 2003; Brown and Caylor, 2006; Chua, Eun et al. , 2007; Bhagat and Bolton, 2008). Therefore, we add the country-level corporate governance factor, like corporate board, corruption, country risk, rule of law and shareholder’s right to discuss. The results suggest that both EPS and FCF are positive on Tobin’s Q and ROA, but only EPS is significant on both. Overall, EPS is consistent on the explanatory power of firm performance. Our study also suggest that firm in countries with higher corruption will have higher firm performance, but it is not consistent with Lee and Ng (2003) and Chua, Eun et al. (2007). We argue that comparing to the other well-developed five countries china is with highly potentiality and growth. Therefore, we exclude china to examine the regression analysis of top five world economic markets in Panel B, and the corruption index is not significant with firm performance when drop out the samples of China. This is the first paper attempt to examine the relationship between EPS、FCF、country corporate governance and firm performance. From the results, we find that EPS has more positive explanatory power for firm performance than FCF, and our finding suggest that firm in lower country risk, higher legality, higher shareholder’s right country will have positive relationship with firm performance. Therefore, U.S. is the country which has the highest shareholder’s right, the best quality of law enforcement, the lowest country risk and the best firm performance in the six economic markets.
Reference
1. Ahn, S., D. J. Denis and D. K. Denis (2006). "Leverage and investment in diversified firms." Journal of Financial Economics 79(2): 317-337.
2. Amess, K. and S. Girma (2009). "Do Stock Markets Value Efficiency?" Scottish Journal of Political Economy 56(3): 321-331.
3. Anderson, R. C., A. Duru, and D. M. Reeb (2009). "Founders, heirs, and corporate opacity in the United States." Journal of Financial Economics 92(2): 205-222.
4. Anderson, R. C. and D. M. Reeb (2003). "Founding-Family Ownership and Firm
Performance: Evidence from the S&P 500." The Journal of Finance 58(3): 1301-1328. 5. Banker, R. D., R. Huang, R. Natarjan (2009). "Incentive Contracting and Value-Relevance
of Earnings and Cash Flows." Journal of Accounting Research, Vol. 47, No. 3, pp. 647-678, June 2009.
6. Beiner, S., W. Drobetz, M. M. Schmid and H. Zimmermann (2006). "An integrated framework of corporate governance and firm valuation." European Financial Management 12(2): 249-283.
7. Bhagat, S. and B. Bolton (2008). "Corporate governance and firm performance." Journal of Corporate Finance 14(3): 257-273.
8. Brown, L. D. and K. Sivakumar (2003). "Comparing the value relevance of two operating income measures." Review of Accounting Studies 8(4): 561-572.
9. Brown, L. D. and M. L. Caylor (2006). "Corporate governance and firm valuation." Journal of Accounting and Public Policy 25(4): 409-434.
10. Brush, T. H., P. Bromiley and M. Hendrickx (2000). "The free cash flow hypothesis for sales growth and firm performance." Strategic Management Journal 21(4): 455-472. 11. Chan, K., Louis K. C. Chan, N Jegadeesh and J Lakonishok (2006). "Earnings Quality and
Stock Returns." The Journal of Business 79(3): 1041-1082.
12. Chen, S. S., R. K. Chou and S. F. Chou (2009). "The Impact of Investment Opportunities and Free Cash Flow on Financial Liberalization: A Cross-Firm Analysis of Emerging Economies." Financial Management 38(3): 543-566.
13. Chen, S. S., K. W. Ho, C. F. Lee and G. H. H. Yeo (2000). "Investment opportunities, free cash flow and market reaction to international joint ventures." Journal of Banking & Finance 24(11): 1747-1765.
14. Chua, C. T., C. S. Eun and S. Lai (2007). "Corporate valuation around the world: The effects of governance, growth, and openness." Journal of Banking & Finance 31(1): 35-56.
15. Claessens, S. and P. H. J. P. Fan (2003). "Corporate Governance in Asia: A Survey." SSRN eLibrary.
16. Collins, D. and P. Hribar (2000). " Earnings-based and accrual-based market anomalies: one effect or two?" Journal of Accounting and Economics 29 :101–123.
17. Dechow, P. M. (1994). "Accounting Earnings and Cash Flows as Measures of Firm Performance - the Role of Accounting Accruals." Journal of Accounting & Economics
18(1): 3-42.
18. Faccio, M. and M. Lasfer (1999). "Managerial Ownership, Board Structure and Firm Value: The UK Evidence." SSRN eLibrary.
19. Gabrielsen, G., J.D. Gramlich and T. Plenborg (2002). " Managerial Ownership, Information Content of Earnings and Discretionary Accruals in Non-US Setting." Journal of Business Finance and Accounting 29: 967-988.
20. Gompers, P., J. Ishii and A. Metrick (2003). "Corporate Governance and Equity Prices*." Quarterly Journal of Economics 118(1): 107-155.
21. Gottesman, A. A., M. R. Morey, E. D. Baker III and B. Godridge (2008). "Does Better Corporate Governance Result in Higher Valuations in Emerging Markets? Another Examination Using a New Data Set." SSRN eLibrary.
22. Gregory, A. (2005). "The Long Run Abnormal Performance of UK Acquirers and the Free Cash Flow Hypothesis." Journal of Business Finance & Accounting 32(5-6): 777-814. 23. Gul, F. A., J. S. Tsui and C. J. Chen (1997). "Agency Costs and Audit Pricing: Evidence
on Discretionary Accruals." SSRN eLibrary.
24. Healy, Paul M.(1985)."The effect of bonus schemes on accounting decisions." Journal of Accounting and Economics 7:85–107.
25. Healy, Paul M. and Krishna G. Palepu (1993)."The effect of firm's financial disclosure strategies on stock price."Accounting Horizons 7:1-11
26. Holthausen, R. W. and R. W. Leftwich (1983). "The economic consequences of accounting choice implications of costly contracting and monitoring." Journal of Accounting and Economics 5: 77-117.
27. Holthausen, V. (1990). "The Effect of Informedness and Consensus on Price and Volume Behavior " The Accounting Review 65(1): 191-208
28. Jensen, M. C. (1986). "Agency Costs of Free Cash Flow, Corporate Finance, and Takeovers." The American Economic Review 76(2): 323-329.
29. Jensen, M. C. (1989). "Active Investors, LBOS, and the Privatization of Bankruptcy." Journal of Applied Corporate Finance, Vol. 2, No. 1, pp. 35-44, Spring 1989. 30. Klapper, L. F. and I. Love (2004). "Corporate governance, investor protection, and
performance in emerging markets." Journal of Corporate Finance 10(5): 703-728. 31. Korczak, A. and P. Korczak (2009). "Corporate ownership and the information content of
earnings in Poland." Applied Financial Economics 19(9): 703 - 717.
32. Krishnan, G. (2003). "Audit Quality and the Pricing of Discretionary Accruals." SSRN eLibrary.
33. La Porta, R., F. Lopez-De-Silanes, A. Shleifer and R. Vishny (2002)."Investor protection and corporate valuation." Journal of Finance 57(3): 1147-1170.
virtue pay?" Working Paper, Cornell University.
35. Lee, Shin-Ping, T. H. Chuang (2009), " The determinants of corporate performance: A viewpoint from insider ownership and institutional ownership." Managerial
Auditing Journal 24(3):233-247.
36. Lemmon, M. L. and K. V. Lins (2003). "Ownership structure, corporate governance, and firm value: Evidence from the East Asian financial crisis." Journal of Finance 58(4): 1445-1468.
37. Liu, Q. and Z. Lu (2007). "Corporate governance and earnings management in the Chinese listed companies: A tunneling perspective." Journal of Corporate Finance
13(5): 881-906.
38. Maury, B. (2006). "Family ownership and firm performance: Empirical evidence from Western European corporations." Journal of Corporate Finance 12(2): 321-341. 39. Majumdar, S.K. and P. Chhibber (1999)." Capital structure and performance: evidence
from a transition economy on an aspect of corporate governance." Public Choice 98 : 287–305.
40. McConnell, J.J. and H. Servaes (1995). " Equity ownership and the two faces of debt." Journal of Financial Economics 39:131–157.
41. Morey, M., A. Gottesman, E. Baker and B. Godridge (2009). "Does better corporate governance result in higher valuations in emerging markets? Another examination using a new data set." Journal of Banking & Finance 33(2): 254-262.
42. Myers, Stewart C. and Nicholas S. Majluf (1984)‚Corporate financing and investment decisions when firms have information that investors do not have,‛Journal of Financial Economics 13, 187-221.
43. Opler, T. C. and S. Titman (1994). "Financial Distress and Corporate Performance." The Journal of Finance 49(3): 1015-1040.
44. Patel, S. A., A. Balic and L. Bwakira (2002). "Measuring transparency and disclosure at firm-level in emerging markets." Emerging Markets Review 3(4): 325-337.
45. Richardson, S. (2006). "Over-investment of free cash flow." Review of Accounting Studies 11(2-3): 159-189.
46. Shivakumar, L., 2000. Do firms mislead investors by overstating earnings before seasoned equity offerings? Journal of Accounting and Economics 29, 339–371.
47. Shuto, A. (2007). "Executive compensation and earnings management: Empirical evidence from Japan." Journal of International Accounting, Auditing and Taxation
16(1): 1-26.
48. Sloan, R. G. (1996). "Do stock prices fully reflect information in accruals and cash flows about future earnings?" Accounting Review 71(3): 289-315.
49. Stulz, R. (1990). "Managerial discretion and optimal financing policies." Journal of Financial Economics 26(1): 3-27.
Management, Corporate Governance, and True Financial Performance." SSRN eLibrary.
51. Teoh, S. H., I. Welch and T. Wong (1998)." Earnings management and the long-run market performance of initial public offerings." Journal of Finance 53:1935-1974. 52. Vuong, Q. H. (1989). "Likelihood Ratio Tests for Model Selection and Non-Nested
Hypotheses." Econometrica 57(2): 307-333.
53. Warfirld, T. D., J. J. Wild and K. L. Wild (1995) "Managerial Ownership, Accounting Choices, and Informativeness of Earnings."Journal of Accounting and Economics
20:61-91.
54. Watts, Ross L. and Jerold L. Zimmerman (1986). "Positive accounting theory" (Prentice Hall, Englewood Cliffs, NJ).
55. Weill, L. (2008). "Leverage and Corporate Performance: Does Institutional Environment Matter?" Small Business Economics 30(3): 251-265.
56. Wright, P., M. Kroll, A. Mukherji and M. Pettus, (2009). "Do the contingencies of external monitoring, ownership incentives, or free cash flow explain opposing firm performance expectations?" Journal of Management and Governance 13(3): 215-243.
Appendix: Vuong’s test
With both EPS and FCF are positive and significant with firm performance, ROA. So we want to find EPS and FCF which is a better estimate for valuing firm performance as firm ROA. For this purpose, both are set up as a competing model to explain firm ROA. This paper use a recent development in model selection techniques, previous studies (Dechow, 1994; Brown and Sivakumar 2003; Shuto, 2007) also use the method is provided by Vuong (1989). Vuong has provided a likelihood ratio test for model selection, and the test is suitable for any non-nested, overlapping, and nested competing model. The null hypothesis of Vuong’s test is the two models are equally close to explaining the true data generating process, and the alternative is one model has more explaining ability. Therefore, Vuong’s test statistic may produce the result that both models have explanatory power, but provides the direction of choosing the more explanatory model.
The first model is regressing firm ROA on EPS, and excluding time subscripts: ) (1)
The second model is regressing firm ROA on FCF, and excluding time subscripts: ) (2)
1. Assume are independent and normally distribution, and the joint density of the first model observations is:
(3)
2. The log likelihood function of the first model is: log
(4) When L be maximizing, the maximum likelihood estimators of and are the
same as the least squares estimators of and . Therefore, using the least squares estimators to substitute. For each observation i, we can get:
(5)
3. is the maximum likelihood estimate of , where is the residual sum of squares from the regression of firm ROA on earnings per share.
4. The log likelihood function of the second model can be obtained by above process: log
(6)
5. is the maximum likelihood estimate of , where is the residual sum of squares from the regression of firm ROA on free cash flow per share. And for each observation i, we can get:
(7)
6. In Eq.(4), we substitute for , and substituting for in Eq.(6) . Therefore, we can obtain estimates of and .
By the likelihood ratio test, we can compare which the two models explains more of the firm ROA.
(8) 7. is the estimate of variance of LR, represented by following function:
(9)
8. The statistic is formed by:
(10)
This test has the mean of direction, if the Z-statistic is positive and significant, that indicated the first model is the better choice, whereas if the Z-statistic is negative and significant, that indicated the second model is the better one.
9. Except for above process, there is a simpler approach to estimate the Z-statistic. To substitute Eq.(4)and Eq.(6) into Eq.(8), for each observation i, we can obtain:
(11)
To Simplify the above function, for each observation i, we can obtain :
(12)
If we summed for each observation i, the results will equal to the LR in Eq.(8), finally we estimate the standard deviation of LR, the Z-statistic will be obtained. Vuong(1989) also provided another method that regressing on unity to calculate the Z-statistic instead of estimating the standard deviation of LR. The Z-statistic can be obtained from multiplying the t-statistic of the regression by . The positive and significant Z- statistic indicates that the first model is the model of choice, because the residuals of the second model are larger than the first model.
Table 1 The top six world economic markets
This table provided the top six world economic markets selected by annual Gross Domestic Product (GDP), and the six economic markets are USA、Japan、Germany、UK、France、China. The GDP of top six world economic markets are reported annual in billion dollars during the sample period, 2003-2007. USA is the top 1 economic market in the world selected by annual GDP, and its annual GDP is larger than other countries. Japan and Germany are world top 2 and 3, and the others are 4 to 6. Panel B provided the ratio of sum of top six economic markets' GDP to sum of all countries' GDP in the world. Total_six means sum of top six economic markets' GDP in each year, and Total_world means sum of 57 world main countries’ GDP in each year. The top six world economic markets' GDP are almost above 60% of world total GDP, so that the top six world economic markets can be a proxy for the whole world.
US$ billions
Panel A: Ranking of the top six economy markets bases on GDP 2003 Rank 2004 Rank 2005 Rank 2006 Rank 2007 Rank USA 10,960.80 1 11,685.90 1 12,421.90 1 13,178.40 1 13,807.60 1 Japan 4,230.32 2 4,609.88 2 4,557.08 2 4,358.80 2 4,380.51 2 Germany 2,442.21 3 2,745.10 3 2,789.70 3 2,912.43 3 3,316.32 3 UK 1,862.34 4 2,198.90 4 2,277.27 4 2,434.44 5 2,804.40 5 France 1,800.00 5 2,061.34 5 2,146.58 6 2,267.55 6 2,589.98 6 China 1,640.97 6 1,931.64 6 2,235.91 5 2,657.88 4 3,280.05 4 Panel B: The proportion of sum of the top six world economy markets' GDP to sum of all countries' GDP in the world
2003 2004 2005 2006 2007
Total_six 22,936.64 25,232.76 26,428.45 27,809.50 30,178.86 Total_world 35,411.20 39,788.48 42,773.06 46,063.57 51,576.67
Table 2 Description of variables
This table shows the description of variables used in this study. The full sample period is from 2003 to 2007.
Variables Proxy Definition
Tobin’s Q Market-based firm performance (Market value of equity+Book value of liability ) /Book value of assets.
ROA
Accounting-based firm performance
(Income before extraordinary items-Preferred dividends+share capital dividends) /Book value of assets.
Size Firm size The natural log of book value of assets at fiscal year end.
EPS Earnings per share (Income before extraordinary items-Preferred dividends) /Common shares outstanding . FCF Free cash flow per share (Operating activities net cash flow-Cash
dividends-Capital expenditures)/Common shares outstanding.
Leverage Firm leverage (Book value of liability-Divided by common stock) /Book value of equity.
Corporate boards Corporate boards The natural log of corporate boards index; corporate boards index is from IMD World Competitiveness Online. It do supervise the management of companies effectively, and the index is from 0 to 10(best).
Corruption Corruption The natural log of corruption index; corruption index is from Transparency International, and ranges between 0 (highly corrupt) and 10.
Country risk Country risk The natural log of country risk; country risk is from Euromoney. The measure is taken from the
September issues of Euromoney, and ranges between 0 (highly risk) and 100.
Rule of law Rule of law The natural log of legal and regulatory framework measure; legal and regulatory framework is from
IMD World Competitiveness Online, and the index is from 0 to 10(best).
Shareholder's right Shareholder's right The natural log of shareholder's right index; shareholder's right index is from IMD World Competitiveness Online. The index is from 0 to
Table 3 Mean statistics by variables
Table 3 reports some descriptive statistics on the world six economic markets sample of market value、 book value of debt、book value of asset、Tobin’s Q and some variables of financial statement and corporate governance, averages over 2003-2007. The number of samples (N) for each economic market is also reported in the table. There are 9,320 samples for USA, 12,465 for Japan, 1,515 for Germany, 2,335 for UK, 1,325 for France and 1,805 for China. The total samples contain 28,765 observations.
USA Japan Germany UK France China Total
N 9320 12465 1515 2335 1325 1805 28765
Market value of equity($M) 5183.74 1112.34 2690.40 3144.52 3738.99 2129.96 2864.41 Book value of debt($M) 2783.43 1233.29 3878.46 1682.55 3575.81 891.12 1997.76 Book value of assets($M) 4528.36 1952.60 5253.73 3031.89 5243.54 1744.19 3187.15 Tobin's Q 2.03 1.15 1.49 1.71 1.52 1.87 1.56 ROA 0.04 0.02 0.00 0.03 0.03 0.03 0.03 EPS($) 0.95 0.47 0.99 0.30 2.41 0.03 0.70 EPS/P0 0.02 0.04 -0.01 0.03 0.05 0.04 0.03 FCF($) 0.56 0.18 0.40 0.28 0.59 -0.03 0.33 FCF/P0 0.04 0.03 0.02 0.06 0.03 -0.06 0.03 Leverage 0.44 0.31 0.34 0.24 0.41 0.17 0.35 Corporate boards 5.63 5.02 5.07 5.85 5.29 5.67 5.34 Corruption 7.42 7.26 7.98 8.58 7.24 3.36 7.21 Country risk 95.99 90.55 90.97 93.30 90.81 61.44 90.74 Rule of law 6.03 4.48 3.59 4.74 3.53 5.67 4.99 Shareholders' rights 7.38 5.11 7.33 7.07 6.47 5.15 6.19
Table 4 Earnings Per Share and Firm Performance
The table reports the effect of EPS on firm performance for the period 2003 to 2007. The results are based on panel regressions. The dependent variable in Panel A is ln(Tobin’s Q), and Tobin’s Q is defined as the market value of equity plus the book value of debt divided by book value of assets. The dependent variable in Panel B is return on assets (ROA), which is defined as income before extraordinary items minus preferred dividends plus share capital dividends divided by book value of asset. Firm size is the natural log of book value of assets. Leverage is debt to equity ratio. T statistics are in parentheses; *, **, and *** indicate significance at 10%, 5%, and 1% respectively.
Dependent variable : Ln(Tobin's Q)
Country (1) USA (2) Japan (3) Germany (4) UK (5) France (6) China (7) ALL
Panel A: Regression analysis on Tobin's Q
Independent variable Intercept 0.190*** -0.116*** 0.313*** 0.403*** 0.410*** 0.820*** 0.238*** (11.646) (-9.228) (10.584) (15.927) (14.306) (13.566) (23.661) Firm size 0.009*** 0.029*** 0.005 0.005 -0.004 -0.053*** 0.016*** (3.216) (13.938) (0.965) (0.937) (-0.822) (-5.184) (9.784) EPS/P0 0.053** 0.086*** 0.095*** 0.180*** 0.059 0.030 0.020*** (2.137) (4.055) (3.158) (3.018) (0.718) (0.282) (2.593) Leverage -0.062*** 0.0198*** -0.106*** -0.097*** -0.106*** -0.092** -0.077*** (-6.786) (3.368) (-5.169) (-2.983) (-4.932) (-2.228) (-15.837) Adj. R-square(%) 0.57 1.958 2.174 0.6715 2.226 2.413 1.005 N 9320 12465 1515 2335 1325 1805 28765
Dependent variable : ROA
Country (1) USA (2) Japan (3) Germany (4) UK (5) France (6) China (7) ALL
Panel B: Regression analysis on ROA
Independent variable Intercept -0.023*** -0.006*** -0.056*** -0.003*** -0.005 -0.025*** -0.034*** (-8.867) (-3.203) (-6.233) (-8.317) (-1.093) (-4.387) (-19.549) Firm size 0.006*** 0.004*** 0.011*** 0.009*** 0.004*** 0.007*** 0.011*** (14.510) (13.064) (6.597) (11.614) (5.440) (7.144) (38.715) EPS/P0 0.303*** 0.231*** 0.277*** 0.446*** 0.397*** 0.429*** 0.081*** (75.334) (79.264) (30.124) (47.318) (32.572) (41.826) (60.331) Leverage -0.014*** -0.014*** -0.011* -0.017*** -0.021*** -0.022*** -0.019*** (-9.696) (-17.421) (-1.752) (-3.264) (-6.436) (-5.724) (-23.358) Adj. R-square(%) 40.862 36.697 41.112 53.337 47.390 54.197 16.125 N 9320 12465 1515 2335 1325 1805 28765
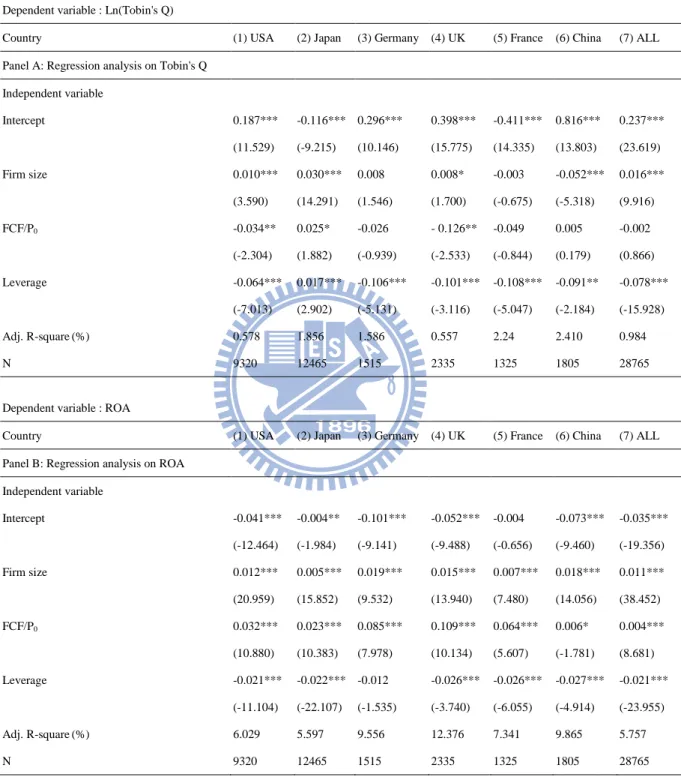
Table 5 Free Cash Flow Per Share and Firm Performance
Panel A and B shows the effect of FCF on firm performance for the period 2003 to 2007. The results are based on panel regressions. The dependent variable in Panel A is ln(Tobin’s Q), and Tobin’s Q is defined as the market value of equity plus the book value of debt divided by book value of assets. The dependent variable in Panel B is return on assets (ROA), which is defined as income before extraordinary items minus preferred dividends plus share capital dividends divided by book value of asset. T statistics are in parentheses; *, **, and *** indicate significance at 10%, 5%, and 1% respectively.
Dependent variable : Ln(Tobin's Q)
Country (1) USA (2) Japan (3) Germany (4) UK (5) France (6) China (7) ALL
Panel A: Regression analysis on Tobin's Q
Independent variable Intercept 0.187*** -0.116*** 0.296*** 0.398*** -0.411*** 0.816*** 0.237*** (11.529) (-9.215) (10.146) (15.775) (14.335) (13.803) (23.619) Firm size 0.010*** 0.030*** 0.008 0.008* -0.003 -0.052*** 0.016*** (3.590) (14.291) (1.546) (1.700) (-0.675) (-5.318) (9.916) FCF/P0 -0.034** 0.025* -0.026 - 0.126** -0.049 0.005 -0.002 (-2.304) (1.882) (-0.939) (-2.533) (-0.844) (0.179) (0.866) Leverage -0.064*** 0.017*** -0.106*** -0.101*** -0.108*** -0.091** -0.078*** (-7.013) (2.902) (-5.131) (-3.116) (-5.047) (-2.184) (-15.928) Adj. R-square(%) 0.578 1.856 1.586 0.557 2.24 2.410 0.984 N 9320 12465 1515 2335 1325 1805 28765
Dependent variable : ROA
Country (1) USA (2) Japan (3) Germany (4) UK (5) France (6) China (7) ALL
Panel B: Regression analysis on ROA
Independent variable Intercept -0.041*** -0.004** -0.101*** -0.052*** -0.004 -0.073*** -0.035*** (-12.464) (-1.984) (-9.141) (-9.488) (-0.656) (-9.460) (-19.356) Firm size 0.012*** 0.005*** 0.019*** 0.015*** 0.007*** 0.018*** 0.011*** (20.959) (15.852) (9.532) (13.940) (7.480) (14.056) (38.452) FCF/P0 0.032*** 0.023*** 0.085*** 0.109*** 0.064*** 0.006* 0.004*** (10.880) (10.383) (7.978) (10.134) (5.607) (-1.781) (8.681) Leverage -0.021*** -0.022*** -0.012 -0.026*** -0.026*** -0.027*** -0.021*** (-11.104) (-22.107) (-1.535) (-3.740) (-6.055) (-4.914) (-23.955) Adj. R-square(%) 6.029 5.597 9.556 12.376 7.341 9.865 5.757 N 9320 12465 1515 2335 1325 1805 28765