國
立
交
通
大
學
管 理 科 學 系
碩
士
論
文
探討客製化、認知需求與產品種類對於顧客滿意度及
購買意願的影響
The Interactive Effects between Need for Cognition and
Level of Customization on Customer Satisfaction and
Purchase Intention across Different Product Types
研 究 生:邱 柏 源
指導教授:張 家 齊 博士
中 文 摘 要
客製化的目的藉由讓顧客參與產品設計,提供最適合消費者需求的產品;換句話 說,客製化就是把消費者視為共同的生產者,讓消費者自己設計要購買的產品。在這個 以消費者為中心的社會中,越來越多公司採用客製化的策略,目的就是要讓消費者更滿 意、並且提高消費者的購買意願。本篇研究旨在探討當消費者參與設計的過程,對滿意 度及購買意願的影響;在客製化的過程中,消費者必須處理產品有關的資訊,而認知需 求代表對於處理資訊的喜好程度,所以本研究探討認知需求會如何影響消費者對於客製 化產品的滿意度及購買意願。此外,不同產品的特性也會影響到客製化的效果,本研究 深入探討不同的產業類別中,認知需求和客製化之間的交互作用如何影響到對產品的滿 意度及購買意願。結果指出,高認知需求的人對於體驗性產品的客製化有較明顯的滿意 度增量,同時也更願意去購買;而低認知需求的人則對於搜尋性產品有較明顯的滿意度 增量,購買意願也較高。Abstract
The purpose of customization is to provide products which meet the needs of each individual customer because they can participate in design process. In other words, customers are considered co-designers during process of customization. They can design the products which they are going to buy on their own. In order to make customers more satisfied and have higher purchase intention, more and more products providers adopt customization strategy in this customer-centric society. This study investigated the effects of customer participation on satisfaction and purchase intention. During the process of customization, customers need to deal with information which is related to products. Need for cognition represents tendency to deal with customization. Hence, we investigated the impacts of interaction between need for cognition and customization on satisfaction and purchase intention. Furthermore, we also try to find out the impacts of interaction between need for cognition and customization on satisfaction and purchase intention across different products types. The results show that high-NFC customers are more satisfied with customized experience products and low-NFC customers are more satisfied with customized search products.
致謝
兩年研究所的生活一下子就結束了,我很驕傲我成功的完成一篇論文,也許不是什 麼曠世巨作,但絕對是我這輩子花最多時間,最用心去完成的一件任務。在過程中,有 許多人曾經給我幫助,首先,我非常感謝我的指導老師—張家齊博士,張老師是我這輩 子遇過最平易近人而且最認真的老師,老師平常就像是我們的朋友,可以跟我們很自然 的聊天,但是做研究的時候,卻絲毫不馬虎,她每個星期都要花至少五個小時跟所有指 導學生 meeting,適時給予我們意見,讓我們可以更順利的完成碩士論文,在這一年的 指導中,老師犧牲許多自己的休閒時間,因為有她耐心的指導,我的論文才能如期完成。 感謝我的父母,讓我在念書的時候不需要去煩惱經濟上的問題,謝謝你們讓我可以 全心的完成學業,也謝謝我所有的家人,在我遇到困難的時候,沮喪的時候給我鼓勵, 我知道你們永遠支持我,謝謝你們給我的一切,讓我可以很順利的完成我的碩士學位。 接下來,我要感謝我同門的同學們—雅君、慧妤、培真以及艾芸,謝謝你們這一路 上的陪伴,一起經歷過低潮,也一起體驗成功的滋味,有了彼此的陪伴,痛苦的日子好 像也沒那麼難熬,這一年來跟你們相處的時光很開心,完成論文後,表示我們也要分開, 希望你們都能找到一個很棒的工作,我會很想念跟你們一起努力的日子,我會想念雅君 誇張的表情,慧妤與世無爭的個性,培真火爆的事蹟以及艾芸豁達的心態,謝謝你們, 謝謝你們讓我研究所的生活變得更精彩。 最後,謝謝曾經被我打擾,幫我填寫問卷的所有朋友們,謝謝你們的耐心,也謝謝 你們在過程中給我的意見,讓我的論文做得更好,感謝你們在我需要幫忙的時候願意伸 出援手,也許對你們來說是件小事,但對我來說卻很重要,謝謝。 邱柏源 謹誌 交通大學管理科學所 九十七年六月Table of Contents
中 文 摘 要 ... i Abstract ... ii 致謝 ... iii Table of Contents ... iv List of Tables ... viList of Figures ... vii
Chapter 1 Introduction ... 1
1.1 Research background ... 1
1.2 Research objectives ... 1
1.3 Research process... 4
Chapter 2 Literature Review ... 6
2.1 Research Framework ... 6 2.2 Customization ... 7 2.3 Satisfaction ... 8 2.4 Purchase intention ... 9 2.5 NFC ... 9 2.6 Product type ... 12
Chapter 3 Research Methodology ... 17
3.1 Overview ... 17
3.2 Stimulus and manipulations ... 17
3.2.1 Stimulus ... 17 3.2.2 Manipulation of customization ... 18 3.3 Experimental design ... 19 3.4 Procedure ... 19 3.5 Measurements ... 20 3.5.1 NFC ... 20 3.5.2 Satisfaction ... 21 3.5.3 Purchase intention ... 22 3.5.4 Perceived risk ... 23 3.5.5 Perceived importance ... 23 3.6 Pretest ... 23
Chapter 4 Research Analysis and Results ... 25
4.1 Background of Participants ... 25
4.2 Reliabilities ... 25
4.3 Manipulation checks ... 26
4.3.1 Manipulation check of selection ... 26
4.3.2 Manipulation check of product type ... 26
4.4 Analysis of results ... 27
4.4.1 Effects of customization on customer satisfaction and purchase intention ... 27
4.4.2 Interaction between NFC and levels of customization ... 28
4.4.3 Interaction between NFC and customization levels across product types ... 35
Chapter 5 Discussion and Future Research ... 41
5.1 Discussion for results ... 41
5.2 Implications ... 43
5.3 Limitations ... 43
5.4 Future research ... 44
Appendix2. Scenario for Standard Search product ... 59 Appendix3. Scenario for Customized Experience product (with questionnaire) ... 64 Appendix4. Scenario for Standard Experience product ... 75
List of Tables
Table 1 Cells of Experimental Design. ... 19
Table 2 Reliability Statistics ... 24
Table 3 Demographics of Participants ... 25
Table 4 Reliability Statistics ... 26
Table 5 Manipulation Check of Selection ... 26
Table 6 Manipulation Check of Product Type ... 27
Table 7 Manipulation Check of Product Type ... 27
Table 8 Descriptive Statistics of Perceived Importance ... 28
Table 9 Descriptive Statistics of Customization Level ... 28
Table 10 Descriptive Statistics of Satisfaction ... 29
Table 11 Descriptive Statistics of Purchase Intention ... 29
Table 12 MANCOVA ... 30
Table 13 ANCOVA of Satisfaction ... 32
Table 14 ANCOVA of Purchase Intention ... 33
Table 15 Perceived risk of High-NFC customers in Experience Product ... 35
Table 16 Perceived risk of Low-NFC customers in Experience Product ... 35
Table 17 Perceived risk of High-NFC customers in Search Product ... 36
Table 18 Perceived risk of Low-NFC customers in Search Product ... 36
Table 19 Descriptive Statistics of Satisfaction (Notebook) ... 36
Table 20 Descriptive Statistics of Satisfaction (Travel) ... 36
Table 21 Descriptive Statistics of Purchase Intention (Notebook) ... 37
List of Figures
Figure 1 Research Flow ... 5
Figure 2 Research Framework ... 6
Figure 3 Interaction Effect on Satisfaction ... 34
Figure 4 Interaction Effect on Purchase Intention ... 34
Figure 5 Interaction between NFC and customization Level ... 38
Figure 6 Interaction between NFC and customization Level ... 38
Figure 7 Interaction between NFC and Customization Level ... 39
Chapter 1 Introduction
1.1 Research background
Since customers nowadays are no longer willing to relinquish their own preferences, they are finding products or services which exactly meet their needs. Individualization of demand is increasing. Pine, Peppers, and Rogers (1995, p. 103) argue that “Customers, whether
consumers or businesses, do not want more choices. They want exactly what they want—when, where, and how they want it—and technology now makes it possible for companies to give it to them.” Therefore, customization strategy is becoming more and more important for
companies. Many companies have already adopted customization strategies, for example, the international sports shoes companies like Adidas, and Nike. Because of a tendency towards a new awareness of quality and functionality that demands durable and reliable products corresponding exactly to the needs of the buyer, Adidas’ management decided to head towards mass customization (Berger & Piller, 2003) and created its customized sports shoe brand “mi adidas”, and it can charge higher premiums of up to 50% higher. Another example is Olay. In 2008, this company offered a website (http://www.olayforyou.com/index.jsp) where customers can follow the directions and get the most suitable products that Olay recommends for them. Capital one has recently started offering a customized credit card service. Customers can choose which interest rate they want and other personal preferences on the website: http://www.capitalonecardlab.com/?linkid=WWW_Z_Z_tg04a_CCOMP_C1_01_T_ BYOCG. These companies are all applying customization strategy and their purpose is to increase their competiveness and profits.
1.2 Research objectives
In any industry, what companies really care is how customers will be satisfied with customized service? And how much are customers willing to pay for it? Companies need to
determine the optimal level of customization in order to maximum profits. It is, however, easy to see that increasing customization levels not only increases benefits, but also increases costs. If companies keep elevating customization level, what they pay may exceed what they earn. Similarly, if they offer too low a customization level, they lose the opportunity to earn more. Neither situation is ideal for a company. Thus, it’s important to find the optimal customization level. Furthermore, as customers participate in a product design process (like at Nike), they are required to spend some time “designing” the products or services, they need to deal with more information (B. J. Pine et al., 1995). Need for cognition (NFC) thus refers to an individual’s tendency to engage in and enjoy effortful cognitive endeavors (Cacioppo & Petty, 1984). Hence, we infer that high-NFC customers enjoy customization processes more than low-NFC customers. Also, different product types have different traits. For example, qualities of products being searched for may be known before being purchased, but customers can only experience the quality after purchase. This characteristic may have different effects for either high-NFC or low-NFC customers. If we can clarify the interaction among three variables, companies would know how to apply customization strategies favorably in different circumstances.
This research project was conceived to find out if the relationship between customization level and satisfaction or purchase intention across different service types would be affected by the level of customers’ need for cognition (NFC).
The following research questions were developed:
1. Do customers feel more satisfied with customized products?
2. Do customers have higher purchase intention for customized products?
3. Are there any differences in satisfaction and purchase intention between high and low-NFC customers when buying customized or standard products?
products than standard experience (search) products?
5. Do high-NFC customers have higher purchase intention for customized experience (search) products than standard experience (search) products?
6. Do low-NFC customers feel more satisfied with customized experience (search) products than standard experience (search) products?
7. Do low-NFC customers have higher purchase intention for customized experience (search) products than standard experience (search) products?
1.3 Research process
The research was designed as follows. First, a framework is presented in Chapter 2. Second, the literature pertinent to customization, need for cognition and product type was reviewed and integrated with the various research hypotheses, each hypothesis being followed the literature reviewed. Methodology is presented in Chapter 3, which includes experimental design, manipulation, measurements and the statistical method used to test the hypotheses. After analyzing the data, I report the results, and make conclusions. I also discuss the implications and limitations of this project, and make suggestions for the direction of future research in the last chapter.
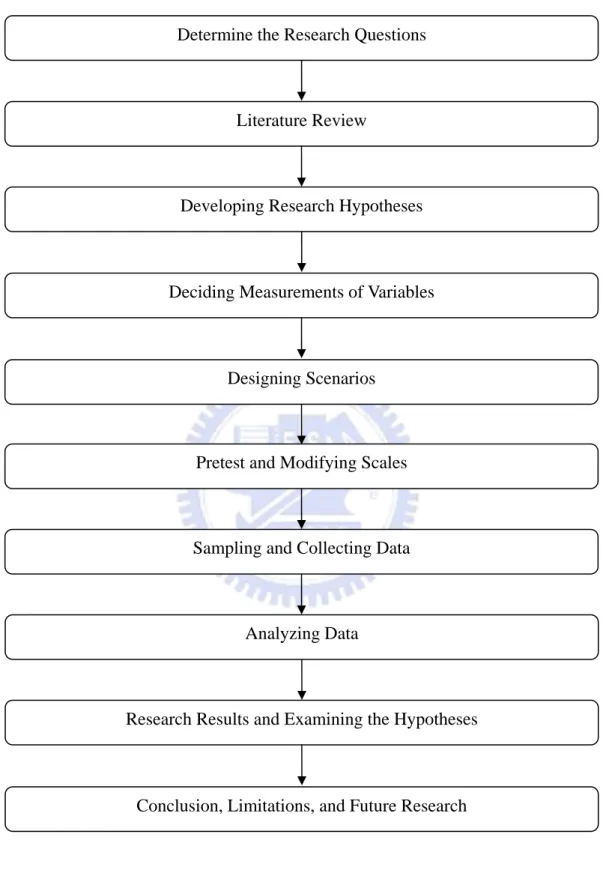
Figure 1 Research Flow
Determine the Research Questions
Literature Review
Developing Research Hypotheses
Deciding Measurements of Variables
Sampling and Collecting Data Designing Scenarios
Pretest and Modifying Scales
Analyzing Data
Research Results and Examining the Hypotheses
Chapter 2 Literature Review
2.1 Research Framework
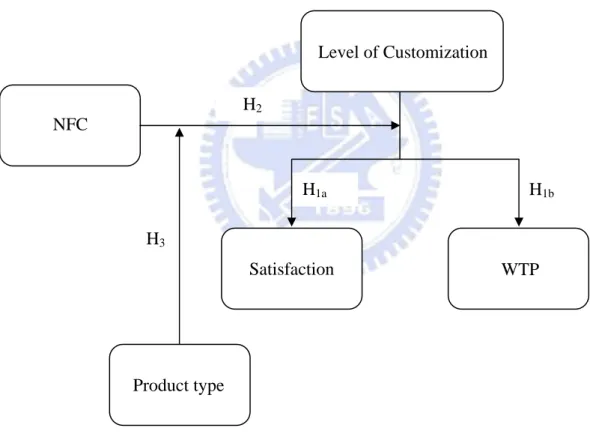
The major focus of this research is to analyze whether the impacts of customization level on customers’ satisfaction and their purchase intention would be different across different product types. Furthermore, I also analyze how the moderator, the need for cognition, influences the effects of customization level on satisfaction and purchase intention across different product types. Figure 2 is the conceptual model followed in this study. The variables will be discussed in the literature review that follows.
Figure 2 Research Framework
H3 H1b H1a H2 NFC Level of Customization Satisfaction WTP Product type
2.2 Customization
Definitions of mass customization are abundant in the literature. It can be defined either in a broad or a narrow way. Davis (1989) first coined the broad concept of mass customization as the ability to provide individually designed products or services to every customer through high process agility, flexibility and integration (Eastwood, 1996; Hart, 1995; J. Pine, Victor, & Boyton, 1993; Silveira, Borenstein, & Fogliatto, 2001). Mass customization systems may contact customers in the mass market economy but fulfill individual requirements as in pre-industrial economies (S. Davis, 1989).
Many authors who propose a narrower concepts of mass customization define it as a system that uses information technology, flexible processes, and organizational structures to deliver a wide range of products and services that meet the specific needs of individual customers, at a cost near that of mass-produced items (Silveira et al., 2001).
The development of mass customization systems is based on three main ideas. First, new flexible and agile manufacturing and information technologies enable production systems to customize goods or services at lower cost. Second, demand for product variety and customization is increasing. Finally, the shortening product life cycles and expanding industrial competition has led to the breakdown of many mass production industries. Therefore, the need for production strategies focused on individual customers is increasing (Ahlstrom & Westbrook, 1999; Hart, 1995; Kotha, 1995; J. Pine, 1993b; Silveira et al., 2001). Another ambitious definition of mass customization was proposed by Hart who defined it as “the ability to provide your customers with anything they want profitably, any time they want
2.3 Satisfaction
According to the expectancy disconfirmation paradigm (Oliver, 1980), customers’ satisfaction is based on the expectation that previously held perceptions of product or service performance continue to be valid. In addition, cognitive processes of confirmation / disconfirmation lead to positive or negative emotions, and thus contribute to satisfaction or dissatisfaction (Homburg, Koschate, & Hoyer, 2005; Oliver, Rust, & Varki, 1997; Oliver , Rust , & Varki 1997). Satisfaction is the result of customer’s evaluation of products or services after consumption or usage, containing both cognitive and affective elements (Oliver, 1997). Besides, customers’ satisfaction / dissatisfaction can be judged by the qualities and benefits customers gained, and the costs and efforts they obtain from the purchase (Ostrom & Iacobucci, 1995). Satisfaction is also a function of customers’ evaluation of service quality, product quality and price (Parasuraman, Zeithaml, & Berry, 1994). Satisfaction reflects whether consumers’ expectations have been met. It is negatively related to complaint behavior (Bearden & Teel, 1983). Bardakci and Whitelock (2004) summarized the work by Peppers and Rogers (1997), which showed that when customers are satisfied, price is no longer important to them (Bardakci & Whitelock, 2004; Peppers & Rogers, 1997). According to this argument, research of British Airways with USAir revealed that passengers in America were willing to pay more for a comfortable seat (Bardakci & Whitelock, 2004). Thus, it is conceivable that the more consumers are satisfied, the more profit companies can earn.
Since customized products are more likely to meet customers’ exact needs and desires (J. Pine, 1993a), customers perceive higher value in customized products (Flynn, 1999). Hence, when providing products or services that meet customers’ needs more precisely, it is likely to achieve a higher level of satisfaction. Also, customized products would conform more closely to customers’ needs than standard products do; we maintain customers will feel more satisfied
with customized products than with standard products. The following hypothesis was thus developed:
Hypothesis 1a: Customers are more satisfied with customized products than standard
products.
2.4 Purchase intention
Willingness to buy is defined as the likelihood that buyers intend to purchase a product (Dodds, Monroe, & Grewal, 1991). In their research, willingness to buy is a term similar to purchase intention. Therefore, purchase intention in our research is defined as the possibility that customers are willing to purchase a product or a service.
Customers’ overall satisfaction contribute to their attitude towards overall service quality which means more satisfied customers also think that qualities of products are higher (Shu, Crompton, & Willson, 2002). Past studies suggested that when customers perceived higher qualities of products, they are more likely to buy the products (Dodds et al., 1991).Also, Oliver (1980) indicated that satisfaction is believed to have influence on purchase intention. On the other hand, more satisfied customers have higher purchase intentions.
This led to formulating the following hypothesis:
Hypothesis 1b: Customers have higher purchase intention for customized products than
standard products.
2.5 NFC
The term need for cognition (NFC) was first coined by Cohen and his colleagues. They defined NFC as “a need to structure relevant situations in meaningful, integrated ways. It is a
need to understand and make reasonable the experimental world” (Cohen, Stotland, & Wolfe,
1955, p. 291) and they argued that ”stronger needs lead people to see a situation as
ambiguous even if it is relatively structured, indicating that higher standards for cognitive clarity are associated with greater need for cognition" (Cohen et al., 1955, p. 292). They also
conceptualize that NFC as ambiguous intolerance which means high-NFC customers have lower tolerance toward ambiguous situation (Cohen et al., 1955).
Need for cognition (NFC) can also be defined as a person's tendency to engage in and enjoy effortful cognitive activity. NFC is a stable individual difference. Cacioppo and Petty (1982) defined need for cognition at a macrolevel, and they argued that NFC is a person’s general tendency to engage in and enjoy cognitive endeavors or effortful thinking, rather than a chronic tendencies to deal with information in a particular domain or as individual variations in cognitive complexity (Cacioppo, Petty, Feinstein, & Jarvis, 1996). In other words, customers have high need for cognition are willing to dealing with information in all kinds of fields such as math, science, computer and so forth, rather than in particular domain such as math.
Customers who are low in need for cognition were defined by the relative absence of extended tendencies to engage in and enjoy effortful cognitive endeavors (Cacioppo et al., 1996). They are not willing to deal with information and avoid any cognitive activities.
The levels of effortful thinking and problem solving that people engage in can vary, including the numbers of dimensions that are considered or the extent of thought or elaboration in each dimension (Cacioppo et al., 1996). For example, when high-NFC customers are selecting a computer from three alternatives, they probably consider more dimensions such as hardware, screen, memory and CPU while low-NFC customers may only take one dimension such as CPU into consideration. Moreover, high-NFC customers think further in each dimension, for example, they consider screen size and screen dpi. In contrast,
customers who are low in need for cognition only consider screen size
Tam and Ho indicated that the interaction between NFC and preference matching is more salient for high-NFC customers than it is for low-NFC customers. In the research of Tam and Ho, participants were first asked to fill in a questionnaire about their demographic information ring-tong download habits and personality. And then they were asked to indicate their preferences for rhythms and singers. Finally, they were asked to select one ring tone from the list. Half of the participants received high preference-matching ring tones which came from the participant’s favorite singers and rhythms. And the rest participants received low-preference matching ring tongs which are randomly selected. When users who are high in need for cognition face high preference-matching content, they elaborate the information to a larger extent and are more likely to accept the choice outcome (Tam & Ho, 2005). In the research of Tam and Ho, the level of preference-matching represents a concept similar to level of customization in this study, and choice outcome represents customer’s purchase behavior. In other words, high-NFC users inherently enjoy processing information (Cacioppo & Petty, 1982), so that when they have the chance to customize, they will process further and choose products which meet their needs more closely. Thus feel more satisfied. That’s why they are more likely to accept the choice outcome. Based on their research, we speculate similar results will be found in our study: high-NFC customers are more likely to elaborate information when customizing and thus they are more satisfied with customized than standard products, and they have higher purchase intention.
Tam and Ho (2005) also indicated that low-NFC customers process more and are more likely to accept customized offers when they see preference-matching content. But the interaction between NFC and preference matching is less significant for low-NFC customers. In other words, low-NFC customers will not process additional information when buying customized products. There is no difference between customized and standard products for
them. Therefore, the difference in satisfaction is not significant. In this study, our speculation follows their results and accordingly, the following hypotheses were formulated:
Hypothesis 2a: The increased customer satisfaction due to customization is larger for
high-NFC customers than for low-NFC customers.
Hypothesis 2b: The increased customer purchase intention due to customization is larger
for high-NFC customers than for low-NFC customers.
2.6 Product type
Numerous product classifications have been provided in the marketing literature. The product classification that was adopted for this research project is based on three distinctive attributes: search, experience and credence attributes (Darby & Karni, 1973; Nelson, 1970 ).
Nelson (1970 ) distinguished between products on the basis of search versus experience attributes. Search characteristics can be evaluated prior to purchase and experience characteristics were those attributes that can be discerned only after purchase and consumption. Darby and Karni (1973) extended Nelson’s work and created a new attribute which is called ”credence”, and proposed that credence attributes cannot be judged confidently by consumers even after they purchase and consumption (Darby & Karni, 1973). Search attributes are qualities of a service or product that can be judged prior to consumption and use of the service or product (e.g. colors of a pair of shoes). Search attributes can be divided into linguistic or cognitive and sensory attributes. Linguistic or
cognitive attributes are those that can be described by any written or verbal documentation of
a product’s characteristics or benefits, including features like a product’s physical dimensions, ingredients and composition (e.g. size, color). It also includes the physical benefits or
outcomes of a product’s use (e.g. the processor speed in a computer). These can be communicated either in writing or orally in a relatively objective manner (Mittal, 2004).
Sensory attribute refers to the physical features of a product, which interface with human
senses (e.g. sound, touch, taste, smell) (cf. Lindaucer, 1972). Since one has to experience sensory attributes with one’s own senses, all of them are deemed to be experiential. In some cases, however, if these attributes can be experienced before purchase, then they can be referred to as search attributes. For example, by tasting a food item before buying, smelling the perfume prior to purchase and so on.
Experience attributes are those qualities of a service or product that need to be experienced by customers themselves (e.g. the quality of a restaurant). To distinguish precisely, experience quality can be divided into experience attributes and experience benefits. Experience attributes are inherent in the product—it is a characteristic of a product’s composition or ingredients—whereas experience benefits are what a customer realizes after using the product. Sometimes experience attributes are tied to experience benefits. For example, when a customer drinks a cup of coffee, it impacts not only an experience attribute, but also an experience benefit. However, for some attributes are separate from benefits (Mittal, 2004).
Many services are experiential. The quality of service in restaurants, for example, is entirely experiential. But experience in services has a different meaning: what a customer experiences is not the sensory perception, it’s the interactive experience (Mittal, 2004; Ostrom & Iacobucci, 1995). For example, was the waiter of a restaurant polite or was a clerk in a convenient store courteous? The services need to be experienced at the episode level not the sensory level (Mittal, 2004).
Finally, credence attributes are those characteristics of a service or a product that can’t even be judged or determined after purchasing or using of the service or product (Darby &
Karni, 1973).
In this research, we are not interested in credence products. We only discussed search and experience products.
Earlier research suggests that consumers are more likely to have lower perceived risks when they buy search services or products. Conversely, they perceived higher risks when they buy experience services or products (Mitra, Reiss, & Capella, 1999) because customers can’t identify quality of experience products before purchase but they can identify quality of search products prior to purchase.
It is suggested that there is positive relationship between perceived risk and information search (Murray, 1991; Newman, 1977), which means consumers with higher perceived risks can reduce their perceived risk by elaborating additional information about products or services (Crocker, 1986; D. L. Davis, Guiltinan, & Jones, 1979; Eigler & Langeard, 1977; Hugstad, Taylor, & Bruce, 1987; Lutz & Reilly, 1973; Zeithaml, 1981). Also, Tam and Ho (2005) suggested that there is an interactive effect between NFC and the level of preference matching in the elaboration of the information, but the results are more salient for high-NFC customers than for low-NFC customers. In their research, preference matching is a concept of customized offers in this study. In other words, high-NFC customers are more likely to deal with the information when they buy customized products. However, there is no significant difference in information elaboration between customized and standard products for low-NFC customers.
The following conclusions can thus be drawn. First, for experience products, high-NFC customers perceive higher risks so they need more information to decrease their perceived risks. When high-NFC customers buy customized experience products, they will deal with information further(Tam & Ho, 2005). Therefore, their perceived risks are reduced. Thus they are more satisfied with customized experience products than standard experience products. As
for low-NFC customers, they also perceived higher risks for experience products. But they won’t elaborate more information when buying customized experience products than standard products (Tam & Ho, 2005). Hence, their perceived risks remain the same. They are not more satisfied with customized experience products than with standard products. The following hypotheses were thus formulated:
Hypothesis 3a: For experience products, high-NFC customers are more satisfied with
customized products than with standard products, but there is no significant difference in satisfaction between customized and standard products for low-NFC customers.
Hypothesis 3b: For experience products, high-NFC customers have higher purchase
intention for customized products than with standard products, but there is no significant difference in satisfaction between customized and standard products for low-NFC customers.
Second, for search products, when high-NFC customers buy search products, their perceived risks are low. They don’t need additional information, but they will still elaborate the information when customizing. Consequently, their perceived risks are not diminished significantly. Thus they are not more satisfied with customized search products than with standard search products. As for low-NFC customers, again, they won’t elaborate more information when buying customized products (Tam & Ho, 2005). Their perceived risks do not decrease. Hence, they are not more satisfied with customized search products. To summarize, neither high-NFC customers nor low-NFC customers are more satisfied with customized search than with standard search products. Thus, the following hypotheses were developed:
Hypothesis 3c: For search products, there is no significant difference in satisfaction
between customized and standard products for both high-NFC and low-NFC customers.
Hypothesis 3d: For search products, there is no significant difference in purchase
intention between customized and standard products for both high-NFC and low-NFC customers.
Chapter 3 Research Methodology
3.1 Overview
Need for cognition (NFC) refers to a customer’s intention of coping with more information. It is correlated with a person’s satisfaction with customized products because customers must deal with more information in the customization process. This study attempts to determine the effects of NFC on customization. Because different product types have different characteristics, the project focuses on whether there are any impacts of NFC on customization of each product category. Under which conditions can firms make larger profits by adopting customization strategy.
3.2 Stimulus and manipulations
3.2.1 Stimulus
The criterion of selecting products as the stimuli was that two products had to belong to search and experience products respectively. For search products, past studies have shown that computers are search products, because a customer knows the qualities they require in a computer before they purchase one (Jiang, 2004). A notebook computer was thus selected as the search product stimulus because it is a product similar to a computer which a customer can figure out the outcomes prior to use. For an experience product, we choose a travel package as the stimulus. Travel packages are one of main products that travel agencies provide and are recommended as an experience product by (Ekelund, Mixon, & Ressler). Furthermore, this product has all the characteristics of an experience product because customers can only evaluate the qualities of a travel package after they have experienced one by themselves.
To ensure that each product belongs to the category that we assigned, they were pretested using a two-item, seven-point scale, which asked the following specific questions:
1. I could determine the product quality by collecting knowledge or information before using.
2. I could determine the product quality only after using.
3.2.2 Manipulation of customization
In the experiment, a yoke design was adopted so as to manipulate customization by giving half the participants opportunities to design their own products. Participants could customize products by selecting from four different attributes, each with three choices, to meet their own preferences. The other participants could only read the information about the products; they had no chance to modify them. What they received were the products designed by the participants who can design their own products.
Manipulations of customization in search and experience products are identical. We fixed the numbers of attributes and numbers of choices of these attributes, which meant that all the participants in customized situations had four attributes with three choices for each attributes.
In each scenario participants face either customized or standard products. Again, to ensure that there was a significant difference between customized and standard products, and the selection was confirmed by a three-item, seven-point scale, asking the following questions: 1. The travel agency (computer provider) provides me different alternatives in travel
packages (computer equipments).
2. The travel agency (computer provider) provides different choices in travel packages (computer equipments) to satisfy my preference.
3. The travel agency (computer provider) provides me different choices in travel packages (computer equipments).
Therefore, a pretest was conducted to determine the product types and level of customization.
3.3 Experimental design
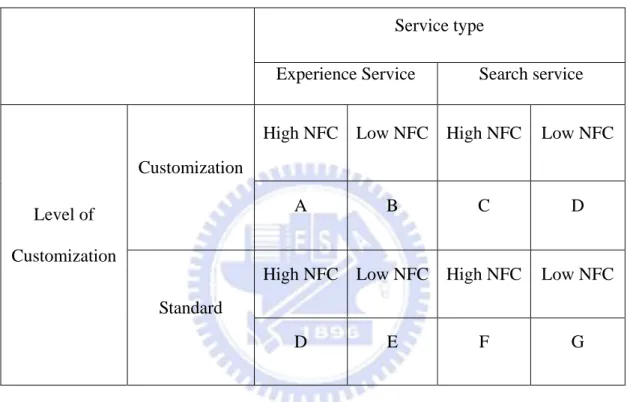
A 2 × 2 × 2 factorial experiment with 30 respondents per cell was conducted (Table1), which consisted of two levels of customization (customized and standard), two types of products (search and experience product) and two levels of NFC (high and low). The dependent variables which we are interested in were satisfaction, and purchase intention.
Table 1 Cells of Experimental Design.
Service type
Experience Service Search service
Level of Customization
Customization
High NFC Low NFC High NFC Low NFC
A B C D
Standard
High NFC Low NFC High NFC Low NFC
D E F G
3.4 Procedure
There were four scenarios in this study because NFC was not manipulated. Every participant was randomly assigned to each scenario. All the scenarios are shown in the Appendix.
Each scenario was divided into four parts. For the first part of the experiment, participants were asked to answer some questions in order to measure NFC. We used average scores of all participants to divide them into two groups. People who had scores over the average were referred to as high-NFC customers and those whose scored below the average were referred to as low-NFC customers.
The purpose of second part is manipulation check of product type and to measure perceived importance. In the third part of scenario, half of participants were assigned to scenarios which asked them either to customize the travel package or the notebook. Each of the remaining participants only read the information on about travel package or notebook designed by participants in the corresponded cell of target group, and they were paired together (customized search productÆstandard search product, customized experience productÆstandard experience product). After the experiment, all participants were asked to fill out a questionnaire which included dependent variables, manipulation check of selection, perceived risk measurement and lastly to collect demographic information.
3.5 Measurements
All items in the questionnaire which are used to measure the constructs in the study were modified from past studies. Each construct was measured by multiple items. We used seven-point scale to measure NFC, satisfaction purchase intention, perceived risk and perceived importance.
3.5.1 NFC
The 34-item scale used to measure NFC was first developed by Caccioppo and Petty (1982). In 1984, these authors shortened the scale into 18 items and which we adopted for this research (Cacioppo & Petty, 1984).
Scale Items:
1. I would prefer complex to simple problems.
2. I like to have the responsibility of handling a situation that requires a lot of thinking. 3. Thinking is not my idea of fun.
challenge my thinking abilities.
5. I try to anticipate and avoid situations where there is a likely chance I will have to think in depth about something.
6. I find satisfaction in deliberating hard and for long hours. 7. I only think as hard as 1 have to.
8. I prefer to think about small, daily projects to long-term ones. 9. I like tasks that require little thought once I've learned them.
10. The idea of relying on thought to make my way to the top appeals to me. 11. I really enjoy a task that involves coming up with new solutions to problems. 12. Learning new ways to think doesn't excite me very much.
13. I prefer my life to be filled with puzzles that I must solve. 14. The notion of thinking abstractly is appealing to me.
15. I would prefer a task that is intellectual, difficult, and important to one that is somewhat important but does not require much thought.
16. I feel relief rather than satisfaction after completing a task that required a lot of mental effort.
17. It's enough for me that something gets the job done; I don't care how or why it works. 18. I usually end up deliberating about issues even when they do not affect me personally.
3.5.2 Satisfaction
Overall satisfaction with a customization process was measured by a three-item, seven-point scale which was developed by Keaveney and Parthasarathy (2001) to gauge a person’s general perceptions with regard to some specific services. The scale was adapted to measure satisfaction with customization process and was self-administered. High scores suggested that respondents were very satisfied with customization experience whereas low
scores implied that participants were not pleased with the experience.
Scale Items:
1. On the whole, I am/was very satisfied with my experience of accepting information of travel package (notebook).
2. Overall, my negative experience outweighs/outweighed my positive experience with information of travel package (notebook).
3. In general, I am/was happy with the experience of accepting the information. 4. This travel package (notebook) meets my requirements.
5. This travel package (notebook) is not as good as I expected. 6. This travel package (notebook) is exactly what I need. 7. This travel package (notebook) is attractive to me. 8. I like this travel package (notebook) very much.
3.5.3 Purchase intention
Purchase intention was measured by a four-item, seven-point scale which was used by Dodds,Monroe and Grewal (1991).
Scale Items:
1. The likelihood of joining this travel package (buying this product) is high.
2. If I were going to travel (buy a notebook), I would consider joining this travel package (buying this notebook.)
3. The probability that I would consider joining this travel package (buying this notebook) is high.
3.5.4 Perceived risk
The items used to scale perceived risk were referred to the scales which were used in the past research (Peter & Tarpey, 1975; Stone & Gronhaug, 1993). We adapted them to this study. We finally decided to use a four-item, seven-point scale to measure respondents’ perceived risks. The items are listed below:
Scale Items:
1. I’m concerned that the travel package (notebook) is not as good as I expected. 2. I feel uncertain about the quality of this travel package (notebook).
3. I am not worried about the quality of this travel package (notebook).
4. Because I’m not sure about the quality of this travel package (notebook), perceived risks are high for me to join this travel package (buy this notebook).
3.5.5 Perceived importance
Perceived importance is a covariate in this study. A two-item, seven-point scale was used to measure perceived importance of each attribute. There are four attributes in each product type. Only one of the attribute in each product type is listed below:
Scale Items:
1. For me, dinner (CPU) is very important for travel (notebook). 2. I care about dinner (CPU) when traveling (when buying notebook).
3.6 Pretest
A pilot study was conducted to test the reliabilities of all the scales. We failed and modified the scales and ran a trial twice. The third version of pretest finally succeeded. Therefore, we decided to put those attributes in the experiment for formal test. Fifty participants participated in this pretest. The process of the formal test was the same as pretest.
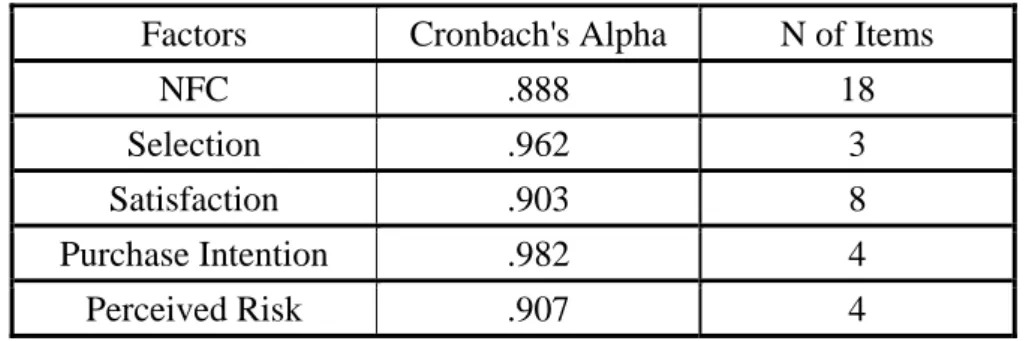
The reliabilities were tested with Cronbach’s alpha. All factors were found to be above 0.7. We summarized the data on Table 2.
Table 2 Reliability Statistics
Factors Cronbach's Alpha N of Items
NFC .888 18
Selection .962 3
Satisfaction .903 8
Purchase Intention .982 4
Chapter 4 Research Analysis and Results
4.1 Background of Participants
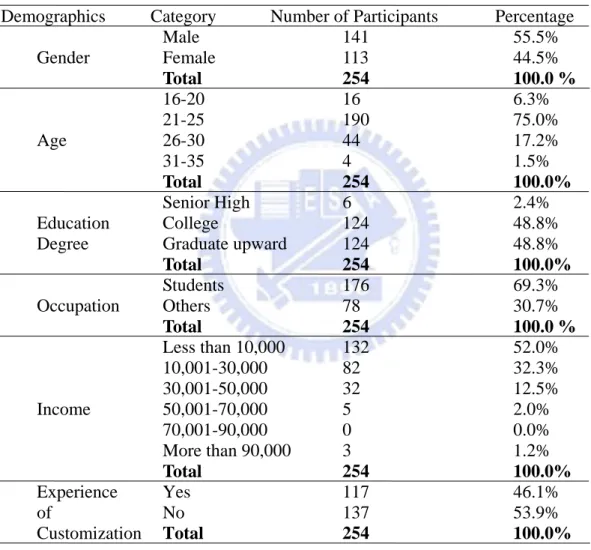
Of the total of 254 participants, 69.3% were students, 55.5% were males, 75% were between 21and 25 years old, 48.8% had college degree, 48.8% had graduate degree or higher, and 52.0% had income of below NT10,000 per month. All the demographics of respondents are listed on Table 3.
Table 3 Demographics of Participants
Demographics Category Number of Participants Percentage
Male 141 55.5% Gender Female 113 44.5% Total 254 100.0 % 16-20 16 6.3% 21-25 190 75.0% Age 26-30 44 17.2% 31-35 4 1.5% Total 254 100.0% Senior High 6 2.4% Education College 124 48.8%
Degree Graduate upward 124 48.8%
Total 254 100.0% Students 176 69.3% Occupation Others 78 30.7% Total 254 100.0 % Less than 10,000 132 52.0% 10,001-30,000 82 32.3% 30,001-50,000 32 12.5% Income 50,001-70,000 5 2.0% 70,001-90,000 0 0.0% More than 90,000 3 1.2% Total 254 100.0% Experience Yes 117 46.1% of No 137 53.9% Customization Total 254 100.0% 4.2 Reliabilities
The reliabilities of all constructs in this research were tested with Cronbach’s alpha. Table 4 shows all reliabilities as all above .7 across all factors which means the high internal consistency of each item of the same factor.
Table 4 Reliability Statistics
Factors Cronbach's Alpha N of Items
NFC .862 18 Selection .972 3 Satisfaction .840 8 Purchase Intention .964 4 Perceived Risk .778 4 4.3 Manipulation checks
4.3.1 Manipulation check of selection
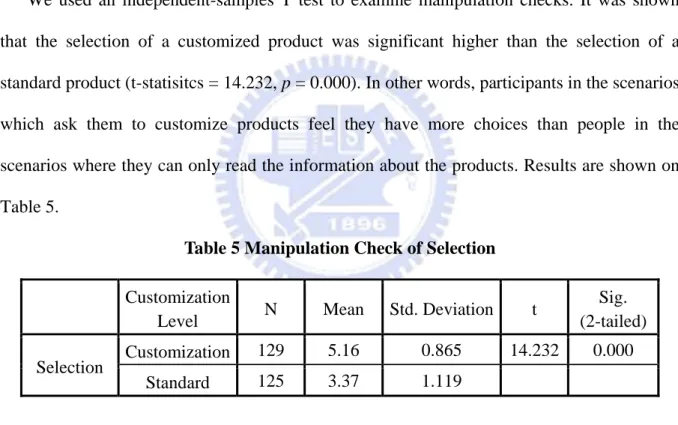
We used an independent-samples T test to examine manipulation checks. It was shown that the selection of a customized product was significant higher than the selection of a standard product (t-statisitcs = 14.232, p = 0.000). In other words, participants in the scenarios which ask them to customize products feel they have more choices than people in the scenarios where they can only read the information about the products. Results are shown on Table 5.
Table 5 Manipulation Check of Selection
Customization
Level N Mean Std. Deviation t
Sig. (2-tailed) Selection Customization
129 5.16 0.865 14.232 0.000
Standard 125 3.37 1.119
4.3.2 Manipulation check of product type
We used a two-item, seven-point scale to categorize product type. The purpose of first
item was to examine whether the quality of a product could be evaluated prior to purchase, which defines a search product. The second item determined whether the quality of a product could be determined only after purchase, which defines an experience product. Scores of the first item were significantly higher for search products than for experience products, and
scores of the second item were significantly higher for experience products than for search products. The results are listed on Table 6 and Table 7.
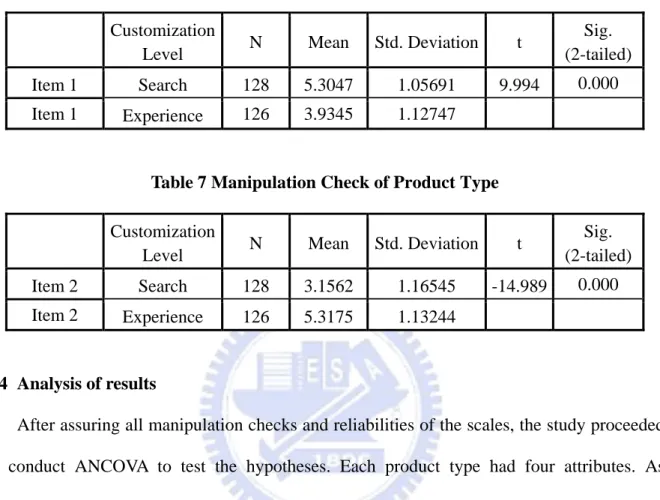
Table 6 Manipulation Check of Product Type
Customization
Level N Mean Std. Deviation t
Sig. (2-tailed)
Item 1 Search 128 5.3047 1.05691 9.994 0.000
Item 1 Experience 126 3.9345 1.12747
Table 7 Manipulation Check of Product Type
Customization
Level N Mean Std. Deviation t
Sig. (2-tailed) Item 2 Search 128 3.1562 1.16545 -14.989 0.000 Item 2 Experience 126 5.3175 1.13244
4.4 Analysis of results
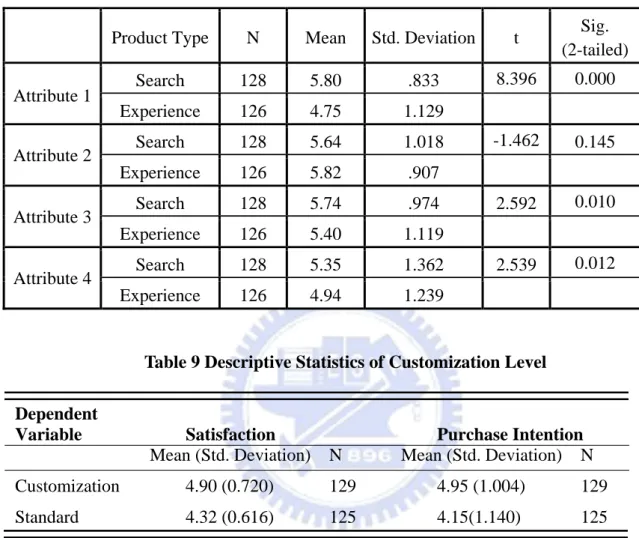
After assuring all manipulation checks and reliabilities of the scales, the study proceeded to conduct ANCOVA to test the hypotheses. Each product type had four attributes. As perceived importance was found to impact on satisfaction, an attempt was made to control the importance of each attribute across the two product types. However, not all attributes in two product types could be controlled. The descriptive statistics are shown on Table 8. Hence, ANCOVA was used to eliminate the impact of perceived importance on our results.
4.4.1 Effects of customization on customer satisfaction and purchase intention
To examine whether there were effects of customization on customers’ satisfaction and purchase intention, ANCOVA was used here. H1a and H1b speculated that customers were more satisfied with customized products than with standard products, and that customers have higher purchase intention for customized products than for standard products. Table 9 shows
results of ANCOVA. The main effect of customization on satisfaction and purchase intention were examined (F= 47.622 and 37.757, p = 0.000). Thus, H1a and H1b were supported.
Table 8 Descriptive Statistics of Perceived Importance
Product Type N Mean Std. Deviation t Sig. (2-tailed) Attribute 1 Search 128 5.80 .833 8.396 0.000 Experience 126 4.75 1.129 Attribute 2 Search 128 5.64 1.018 -1.462 0.145 Experience 126 5.82 .907 Attribute 3 Search 128 5.74 .974 2.592 0.010 Experience 126 5.40 1.119 Attribute 4 Search 128 5.35 1.362 2.539 0.012 Experience 126 4.94 1.239
Table 9 Descriptive Statistics of Customization Level
Dependent
Variable Satisfaction Purchase Intention
Mean (Std. Deviation) N Mean (Std. Deviation) N Customization 4.90 (0.720) 129 4.95 (1.004) 129
Standard 4.32 (0.616) 125 4.15(1.140) 125
4.4.2 Interaction between NFC and levels of customization
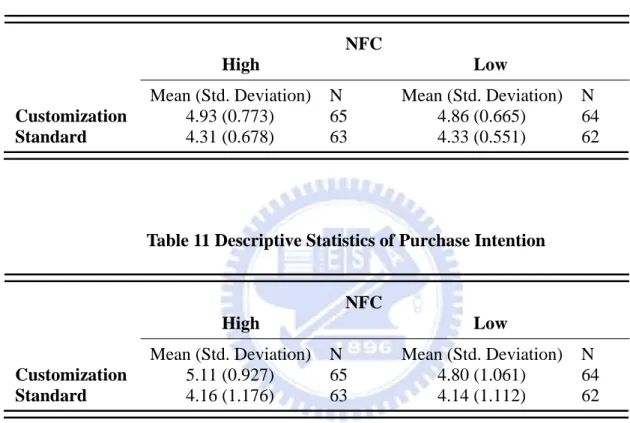
In this section an attempt is made to demonstrate whether there is an interaction effect between NFC and the level of customization on customer satisfaction and purchase intention. H2a posited that high-NFC customers were more satisfied with customized products than with standard products, but low-NFC customers were not. H2b indicated that the same resulted in purchase intention. We used ANCOVA to test H2a and H2b. Table 10 and Table 11 give the descriptive statistics of satisfaction and purchase intention respectively. Table 13 shows that there was no interaction effect on satisfaction (F = 0.232, p = 0. 631) and Table 14 shows that
there was no interaction effect on purchase intention (F = 1.157, p = 0.283). Both high-NFC and low-NFC customers were more satisfied with customized products, and they had higher purchase intention for customized products. Thus hypotheses 2a and 2b are partially supported. The results are more clearly shown on Figure 3 and Figure 4.
Table 10 Descriptive Statistics of Satisfaction
NFC
High Low
Mean (Std. Deviation) N Mean (Std. Deviation) N
Customization 4.93 (0.773) 65 4.86 (0.665) 64
Standard 4.31 (0.678) 63 4.33 (0.551) 62
Table 11 Descriptive Statistics of Purchase Intention
NFC
High Low
Mean (Std. Deviation) N Mean (Std. Deviation) N
Customization 5.11 (0.927) 65 4.80 (1.061) 64
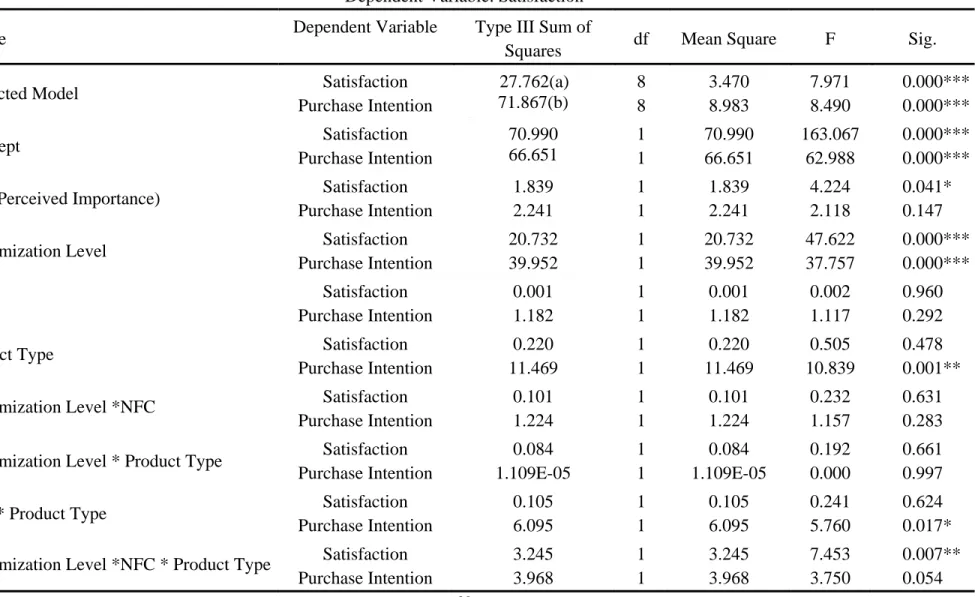
Table 12 MANCOVA
Dependent Variable: Satisfaction
Source Dependent Variable Type III Sum of
Squares df Mean Square F Sig.
Corrected Model Satisfaction
Purchase Intention 27.762(a) 71.867(b) 8 8 3.470 8.983 7.971 8.490 0.000*** 0.000*** Intercept Satisfaction Purchase Intention 70.990 66.651 1 1 70.990 66.651 163.067 62.988 0.000*** 0.000***
Cov (Perceived Importance) Satisfaction
Purchase Intention 1.839 2.241 1 1 1.839 2.241 4.224 2.118 0.041* 0.147
Customization Level Satisfaction
Purchase Intention 20.732 39.952 1 1 20.732 39.952 47.622 37.757 0.000*** 0.000*** NFC Satisfaction Purchase Intention 0.001 1.182 1 1 0.001 1.182 0.002 1.117 0.960 0.292
Product Type Satisfaction
Purchase Intention 0.220 11.469 1 1 0.220 11.469 0.505 10.839 0.478 0.001**
Customization Level *NFC Satisfaction
Purchase Intention 0.101 1.224 1 1 0.101 1.224 0.232 1.157 0.631 0.283
Customization Level * Product Type Satisfaction
Purchase Intention 0.084 1.109E-05 1 1 0.084 1.109E-05 0.192 0.000 0.661 0.997
NFC * Product Type Satisfaction
Purchase Intention 0.105 6.095 1 1 0.105 6.095 0.241 5.760 0.624 0.017* Satisfaction 3.245 1 3.245 7.453 0.007**
Error Satisfaction Purchase Intention 106.658 259.248 245 245 0.435 1.058 Total Satisfaction Purchase Intention 5541.078 5610.500 254 254
Corrected Total Satisfaction
Purchase Intention
134.421 331.114
253 253 a. R Squared = .207 (Adjusted R Squared = .181)
b. R Squared = .217 (Adjusted R Squared = .191)
Table 13 ANCOVA of Satisfaction
Dependent Variable: Satisfaction
Source Type III Sum of
Squares df Mean Square F Sig.
Corrected Model 27.762a 8 3.470 7.971 0.000***
Intercept 70.990 1 70.990 163.067 0.000***
Cov (Perceived Importance) 1.839 1 1.839 4.224 0.041*
Customization Level 20.732 1 20.732 47.622 0.000***
NFC 0.001 1 0.001 0.002 0.960
Product Type 0.220 1 0.220 0.505 0.478
Customization Level *NFC 0.101 1 0.101 0.232 0.631
Customization Level * Product Type 0.084 1 0.084 0.192 0.661
NFC * Product Type 0.105 1 0.105 0.241 0.624
Customization Level *NFC * Product Type 3.245 1 3.245 7.453 0.007**
Error 106.658 245 0.435
Total 5541.078 254
Corrected Total 134.421 253
a. R Squared = .207 (Adjusted R Squared = .181)
Table 14 ANCOVA of Purchase Intention
Dependent Variable: Purchase Intention
Source Type III Sum of
Squares df Mean Square F Sig.
Corrected Model 71.867a 8 8.983 8.490 0.000***
Intercept 66.651 1 66.651 62.988 0.000***
Cov (Perceived Importance) 2.241 1 2.241 2.118 0.147
Customization Level 39.952 1 39.952 37.757 0.000***
NFC 1.182 1 1.182 1.117 0.292
Product Type 11.469 1 11.469 10.839 0.001**
Customization Level *NFC 1.224 1 1.224 1.157 0.283
Customization Level * Product Type 1.109E-5 1 1.109E-5 0.000 0.997
NFC * Product Type 6.095 1 6.095 5.760 0.017*
Customization Level *NFC * Product Type 3.968 1 3.968 3.750 0.054
Error 259.248 245 1.058
Total 5610.500 254
Corrected Total 331.114 253
a. R Squared = .217 (Adjusted R Squared = .191)
Figure 3 Interaction Effect on Satisfaction
Figure 4 Interaction Effect on Purchase Intention Customization Standard Customization Standard
4.4.3 Interaction between NFC and customization levels across product types
H3a assumed that High-NFC customers were more satisfied with customized experience products than with standard experience products since their perceived risks were reduced (t-statistics = -3.982, p = 0.000). Table 15 shows the results of perceived risks. There was no difference in satisfaction between customized experience and standard experience products for low-NFC customers because their perceived risks didn’t decrease (t-statistics = 0.288, p = 0.774). The data are listed on Table 16.
Table 15 Perceived risk of High-NFC customers in Experience Product
Customization
Level N Mean Std. Deviation t
Sig. (2-tailed) Perceived Risk Customization 31 4.290 0.7775 -3.982 0.000 Standard 32 5.094 0.8224
Table 16 Perceived risk of Low-NFC customers in Experience Product
Customization
Level N Mean Std. Deviation t
Sig. (2-tailed) Perceived Risk Customization 32 4.93 1.006 -0.288 0.774 Standard 31 4.99 0.669
Besides, H3b assumed that high-NFC customers were not more satisfied with customized search products than with standard search products, since their perceived risk remained unchanged (t-statistics =0.195, p = 0.846). The data are shown on Table 17. Furthermore, low-NFC customers were not more satisfied with customized search than with standard search products, also because their perceived risks remained the same (t-statistics = -0.257, p = 0.798). Table 18 shows these results.
Table 17 Perceived risk of High-NFC customers in Search Product
Customization
Level N Mean Std. Deviation t
Sig. (2-tailed) Perceived Risk Customization 34 4.25 1.002 0.195 0.846 Standard 31 4.20 0.999
Table 18 Perceived risk of Low-NFC customers in Search Product
Customization
Level N Mean Std. Deviation t
Sig. (2-tailed) Perceived Risk Customization 32 4.156 1.0487 -0.257 0.798 Standard 31 4.218 0.8385
H3c and H3d assume that the same outcomes would happen to purchase intention. Table 19, Table 20, Table 21 and Table 22 are the descriptive statistics of satisfaction and purchase intention.
Table 19 Descriptive Statistics of Satisfaction (Notebook)
NFC
High Low
Mean (Std. Deviation) N Mean (Std. Deviation) N
Customization 4.83 (0.884) 34 5.03 (0.667) 32
Standard 4.50 (0.762) 31 4.30 (0.622) 31
Table 20 Descriptive Statistics of Satisfaction (Travel)
NFC
High Low
Mean (Std. Deviation) N Mean (Std. Deviation) N
Customization 5.04 (0.624) 31 4.70 (0.630) 32
Table 21 Descriptive Statistics of Purchase Intention (Notebook)
NFC
High Low
Mean (Std. Deviation) N Mean (Std. Deviation) N
Customization 5.07 (.997) 34 5.32 (0.794) 32
Standard 4.40 (1.243) 31 4.41 (1.108) 31
Table 22 Descriptive Statistics of Purchase Intention (Travel)
NFC
High Low
Mean (Std. Deviation) N Mean (Std. Deviation) N
Customization 5.15 (0.858) 31 4.27 (1.046) 32
Standard 3.93 (1.076) 32 3.87 (1.066) 31
ANCOVA was used to test these hypotheses. Table 13 shows that there was a three-way interactive effect on satisfaction (F = 7.453, p = 0.007), but Table 14 shows that there was no three-way interactive effect on purchase intention (F = 3.750, p = 0.054). This, however, requires further discussion determine the reason. It can be seen from Figure 5 and Figure 6 that high-NFC customers were significantly more satisfied with customized experience products than with standard experience products, and they also had higher purchase intention for customized experience products, too. But difference in satisfaction and purchase intention between customized and standard experience products for low-NFC customers was not significant. The interactive effect between NFC and level of customization for experience products is salient. Thus, H3a and H3c are supported.
Travel (Experience Product)
Figure 5 Interaction between NFC and customization Level
Travel (Experience Product)
Figure 6 Interaction between NFC and customization Level Customization Standard
Furthermore, according to Figure 7 and Figure 8, low-NFC customers were more satisfied with customized search products than with standard search products, and they were more likely to buy customized search products. For high-NFC customers, there was no difference in satisfaction between customized and standard search products. However, they have higher purchase intention for customized search than for standard search products. Thus, there is an interactive effect on satisfaction but not on purchase intention. H3b is partially supported and H3d are not supported.
Notebook (Search Product)
Figure 7 Interaction between NFC and Customization Level Customization Standard
Notebook (Search Product)
Figure 8 Interaction between NFC and customization Level Customization Standard
Chapter 5 Discussion and Future Research
5.1 Discussion for results
The results of this study indicated that hypotheses1a and 1b are supported which mean that customers are more satisfied with customized products than with standard products, because customized products are more likely to meet their preferences and exact needs (J. Pine, 1993a). Customers also have higher purchase intention for customized products than standard products.
Besides, H2a and H2b are partially supported. In other words, no matter whether high-NFC or low-NFC customers are more satisfied with customized products than with standard products, and both high-NFC and low-NFC customers have higher purchase intention for customized products. No interactive effect between level of customization and need for cognition was found, which is not in agreement with the findings of Tam and Ho (2005). The following discussion will show why there is no interaction between NFC and level of customization.
Furthermore, H3a and 3b are supported. High-NFC customers are more satisfied with customized experience products than with standard experience products because they can decrease their perceived risks through the process of customization. They also have higher purchase intention for customized products than for standard products. Since low-NFC customers don’t like to deal with information (Cacioppo & Petty, 1982), they are more likely to skip information during the process of customization. Their perceived risks are the same, and thus they are not more satisfied with customized experience products. Hence, there was no significant difference in satisfaction and purchase intention between customized experience products and standard experience products.
H3c was partially supported which means low-NFC customers are more satisfied with customized search products but high-NFC customers are not more satisfied with customized
search products than standard search products. Customers perceive less risk when buying search products than with buying experience products (Mitra et al., 1999). If customers can choose something that is not risky for them, it is easier to choose one which meets their own preferences more closely. Thus they may feel more satisfied which is why low-NFC customers are more satisfied with customized search products than with standard search products. However, high-NFC customers felt that the choices provided were not enough. They wanted to have more choices when customizing less risky products and in which the difference between the two types of customers lies.
H3d is rejected because both high-NFC and low-NFC customers have higher purchase intention for customized search products than for standard search products. According to H3c, high-NFC customers are not more satisfied with customized search products than with standard search products. Theoretically, they won’t have higher purchase intention for customized search products. High-NFC customers felt that the choices provided for customized search products were not enough, thus they were not more satisfied. However, they could still select one which met their requirements more closely and were, therefore, more likely to buy customized search products. This is why high-NFC customers have higher purchase intention for customized search products than for standard search products even though they are not more satisfied. On the other hand, low-NFC customers are more satisfied with customized search products, and thus also have higher purchase intention.
In Chapter 2, we speculated that low-NFC customers are not more satisfied with customized products than with standard products. However, we know that low-NFC customers were more satisfied with customized search than with standard search products, but according to H3, were not more satisfied with customized experience products than with standard experience products. For this the reason H2a and H2b are only partially supported, that is, both high-NFC and low-NFC customers were more satisfied with customized
products than standard products.
5.2 Implications
The implications of this study are that customization strategy can help companies to make more profits since customers experience greater satisfaction. However, results can be different for different kinds of people across difference product types. The study shows that there is a totally opposite interactive effect between NFC and customization level for two kinds of products. Hence, for each product category, companies should try to understand the characteristics of customers.
For search products, only low-NFC customers were more satisfied with customized products. For experience products, only high-NFC customers were more satisfied with customized products. If companies are able to identify the NFC level of customers, they can apply customization strategy more appropriately. They can provide customization strategy according to NFC level and maximum profits while limiting expenditures.
5.3 Limitations
One of limitations in this study was the type of respondents used. About 70% of participants were students, and most of them were under 25 years old, which is not a reflection of the real demographics of a society. Younger people may have different perceptions about customization from people at older ages.
Furthermore, the income of most participants was under NT 30,000 per month because most were students. Although travel packages and notebooks are both expensive products for students, notebooks are necessities for students nowadays, but travel packages are not. Therefore, participants have higher purchase intention for a notebook than for a travel package. The main effect of product type on satisfaction is significant.
Furthermore, the study attempted to make all participants more involved in the experiments. However, as the internet was used to collect samples, it is possible that some participants did not concentrate on the experiments during the process. If participants could have been interviewed individually, the situation may be improved. But it also costs more time.
5.4 Future research
Most studies nowadays focus on customization in the product industry. However, service industries are becoming more and more popular nowadays. Many companies in the product industry are converting to service industries and the boundary between these two industries is becoming obscured. It is, therefore, suggested that to research into the customization of service industry would be appropriate and valuable.
As was noted above, participants have higher purchase intention for notebooks than travel packages. To ensure that purchase intentions are the same across product types, another product should be chosen to represent search product in future research.
Finally, except for search and experience products, Darby and Karni (1973) added a new product type, namely, credence products. Future research should be extended to compare and contrast three product types.
References
Ahlstrom, P., & Westbrook, R. (1999). Implications of mass customization for operations management: An exploratory survey. International Journal of Operations and
Production Management 19 (3), 262-274.
Bardakci, A., & Whitelock, J. (2004). How "ready" are customers for mass customisation? An exploratory investigation. European Journal of Marketing.
Bearden, W. O., & Teel, J. E. (1983). Selected Determinants of Consumer Satisfaction and Complaint Reports. Journal of Marketing Research.
Berger, C., & Piller, F. (2003). CUSTOMERS AS CO-DESIGNERS. IEE
MANUFACTURING ENGINEER.
Cacioppo, J. T., & Petty, R. E. (1982). The need for cognition. Journal of Personality and
Social Psychology.
Cacioppo, J. T., & Petty, R. E. (1984). The Efficient Assessment of Need for Cognition.
Journal of Personality Assessment.
Cacioppo, J. T., Petty, R. E., Feinstein, J. A., & Jarvis, W. B. G. (1996). Dispositional Differences in Cognitive Motivation: The Life and Times of Individuals Varying in Need for Cognition Psychological Bulletin
Cohen, A. R., Stotland, E., & Wolfe, D. M. (1955). An experimental investigation of need for cognition. Advertising and information Systems Research, 51(2), 291-294.
Crocker, K. E. (1986). The influence of the amount and type of information on individuals' perception of legal services. Journal of the Academy of Marketing Science.
Darby, M. R., & Karni, E. (1973). Free competition and the optimal amount of fraud.
Journal of Law and Economics.
Davis, D. L., Guiltinan, J. P., & Jones, W. H. (1979). Service characteristics, consumer search and the classification of retail services. Journal of Retailing.
Davis, S. (1989). From future perfect: Mass customizing Planning Review, 17(2), 16-21. Dodds, W. B., Monroe, K. B., & Grewal, D. (1991). Effects of Price, Brand, and Store
Information on Buyers' Product Evaluations. Journal of Marketing Research.
Eastwood, M. (1996). Implementing mass customization. Computers in Industry, 30(3), 171-174.
Eigler, P., & Langeard, E. (1977). A new approach to services marketing. Marketing
Consumer Services: New Insights.
Ekelund, R. B., Mixon, F. G., & Ressler, R. W. (1995). Advertising and information: an empirical study of search, experience and credence goods. Journal of Economic
Studies, 22(2), 33-43.
Flynn, L. J. (1999). Built to order: how relationship management technology is driving the revolution in mass customization and electronic commerce. Knowledge Management. Hart, C. W. L. (1995). Mass customization: Conceptual underpinnings, opportunities and
limits. International Journal of Service Industry Management 6 (2), 36-45.
Homburg, C., Koschate, N., & Hoyer, W. D. (2005). Do Satisfied Customers Really Pay More? A Study of the Relationship Between Customer Satisfaction and Willingness to Pay. Journal of Marketing.
Hugstad, P., Taylor, J. W., & Bruce, G. D. (1987). The effects of social class and perceived risk on consumer information search. Journal of Services Marketing.
Jiang, P. (2004). The role of brand name in customization decisions: a search vs experience perspective. Journal of Product and Brand Management.
Keaveney, S. M., & Parthasarathy, M. (2001). Customer Swithcing Behavior In Online Services: An Exploratory Study of the Role of selected Attitudinal, Behavioral, and Demographic Factors. JAMS.