行政院國家科學委員會專題研究計畫 成果報告
會計資訊與公司治理資訊在預測惡性倒閉事件的相對有用
性
研究成果報告(精簡版)
計 畫 類 別 : 個別型 計 畫 編 號 : NSC 97-2410-H-004-034- 執 行 期 間 : 97 年 08 月 01 日至 98 年 07 月 31 日 執 行 單 位 : 國立政治大學會計學系 計 畫 主 持 人 : 張清福 處 理 方 式 : 本計畫可公開查詢中 華 民 國 99 年 05 月 11 日
附件:封面格式
行政院國家科學委員會補助專題研究計畫成果報告
※※※※※※※※※※※※※※※※※※※※※※※※※
※ ※
※
會計資訊與公司治理資訊在預測惡性倒閉事件的相對有用性
※
※ ※
※※※※※※※※※※※※※※※※※※※※※※※※※
計畫類別:■個別型計畫 □整合型計畫
計畫編號:NSC 97 - 2410 - H - 004 - 034 -
執行期間:97 年 08 月 01 日至 98 年 07 月 31 日
計畫主持人: 張清福
計畫參與人員:蔡蓓華、張荷君
本成果報告包括以下應繳交之附件:
□赴國外出差或研習心得報告一份
□赴大陸地區出差或研習心得報告一份
□出席國際學術會議心得報告及發表之論文各一份
□國際合作研究計畫國外研究報告書一份
執行單位:國立政治大學
中 華 民 國 99 年 05 月 10 日
行政院國家科學委員會專題研究計畫成果報告
國科會專題研究計畫成果報告撰寫格式說明
Preparation of NSC Project Reports
計畫編號:NSC 97 - 2410 - H - 004 - 034 -
執行期限:97 年 8 月 1 日至 98 年 7 月 31 日
主持人: 張清福 (國立政治大學)
計畫參與人員:蔡蓓華、張荷君 (國立政治大學)
中文摘要 會計資訊在財務危機預警模型的研究 中,通常被認為具有一定程度的解釋能 力,因此模型中都會將會計資訊作為財務 危機預測的解釋變數之一,甚至有的財務 危機預警模型完全只有會計資訊而無其他 資訊包含其中,最知名的例子就是 Altman (1968) 的 Z-score 模型,這個模型直到今 天仍然廣為使用。然而,有些論者(葉銀 華 2004)從個案的角度觀察,認為:在有 些財務危機案例中,公司的會計資訊並無 法提供財務危機的預警訊息,本文稱之為 財務危機預警之『會計資訊無用論』。 如果將財務危機案例細分為經營不善 型財務危機與惡性倒閉型財務危機,則會 計資訊無用論者的論點指的是『會計資訊 無法提供投資人惡性倒閉型財務危機的預 警訊息』;反之,他們認為『公司治理資 訊才能提供投資人惡性倒閉型財務危機的 預警訊息』。值得吾人注意的是:這種論 點只是經由個案觀察得到的看法,並未經 過縝密的思辨與實證研究。 本文採用離散時間涉險模型比較『會 計資訊』與『公司治理資訊』在財務危機 模型中的相對有用性。尤其是對於區分惡 性倒閉型財務危機與經營不善型經營危機 的預測上,究竟哪一種資訊較為有用,從 而找出惡性倒閉型財務危機特殊的徵兆。 關鍵詞:財務危機、倒閉、離散時間涉險 預測模型 AbstractThis study investigates if corporate governance information is superior to
financial statement information in predicting fraudulent bankruptcy. I propose to divide financial distress into two categories, fraudulent financial distress and
non-fraudulent financial distress, since they may have different suitable bankruptcy prediction models.
葉銀華 (2004) criticizes the useless of accounting information in predicting
fraudulent bankruptcy while emphasizing corporate governance information. However, I postulate that the financial scandals are usually under way for years before bankruptcy occurs and the accounting information is useful in discriminating fraud and non-fraud bankruptcy. Therefore, for fraudulent financial distress, from accounting perspective, I propose to search for potential useful accounting variables and corporate governance variables to be included in the models and make comparison of their prediction capability for fraudulent financial distress.
Keywords: Bankruptcy, Financial Distress,
Discrete-time Survival Model
1. Motivation and Purposes
Bankruptcy prediction models usually try to discriminate distressed cases from non-distressed cases and predict the
probability of default (PD) for each company in the sample. However, financial distress can be non-fraudulent or fraudulent cases. We may use accounting information or
corporate governance information to discriminate fraudulent distress from
non-fraudulent distress. Which information is superior to the other in discriminating
fraudulent from non-fraudulent cases? This is the issue the study is currently concerned with.
葉銀華(2004)argues that fraudulent distressed firms will manipulate financial statements so that investors cannot detect their fraud beforehand based on accounting information. On the contrary, corporate governance is more informative in fraudulent distress cases. The cases like 東隆五金, 久 津, and 中興銀行, among others, illustrate this point. They all have good performance relative to the industry one year before bankruptcy. For example, one year before bankruptcy, 東隆五金 has ROA, EPS, Debt Ratio, and Current Ratio of 6.59, 1.71, 48.15, 141.28, respectively, comparing to the
industry at 5.93, 1.29, 47.52, and 102.84. 久 津 has 11.85, 2.19, 48.05, and 144.05, comparing to the industry at 2.09, -0.39, 47.74, and 107.06, respectively. 中興銀行 has ROA, EPS, ROE, and Contribution per person of 0.56, 0.67, 6.1, and 1081,
comparing to the industry at 0.50, 0.61, 5.55, and 985, respectively.
The argument based on the above illustrations is noteworthy but need further investigation based on statistical tests.
2. Literature Review
From time to time, bankruptcy scandals occur in our economic society and cause the society huge costs, such as Procomp (博達) scandal in 2004 and Rebar Group ( 力霸) scandal in 2006. The former costs the society 5 billion dollars and the latter 7.31 billion dollars. The Rebar Group had not been
closely watched for 8 years during 1998-2006. Thus a powerful prediction model for
bankruptcy scandal, other than for general bankruptcy, is much needed in this
circumstance.
Up to now, we have several modern credit-risk model such Merton model, KMV model, Creditrisk model and so on. Some
models rely on market price information which may still go very high before going bankrupt. On the other hand, some models using accounting information such as Z-score model (Altman 1968).
Altman’s (1968) Z-score model is the seminal work in bankruptcy prediction in accounting literature. His model employs multiple discriminant analysis (MDA) technique to develop the so-called Z-score model which incorporates five financial ratios as explanatory variables including net working capital divided by total assets, retained earnings divided by total assets, market value of equity divided by book value of total liabilities, earnings before interest and taxes divided by total Assets, and sales divided total assets.
Since 1980s, some logit and probit models are applied to compute the
probability of default. Ohlson (1980) uses a logit model to predict the probability of bankruptcy. Zmijewski (1984) addresses methodological issues related to the estimation of financial distress prediction models. Two estimation biases including choice-based sample biases and sample selection biases are discussed in his article.
Allison (1982, 1984), Tuma and Hannan (1984) and Yamaguchi (1991) extend
multi-period logit models to discrete-time survival models in bankruptcy prediction. Shumway (2001) employs discrete-time survival model. He argues that survival models are more appropriate than
single-period models for predicting financial distress and finds that half of the accounting ratios used in literature are not statistically significant. He proposes a model using both accounting ratios and market-driven variables to perform more accurate out-of-sample forecast.
Jones and Hensher (2004) propose a mixed logit model which is regarded as superior to standard logit model in explanation and prediction of financial distress.
In Taiwan, 陳明賢(1986), 潘玉葉 (1990), and 王俊傑(2000) use logit models to predict bankruptcy while 郭志安(1997) and 陳渭淳(2001) use survival analysis to
examine the issue. 吳清在與謝宛庭 (2004)
apply a discrete-time survival model to forecast financially distressed firms that face the delisting risk in the Taiwan Stock Exchange and the TAISDAQ.
In bankruptcy literature, although the main focus of studies is on the evolution of methodologies while identifying more powerful explanatory variables, researchers all try to discriminate bankrupt firms from normal operation firms. The issue of distinguishing fraudulent financial distress from non-fraudulent distress has never been investigated. This study will focus on this issue.
3. Methodology
The discrete-time survival model for binary response will be applied in this research. Here I briefly introduce the evolution of the logit methodologies.
The logit bankruptcy prediction models in literature have evolved in sequence from single-period logistic regression model, multi-period logistic regression model, to the discrete-time survival models (Shumway 2001; 吳清在與謝宛庭 2004), and mixed logit model (Jones and Hensher 2004).
Single-period logit models have been extensively used for a long time, such as Ohlson (1980) and Zmijewski (1984), among others. Single-period logit models consider the risk factors just before bankruptcy while multi-period logit models incorporate risk factors information for several years before bankruptcy occurs.
Allison (1982, 1984), Tuma and Hannan (1984) and Yamaguchi (1991) extend
multi-period logit models to discrete-time survival models.
The development of discrete-time survival models addresses the issue whether and when events occur in bankruptcy or credit risk research, which has been frequently asked by the researchers.
Most previous research use single-period logit models to predict bankruptcy. Recently, Shumway (2001) applies discrete-time survival models to address this issue.
The discrete-time hazard function, (h(tij)), is the conditional probability that the
event i will occur in time period t, given that it didn’t occur in any earlier time period. The function can be expressed as the following:
h(tit) = Prob[Ti = t|Ti≧t]
The general form of the population discrete-time hazard model including P predictors is:
h(tit) = Prob[Ti = t|Ti≧t and X1it=x1it,
X2it=x2it, …, Xpit=xpit]
where Xit’s are predictors for individual i at time t.
To include time indicators D’s and predictors X’s while using logit link function to link the predictors to outcomes, we have the transformed time-varying hazard model:
Logit h(tit) = [α1D1it+α2D2it+…+αJDJit] +
[β1X1it+β2X2it+…+βpXpit]
To conduct the maximum likelihood estimation, we use the following likelihood function and log-likelihood function:
∏∏
= = − − = n i T t Event it Event it t it it h t t h Likelihood 1 1 ) 1 ( )) ( 1 ( ) (∑∑
= = − − + = n i t i t i it it T t t h Event t h Event LL i 1 1 )) ( 1 log( ) 1 ( ) ( log4. Research Design and Sample
This study employs discrete-time survival model to compare the usefulness of accounting information and corporate governance in predicting fraudulent bankruptcy. For comparison of models with accounting information and corporate governance information, explanatory variables are collected from classical literature including 葉銀華、李存修、柯存 恩 (2002),葉銀華(2004),葉銀華(2005), Beaver (1966), Altman (1968), Ohlson (1980), Zmijewski (1984), Louwers, Messina and Richard (1999), Jones and Hensher (2004), Beaver, McNichols, and Rhie (2005),
Yeh and Woidtke. (2005) and Ashbaugh-Skaife, Collins, and LaFond (2006).
The accounting information model for predicting fraudulent bankruptcy is based on the following variables:
WC/TA: Working Capital / Total Assets RE/TA: Retained Earnings / Total Assets EBIT/TA: Earnings before Interest and
Taxes/Total Assets S/TA: Sales/Total Assets ROA: Net Income/Total Assets
TL/TA: Total Liabilities / Total Assets CA/CL: Current Assets / Current
Liabilities SIZE: log(Total Assets)
CFO/TA: Cash Flows from Operations / Total Assets
The corporate governance information model for predicting fraudulent bankruptcy is based on the following variables:
CG1: Number of directors CG: Number of supervisors CG3: Insider ownership CG4: Director ownership CG5: Blockholder ownership CG6: Institution ownership
CG7: Foreign institution ownership CG8: Cash flow rights
CG9: Deviation
CG10: Ownership/Control
CG11: Pledged shares percentage of directors and supervisors
CG12: Compensation
CG13: Sales to related parties
CG14: Purchases from related parties CG15: Percentage of CEO director CG16: CEO as director
CG17: CEO as supervisor
There are nine potential explanatory variables for accounting information model and seventeen potential ones for corporate
governance model. Based on prediction capability, suitable variables for each model will be selected for model comparison.
The sample includes fraudulent and non-fraudulent bankrupt firms in Taiwan during 1997-2005. As shown in Table 1, there are 202 sample firms including 155 (77%) non-fraudulent bankrupt firms and 47 (23%) fraudulent firms, with event and non-event observations 47 and 880,
respectively. There are 927 observations in sum. Their distribution in the sample years is shown in Table 3.
Accounting researchers usually employ winsorization technique to trim outliers. Since in real world we are not able to trim anything before it happens in conducting prediction, the winsorization trimming technique is not applied in this study.
Table 1. Distribution of Fraudulent and Non-Fraudulent Bankrupt Firms Bankruptcy Frequency Percent Non-Fraudulent 155 77 Fraudulent 47 23 Total 202 100
Table 2. Distribution of Event and Non-Event Observations Observation Frequency Percent Non-Event 880 95 Event 47 5 Total 927 100
Table 3. Distribution of Observations during the Sample Period
Year Frequency Percent 1997 145 15.64 1998 158 17.04 1999 151 16.29 2000 131 14.13 2001 105 11.33 2002 75 8.09 2003 71 7.66 2004 57 6.15 2005 34 3.67 Total 927 100.00
5. Empirical Results
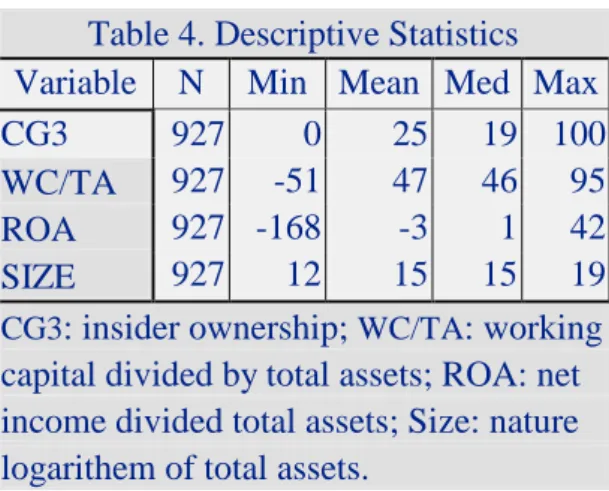
Based on predictive capability, this study selects three from nine variables listed in the section of research design and sample for accounting information model and one from seventeen variables for corporate governance information model, as shown in Table 4. The inclusion of all other variables cannot improve the predictive power.
Table 4. Descriptive Statistics
Variable N Min Mean Med Max
CG3 927 0 25 19 100
WC/TA 927 -51 47 46 95
ROA 927 -168 -3 1 42
SIZE 927 12 15 15 19
CG3: insider ownership; WC/TA: working
capital divided by total assets; ROA: net income divided total assets; Size: nature logarithem of total assets.
Although there are nine financial variables and seventeen corporate
governance variables, most of them cannot distinguish fraudulent bankrupt firms from non-fraudulent ones. Finally, three financial variables are selected for accounting
information model and one for corporate governance model. The descriptive statistics for these variables are presented in Table 4.
Table 5 presents the results of discrete-time survival models based on accounting information and corporate governance information, respectively. Among seventeen corporate governance variables, the only one significant variable is the insider ownership. It implies that a dramatic decline in insider ownership may reveal the potential fraudulent bankruptcy
since it may indicate that insiders are fleeing away from the company. However, there is no other corporate governance variables provide further information distinguishing fraudulent bankruptcy from non-fraudulent bankruptcy. The AUC for corporate
governance model is 0.68.
Table 5. Result of Discrete-Time Survival Models Accounting Information Model Corporate Governance Model Intercept -11.8798 Intercept -2.0152 (23.67)*** (53.92)*** WC/TA 0.0338 CG3 -0.0454 (9.92)*** (10.92)*** ROA -0.0618 (41.34)*** SIZE 0.444 (10.39)*** AUC 0.74 AUC 0.68
CG3: insider ownership; WC/TA: working capital divided by total assets; ROA: net income divided total assets; Size: log of total assets. *** indicates significance at the <0.01
level. AUC is the area under receiver's operation characteristics curve.
In nine accounting information variables, three variables are statistically significant, namely, working capital divided by total assets, ROA (net income divided by total assets), and size (log of total assets). These three accounting variables may distinguish fraudulent from non-fraudulent bankruptcy. The AUC for accounting information model is 0.74, which is marginally higher than that of corporate governance model.
To make clear comparison of
accounting information model and corporate governance model, the receiver’s operating characteristic (ROC) curves for two models
are plotted as shown in Figure 1, Figure 2, and Figure 3. The area under receiver’s operating characteristic curve (AUC) is also shown in Table 5. Figure 3 shows that two models are not significantly different from each other in prediction power, but it seems that the accounting information is marginally superior to corporate governance information based on AUC comparison.
Among the corporate governance variables, the insider ownership is the only one statistically significant. It may explain the fact that the insiders usually reduce their holdings while the fraud is going on. Three accounting variables, working capital divided by total assets, net income divided by total assets (ROA) and log of total assets (size), put together as explanatory variables provide significant predictive power. However, size is significant only when it works together with working capital divided by total assets and net income divided by total assets (ROA).
5. Conclusions
Comparison of model-fit performances indicates that the accounting information marginally outperforms corporate governance information in distinguishing fraudulent financial distress from non-fraudulent one, although the comparison of out-of-sample forecasts cannot be conducted due to the lack of distinctive forecast capability of these two models. 6. References 王俊傑,2000,財務危機預警模式-以現 金流量觀點 吳清在、謝宛庭,2004, ,國立台北大學企業管理 學系碩士論文。 財務困難公司下 市櫃之離散時間涉險預測模式,會計
評論,第 39 期。 郭志安,1997,以Cox 模式建立財務危機 預警模式 葉銀華、李存修、柯存恩,2002,公司治 理與平等系統,商智文化。 ,私立逢甲大學統計與精算 學系碩士論文。 葉銀華,2004,透視上市公司:聰明選股、 遠離地雷,先覺出版股份有限公司。 葉銀華,2005,蒸發的股王:領先發現地 雷危機,商智文化。 陳明賢,1986,財務危機預測之計量分析 研究 陳渭淳,2001, ,國 立台灣大學商學系碩士論文。 上市公司失敗預測之實證 研究 潘玉葉,1990, ,國立台北大學企業管理學系博 士論文。 台灣股票上市公司財務危 機預警分析
Allison, P. 1982. Discrete-time methods for the analysis of event histories.
Sociological Methodology: 61-98.
,私立淡江大學管理科學 學系所博士論文。
Allison, P. 1984. Event History Analysis. Beverly Hill: Sage Publications.
Altman, E. 1968. Financial ratios, discriminant analysis and the prediction of corporate bankruptcy. Journal of
Finance 6 (1): 4-19.
Ashbaugh-Skaife, H., D. W. Collins, and LaFond. 2006. The effects of corporate governance on firms’ credit ratings. Journal of Accounting and Economics 42: 203-243.
Beaver, W. 1966. Financial ratios as predictors of failure. Journal of Accounting Research 4: 71–111.
Beaver, W. H., N. F. McNichols, and J. W. Rhie. 2005. Have Financial Statements Become Less Informative? Evidence from the Ability of Financial Ratios to Predict Bankruptcy. Review of Accounting Studies 10: 93–122.
Jones, S. and D. A. Hensher. 2004. Predicting firm financial distress: A
mixed logit model. Accounting Review 79 (4): 1011-1138.
Louwers, J., M. Messina, and D. Richard. 1999. The auditor’s going-concern disclosure as a self-fulfilling prophecy: A discrete-time survival analysis.
Decision Sciences 30 (3): 805-824.
Ohlson, J. 1980. Financial ratios and the probabilistic prediction of bankruptcy.
Journal of Accounting Research 18 (1):
109-131.
Shumway, T. 2001. Predicting bankruptcy more accurately: A simple hazard model. Journal of Business 74 (1): 101-124.
Tuma, N. B. and M. T. Hannan. 1984. Social
Dynamics: Models and Methods. New
York, NY: Academic.
Yamaguchi, K. 1991. Event History Analysis. Newbury Park, CA: Sage Publications. Yeh, UY. H. and T. Woidtke. 2005.
Commitment or entrenchment?: Controlling shareholders and board composition. Journal of Banking and
Finance 29: 1857–1885.
Zmijewski, M. 1984. Methodological issues related to the estimation of financial distress prediction models. Journal of
Accounting Research 22 (Supplement):