Abstract—Data mining tools and machine learning techniques have been used in customer relationship management (CRM) for a very long time. Several papers investigated data analysis for customer retention in financial, retail, and telecommunications industries. However, there is a lack of researches on machine learning for CRM in service industry. This paper strives to understand the whole process of applying machine learning based data mining application in service industry and to examine how these novel techniques can help a business improve their customer relationship. This case use action research to document and analyze the application of machine learning based data mining in a business case in service industry. Key areas will cover decision making process from operational, managerial and strategic dimensions. The research used the data collected from a large car dealer’s IT department and its vehicle maintenance plants, containing about 2.73 million rows of data. The machine learning model used to generate the recommended customer lists was the boosted decision tree model provided by Microsoft Azure. By taking advantage of these lists, the company can increase the success rate of promoting action and decrease the time and frequency that technicians have to spend on promotion, which leads to more effective and efficient frontline operation and both higher technicians’ and customers’ satisfaction. The result of our research reveals that the recommended customer lists really helped the company better distinguish customers and achieve better CRM effectiveness through customer segmentation and customer development.
Index Terms—Customer relationship management, Data mining, Machine learning, Service industry
I. INTRODUCTION A. Introduction of machine learning
Over the past years, customer relationship management (CRM) relies on data mining very much. Businesses have devoted themselves to find customer’s behaviors and patterns hidden in business data. Traditionally, business analysts generally use conventional analytic tools, such as excel spread sheet, OLAP tools, standard logit/probit models, linear discriminant analysis (LDA), and other statistical techniques, to analyze data. However, as the widespread use of computers and Internet, more customer’s data has been created and stored in databases. The traditional manual data analysis has become insufficient. Therefore, how to facilitate decision making process has become a keen area for business users, which brings the rise of machine learning based analytic methods. Unlike conventional data analytic tools, machine
Manuscript received October 20, 2017.
F. A. Author is with the Department of Management Information Systems, National Chengchi University, Taipei, Taiwan, ROC (e-mail: [email protected]).
learning based data mining techniques can help business users make future predictions and can provide automated, prospective knowledge in real time with little human intervention. Machine learning based data mining techniques not only can extract information from historical data but also find non-intuitive hidden relationships between variables that experts may miss because it lies outside their expectations [10].
B. Motivation and research objective
There are a lot of research cases about machine learning application on different industries such as financial and telecommunications industry. These industries have characteristics of high transaction frequency, or intensive interaction point with customers. However, there is still a lack of understanding about machine learning on other industries with characteristics such as low transaction frequency or extensive interactions with customers, for example: service industry, tourism industry, software industry…etc. We also do not have clear picture of downsides of machine learning on business application. For these reasons, this study wants to provide an examination of machine learning based data mining application on service industry and try to figure out how these techniques can help a business improve their CRM effectiveness. In this paper, we analyzed the customer data of maintenance service in a car dealer in Taiwan, and provide in depth study on the case about Machine Learning on CRM.
II. LITERATUREREVIEW A. Machine learning and data analytics
Machine learning based data mining techniques are the union of classical statistics, artificial intelligence (AI), and machine learning [10][13]. A maturing of the AI field has created a set of techniques of “machine learning'' that are useful in automating tedious but crucial activities of discovering patterns in databases. Traditionally, business analysts generally use statistical techniques and OLAP analysis to find patterns in business data. However, there are some disadvantages. For statistical techniques, the data set must conform to rigid distribution criteria to employ statistical modeling methods. For OLAP analysis, it requires the user has the subjective definition of the query objectives. Perspective knowledge is often hidden and unexpected, and hypothesis driven methods, such as most statistical methods and OLAP, will generally fail to uncover such knowledge [21]. Conversely, machine learning based data mining techniques, which is based on observations from data, impose fewer restrictions and produce patterns that are easy to understand.
A Case Study on Machine Learning for Customer
Relationship Management in Service Industry
B. Machine learning techniques
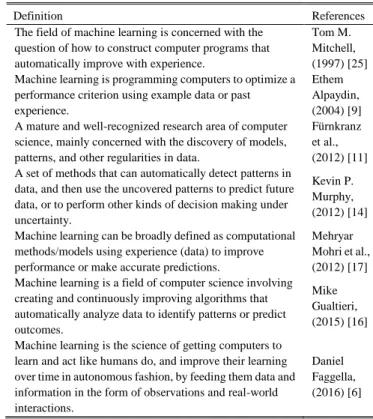
Many sources tried to define machine learning. We summarized some definitions of machine learning in the following table.
TABLEI:MACHINE LEARNING DEFINITION
Definition References
The field of machine learning is concerned with the question of how to construct computer programs that automatically improve with experience.
Tom M. Mitchell, (1997) [25] Machine learning is programming computers to optimize a
performance criterion using example data or past experience.
Ethem Alpaydin, (2004) [9] A mature and well-recognized research area of computer
science, mainly concerned with the discovery of models, patterns, and other regularities in data.
Fürnkranz et al., (2012) [11] A set of methods that can automatically detect patterns in
data, and then use the uncovered patterns to predict future data, or to perform other kinds of decision making under uncertainty.
Kevin P. Murphy, (2012) [14] Machine learning can be broadly defined as computational
methods/models using experience (data) to improve performance or make accurate predictions.
Mehryar Mohri et al., (2012) [17] Machine learning is a field of computer science involving
creating and continuously improving algorithms that automatically analyze data to identify patterns or predict outcomes.
Mike Gualtieri, (2015) [16] Machine learning is the science of getting computers to
learn and act like humans do, and improve their learning over time in autonomous fashion, by feeding them data and information in the form of observations and real-world interactions.
Daniel Faggella, (2016) [6]
By combining these definition, in this research, we define machine learning with the features of “automatically detect patterns in data”, “automatically improved with experience”, and “be used to predict uncovered patterns or future outcomes”.
Empirical evidence from different fields of application suggests that machine learning based data mining tools can clearly outperform conventional tools such as logit, probit and LDA [3][20][22].
First reason is effort reduction in feature selection. Machine learning based data mining techniques can handle many features simultaneously, whereas conventional tools such as classical statistical analysis are usually one-dimensional therefore cannot handle huge feature spaces. Classification problems is the most notable situation. As suggested by Liu & Yu (2005), “CRM domain is characterized by many input variables, often hundreds, with each one containing only a small amount of information and human expert feature selection is known to be suboptimal” [12]. Unfortunately, conventional statistical tools lack of efficient feature-selection algorithm, composing a serious problem to CRM.
Second reason is the ability to handle noisy data (outlier, missing value). As said by Anita et al. (2008), “noise robustness is of the utmost importance to CRM applications typically tormented by noisy data” [1]. Conventional tools like logistic regression have no natural means to deal with missing values and are largely effected by outliers [15], therefore they are very sensitive to noisy data and the shape or structure of input variables. Machine learning based data
mining techniques are robust to noisy data, especially classification trees (decision tree and random forest) are considered resistant to noise and overfitting because of their pruning and ensemble of classifiers (bagging, boosting) strategies. Therefore they may require minimal data intervention by the researcher and provide better predictive performance [1][19][20][22][23].
Third reason is the flexibility to model nonlinear relationships among variables. Most of machine learning based data mining techniques, such as neural network, SVM, generalized boosting and random forest, are high-dimensional nonlinear models which can offer significant improvement over traditional statistical methods. Simple linear classifiers such as standard form logit, probit and LDA have limited capacity to model nonlinearity and unobserved heterogeneity in the dataset [22]. Since the traditional statistical models use the assumptions about f; y = f(x), in order to deal with nonlinear relationships, it has to replace the linear model with a high degree polynomial function and the form of nonlinearity must be known at the first phase [18][23]. Classification trees are confirmed to be very useful non-parametric classifiers given non-linearly associated variables. As suggested by Stewart et al. (2015), the newer classifiers such as generalized boosting, AdaBoost and random forests can strongly outperform all other classifiers and prove remarkably robust to different data structures and assumptions [22].
Despite those advantages of machine learning techniques, there are studies reveal the downsides of machine learning techniques. One argument about machine learning is the lake of interpretability. Despite decision trees are relatively easy to explain, other machine learning techniques like SVMs and neural networks are impossible to decipher the role and behavioral influence of input variables [23]. Thus, the classification logic is not understandable to the end-user [13]. That’s why people call them “black box” models. Although these novel techniques can provide better predictive performances, in many cases the comprehensibility and justifiability of a model are more important to the users than the predictive accuracy [7].
C. Data analysis for CRM
Nowadays, the ability to gain useful customer insight from business data has become more important to managers. Data mining helps business achieve better CRM performance and therefore differentiate itself from its competitors. As machine learning based data mining techniques become mature and affordable, businesses are willing to adapt these tools in order to seek an improved way to find the hidden customer information and thus achieve effective CRM. Swift (2001) defined CRM as an ‘‘enterprise approach to understanding and influencing customer behavior through meaningful communications in order to improve customer acquisition, customer retention, customer loyalty, and customer profitability” [24]. According to some studies, CRM can be defined into four dimensions: customer identification, customer attraction, customer retention, and customer development [2][8][24]. On the basis of these dimensions, briefly speaking, data analysis can help CRM with the following aspects:
1) Customer identification: Target the right customer segments or detect the customers who are likely to churn.
2) Customer attraction: Establish right communication channel and process with customers.
3) Customer retention: Maintain customer satisfaction and keep long-term relationship with customers. 4) Customer development: Increase customer
profitability and customer lifetime value. III. RESEARCHMETHODOLOGY A. Why use case study
There are some reasons that we use case study method. First, the effect of machine learning application on business is still a phenomenon and lack of enough evidence to verify. Second, we want to explore more detail about the whole process of application. Third, through this case, future research and business manager can get a whole picture of how to merge machine learning techniques into business operation process.
B. Action Research method
This case uses action research to document and analyze the application of machine learning based data mining in a real-world business. Action research can be defined as “an approach in which the action researcher and a client collaborate in the diagnosis of the problem and in the development of a solution based on the diagnosis” [4]. Coughlan and Coghlan (2002) proposed a framework of action research cycle which comprises a pre-step and some main steps. Pre-step is to understand context and purpose, emphasizing the rationale for both action and research. Six main steps are as the following [5]:
1) Data gathering: data collection through interviews of the client, internal reports, and observation.
2) Data feedback: researcher reports the data collected to the managers and makes it available for analysis. 3) Data analysis: collaboratively performed by both
researcher and managers. This step is crucial since the involvement of management leads to effective implementation of actions.
4) Action planning: activities are scheduled, and roles are assigned to organizational members.
5) Implementation: the organization implements the planned action with researcher’s support.
6) Evaluation: reflecting on the outcomes of the action implemented in order that the next cycle may benefit from the cycle completed. This is the key to continuous learning.
Monitoring is a meta-step in the way that it takes place throughout the cycles. Each action research cycle leads to another cycle, thus continuous planning, implementation and evaluation occur over time [5].
The feature of this case is that it presents the whole process of the project which includes the cycles of execution, measurement, evaluation, and modification. The next chapter will report the action research process of this case in detail.
IV. CASEINTRODUCTION A. Background of T-company
T-Company is a top car dealer in Taiwan which not only sells cars but also provides maintenance service to customers. The market share of T-Company in 2016 is over 30%, and their operating revenue in 2016 is over 110 billion (TWD). Until 2016, T-Company has 122 vehicle maintenance plants and about 2.6 million of customers in Taiwan. T-Company provides comprehensive and high-quality services to customers; therefore, CRM is very critical to T-Company. T-Company provides warranty period to every car they sold. Usually the warranty period is within 4 years, or the odometer is under 120,000 kilometers. The maintenance service actually contributes considerable profit to T-Company, only when the customers go to the vehicle maintenance plants of T-Company that can T-Company find out their follow-up needs (ex. periodically automobile parts replacement and routine maintenance fee) and then maximize Customer Lifetime Value (CLV) of T-Company.
In order to maintain customers and prevent customers from churning, T-Company provides products for customers either within or exceed the warranty period. Traditionally, when the car owner goes to the T-Company vehicle maintenance plant for maintenance, technicians were required to promote the suitable service product to every customer coming for maintenance service, depending on whether the car exceed or is in the warranty period. For those within the warranty period, product A, which extend the warranty period to 5th year or 140,000 kilometers, will be promoted. For those exceed the warranty period, product B, which provides three different types of cash cards and then customers can buy the cards and receive car maintenance services at a discount rate, will be promoted.
T-Company had also set sales targets and sales performance related KPIs (key performance indicators) to the vehicle maintenance plants of T-Company. As a result, every technicians in the vehicle maintenance plants not only have to promote the service program but also do the maintenance job, which was very time-consuming for technicians. Moreover, this may confuse the role and the mindset of T-Company’s technicians. The technicians are supposed to provide services on automobiles, however, in this case, the technicians are also required to sell the promoted products. For the customers coming for maintenance service, car safety is the main concern to them. If the technicians promote too hard, it may leave bad impressions to the customers and decrease the customers’ satisfaction. Therefore, the managers of T-Company wanted to find out who are more likely to purchase the promoted services. This can increase the success rate of promotion and decrease the time and frequency that technicians have to spend on promoting. Thus, the front line of vehicle maintenance plants of T-Company can be more effective and efficient, and the customers’ perception toward T-Company’s maintenance service will be more positive.
B. Data gathering
The dataset is mainly from the vehicle maintenance plants of T-Company. It is about the customer, their car information, and whether they bought the service program after promoted
by technicians. The market analyst of the IT department of T-company collected the historical data between January 2009 to September 2016, containing about 2.73 million rows of data, and cleaned the data.
The data cleaning process including abnormal value deletion (ex. the odometer is over 500,000 kilometers or unusual customer date of birth), data format transformation (ex. transform date of birth to age and uniform the name of car series and the name of vehicle maintenance plants), and filter the qualification of the car (ex. the car brand should be T-Company; or if the product A was already given to the customer for free then it’s not qualified; and for the product B, the number of months since the last regular maintenance should less than 24 months). After completed the data cleaning phase, the dataset was segmented into two parts as for product A and B, according to car's year of manufacture is within 4 years or exceeded. Both the two data segments were divided into 70% of training data and 30% of testing data in order to feed the machine learning model and build the decision tree models. The historical dataset included customers’ and their cars’ information. Part of the customers had come to T-company’s vehicle maintenance plants before, and they can be divided into two groups: those who bought the product and those who had not buy the product. However, the historical data cannot reveal whether they had been promoted when they came for maintenance services.
Besides data collection, the research also interviewed after sales team, IT technicians from after sales team, infrastructure team, and dealers of T-company.
C. Data feedback
After collected the data, the research then discussed and collected suggestions from IT middle level managers, after sales associated managers and managers of vehicle maintenance plants.
D. Data analysis
The objective of the data analysis is to reveal those customers who have higher purchasing power. This case used boosted decision tree to classify customers and to generate the high potential customer lists for the vehicle maintenance plants of T-Company. The boosted decision tree models were created on the Microsoft online cloud service called “Microsoft Azure”.
After inputting the historical data to the machine learning model, the first model was built and the first recommended customer list was produced. The list included three types of customers: (1) those who had come to T-company’s vehicle maintenance plants and also had bought the product already, (2) those who had come to T-company’s vehicle maintenance plants but had not buy the product, and (3) those who had neither come to T-company’s vehicle maintenance plants nor bought the product before. Those potential customers who are likely to buy the product are included in the third type of customers. By filtering out those high buying potential customers, T-company’s technicians can promote suitable product for them. And to those low buying potential customers, technicians can focus on providing them maintenance services.
E. Action planning
In order to test the performance of this project, T-Company applied experiment toward its vehicle maintenance plants. T-Company chose 27 vehicle maintenance plants, including 13 vehicle maintenance plants as the treatment group, and 14 vehicle maintenance plants as the control group. The criteria of selecting these vehicle maintenance plants are their service capacity, average daily customer flow, square footage of the plant space, numbers of their maintenance machines, numbers of their technicians…etc. The conditions of the selected treatment group should be similar to the corresponding control group in order to eliminate interferences of variables.
F. Implementation
Thus, the first recommended customer list was offered to the 13 vehicle maintenance plants as the treatment group, the technicians in these vehicle maintenance plants would base on the list to filter customers who came. Only those on the recommended customer list would be promoted. In the contrast of the treatment group, other 14 vehicle maintenance plants as the control group would remain the same way as before, which means technicians would promote to every customers who came for maintenance services. During the experiment, whether the customers bought the product or not would be recorded by technicians.
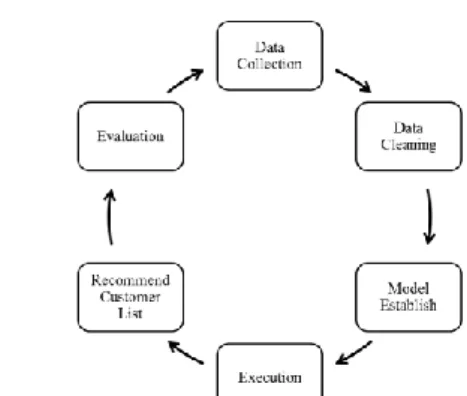
After the first experiment period ended, the records would be reported to the analysts of the IT department, and these new data would be inputted to the decision tree models in order to reinforce the models and improve the model performance. After some parameter tuning and calibration, the new decision tree models would produce the second recommended customer list, and the list would be applied to the treatment group again. The above process would be executed again and again as the following cycle:
1) Produce recommended customer list 2) Apply to the treatment group 3) Feed new collected data to the model 4) Evaluate model performances 5) Model parameter tuning
Fig. 1. Data analysis process for CRM in T-company.
Through the cycle, those customers who came to the vehicle maintenance plants during the experiment periods but did not buy the product after promoted would be removed from the list and help the decision tree models improve itself. As the result, the models and the lists could be more accurate and precise. The team started to collect historical data since December 2015, and produced the first recommended
customer list in April 2016. The last experiment period was ended on September 2016. The experiment periods were approximately month by month, and this project included about five cycles of experiments.
Fig. 2. Timeline of the project.
G. Evaluation
The team evaluated the performances of this project by the precision and recall fractions of the recommended customer lists, and the saving proportion of the number of promotion times in order to achieve the same sales targets. As mentioned previously, T-Company had set sales targets and sales performance related KPIs (key performance indicators) to the vehicle maintenance plants of T-Company. Under the premise of achieving the same sales targets, how many promotion times could be saved by applying the recommended customer lists is what the team measured. The formula is the number of promotion time needed without the lists minus the number of promotion time needed with the lists, and divided by the number of promotion time needed without the lists.
The formula of precision is the number of customers who bought the product after promoted in the list divided by the total number of customers in the list. The formula of recall is the number of customers who bought the product after promoted in the list divided by the total number of customers who bought the product after promoted.
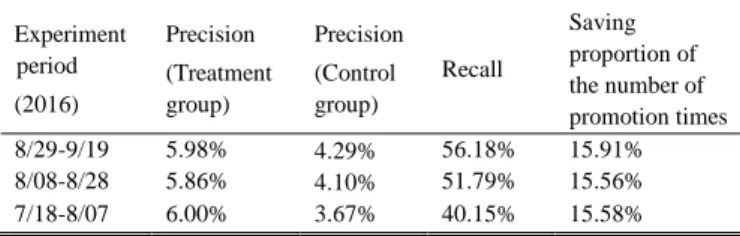
After applying five cycles of experiment processes, we list the latest three experiment results as the following tables.
TABLEII:EXPERIMENT RESULTS OF THE PRODUCT A Experiment period (2016) Precision (Treatment group) Precision (Control group) Recall Saving proportion of the number of promotion times 8/29-9/19 5.98% 4.29% 56.18% 15.91% 8/08-8/28 5.86% 4.10% 51.79% 15.56% 7/18-8/07 6.00% 3.67% 40.15% 15.58%
TABLEIII:EXPERIMENT RESULTS OF THE PRODUCT B Experiment period (2016) Precision (Treatment group) Precision (Control group) Recall Saving proportion of the number of promotion times 8/25-9/19 6.72% 5.51% 37.31% 6.73% 8/08-8/24 7.75% 5.64% 47.00% 12.77% 7/18-8/07 5.83% 6.44% 17.13% -1.78%
Overall, both experiment results shows that the treatment group performed better than the control group, which means the recommended customer lists did help the technicians in the vehicle maintenance plants by saving their time spent on promotion. As we executed the cycle repeatedly, the decision tree model could improve by itself, therefore newer
recommended customer lists performed better.
It's worth noting that the experiment results of product B are unstable. The reason is that in August 2016, the team found that one of the inputted variables could explain the vast majority of the buying behavior of product B. The decisive variable is the amount of customer’s reward points, which can be used to make a payment. Customers can receive reward points either when they go to the vehicle maintenance plants for maintenance services or from some marketing events. The more reward points a customer has, the more likely that he or she will buy the product. As a result, almost all the customers on the recommended customer lists were accordant with both having great number of reward points and had already bought product B. This result means that the technicians couldn’t use the lists to find new potential customers who hadn’t bought the product B. Therefore, as soon as the team found this phenomenon, we immediately removed the variable form the input data. After doing that, the treatment group’s experiment results of product B finally surpassed control group’s results, and the recall fractions of treatment group also improved.
V. MANAGERIALIMPLICATIONS
The result of our research reveals that the recommended customer lists really helped T-company better distinguish customers and achieve better CRM effectiveness through customer segmentation and customer development. During this project, the research have concluded some key factors for successful application.
First, the most important phase of the whole project is the beginning stage, which includes problem definition, data collection and model design. How to collect the data source correctly depends on how appropriate the business problem is defined. And how to choose and develop the model depends on what kind of results are expected to gain from that.
Second, the way how to verify the model’s results is also important. This case designed an approach to confirm whether the lists were correct or not. By applying the lists in the vehicle maintenance plants and retrieving the updated lists from the techniques, the team could obtain corrected data as executing the cycle repeatedly. Therefore the team can confirmed the lists and further improved the model.
Third, the KPIs setting can largely affect the employees on whether they will apply the model results to their daily operational jobs. A well-designed strategic plan relies on establishing targets that can translate strategy into manageable operational actions for employees. In this case, technicians take several roles at the same time. They are not only maintenance staff, but also salesperson. Therefore, how to set the proper KPIs is the key of project success.
Fourth, corporate should spend more resources on collecting critical data attributes. In this case, the records of whether the customers bought the product after promoted or not are essential input data for the machine learning model to reinforce its performance. By continuously feeding new data to the model, it can revise its algorithm and improve by itself. Therefore, corporate should base on their strategic plan and blend the data collection process into their daily operation.
Furthermore, from this case, we can see the comparison of machine learning techniques with conventional data mining
tools. First, machine learning techniques can reduce human’s effort on feature selection. The decision tree model used in this case could handle over 135 features simultaneously, whereas conventional data mining tools lack of efficient feature-selection algorithm. Second, machine learning techniques are more robust to outliers and missing values. Unlike standard statistical software, decision tree model doesn’t need to real handle missing values. It can impute the missing values with new values, or simply ignore the missing values in the evaluation of every splits in the tree. Third, as mentioned in chapter 2, classification trees can perform well given nonlinear relationships among variables, which is the limitation of some traditional statistical models.
VI. CONCLUSIONANDRECOMMENDATIONS Nowadays, the service industries has become more attractive and important. However, little research focus on this area, revealing a need for further understanding. Data mining techniques have been used to find the uncover knowledge and hidden information from abundant data in order to help the CRM process more effectively. In this case, we used machine learning based data mining techniques to improve the CRM process of a car dealer company which provides maintenance services to their customers. We used decision tree model to generate the recommended customer lists in order to help the front line technicians better distinguish customers and improve their operating efficiency and effectiveness. The results of this case support the advantages of applying machine learning techniques in service industries.
The main contributions of this study consists of both academic domain and practical domain. Academically, this case demonstrate the whole process of an action research case. Practically, other companies may refer to this study and learn from the experience of applying machine learning techniques on CRM. The limitation of this research is the generalization problem due to the data limitation since it is only one company. Future research should therefore further explore more other cases to improve the generalization ability.
REFERENCES
[1] Anita P., Dirk V. P. (2008). Random forests for multiclass classification Random MultiNomial Logit. Expert Systems with Applications 34, 1721–1732.
[2] Atul Parvatiyar1 & Jagdish N. Sheth (2001). Customer relationship management Emerging practice, process, and discipline. Journal of Economic and Social Research. 3(2), 1-34.
[3] Bart L., Dirk V. P. (2005). Predicting customer retention and profitability by using random forests and regression forests techniques. Expert Systems with Applications. 29, 472–484.
[4] Bryman, A. & Bell, E. (2011). “Business Research Methods” 3rd edition, Oxford University Press, P.414.
[5] Coughlan, P., Coghlan, D. (2002). Action research for operations management. International Journal of Operations & Production Management. 22(2), 220–240.
[6] Daniel Faggella. (2016). What is Machine Learning?. https://www.techemergence.com/what-is-machine-learning/. Accessed on 30 Sep 2017.
[7] David M., Jan V., Wouter V., Bart B. (2011). Performance of classification models from a user perspective. Decision Support Systems. 51, 782–793.
[8] E.W.T. Ngai, Li Xiu b & D.C.K. Chau. (2009). Application of data mining techniques in customer relationship management A literature review and classification. Expert Systems with Applications. 36, 2592–2602.
[9] Ethem Alpaydin. (2004). Introduction to Machine Learning. MIT press.
[10] Faiz Malik, (2013). Application of Data Mining In Changing Times and Its Role in Future. Indian Journal of Commerce & Management Studies. 4(1), 73-77.
[11] Fürnkranz, Johannes, Gamberger, Dragan, Lavrač, Nada (2012). Foundations of Rule Learning. Springer.
[12] Huan Liu and Lei Yu (2005). Toward Integrating feature selection algorithms for classification and clustering. IEEE Transactions on Knowledge and Data Engineering. 17(4), 491-502.
[13] Indranil B. & Radha K. M. (2001). Business data mining - a machine learning perspective. Information & Management. 39, 211-225. [14] Kevin P. Murphy. (2012). Machine learning: a probabilistic
perspective. MIT Press.
[15] Kristof C., Stefan L., Geert V. (2017). A comparative analysis of data preparation algorithms for customer churn prediction: A case study in the telecommunication industry. Decision Support Systems 95, 27–36. [16] Mike Gualtieri and Rowan Curran. (2015). A Machine Learning
Primer For BT Professionals. Forrester Research.
[17] Mohri, M., Rostamizadeh, A. & Talwalkar, A. (2012). Foundations of machine learning. MIT press.
[18] Patricia M. W., Patrick L. B., Linda L. G. (1997). A comparative analysis of neural networks and statistical methods for predicting consumer choice. Marketing Science. 14(4), 370-391.
[19] S. B. Kotsiantis (2007). Supervised Machine Learning: A Review of Classification Techniques. informatica. 31, 249-268.
[20] Siddhartha B., Sanjeev J.,1, Kurian T., J. Christopher W. (2011). Data mining for credit card fraud A comparative study. Decision Support Systems. 50, 602–613.
[21] Sigurdur O., Xiaonan L., Shuning W. (2008). Operations research and data mining. European Journal of Operational Research. 187, 1429–1448.
[22] Stewart J., David J., Roy W. (2015). An empirical evaluation of the performance of binary classifiers in the prediction of credit ratings changes. Journal of Banking & Finance. 56, 72–85.
[23] Stewart J., David J., Roy W. (2017). Predicting Corporate Bankruptcy An Evaluation of Alternative Statistical Frameworks. Journal of Business Finance & Accounting. 44(1) & (2), 3–34.
[24] Swift, R. S. (2001). Accelarating customer relationships: Using CRM and relationship technologies. Upper saddle river. N.J.: Prentice Hall PTR.
[25] Tom M. Mitchell. (1997). Machine Learning. McGraw-Hill. Shari Shang is a professor of Management Information Systems at the National Chengchi University in Taiwan. Her professional expertise includes business innovation, business process management, enterprise systems (CRM and ERP), and strategic technology management. She received her Ph.D. in Information Systems from the University of Melbourne in Australia.
Her research has been published in Information Systems Journal, Information & Management, International Journal of Technology Management, Behaviour & Information Technology, Service Industries Journal, R&D Management and Total Quality Management & Business Excellence, among other journals. Before undertaking her doctoral study, Dr. Shang worked as a Consulting Manager, MIS Manager, Business Analyst, and EDP specialist in global companies such as IBM, KPMG, and AICPA, in both Taiwan and the United States.
Yuanchun Ho is currently a master student in the Department of Management Information Systems in the National Chenchi University since 2016. She received the B.E. degree in business administration from the National Chenchi University.
Ms. Ho is a member of the International Business Honor Society called Beta Gamma Sigma, which is the exclusive business honor society, associated with AACSB International.
Author’s formal photo Author’s formal