行政院國家科學委員會專題研究計畫 成果報告
探討換新就緒度和汰舊就緒度對消費者採用先進旅行者資
訊系統相關新產品之影響-以 GPS 導航手機為例
研究成果報告(精簡版)
計 畫 類 別 : 個別型 計 畫 編 號 : NSC 99-2410-H-009-038- 執 行 期 間 : 99 年 08 月 01 日至 100 年 07 月 31 日 執 行 單 位 : 國立交通大學運輸科技與管理學系(所) 計 畫 主 持 人 : 任維廉 計畫參與人員: 博士班研究生-兼任助理人員:呂明穎 報 告 附 件 : 出席國際會議研究心得報告及發表論文 處 理 方 式 : 本計畫可公開查詢中 華 民 國 100 年 08 月 05 日
行政院國家科學委員會補助專題研究計畫
■成果報告
□期中進度報告
探討換新就緒度和汰舊就緒度對消費者採用先進旅行者資訊系統相
關新產品之影響-以 GPS 導航手機為例
計畫類別:■個別型計畫 □整合型計畫
計畫編號:NSC 99-2410-H-009-038
-
執行期間: 2010 年 8 月 1 日至 2011 年 7 月 31 日
執行機構及系所:
國立交通大學 運輸科技與管理學系
計畫主持人:
任維廉
計畫參與人員:
兼任助理人員 博士班研究生 呂明頴
成果報告類型(依經費核定清單規定繳交):■精簡報告 □完整報告
本計畫除繳交成果報告外,另須繳交以下出國心得報告:
□赴國外出差或研習心得報告
□赴大陸地區出差或研習心得報告
■出席國際學術會議心得報告
□國際合作研究計畫國外研究報告
處理方式:
除列管計畫及下列情形者外,得立即公開查詢
□涉及專利或其他智慧財產權,□一年□二年後可公開查詢
中 華 民 國 100 年 7 月 31 日
1. Introduction
Advanced traveler information systems (ATIS) is a subset of intelligent transportation systems (ITS) that will be able to provide users a variety of services including navigational aids and yellow page type
information. A principal component of ATIS is route guidance, or the capability of providing drivers with desirable routes from their trip origins to destinations, based on historical, current or predicted travel
conditions (Thakuriah and Sen 1996). With the rapid development of technology, company is able to provide new products constantly. The new products replace old ones by providing either incremental functions or totally new functions. There are lots of new products related to ATIS, such as in-vehicle navigator, navigator PDA (personal digital assistant), and navigator phone, to become available in the market. Some of them (in-vehicle navigator) are well received by consumers, and soon penetrate the market. There are also some new products related to ATIS cannot be accepted by consumers, and are not readily welcomed in the market, such as navigator PDA. However, earlier research on new products provides limited theories to explain why consumer accept or reject the new product.
Recently, researchers propose a concept of “readiness” which is useful to explain consumers’ attitude toward new products, and their adoption behavior of new products (Bitner et al. 2002; Meuter et al. 2005; Parasuraman 2000). This is because that new products usually come with innovative technologies that
drastically change the way people interact with products. Therefore, new products may lead to the perception of discomfort and insecurity (Parasuraman 2000), and further decrease consumers’ motivation to purchase the new product. Consumers need to have technology-readiness, which refers to people’s propensity to embrace and use new technologies for accomplishing goals in home life and at work (Parasuraman 2000), so that they may accept the new product. Furthermore, researchers note the role of consumer readiness as an important mediator of the relationship between antecedents of new product adoption and consumer adoption behavior (Meuter et al. 2005). More specific, the innovation characteristic of new products are able to enhance
consumers’ motivation and ability, thus consumers are more likely to adopt the new product. Comprehensively, the concept of readiness is important in understanding consumers’ behavior of new product adoption.
Most of the above-mentioned research discusses new product adoption from the perspective of new product property. However, some studies emphasize the effect of old product on the purchase new product (Okada 2001; Okada 2006; Zhu et al. 2008). For example, providing trade-in of old product can increase consumers’ willingness to purchase new product. In other words, if consumers can properly dispose the old products (PDA without navigator), new product (navigator PDA) adoption could be easier. This research stream focuses on consumers’ disposition behavior and identifies factors that affect consumers’ disposition behavior, such as residual value (Okada 2001; 2006), emotional attachment (Beggan 1992; Fournier 1998; Jacoby et al. 1977) and status quo bias (Grewal et al. 2004). According to the adoption, replacement, and disposition literature, most researchers treat new product adoption and old product disposition as one time shooting, indicating that the acceptance of new products also means the rejection of old products.
Nevertheless, in real life, consumer may buy new product while still keep the old product. Therefore, we came to the realization that new product acceptance and old product rejection are not necessarily equivalent to consumers. To explain consumers’ ownership of more than one product in a category, we believe that the new product adoption and the old product disposition should be served as two separate concepts. Furthermore, according to readiness theory, we propose that two kinds of readiness should exist: “consumer readiness to accept new product” and “consumer readiness to reject old product”.
2. Research Purpose
In order to fully realize consumers’ product ownership, we construct a model which combines both perspectives of new product adoption and old product disposition. According to relevant literature, we explore the important antecedent of new product buying intentions and old product disposition intentions. We further introduce the concept of new product acceptance readiness and old product reject readiness, and clarify the roles of these two readinesses in explaining consumers’ product ownership. Our study can provide two theoretical contributions:
(1) The combination of new product adoption (such as navigator phone) and old product (such as phone without navigator) disposition, which previous research discuss them separately.
(2) The proposition of the concept of consumer readiness to reject old product (such as phone without navigator), which early studies only suggest the existence of readiness to accept new product (such as navigator phone).
of consumers’ decision process and developing more appropriate tactic for new product launching project. Especially, current research would provide managerial implications for government or practitioners to envelope ATIS.
3. Literature Review
3.1 Advanced Traveler Information Systems
An Advanced Traveler Information Systems (ATIS) is a functional area within Intelligent Transportation Systems (ITS) that will be able to provide users up-to-the-minute information on weather and road conditions, alternate routes, construction zones, and parking. ATIS may offer significant benefits in terms of improving the travel experience of individuals and enhancing system performance. They may be particularly useful in the context of incident-induced congestion (Al-Deek et al. 1998). Driver behavior should become more informed with the advent and deployment of real-time in-vehicle navigation systems. ATIS would provide drivers with guidance regarding fastest path between a current location and final destination, updated in real-time to consider recurring, and non-recurring congestion (Levinson 2003). Furthermore, whether drivers have would have different behaviors of route choice and have different perceptions of travel time. It is generally agreed that the congestion can be reduced by the ATIS adaption or ATIS market penetration (Yang 1998). Thus, whether or not the products related to ATIS, such as in-vehicle navigator, navigator phone and navigator PDA, could be accepted by consumers influences the developing of ATIS. Prior research exploring the
characteristics of early adopters of the ATIS service and reveals that the travelers response to the ATIS service is influenced by a complex variety of factors such as stage in the lifecycle, trip maker constraints, sex, age, risk aversion, knowledge of the route (Mehndriatta et al. 2000). However, relative few research focus on why they early or later adopt the ATIS services or products.
3.2 New Product Adoption and Concept of Readiness
As technology is penetrated into several aspects of life, technology-related products and services are becoming inevitable (Meuter et al. 2005). To catch up with the global trend, companies keep introducing new products and services that fulfill consumers’ evolving needs. Observing the importance, research on the determinants of innovation (new products and self-service technologies (SSTs)) adoption has gone on for decades. Research examines consumers’ perception of innovation characteristics includes diffusion of innovations (Rogers 1995), perceived innovation attributes as predictors of innovativeness (Ostlund 1974), technology acceptance model (Davis 1989), and price related studies (Kalyanaram and Winer 1995; Monroe 1990). According to Rogers (1995), new product adoption can be explained by relative advantage,
compatibility, complexity, triability, observability. In information system domain, perceived ease of use and perceived usefulness are critical variables driving new technology acceptance (Davis 1989). Technology readiness (TR) (Parasuraman 2000) that refers to people’s tendency to use new technologies is identified to affect new product adoption.
3.3 Important Antecedents of New Product Adoption 3.3.1 Price Fairness
When consider buying something, price is a critical factor taken into account. One aspect of price that drives purchase decisions is price fairness (Maxwell 2002). Consumers’ perception of a fair price has been recognized as a determinant of consumers’ willingness to purchase (Kahneman et al., 1986; Kalapurakal et al., 1991; Winer, 1986).
3.3.2 Subjective Norm
Social factors are also documented to affect adoption behavior. Subjective norm is one of them.
Normative influence has identified to affect people’s technology adoption behavior (Davis 1989; Ajzen 1991). These researchers theorize subjective norm as “the degree to which an individual perceives that important others believe he or she should use the new system”, which is originally advanced in the theory of reasoned action (TRA) (Ajzen and Fishbein 1980). In product adoption domain, products that fulfill the view of social norm assist consumers to achieve desired social goals by providing them with the characteristics they believe they lack (Grewal et al. 2004). In our research, we adapt the definition of subjective norm as “the degree to which an individual perceives that important others believe he or she should buy the new product”.
3.3.3 Technology Readiness
The development of new technology and new product has benefited consumers. Some new products are penetrating the market at a fast speed. But some don’t. Companies are beginning to aware that some
consumers choose to neglect, reject, or postpone their adoption of these products or services (Mick and Fournier 1998). Observing the challenges and frustration consumer encounters with new technologies, Parasuraman (2000) identify the role of technology readiness (people’s trait, generalized beliefs, and affects) in technology-based product acceptance. The researcher defines technology readiness (TR) as people’s propensity to embrace and use new technologies for accomplishing goals in home life and at work.
TR comprises four constructs: innovativeness (tendency to be a technology pioneer and thought leader), optimism (positive view about technology), discomfort (feeling of being overwhelmed by technology), and insecurity (distrust of technology). Parasuraman (2000) suggests that TR is positively related to consumer’s acceptance of technology-based products or services. Aside from some research’s view of TR as a higher order construct that reflects on innovativeness, optimism, discomfort, and insecurity (Lin et al. 2007) or TR as a whole drive adoption behavior(Lin and Hsieh 2006), Lam et al. (2008) examine the effect of the four TR constructs separately on adoption behavior. Their result indicates that innovativeness and optimism positively influence adoption behavior. Insecurity negatively affects adoption behavior.
3.4 Old Product Disposition and Important Antecedents 3.4.1 Effect of Old Product on New Product Adoption
Prior research on new product adoption not only centers on new product itself but also recognizes the influence of old products which are owned by consumers. “Consumer behavior can be viewed as the
acquisition, consumption, and disposition of goods, services, time and ideas by decision making units (Jacoby 1976).” Owing to the importance of new product adoption, extant literature focuses attention on acquisition, actual usage, or consumption (Jacoby et al. 1977). To buy new products, consumers have to deal with the existing product they have. If old product is still functional, old product may be the obstacle to accept new product (Jacoby, et al. 1977; Okada 2006). Observing the effect of old product on new product adoption, a stream of research investigates disposition behavior of consumer durable goods (Burke et al. 1978; Debell and Dardis 1979; Jacoby et al. 1977).
Prior literature of product disposition examines the factors that drive consumers’ disposition choices (Debell and Dardis 1979; Jacoby et al. 1977), consumers segments and related disposition behaviors (Burke, Conn, and Lutz 1978), and disposition process (Hanson 1980). Owing to various conditions of old products, Jacoby et al. (1977) develop a conceptual model of major disposition choices (e.g., keep the product, abandon it, give it away, sell it, trade-in). Product-related factors that lead to disposition such as performance or
technological obsolescence (Debell and Dardis 1979) and product that no longer corresponds to one’s self-image could be the underlying reasons for disposition (Belk 1988; Jacoby et al. 1977). When consider whether to dispose of certain product, consumers may take several factors into account, such as residual value, emotional attachment, and the status quo.
3.4.2 Residual Value
Residual value of the product is one of the major determinants in considering product disposition. Residual value refers to the “mental book value” from the mental accounting’s perspective. It is the positive difference between the initial purchase price and the cumulative enjoyment (Okada 2001). Good and frequent usage experiences will lead to lower residual value. If the residual value is low, consumers are more likely to dispose of the product. On the contrary, if the residual value is high, consumers are less likely to dispose of the product.
3.4.3 Emotional Attachment
Emotional attachment is the emotional bond linking an individual with a consumption entity (e.g., brand, person, place, or object) (Park and MacInnis 2006). Emotional attachment is negatively related to product disposition (Beggan 1992; Fournier 1998; Jacoby et al. 1977). Research has also indicated that emotional attachment to the old technology and to traditional products (e.g., How will I feel if I forgo the old?), can be a barrier to new product adoption (Fournier 1998). Consumers are more reluctant to give up items when they are more attached to the items (Ariely et al. 2005). Reluctance to give up items increases as consumer’s attachment to the item increases.
3.4.5 Status Quo Bias
To maintain the status quo is human nature. Samuelson and Zeckhauser (1988) introduce the concept “status quo bias” as a preference for the current state that biases people’s choices. That is, people tend to do nothing or maintain their current or prior decision. The status quo effect and the mere ownership effect suggest that consumers are often reluctant to abandon currently owned durables in favor of newer and potentially superior models (Grewal et al. 2004).
4. Research Model and Hypotheses
4.1 Operation Definition and Measurement of Research Constructs
Consistent with the new product adoption literature (Alexander, et al. 2008; Castaño et al. 2008; Herzenstein et al. 2007) we refer to new product adoption as buying a new product (e.g., a brand-new navigator phone). In old product disposition research (Jacoby et al. 1977), disposition alternatives include keeping, selling, giving out, throwing away, etc. In our research, we discuss selling old product only. 4.1.1 Consumer Readiness to Accept New Product
Prior research has documented several antecedents of new product adoption. But the questions of when and why consumer accept or not accept new product are relatively unexplored. Whether consumers are ready for the new product or not may critically affect their adoption intention. We advance the concept “consumer readiness to accept new product” (RA), which is adapted from “consumer readiness” (Meuter et al. 2005). Consumer readiness to accept new product refers to a condition or state in which a consumer is prepared to buy the new product (people’s propensity to buy new product), that consists of motivation and ability.
Motivation refers to a desire to buy the new product and ability reflects required capability and confidence to use the new product. Consumer readiness to accept new product is positioned as the mediators between the antecedents of new product adoption and consumer’s adoption intention.
Motivation: When the old product is still functional, buying new product may be unnecessary. To buy new product, consumer must be adequately motivated to do so. Consumer motivations stir, push, or prod one to take action (Fitzmaurice 2005). Meuter et al. (2005) identifies the importance of intrinsic and extrinsic motivation in trying SSTs. Similar to adopting new technology, adopting new product requires consumers to be sufficiently motivated to do it. In our research, motivation to buy new product refers to the extrinsic motivation of doing the action, which is instrumental and desirable to consumer. Hence, we posit that motivation to buy new product has a significant, direct effect on buying intention. In the survey instrument, four items adapted from Meuter et al. (2005).
Ability: SSTs to people who never used before are relatively new technologies. Meuter et al. (2005) find that before trying SSTs, people would evaluate whether they are capable of and how confident they are in using the technologies. Higher ability is thus identified to drive SSTs trial. Similarly, new product may contain new technologies or new functions. To properly use the new product, necessary capability is required. Hence, we expect that whether people have the ability to use the new product may largely affect their buying
intention. In the survey, three items adapted from Meuter et al. (2005). 4.1.2 Consumer Readiness to Reject Old Product
In reality, adopting new product does not necessarily lead to disposing of old product. Scarce research digs into this field. When will consumer buy new product and still keep the old product in use are left unsolved. To clarify the myth, we introduce the concept- consumer readiness to reject old product (RR), which refers to a condition or state in which a person is prepared to dispose of the old product. Notably, consumer readiness to reject old product is distinguished from consumer readiness to accept new product. Consumer readiness to reject old product also consists of motivation and ability but are different from that of consumer readiness to accept new product.
Motivation: To dispose of old product that is still functional, consumer must be adequately motivated to do so. When the product no longer fits in with the environment or corresponds to the owner’s preferences or self-image (Jacoby et al. 1977), it provides sufficient motivation to dispose of it. Without enough motivation to dispose of old product, it is unlikely that a person will take action. Thus, we expect that motivation to dispose of old product have a significant, direct effect on selling intention. In the survey, four items created for the context.
the ability to sell it. This ability reflects on people’s resource and related experience they have. For instance, some people are more experienced in online auction. Some people are used to sell the unwanted product to second-hand stores. Others seldom or never sell unwanted product. We posit that whether people are capable of and confident in selling the product will drive their selling intention. That is, we expect to identify a significant and direct relationship between ability and selling intention. In the survey, four items created for the context.
4.2 Research Hypotheses
4.2.1 Antecedents Variables as Predictors of Consumer Readiness
To assess the mediation effect of consumer readiness to accept new product and consumer readiness to reject old product, antecedent variables should have direct effect on consumer readiness variable. We delve into two sets of antecedent variables: antecedents of new product adoption and antecedents of old product disposition.
Antecedents of New Product Adoption: The antecedents of new product adoption explored are price fairness (4 items adapted from Stone and Gronhaug [1993]), subjective norm (4 items adapted from Stone and Gronhaug [1993] and Venkatesh and Davis [2000]), innovativeness, discomfort, optimism, and insecurity (15 items of 4 TR constructs adapted from Parasuraman [2000]). These factors are widely tested in new
product/technology adoption research. We suppose that price fairness, subjective norm, innovativeness, and optimism positively affect consumer readiness to accept new product. Discomfort and insecurity are expected to negatively affect consumer readiness to accept new product.
Antecedents of Old Product Disposition: Factors that drive disposition decision been explored are residual value, emotional attachment, and status quo bias. These factors are widely considered in disposition or trade-in literature. We expect that residual value (3 items created for the context), emotional attachment (4 items adapted from Sivadas and Venkatesh [1995] and Schifferstein and Zwartkruis-Pelgrim [2008]), and status quo bias (3 items created for the context) all have negative effect on consumer readiness to reject old product.
Mediation Hypotheses of Consumer Readiness Variables: Based on the conceptualization of the research model, the literature reviewed, and the important relationships examined in prior part, we propose the
following two mediating hypotheses:
H1a: Motivation to buy the new product and ability to use the new product mediate the relationship between antecedents of new product adoption and buying intention.
H1b: Motivation to sell old product and ability to dispose of the old product mediate the relationship between antecedents of old product disposition and selling intention.
4.2.2 The Effect of RA and RR on Buying and Selling Intention
In our proposed model, we expect that consumer readiness to accept new product has a direct and significant effect on consumer’s buying intention and consumer readiness to reject old product has a direct and significant effect on consumer’s selling intention. In reality, whether consumers are ready to accept new product may also affect their selling intention. Similarly, if consumers are more ready to sell their old product, they may be more prone to buy new product. We expect these effects to exist, but these effects will be smaller than the main effect. Hence, we propose the following hypotheses:
H2a: Consumer readiness to accept new product has a greater effect on buying intention than consumer readiness to reject old product.
H2b: Consumer readiness to reject old product has a greater effect on selling intention than consumer readiness to accept new product.
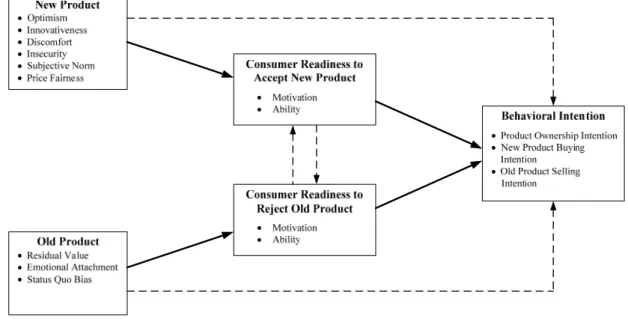
Based on the discussion and the hypotheses, we propose a model combine both adoption and disposition aspect. The model is shown in Figure 1. The left part of the model is the antecedents of new product adoption and old product disposition. The middle part is the consumer readiness to accept variables and consumer readiness to reject variables. The right part shows consumers’ buying, selling, and product ownership
intention. All variable are viewed as latent variable except product ownership. Product ownership is operated as a discrete variable.
Figure 1 The Conceptual Model 4.3 Research Methodology
Among the products related to ATIS, navigator phones are chosen as the illustrative product for the following reasons. First, they are prevalent in Taiwan and are viewed as everyday technology. Second, most of the mobile phone users have the experience of repeat purchases of mobile phone. Thus, it is easier for subjects to respond to the questions. Third, among 3C products, it is more likely for people to own more than one mobile phone at a time. To examine whether people are ready to accept new product and/or ready to reject old product, there must be a new product to evaluate. A flier of a new phone (named Navigator 1) with satellite navigation system is created. Satellite navigation system is included to investigate people’s technology readiness toward the mobile phone. Data are collected through survey instrument. All the items use a 7-point Likert Scale ranking from 7 (strongly agree) to 1 (Strongly disagree).
5. Analyses and Results
5.1 Investigation
Respondents are first presented with a piece of new navigator phone ads. After reading the ads, they are instructed to do a self-administered survey. When they finish filling out the surveys, they are given a gift as a return of the favor. Subjects were randomly chosen. In total, 408 surveys are collected, and 362 surveys are used for analysis. Of the sample, 49.2% were male and 50.8 % were female. Age of 20-29 stands for the highest portion (72.7%). 48.3 % are student and 31.2 % are office worker.
According to the results of CFA, the model fit indices are: χ2= 2645.1, df=1345, NFI=0.830, RFI=0.811, IFI= 0.914, TLI=0.904, CFI=0.913, and RMSEA=0.048. The level of internal consistency (reliability) in each variable is acceptable, with Cronbach’s α score range from 0.745 (residual value) to 0.923 (ability to use new product), indicating acceptable measurement reliabilities. Also, the composite reliability ranks from 0.742 (residual value) to 0.920 (selling intention). Hence, the results reflect the internal consistency of the indicator. The standardized factor loadings for the indicators rank from 0.523(motivation to buy new product: MN4) to 0.980 (Discomfort: Dis3). Based on the good over fit and the proper factor loadings of the items, we believe the measurement model have good convergent validity. To evaluate discriminant validity, the Average Variance Extracted (AVE) is calculated. AVE should be higher than the variances shared between the
constructs (Fornell and Lacker 1981). All the correlations between different constructs are lower than square roots of the AVE for each of the constructs. Hence, we infer that the constructs have adequate discriminant validity.
We use a two-step process to test for mediation. The first step is to ensure that antecedent has a
significant effect on intention. In the second step, we check whether antecedent has a direct effect on mediator, mediator has an effect on intention, and antecedent has an effect on intention. In the second step, the influence of antecedent on intention must be lessened when the mediator are included in the model. That is, the effect of antecedent on intention in step 2 should be less than that of step 1.
5.2 Results of the Mediation Effect
The results of the mediation test are summarized in Table 1, showing the comparison of the effect of antecedents on intention with and without mediator. We discover that the effects of price fairness, subjective norm, and innovativeness on buying intention are partially mediated by motivation to buy new product and ability to use new product. The effect of optimism on buying intention is fully mediated by motivation to buy new product and partially mediated by ability to use new product. The effect of insecurity on buying intention is partially mediated by ability to use new product. Motivation does not mediate discomfort and insecurity on new product buying. Hence, the result partially supports H1a.
Table 1 Mediation Effect Analysis Result
Predictor ANTINT (step1) ANTMED (step2) MEDINT (step2) ANTINT (step2) Conclusion
Description of Test: Motivation to new product as a mediator of the relationship between new product adoption antecedents and buying intention
PF 0.587 (0.001) 0.399 (0.001) 0.726 (0.001) 0.299 (0.001) Partial Mediation SN 0.639 (0.001) 0.428 (0.001) 0.624 (0.001) 0.374 (0.001) Partial Mediation INN 0.269 (0.001) 0.140 (0.001) 0.872 (0.001) 0.150 (0.001) Partial Mediation
DIS -0.038 (0.510) --- --- --- No Mediation
OPT 0.354 (0.001) 0.358 (0.001) 0.893 (0.001) 0.037 (0.470) Total Mediation INS -0.181 (0.025) -0.111 (0.102) 0.909 (0.001) -0.081 (0.123) No Mediation
Description of Test: Ability to use new product as a mediator of the relationship between new product adoption antecedents and buying intention
PF 0.587 (0.001) 0.346 (0.001) 0.168 (0.001) 0.527 (0.001) Partial Mediation SN 0.639 (0.001) 0.296 (0.001) 0.156 (0.001) 0.591 (0.001) Partial Mediation INN 0.269 (0.001) 0.332 (0.001) 0.290 (0.001) 0.174 (0.001) Partial Mediation DIS -0.038 (0.510) -0.501 (0.001) 0.444 (0.001) 0.183 (0.001) Partial Mediation OPT 0.354 (0.001) 0.389 (0.001) 0.310 (0.001) 0.233 (0.001) Partial Mediation INS -0.181 (0.025) -0.362 (0.001) 0.363 (0.001) -0.047 (0.505) Total Mediation
Description of Test: Motivation to old product as a mediator between old product disposition antecedents and selling intention
RV -0.334 (0.001) -0.714 (0.001) 0.444 (0.048) -0.017 (0.933) Total Mediation EA -0.514 (0.001) -0.066 (0.254) 0.430 (0.001) -0.486 (0.001) No Mediation SQB -0.157 (0.025) -0.016 (0.754) 0.462 (0.001) -0.150 (0.024) No Mediation
Description of Test: Ability to dispose of old product as a mediator between old product disposition antecedents and Selling intention
RV -0.334 (0.001) 0.159 (0.081) 0.455 (0.001) -0.403 (0.001) Partial Mediation EA -0.514 (0.001) 0.092 (0.232) 0.452 (0.001) -0.557 (0.001) No Mediation SQB -0.157 (0.025) -0.154 (0.029) 0.412 (0.001) -0.093 (0.156) Total Mediation Notes: The numbers shown are maximum likelihood parameter estimates, and p-values are shown in the parentheses. ANT: antecedents; INT: intention; MED: mediator; PF: price fairness; SN: subjective norm, INN: innovativeness; DIS: discomfort; OPT: optimism; INS: insecurity; RV: residual value; EA: emotional Attachment; SQB: status quo bias
For consumer readiness variable, motivation to dispose of old product partially mediates the effect of residual value on selling intention. Motivation to dispose of old product does not mediate the effect of emotional attachment and status quo bias because of their non-significant effect on motivation. Ability to dispose of the old product partially mediates the effect of residual value and fully mediates the effect of status quo bias on selling intention. Still, ability does not mediate between the relationship of emotional attachment and selling intention. The results partially support H1b.
5.3 The Effect of Readiness on New Product Buying Intention and Old Product Selling Intention To examine whether RA are dominating RR in affecting buying intention and whether RR are more influential in selling intention than RA, we run a SEM model to test the effect. The result (Table 2) indicates that buying intention is majorly affected by readiness to accept new product but not readiness to reject old product (MO-BI, ABO-BI not significant). Also, readiness to reject old product has a more pounced effect on selling intention than readiness to accept. Although motivation to accept new product has a significant effect on selling intention, the effect of readiness to reject variables are still greater than it. Hence, H2a and H2b are supported.
Table 2 Standardized Total Effect of RA and RR to Intention
Causal Relationship Path Coefficient Consumer Readiness to Accept
New Product
Motivation to New Product Buying Intention 0.778 (0.001) Ability to Use the New Product Buying Intention 0.098 (0.034) Consumer Readiness to Reject
Old Product
Motivation to Old Product Buying Intention 0.002 (0.958) Ability to Dispose of Old Product Buying Intention 0.064 (0.124) Consumer Readiness to Accept
New Product
Motivation to New Product Selling Intention 0.141 (0.013) Ability to Use the New Product Selling Intention 0.005 (0.933) Consumer Readiness to Reject
Old Product
Motivation to Old Product Selling Intention 0.366 (0.001) Ability to Dispose of Old Product Selling Intention 0.459 (0.001)
5.4 The Effect of Readiness on the Product Ownership
To gain more insight from the data, we analyze the results to determine whether people with different level of readiness to accept and readiness to reject have different intentions. In the analysis, we use mean score of readiness to split the people. We categorize people into four groups with high RA high RR (group 1), low RA high RR (group 2), low RA low RR (group 3), and high RA low RR (group4). The mean score of buying intention for the four groups are 4.32, 2.91, 2.91, and 3.97. Result shows that there are significant differences between group 1 and 2(p<0.001), group 1 and 3 (p <0.001). Group 1 and 4 (0.159) and 2 and 3 (1.000) are not significantly different. The result further supports our conceptualization that people with higher readiness to accept (group 1 and 4) have a higher buying intention. Mean scores for selling intention are 4.38, 3.97, 2.90, and 3.26 for group 1, 2, 3, and 4 respectively. The p-value between groups are 0.156 (1 and 2), p<0.001(1 and 3), p<0.001(1 and 4), p<0.001(2 and 3), 0.006 (2 and 4), and 0.298 (3 and 4). The
significance test shows that people with higher readiness to reject old product have a higher selling intention. The result shows that people in group 1 choose adventurer (replacement) the most compare to other
groups. Respondents in group 2 choose seeker (defer choice) the most than do the other group. Respondents in group 3 choose laggard (use old one) the most than do the other group. Respondents in group 4 choose
collector (buy new and keep old) the most than do the other group.
6. Discussion and Implication
6.1 General Discussion
According to our research model, we explore important antecedent of new product adoption (price fairness, subjective norm, innovativeness, discomfort, optimism, and insecurity) and antecedents of old product disposition (residual value, emotional attachment, and status quo bias). The effect of these antecedents is mediated by RA (H1a) and RR (H1b), which are proposed by our study. Furthermore, RA is found to have greater effect on buying intention than RR (H2a). RR is identified to be more pronounced in affecting selling intention than RA (H2b).
RA is identified to be mediators between adoption antecedents and buying intention. Motivation to buy new product mediate 4 of the 6 antecedents except discomfort and insecurity. The result indicates that price fairness, social norm, innovativeness, and optimism positively affect consumers’ motivation to buy new product. The motivation further increases buying intention. Ability to use new product mediate 5 of the 6 antecedents. The findings imply that innovativeness and optimism positively affect their ability to use new product. With higher ability to use the new product, consumers are more willing to buy new product. Insecurity’s negatively affect their ability to use new product thus reduce consumer’s buying intention.
RR mediates the relationship between disposition antecedents and old product selling intention. Motivation to sell old product mediate the effect of residual value. The result indicates that with higher
residual value, consumers are less motivated to sell the product, hence reduce their selling intention. Ability to sell old product mediate 2 of the 3 antecedents: residual value and status quo bias. Interestingly, higher
residual value decreases people’s motivation to sell the old product but increases people’s ability in selling it. With higher residual value, consumers are more confident in selling old product (higher ability), thus increase their selling intention. In addition, people that are more status quo biased are more likely to keep their product instead of selling it. Hence reduce their experience (ability) in selling. Thus decrease selling intention.
(group 1) are more likely to choose buying new product and sell the old product than other group. People with low RA and high RR are more likely to choose action that is looking for other new product than other group. People with low RA and low RR are more pronounced in keep using the old product regardless of the new product. People with high RA and low RR tend to buy new product and keep the old product.
To sum up, the major contribution of the research is twofold. First, the conceptual model integrates both new product adoption and old product disposition. We look into how consumer readiness variables mediate between the relationships of antecedents and intention. The adding of the consumer readiness variable broadens our knowledge in consumers buying and selling decisions. Second, by differentiating consumer readiness to accept new product from consumer readiness to reject old product, we further clarify that buying does not necessarily equivalent to selling. Also, with the construction of RA and RR, we are capable of forecasting consumer buying and disposing intention simultaneously.
6.2 Managerial Implication
As Meuter et al. (2005) has mentioned, “For many firms, often the challenge is not managing the
technology but rather getting consumers to try the technology.” Their findings provide companies with useful strategies in implementing SSTs or introducing new products. They focus on new product perspective, our research include both new product and old products’ effect. The inclusion of old product’s perspective could offer companies with a more thorough understanding of consumer’s attitude toward new product and their old product. By knowing the critical effect of RA and RR on buying and disposition intention, companies can apply tactical strategies to increase consumer’s motivation and ability in both readinesses.
Our research categorizes 4 groups of possible choice: adventurer (replacement), seeker (to defer choice), laggard (to use the old product), and collector (buy new keep old). Adventurer and collector are more
appealing to the company. Companies could use some tactics to move people from seeker and laggard to adventurer and collector. Management can encourage buying by increasing people’s RA variables. For seeker consumer, company can provide other new models and provide them with trade-in or other disposition alternatives. By do this, company may move consumer from seeker to adventurer. For people who think their old product still function well (laggard), companies can increase their motivation to buy new product and ability in using the new product by differentiating the new product from their old product and stress their product is easy to use. Also, the company can inform their consumer that they do not have to dispose of their old product (retire or sell it). It is because of the two products are somehow different. By doing this, consumer may move from laggard to collector.
Reference
[1] Alexander, David L., John, G. Lynch Jr., and Qing Wang (2008), “As Time Goes By: Do Cold Feet Follow by Warm Intentions for Really New Versus Incrementally New Products?” Journal of Marketing Research, 45(3), 307-319.
[2] Ajzen, Icek (1991), “The Theory of Planned Behavior,” Organization Behavior and Human Decision Process, 50, 179-211. [3] Ajzen, I., & Fishbein, M. (1980). Understanding attitudes and predicting social behavior. Englewood Cliffs, NJ: Prentice
Hall.
[4] Al-Deek, Haitham M., Asad J. Khttak, Paramsothy Thananjeyan (1998), “A Combined Traveler Behavior and System Performance Model with Advanced Traveler Information Systems,” Transportation Research Part A, 32(7), 479-493. [5] Ariely, Dan, Joel Huber, and Klaus Wertenbroch (2005), “When Do Losses Loom Larger Than Gains?” Journal of Marketing
Research, 42(May), 134-138.
[6] Beggan, James K. (1992), “On the Social Nature of the Nonsocial Perception: The Mere Ownership Effect,” Journal of
Personality and Social Psychology, 62 (Feburary), 229-237.
[7] Belk, Russell W. (1988), “Possessions and Extended Self,” Journal of Consumer Research, 15(Sep), 139-158.
[8] Bitner, Mary Jo, Amy L. Ostrom, and Matthew L. Meuter (2002), “Implementing Successful Self-Service Technologies,”
Academy of Management Executive, 16(4), 96-109.
[9] Burke, Marian, W. David Conn, and Richard J. Lutz (1978), “Using Psychographic Variables to Investigate Product Disposition Behaviors,” Research Frontiers in Marketing: Dialogues and Directions, S. C. Jain, ed. Chicago: American Marketing Association, 321-26.
[10] Castaño, Raquel, Mita Sujan, Manish Kacker, and Harish Sujan (2008), “Managing Consumer Uncertainty in the Adoption of New Products: Temporal Distance and Mental Simulation,” Journal of Marketing Research, 45(June), 320-36.
[11] Davis, Fred D. (1989), “Perceived Usefulness, Perceived Ease of Use, and User Acceptance of Computer Technology,” MIS
Quarterly, 13, 319-340.
[12] Debell, Margret and Rachel Dardis (1979), “Extending Product Life: Technology isn’t the only Issue,” Advances in Consumer
Research, Vol. 6, 381-385.
[13] Fitzmaurice, Julie (2005), “Incorporating Consumers’ Motivation into the Theory of Reasoned Action,” Psychology &
Marketing, 22(11), 911-929.
Consumer Research, 24(March), 343-70.
[15] Grewal, Rajdeep, Raj Mehta, and Frank R. Kardes (2004), “The Timing of Repeat Purchases of Consumer Durable Goods: The Role of Functional Bases of Consumer Attitudes,” Journal of Marketing Research, Vol. 41, February, 101-115.
[16] Hanson, James W. (1980), “A Proposed Paradigm for Consumer Product Disposition Processes,” Journal of Consumer Affairs, Vol. 14, No.1, 49-67.
[17] Herzenstein, Michal, Steven S. Posavac, and J. Joško Brakus (2007), “Adoption of New and Really New Products: The Effects of Self-Regulation Systems and Risk Salience,” Journal of Marketing Research, 44(2), 251-260.
[18] Jacoby, Jacob (1976), “Telling It Like It Is,” in Advances in Consumer Research, Vol. 3, Beverlee B. Anderson (ed.), Ann Arbor, MI: Association for Consumer Research, 1-11.
[19] Jacoby, Jacob, Carol K. Berning, and Thomas F. Dietvorst (1977), “What about Disposition?” Journal of Marketing, Vol. 40, Iss. 2, 22-28.
[20] Kahneman, Daniel, Jack L. Knetsch, and Richard H. Thaler (1986), “Fairness as a Constraint on Profit Seeking: Entitlements in the Market,” American Economic Review, 76 (September), 728–741.
[21] Kalapurakal, R., P. R. Dickson, and J. E. Urbany (1991), “Perceived Price Fairness and Dual Entitlement,” Advances in
Consumer Research, 18, 788–793.
[22] Kalyanaram, Gurumurthy, and Russell S. Winer (1995), “Empirical Generalizations from Reference Price Research,”
Marketing Science, 14(3), 161-169.
[23] Lam, Shun Yin, Jeongwen Chiang, and A. Parasuraman (2008), “The Effects of the Dimensions of Technology Readiness on Technology Acceptance: An Empirical Analysis,” Journal of Interactive Marketing, 22(4), 19-39.
[24] Levinson, David (2003), “The Value of Advanced Traveler Information Systems for Route Choice,” Transportation Research
Part C, 11, 75-87.
[25] Lin, Chien-Hsin, Hsin-Yu Shih, and Peter J. Sher (2007), “Integrating Technology Readiness into Technology Acceptance: The TRAM Model,” Psychology & Marketing, Vol. 24(7), 641-657.
[26] Lin, Jiun-Sheng Chris and Pei-Ling Hsieh (2006), “The Role of Technology Readiness in Customers’ Perception and Adoption of Self-Service Technologies,” International Journal of Service Industry Management, Vol. 17, No. 5, 497-517. [27] Maxwell, Sarah (2002), “Rule-Based Price Fairness and Its Effect on Willingness to Purchase,” Journal of Economic
Psychology, 23, 191-212
[28] Mehndriatta, Shomik, Michael Kemp, Sean Peirce, and Jane Lappin (2000), “Users of A Regional Telephone-based Traveler Information System- a Study of TravInfo Users in the San Francisco Bay Area,” Transportation, 27, 391-417.
[29] Meuter, Matthew L., Mary Jo Bitner, Amy L. Ostrom, and Stephen W. Brown (2005), “Choosing Among Alternative Service Delivery Modes: An Investigation of Customer Trial of Self-Service Technologies,” Journal of Marketing, 69(April), 61-83. [30] Mick, David Glenn and Susan Fournier (1998), “Paradoxes of Technology: Consumer Cognizance, Emotions, and Coping
Strategies,” Journal of Consumer Research, 25(September), 123-147.
[31] Monroe, Kent B. (1990), Pricing: Making Profitable Decision, 2d ed. New York, McGraw-Hill.
[32] Okada, Erica Mina (2001), “Trade-Ins, Mental Accounting, and Product Replacement Decisions,” Journal of Consumer
Research, 27(March), 433–446.
[33] Okada, Erica Mina (2006), “Upgrades and New Purchases,” Journal of Marketing, 70 (October), 92–102.
[34] Ostlund, Lyman E. (1974), “Perceived innovation Attributes as Predictors of Innovativeness,” Journal of Consumer Research, 1(September), 23-29
[35] Parasuraman A., (2000), “Technology Readiness Index (TRI): A Multiple-Item Scale to Measure Readiness to Embrace New Technology,” Journal of Service Research, (May), 2, 4, 307-20.
[36] Park, C. Whan and Beborah J. MacInnis (2006), “What’s In and What’s Out: Questions on the Boundaries of the Attitude Construct,” Journal of Consumer Research, 33, 16-18.
[37] Rogers, Everett M. (1995), Diffusion of Innovations, 4th ed. New York: The Free Press
[38] Samuelson, William and Richard Zeckhauser (1988), “Status Quo Bias in Decision Making,” Journal of Risk and Uncertainty, 1(1), 7-60.
[39] Schifferstein, Hendrik N. J. and Elly P. H. Zwartkruis-Pelgrim (2008), “Consumer-Product Attachment: Measurement and Design Implications,” International Journal of Design, 2 (3), 1-13.
[40] Sivadas, Eugene and Ravi Venkatesh (1995), “An Examination of Individual and Object Specific Influences on the Extended Self and its Relation to Attachment and Satisfaction,” In Advances in Consumer Research 22. Eds. Chris T. Allen and Deborah Roedder John. Provo, UT: Association for Consumer Research, 406-412.
[41] Stone, Robert N., and Kjell Grønhaug (1993), “Perceived Risk: Further Consideration for the Marketing Discipline,”
European Journal of Marketing, 27(3), 39-50.
[42] Thakuriah, Piyushimita (Vonu) and Ashish Sen (1996), “Quality of information given by advanced traveler information systems”, Transportation Research Part C, 4 (5), 249-266.
[43] Venkatesh, Viswanath. and Fred D. Davis (2000), “A Theoretical Extension of the Technology Acceptance Model: Four Longitudinal Field Studies,” Management Science, 46, 186-204.
[44] Winer, R. (1986), “A Reference Price Model of Brand Choice for Frequently Purchased Products,” Journal of Consumer
Research, 13 (September), 250–256.
[45] Yang, Hai (1998), “Multiple Equilibrium Behaviors and Advanced Traveler Information Systems with Endogenous Market Penetration,” Transportation Research Part B, 32 (3), 205-218.
[46] Zhu, Rui (Juliet), Xinlei (Jack) Chen, and Srabana Dasgupta (2008), “Can Trade-Ins Hurt You? Exploring the Effect of a Trade-In on Consumers’ Willingness to Pay for a New Product,” Journal of Marketing Research, 45(April) 159-170.
1
出席國際學術會議心得報告
計畫編號 NSC 99-2410-H-009-038- 計畫名稱 探討換新就緒度和汰舊就緒度對消費者採用先進旅行者資訊系統相關新產 品之影響-以GPS導航手機為例 出國人員姓名 服務機關及職稱 任維廉,國立交通大學運輸科技與管理學系教授 會議時間地點 2010/12/11-2010/12/14,香港 (Hong Kong)會議名稱 The 15th HKSTS (Hong Kong Society for Transportation Studies) International Conference: Transportation and Urban Sustainability
發表論文題目 Effect of perceived justice and satisfaction of frequent flyer programs on passenger’s loyalty: A case of Taiwanese airlines
一、參加會議經過
香港運輸研究學會 (Hong Kong Society for Transportation Studies (HKSTS) 每年年底都會主辦 國際研討會,邀請歐美著名學者來香港與亞洲學者研討最新運輸課題。今年是第 15 屆了。 今年大會主題為 “Transportation and Urban Sustainability”,因為隨著經濟及城市化的快速發 展,當前最重要的課題是運輸系統的永續經營,包括規劃,工程和管理各層面。全部活動於 2010 年 12 月 11 日至 14 日共四天,包括在香港九龍海景嘉福酒店(InterContinental Grand Stanford Hong Kong) 進行各項論文研討活動。其中 14 日之參訪活動係參觀 Western Harbour Tunnel Company Limited, MTR Corporation 的 Operations Control Centre, Motor Bus Company 的 Headquarter 等。
開幕儀式於 11 日上午9點整舉行,由香港理工大學 (Hong Kong Polytechnic University) J.G. Teng教授和香港運輸研究學會主席 William H.K. Lam 教授進行開幕致詞,接著由香港運輸部 門的Commissioner Joseph Y. T. Lai 主講:”Sustainable Transport in Hong Kong”。Keynote address 是由英國 Leeds大學的Anthon D. May 教授主講:”Urban Transport and Sustainability: The Key Challenges”, 美國UC Berkeley 的 Pravin Varaiya 教授主講:”Active Traffic Management”, 然 後開始整個會議活動。
本次學術論文場次共包含 109 篇論文,分別於 5 個會議室、各 5 個場次,一共 25 個場次舉 行研討。
主題包括:Sustainable Transportation Systems, Transportation Safety, Outstanding Student Paper Award, Infrastructure and Transportation Planning, Congestion Pricing, Activity Based Travel Behavior, Travel Behavior Modeling, Freight Transportation and Maritime, Network Modeling, Network Reliability, Demand Modeling, Transportation and the Environment, Intelligent
2
Operation Research, Highway Engineering, Traffic Flow and Traffic Signals, Public Transport.
本次會議我們的論文報告是安排在 12 月 13 日下午 15:05~16:45 的 Air Transport (E1) 場次第
二篇報告,Session Chair 是 Kevin O’Connor 教授。該場次除了我們外,第一個報告者是來自
於德國的 Richard Klophaus 報告:”The economics of unbundling air travel services”。 第三篇 是由 Chairman Kevin O’Connor 教授和來自於澳洲的 Kurt Fuellhart 一起報告:”Air services at second ranked cities: Decline or growth?”。第四篇是由西班牙的學者 Augusto Voltes-Dorta 報 告:”A frontier-based hierarchical clustering for airport benchmarking”。最後一篇是由日本的學 者 Yasuo Asakura 報告:”Way of mining travelers’ impression from blog pages about using behavior of Kansai airport”。 在會議期間,我們遇到許多來自台灣交通運輸領域的學者及教授,如交大藍武王教授、邱裕 鈞教授、黃家耀助理教授,逢甲溫傑華教授,東吳胡凱傑助理教授。 二、與會心得 與來自世界各地的學者,專家共聚一堂,而各個相關主題的分類更可以使相同領域的學者們 針對彼此不同的概念進行討論,了解到對於問題的看法可以多重的觀點與角度,進而激發出 新的研究想法,因而受益良多。 雖然每篇論文的報告時間只有 12 到 15 分鐘,不足以完整瞭解其研究內涵,但是卻可以拓展 更廣的視野,無論是研究課題或方法論應用,可以讓我們對當今國際上研究的趨勢或方法有 新的認識,進而有所啟發。 最後值得一提的是,大會非常用心,在會議結束後不久,很快地就將相關活動相片貼上專屬 facebook 網頁: http://www.facebook.com/photo_search.php?oid=121244894570435&view=all 三、建議 HKSTS 所舉辦的國際研討會已堂堂邁入第 15 年,這次的參與者來自於大陸、美國、德國、 英國、希臘、挪威、荷蘭、瑞典、法國、西班牙、加拿大、澳洲、新加坡、泰國、印尼、馬 來西亞、韓國、日本、台灣和香港。在會議上有非常多的西方面孔的學者和教授與會,是這 個年會的特色。此外,大陸學者的積極參與,及論文的快速增加更令人印象深刻。 亞洲區香港的研討會竟然可以辦得這般國際化,可以當作國內未來辦研討會的參考,希望未 來能在國內看到許多大型的國際研討會。特別是中華民國運輸學會之年會,可以借鏡他們, 提供更多國內學者與學生和國外學者交流的機會。
3 四、攜回資料名稱及內容 攜回大會手冊一本,研討會論文集一本,個人名牌一份,攜帶背包一個,便條紙、原子筆、 廣宣資料等。 五、其他 感謝國科會補助此次出國費用 (補助編號:NSC 99-2410-H-009-038-),希望能繼續支持進行 國際交流。此外,在會場也有看到一些其他的台灣碩博士班學生參加,實在難得,也建議國 科會對於學生出國發表論文能多給予財務支持。
Hu, Liao, Lu & Jen 1
__________________________________________________________________________________
EFFECTS OF PERCEIVED JUSTICE AND SATISFACTION OF FREQUENT FLYER PROGRAMS ON PASSENGER’S LOYALTY: A CASE OF TAIWANESE AIRLINES
K.C. HU a, H.T. LIAO b, L.M. LU c and W. JEN c
a Department of Business Administration, Soochow University, Taiwan Email: [email protected]
b Department of Logistics and Shipping Management, Kainan University, Taiwan c Department of Transportation and Technology Management, Chiao Tung University, Taiwan
ABSTRACT
Recently, with more fierce competition, the airlines have been focusing on developing the relationship with their customers. Frequent Flyer Programs (FFPs) is one of the tactics airlines practice to maintain their relationship with passengers or lure passengers. For this reason, meeting passengers’ needs and enhance their loyalty through FFPs have become the essential concern for all the airlines. Moreover, during the interaction with airlines in regard to FFPs customers will take the justice to heart. The perception of justice will influence the customers’ satisfaction. Therefore the purpose of this study is to explore the effects of perceived justice on customer’s satisfaction of FFPs and loyalty of airline’s passengers. The structural equation modeling is conducted to deal with this issue. By the means of questionnaire, the data are collected from the Frequent Flyer members of China Airlines and Eva Airways in Taiwan. The results found that if passengers are satisfied with the interaction justice of the FFPs they will be more willing to cooperate and develop longer loyal relationship with the airlines. Moreover, the study also found that interactive justice has the most positive effect on customer satisfaction, while procedure justice has less positive effect followed. As far as distributive justice is concerned, for the Frequent Flyer members, the result showed not much effect here. Finally, this study mentioned that some managerial implications are suggested by the research results, and it may offer some ideas of future researches.
KEYWORDS
Airlines, Frequent Flyer Programs, Perceived Justice, Satisfaction, Loyalty
1. INTRODUCTION
In recent years, drastic rises in the price of fuel and the depression of economic, airlines are faced with more challenges and difficult situations which lead to fiercer competition. Airlines have to retain the profitability through maintain the relationship with passengers and lure their patronage repeatedly (Patterson and Smith 2003). Therefore, airlines have continuously executed many varieties of marketing strategies to attract travelers. Furthermore, loyalty reward programs, frequent flyer programs (FFPs), are the important tactics for airlines in their marketing services (Park 2010). Thus, the effects of FFPs on passengers’ behavior are considered in practice and academic.
Frequent flyer programs practiced by airlines provide passengers to accumulate their frequent flyer miles of trips to obtain “free” tickets or upgrade for the future trips. FFPs came into existence when American Airlines launched its AAdvantage Frequent Flyer Program into the market in May 1981. Basically, members accumulate credits by flying on the airline’s routes. Credits also can be earned by renting cares from, and staying at hotels belonging to, designated affiliates. Members cash in on their earned mileage credits for certificates of upgrades on free travel, usually restricted in usage by time and destination. This kind of loyalty reward program is well received by travelers (Atalik 2007). Prior research document that the FFPs have significantly effect on travelers’ choice behavior (Suzuki 2003). The frequent flyer program has become not only the long-term strategy for airlines, but also an effective marketing technique in the airline industry with positive implications for the financial
2 Transportation and Urban Sustainability
__________________________________________________________________________________________
performance of the airlines (Yang and Liu 2003). Consequentially, improving the relative attractiveness of the frequent flyer programs is an important issue for many airlines. Nevertheless, airlines are engaging in making FFPs varied, but rarely pay close attention to how passengers perceive the process of executive FFPs.
Furthermore, the scheme of FFPs and the way employees interact with passengers related to redeeming service had the effect on travelers’ evaluation of airlines (Toh and Hu 1998, Whyte 2004). Either the program scheme or the process of executive programs is important for airlines to attract passengers. According to the rule of FFPs, there are many restrictions, specific time period and limited seats, when passengers redeemed for the free tickets or upgrade. It makes passengers can’t acquire what they want frequently. Moreover, passengers have to cope with the complex processes in the redeeming service. And whether passenger be treated fairly may cause passengers perception of fairness. And these had further effect on passengers’ satisfaction (Forbes et al. 2005). Thus, the perceived justice of passengers related to FFPs will influence their further attitude and behavior. Perceived justice focuses on the motivational and cognitive processes of weighing justice inputs against justice outcomes (Maxham III and Netemeyers 2003). The researchers had partitioning justice into distributive, procedural, and interactional justice (Tax et al. 1998). What is called distributive justice is that customers obtain the outcome fairly from service; the procedural justice is that customers perceived fair form the process of service; and the interactional justice is customers perceived fair in interactions with employees (Bies and Shapiro 1998, Greenberg and Baron 2003). Prior research showed that customers feel just and satisfied while they perceived the outcomes equal to inputs (Tax et al. 1998, Homburg and Furst 2005). Thus, how to execute the FFPs is worth and necessary to be discussed.
Most of prior research related FFPs focus on the design of scheme of programs (Gudmundsson et al., 2002; Suzuki, 2003; Yang and Liu, 2003), but rare researchers concentrate their attention on the effects of passengers’ perception of programs. Makes passengers enable to obtain benefits from FFPS is important for airlines to use FFPs as a tactic to increase the satisfaction and loyalty of passenger (Klemperer 1995). Thus, the purpose of this study is exploring the effects of perceived justice on the satisfaction and loyalty of passengers.
2. LITERATURE REVIEWS AND HYPOTHESES
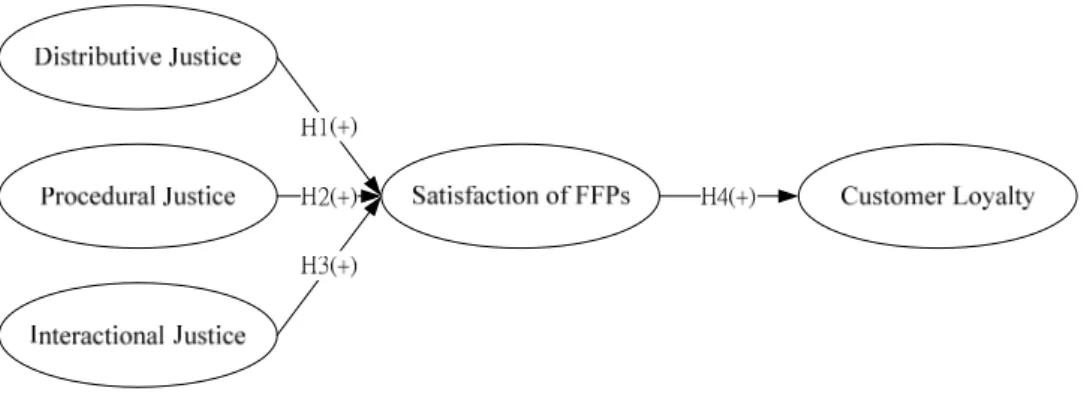
The choice behavior of passengers highly correlated to the schemes of FFPs and service quality (Long et al. 2003). The schemes of FFPs are duplicable, but the way the program be executed. According prior research, perceived justice is that customer will compare the value they gain from the consumption and the resource input and further affects the satisfaction (Huppertz et al. 1978).And how customer perceived and be treated in the redeeming service have effect on the customers’ perception. Not only the scheme of FFPs, but also the passenger’s perception of justice had effect on the success of FFPs. Therefore, this study will focus primarily on the investigation of perceived distributive justice, procedural justice, and interactional justice of FFPs of air passengers. We will exam the effects of distributive justice, procedural justice, and interactional justice on satisfaction of FFPs and customer loyalty. We draw a diagram to explain our framework in Figure 1. The customer loyalty means passengers’ loyalty to the airlines.
Perceived justice represents the extent to which people ascertain the fairness of an exchange between themselves and another party (Deutsch 1985, Lind and Tyler 1988, Greenberg 1990). The prior research reveals that perceived justice is composed of distributive, interactional, and procedural justice (Tax et al. 1998). And these three constructs measure service encounter fairness associated with the output, people, and process involved, respectively (Severt 2002).
Hu, Liao, Lu & Jen 3
__________________________________________________________________________________
Figure 1. Research model
Distributive justice is based on social exchange theory that people assess the equity of an exchange by comparing input to outcomes (Deutsch 1985, Greenberg 1990). Higher distributive justice customers perceived the higher probability they will satisfy and re-patronize (Blodgett et al. 1993). The satisfaction has arises from perception of distributive justice when customers perceived the results or outcomes of redeeming are equality (Deutsch 1985, Schoefer and Ennew 2005, Atalik 2007).Thus, we posit the following:
H1: Perceived distributive justice positively affects satisfaction of FFPs.
For procedural justice, it refers to the fairness of the policies and procedures used to achieve outcomes (Lind and Tyler 1988). Procedural justice is process fairness and services marketing research have used procedural justice to measure fairness (Severt 2002). The satisfaction comes from procedural justice when they perceived fair from process of redeeming service, and higher justice they perceived higher satisfaction they felt (Luria and Yagil 2008). Thus, we posit the following:
H2: Perceived procedural justice positively affects satisfaction of FFPs.
Interactional justice comes of the interpersonal part of a transaction (Severt 2002). It indicates that the customers believe they have been treated justly in their interactions with employees (Maxham III and Netemeyer 2003). Customers perceived unfairness in interactions with employees when they were treated with dishonesty and impoliteness (Tax et al. 1998). And that will make customers feel dissatisfied. Thus, we posit the following:
H3: Perceived interactional justice positively affects satisfaction of FFPs.
The relationship between customer satisfaction and post purchase behavior were broadly discussed by researchers (Bitner 1990, Oliver 1999). Prior research reveals that satisfaction positively affects the intention of repurchase (Cronin and Taylor 1992). And the satisfaction was the antecedent of loyalty and positively effects on customer loyalty (Bitner 1990). Chang and Chen (2007) study on customer loyalty of air passengers and found that the relationship between the contents of FFPs and perceived benefit of FFPs, and further influence the customer loyalty. Furthermore, the higher satisfaction of program frequent flyer members perceived the higher loyalty will result (Grondholdt et al. 2000). Thus, we test the following hypothesis:
H4: The satisfaction of FFPs positively affects customer loyalty.
3. RESEARCH METHODS
For distributive justice, procedural justice, and interactional justice, we referred to the content of Schoefer and Ennew (2005), Atalik (2007) and devised 3 questions, including “The ratio of the money I spent to the miles I earned is equitably distributed”, “It is a reasonably redeeming that the number of mile be deducted against the preferential product I can acquire”, and “Generally, the ratio of the reward is fair”. Our study refers to the prior study and designed 3 questions, including “The procedure of redeeming is expedient”, “Serving passengers is a top priority for the airlines while providing the
4 Transportation and Urban Sustainability
__________________________________________________________________________________________
redeem service”, and “Employees can adopt my suggestions and improve on while providing the redeem service”. For interactional justice, we refer to the prior research and introduced 3 questions, including “I have been treated well in interact with employees while they provided redeem service”, “Employees are courteous to me and performed well when they interact with me in redeeming service”, and “I feel be esteemed when employees interact with me in redeeming service”. For the construct of satisfaction of FFPs and customer royalty, our study refers to the research of Gondholdt et
al. (2000) and devised 3 questions respectively. There are “I am satisfied the overall redeeming
service”, “I am delight with the redeeming service”, “The service airlines provide in redeeming service exceeds my expectations”, “This airlines is my first priority”, “I will always fly by this airlines”, and “I will recommend the service of this airlines to others”.
A survey of the passengers of airlines has been conducted with a questionnaire in this research and a Likert five-level scale is applied to all questions to allow subjects to rate each construct variable (1 stands for “strongly disagree” and 5 for “strongly agree”). Since there have many passengers within north Taiwan, the survey was conducting at Taoyuan International Airport which is the major station in north Taiwan. Besides, we have set the estimated number of samples at 400 in order for meet the basic requirements for the structural equation model (SEM) to be valid.
The paths in the research model were analyzed using structural equation modeling (SEM). Analysis followed a two-step procedure based partly on the approach recommended by Anderson and Gerbing (1988). The first step applied confirmatory factor analysis to develop a measurement model that has an acceptable fit to data. The second step then tests the theoretical model (or structural model) via path analysis to ensure that the structural model is meaningful and statistically acceptable. Notably, SEM is used to test some causal relationships among construct variables. The adjustment of collected sample could only produce some duplicate data and that is no meaning while applying this method. Therefore, the raw sample was used directly in this study.
4. RESULTS
4.1 Sample and Reliability Analysis
A total of 420 questionnaires were distributed for the research and 403 copies were recovered and valid. The effective sample recovery rate was 96.0%. Among 403 copies, 254 copies (63.3%) were given to China Airlines and 149 copies (36.97%) to Eva Airways. The ages of 35.2% respondents were between 36 and 45, 27.3% were between 26 and 35, and 181 respondents (45%) were female. Among all respondents, 26.95% indicated that they have had the experience of redeem their miles for the upgrade and 24.39% indicated that they have had the experience of redeem their miles for the free ticket, while only 1.89% indicated that they have had the experience of deduct 5000 miles for the lounge invitation.
With regards to the test of reliability, we have chosen Cronbach’s α reliability coefficient for the analysis in this study. The reliability coefficients for distributive justice, procedural justice, interactional justice, satisfaction of FFPs, and customer loyalty presented in the questionnaire were 0.914, 0.771, 0.891, 0.804, and 0.843 respectively. All the values of Cronbach’s α were greater than 0.7. Thus, this means all dimensions adopted in this research are highly reliable.
4.2 Confirmatory Factor Analysis
Confirmatory factor analysis is primarily used to validate or confirm the attribute of parameters in the factor analysis or the number of factors involved. There are five latent variables present in the model presented in this research: Distributive justice (V1~V3), Procedural justice (V4~V6), Interactional justice (V7~V9), Satisfaction of FFPs (V10~V12) and Customer loyalty (V13~V15). Results of measurement model fitness indices are shown in Table 1. The ratio of Chi-square/df was smaller than 3 (245.101/83=2.953). In addition, we could also see from the table that the value of AGFI was
Hu, Liao, Lu & Jen 5
__________________________________________________________________________________ approaching 0.9 while other indices such as GFI, CFI, NFI and NNFI have exceeded 0.9. Not only that, RMR has fallen below 0.05 with RMSEA dropping below 0.08. Overall speaking, the indices show the acceptable fitness of measurement model.
Table 1. Result of measurement model fitness indices
Chi-square df GFI AGFI CFI NFI NNFI RMR SRMR RMSEA
245.101 83 0.929 0.897 0.960 0.940 0.960 0.049 0.047 0.070 The result of measurement model characteristic analysis is shown in Table 2. From the t-value in the table, it is evident that the standardized factor loadings for all indices have reached the significance level. In addition, the standardized factor loadings for all indices have exceeded 0.5. This showed that all indices have sufficient convergent validity (Anderson and Gerbing 1988). Furthermore, All constructs have shown excellent composite reliability (>0.7) (Fornell and Larker 1981). The variance extracted estimate for each construct variable is greater than 0.5. Thus, the measurement model has the both reliability and validity.
Table 2. Analysis of measurement model Standardized
factor loading t-value Compositereliability Variance extractedestimates Distributive Justice 0.916 0.784 V1 0.905 22.932* V2 0.912 23.202* V3 0.837 20.285* Procedural Justice 0.772 0.531 V4 0.745 16.323* V5 0.733 15.973* V6 0.707 15.258* Interactional Justice 0.893 0.736 V7 0.827 19.748* V8 0.888 22.042* V9 0.857 20.858* Satisfaction of FFPs 0.810 0.590 V10 0.838 19.847* V11 0.803 18.641* V12 0.650 13.992* Customer Loyalty 0.856 0.667 V13 0.880 21.306* V14 0.853 20.353* V15 0.707 15.594*
Note: *indicates t-test has reached the significance level of p<0.05
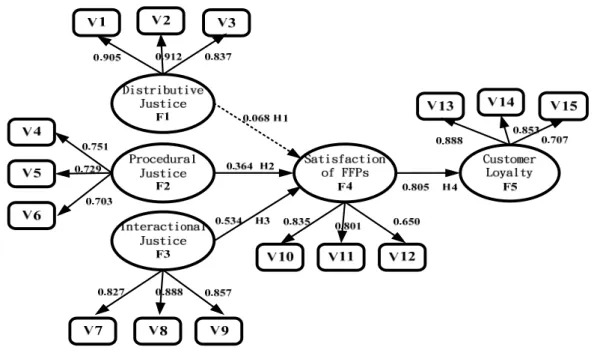
4.3 Path Analysis
The next portion involved path analysis of the research model. The value of Chi-square for the model came to 104.550. The ratio of Chi-square/df was 3.076 (258.423/84) and smaller than 5. Besides, CFI = 0.957, GFI = 0.925, AGFI = 0.893, NFI = 0.937 and NNFI = 0.957. In addition to the value of AGFI was approaching 0.9, others have exceeded 0.9. Results for RMR = 0.031 within the accepted range. This proves that the results of fitness obtained from this structural model turned were ideal and met the required standards.
The number of path coefficients amongst the latent variables is shown in Table 3 and displayed in Figure 2. Overall speaking, the positive and negative signs for all path coefficients have been