行政院國家科學委員會專題研究計畫 成果報告
總計畫
計畫類別: 整合型計畫
計畫編號: NSC92-2214-E-002-023-
執行期間: 92 年 08 月 01 日至 93 年 07 月 31 日
執行單位: 國立臺灣大學化學工程學系暨研究所
計畫主持人: 李篤中
報告類型: 精簡報告
處理方式: 本計畫可公開查詢
中 華 民 國 93 年 11 月 10 日
行政院國家科學委員會補助專題研究計畫成果報告
※ ※ ※ ※ ※ ※ ※ ※ ※ ※ ※ ※ ※ ※ ※ ※ ※ ※ ※ ※ ※ ※
※
※
※
精密固液分離在高科技產業之應用-總計畫
※
※
※
※※※※※※※※※※※※※※※※※※※※※※※※※
計畫類別:□個別型計畫
整合型計畫(重點研究群計劃)
計畫編號:NSC92-2214-E-002-023-
執行期間:92 年 8 月 1 日至 93 年 7 月 31 日
計畫主持人: 李篤中
教授
共同主持人: 黃國楨
教授
王大銘
教授
鄭東文
教授
莊清榮
副教授
童國倫
副教授
本成果報告包括以下應繳交之附件:
□赴國外出差或研習心得報告一份
□赴大陸地區出差或研習心得報告一份
□出席國際學術會議心得報告及發表之論文各一份
□國際合作研究計畫國外研究報告書一份
執行單位:國立臺灣大學 化學工程學系
中
華
民
國 93 年 10 月 31 日
行政院國家科學委員會專題研究計畫成果報告
精密固液分離在高科技產業之應用-總計畫
Application of Fine Solid-Liquid Separation on the High-Tech Industries
計畫編號
:NSC
92-2214-E-002-023-執行期限
:92 年 8 月 1 日至 93 年 7 月 31 日
執行單位
:國立臺灣大學 化學工程學系
計劃主持人:李篤中 教授
固液分離技術不僅在過去居化學工程的中心課題,更將是本世紀尖端科技的主流與
關鍵技術。近年來,隨著生物及奈米產業等尖端科技之快速發展,精密固液分離技術的
重要性亦日益突顯。由於在精密製程上對產品純度之要求大為提昇,而分離製程上所產
生之次微米級粒子,或分割分子量不同之奈米級粒子之產品,超純液(水)的製備及如何
由懸濁液中分離難濾性膠羽污泥等,都是固液分離所面臨的新課題。所以本整合群之研
究對象涵蓋含高壓密性膠羽或軟性微粒子,非水項或高黏性膠液及次微米、奈米級粒子
與蛋白質等所構成之懸濁液,其濾阻常在 10
14~10
16m/kg 以上,而壓密次數也大於 0.8,
當此濾餅承受壓縮壓力時不僅發生變形,甚至脫液而減積,所以非傳統的過濾或壓榨理
論可來解釋,也因此其分離費用常因不諳真相而倍增困擾。要對其基本機構進行瞭解需
由微觀著手建構膠羽與濾餅結構與過濾性之間的關連性,方可對整體固液分離程序進行
最適化。
本整合群過去數年已深入探討膠羽結構與各種前處理之間的關係,包括:可變形軟
粒子之過濾、難濾性泥漿之固液分離及膜的構造對分離微米與次微米級之基礎,在本三
年計畫中則進一步應用這些成果至高科技產業之精密固液分離之操作設計上。此三年計
畫之第二年中,所完成的研究成果依各子題分列主要研究成果如下:
(I)
污泥膠羽結構對精密分離處置程序之影響
1.
子計劃一主要在探討污泥膠羽結構對精密分離處置程序之影響,第二年研究中採 取病理分析中常用的石蠟固定切片觀察污泥膠羽之截面影像,取得二維結構資 訊,並使用共軛焦掃描顯微鏡配合核糖核酸螢光探針,建構污泥膠羽之三維模型 與分析其表面特性。2.
本子計畫中並比較由石蠟固定切片二維觀察與共軛焦掃描顯微鏡配合核糖核酸 螢光探針三維觀察等兩種技術所得到的結構資訊,同時亦探討在經過物理與化學 調理後污泥膠羽結構之變化。
(II) 精密製程中微過濾與高速離心分離機構之研究
1. 子計畫二旨在探討酵母菌/蛋白質雙成分懸浮液之掃流微過濾與離心分離
的機構。
2. 研究結果發現在掃流微過濾中,掃流速度增加會抑制濾餅的成長、降低濾
餅阻力,所以穩定濾速會提升。而增加過濾壓差,雖然增加了過濾的驅動
力,卻也造成濾餅的厚度增加,造成過濾阻力的增加。而牛血清蛋白之阻
擋率取決於此蛋白質在濾膜表面之沉積機率,以及濾餅的厚度。
3. 在離心過濾中,離心轉速愈高則濾餅成長愈快、結構愈緊密,故比阻愈高,
蛋白質之阻擋率愈低;但是由於其平均驅動力較高,故濾速仍然較高。
4. 本子計畫並建立了適用於酵母菌/蛋白質雙成分懸浮液之過濾理論模式,並
提供裝置選擇或程序最適化之參考。。
(III) 滲透蒸餾在生化產品濃縮上之應用-膜材製備、分離應用、及輸送現象之探討
1. 子計畫三以中分子量 TPX 與一號濾紙(基材)製備出 TPX 微孔複合膜,
成功地提升機械強度,進一步將所製備的 TPX 微孔複合膜應用在滲透蒸
餾分離程序上,
2. 實驗結果顯示:應用於滲透蒸餾程序,TPX 微孔複合膜與商業化 PTFE 膜
的通量相差不大。將滲透蒸餾與恆壓過濾實驗比較,評估在濃縮蛋白質、
peptide 及醣類的效能。結果對於三種進料,滲透蒸餾程序擁有較高的分
離效果,而且滲透蒸餾沒有結垢現象(fouling),因此通量可以維持穩定,
適合長期操作。
(IV) 利用脈衝電場促進掃流微過濾之研究
1. 本子計畫四重點在於電場微過濾特性之研究,由實驗探討電場強度及其脈
衝作用對含生物粒子之懸浮液微的掃流過過濾之影響,同時也建立濾餅層
與濾膜兩者串聯的電滲透方程式,
2. 另一方面也比較脈衝與連續兩不同電場施加方式之膜結垢及蛋白質穿透
率等的差異。整體而言,已達到計畫預期目標,這結果對電場微過濾特性
之了解及其於生物粒子懸浮液分離的應用等提供參考依據。
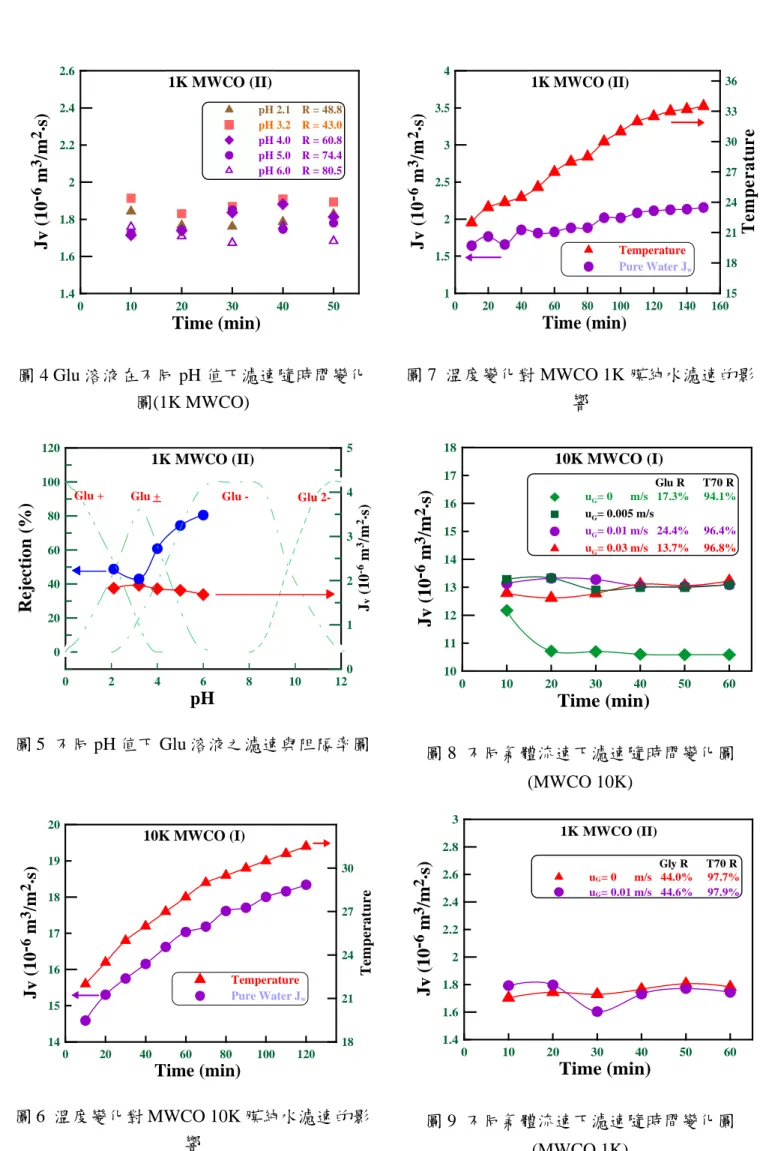
(V) 薄膜過濾應用於奈米分子溶液分離操作之探討
1. 本子計畫五探討 UF/NF 掃流系統在巨分子溶液中分離胺基酸之最佳操作
條件,在不同的操作變數下,包括有 pH 值、溫度、氣體流速等,研究溶
液濾速與溶質阻隔率的變化,
2. 實驗結果顯示在超過濾系統(MWCO 10KDa)中,胺基酸與 Dextran T70 混
合水溶液之濾速隨通氣量及操作溫度的增高而增加,但通氣量對濾速之提
升會趨於極限值;在此系統中因薄膜孔洞較大,pH 值對胺基酸的阻隔率影
響較小,溶質的阻隔率主要由篩選效應控制,
3. 在奈米過濾系統(MWCO 1K Da)中,胺基酸與β-Cyclodextrin 混合水溶液
之濾速隨通氣量及操作溫度的增高亦有增加,但較不明顯;因薄膜孔洞較
小電荷效應的影響顯得重要,所以 pH 值的改變對溶質阻隔率有明顯的影
響。。
(VI) 含深次微米/奈米微粒之液體澄清化機制之探討
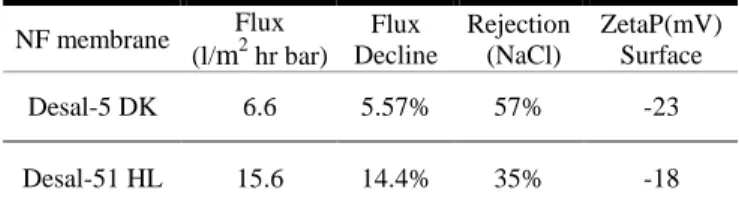
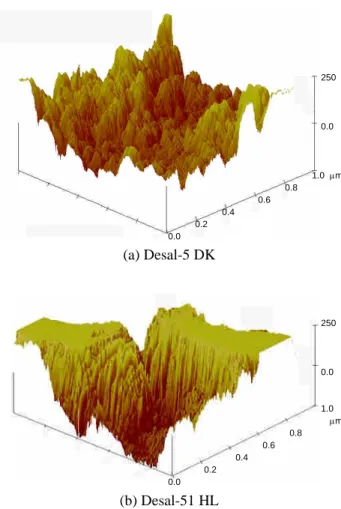
1. 本子計畫六之目的在探討不同奈濾(NF)膜之表面特性對深次微米/奈米級
粒子澄清過濾效能之影響,主要以實驗研究為主,分析奈濾膜之表面孔洞
大小、界達電位、膜面粗糙度及表面化學特性對離子溶液及 100(nm)奈米
尺寸之 SiO
2粒子懸浮液的奈米過濾膜結垢行為之影響,
2. 研究結果發現,對離子溶液之奈米過濾系統,膜結垢機制受膜面界達電位
之影響大於膜面粗糙度;對含深次微米/奈米級粒子懸浮液之奈米過濾系
統,膜結垢機制受膜面粗糙度影響遠大於膜面及溶液之物化特性。
本研究計畫凝聚了國內固液分離之研究人力,由以上各子題之研究成果之整合,在此一
1. 建立膠羽內部結構之基本函數,並了解其與固液分離操作之間的關係。
2. 了解膠羽結構對輸送特性及反應速率的影響。
3. 了解生物微胞之微過濾與離心分離機構。
4. 了解含次微米級粒子聚集機制與其結構。
5. 了解分散相之流變行為對過濾性能之影響。
6. 了解 TPX 微孔膜的成膜機制及孔洞控制技術、TPX 微孔膜在生化產品濃縮
及酒精去除上的應用,以及研究其中的輸送現象及分離機制。
7. 了解以電場掃流微過濾分離含巨分子之膠體懸浮液之機制及其於促進生化
產品類膜過濾分離的應用。
8. 了解奈米級分子溶液之濃縮與純化機構、探討薄膜特性及操作條件對奈米
級分子分離效率的影響,衍導適當之操作模式。
所完成之數項研究成果已分別於 2003 年 The Second Taiwan-Japan Joint Symposium on
Membrane Technology in Environmental Management、2003 年輸送現象研討會及 2003 年
中國化學工程學會暨國科會化學工程學門成果發表會中專題發表(見附件一,第 4、5
頁),並另發表於國內外各期刊。
本研究群與國際上同領域之交流方面,2003 年 4 月日本名古屋大學精密分離講座
之 Professor E. Iritani 邀請本研究群成員中原大學化工系童國倫教授共同執行日本卓越
計劃(COE)獲通過,計劃名稱為「Development of Selective Separation Process of Valuable
Biomaterials by Porous Membrane」,於今年 7 月開始執行共計兩年。第九屆世界過濾會
議於 2004 年在美國舉辦,本研究群主持人呂維明教授、李篤中教授及黃國楨教授應邀
為第九屆世界過濾會議之籌備委員。2003 年 11 月亦假舉辦輸送現象研討會之便, 邀請
Separation Science & Technology 主編 Professor S. M. Cramer 來台,除專題演講外,更於
會後隔日於台灣大學舉行固液分離座談會,除與本研究群各成員廣泛交換意見外,並討
論未來合作事宜。
各子提之成果報告分別列述如後:
子 計 劃 主 持 人
計
劃
名
稱
頁
碼
子計畫一 李篤中 台大化工 污泥膠羽結構對精密分離處置程序之影響
第 6 頁
子計畫二 黃國楨 淡江化工 精密製程中微過濾與高速離心分離機構之研究 第 10 頁
子計畫三 王大銘 台大化工
滲透蒸餾在生化產品濃縮上之應用---膜材製備、分離應用、及輸送現象之探討
第 14 頁
子計畫四 莊清榮 中原化工 利用脈衝電場促進掃流微過濾之研究
第 18 頁
子計畫五 鄭東文 淡江化工 薄膜過濾應用於奈米分子溶液分離操作之探討 第 22 頁
子計畫六 童國倫 中原化工 含深次微米/奈米微粒之液體澄清化機制之探討 第 26 頁
附件一、2003 年「固液分離研究群」年度研究成果發表
2003 The Second Taiwan-Japan Joint Symposium on Membrane Technology in
Environmental Management
(2003/11/07 –2003/11/11)
Jia-Shyan Shiau and Da-Ming Wang (2003) “Combined poreblocking and cakeCombined pore
blocking and cake filtration models for protein filtration models for protein microfiltration,”Proc. of
the Second Taiwan-Japan Joint Symposium on Membrane Technology in Environmental Management,
7-11, Nov.
Kuo-Jen Hwang and Yun-Sheng Wan (2003) “Mechanism ofCross-Flow FlowMicrofiltration of Soft Colloids,”Proc. of the Second Taiwan-Japan Joint Symposium on Membrane Technology in
Environmental Management, 7-11, Nov.
Ching-Jung Chuang and Guan-Ting Chen (2003) “Crossflow Electro-Microfiltration for Microbial
Cell Suspensions,”Proc. of the Second Taiwan-Japan Joint Symposium on Membrane Technology in
Environmental Management, 7-11, Nov.
Kuo-Lun Tung, Yu-Ling Li and Juin-Yih Lai (2003) “CFD Analysison Fluid Flow
throughSpiral-wound Membrane Module,”Proc. of the Second Taiwan-Japan Joint Symposium on
Membrane Technology in Environmental Management, 7-11, Nov.
T. W. Cheng and S. Y. Pan (2003) “A Study on the Critical Flux of Submerged Membrane
Filtration,”Proc. of the Second Taiwan-Japan Joint Symposium on Membrane Technology in
Environmental Management, 7-11, Nov.
2003 Symposium on Transport Phenomena and Applications
(2003/11/07)
K.J. Hwang and Y.S. Wang (2003) “Mechanism of Cross-flow Microfiltration of Soft Colloids,”Proc.
of 2003 Symposium on Transport Phenomena and Applications, Taipei, Taiwan, 7th Nov.
C.J. Chuang and Y.C. Chiang (2003) “MeasurementsofMembrane Surface Charge and Analysis of the Electrokinetic Behavior in Membrane Filtration,”Proc. of 2003 Symposium on Transport
Phenomena and Applications, Taipei, Taiwan, 7th Nov., MA-001
K.L. Tung, J.Y. Lai, C.H. Chang and Y.L. Chang (2003) “Study on the Mechanism of Deep Bed
Filtration for Submicron Particle Suspension,”Proc. of 2003 Symposium on Transport Phenomena
and Applications, Taipei, Taiwan, 7th Nov., SL-003
T.W. Cheng and T.L. Chiu (2003) “SeparationsofAmino Acid and Peptidefrom Macromoleculesby Nanofiltration,”Proc. of 2003 Symposium on Transport Phenomena and Applications, Taipei, Taiwan,
7th Nov., SL-005
T.W. Cheng, K.S. Lin and W.C. Lin (2003) “Estimation of Pore Size in Nanofiltration Membrane”
Proc. of 2003 Symposium on Transport Phenomena and Applications, Taipei, Taiwan, 7th Nov.,
SL-006
T.W. Cheng and S.Y. Pan (2003) “A Study on theCriticalFlux ofSubmerged MembraneFiltration System,”Proc. of 2003 Symposium on Transport Phenomena and Applications, Taipei, Taiwan, 7th
Nov., SL-007
K.J. Hwang and W.T. Wang (2003) “Cross-Flow Microfiltration of micron particles suspended in
polymeric solution,”Proc. of 2003 Symposium on Transport Phenomena and Applications, Taipei,
Taiwan, 7th Nov., SL-008
K.J. Hwang and Y.C. Chou (2003) “Purification of Proteins from Fermation Broth by Centrifugal
Filtratuion,”Proc. of 2003 Symposium on Transport Phenomena and Applications, Taipei, Taiwan,
7th Nov., SL-009
K.J. Hwang and L.W. Lin (2003) “Purification of Proteins from Fermation Broth by Crossflow
T.W. Cheng, Y.W. Lin and Z.W. Li (2003) “A Study on the Critical Flux of Gas-Liquid Two-Phase Flow Membrane Filtration System,”Proc. of 2003 Symposium on Transport Phenomena and
Applications, Taipei, Taiwan, 7th Nov., SL-011
中國化學工程學會暨國科會化學工程學門成果發表會 (2003/11/22)
張閔然、丁健弘、李篤中 (2003) “精密固液分離在高科技產業之應用”2003 年中國化學工程學
會暨國科會化學工程學門成果發表會, Taipei, Taiwan, 22nd Nov, 4-01.
蘇信團、蔡名瑋、李篤中 (2003) “天然有機物對鋁鹽污泥膠羽特性及其對污泥毯澄清池穩定性
之影響”2003 年中國化學工程學會暨國科會化學工程學門成果發表會, Taipei, Taiwan, 22nd Nov.,
4-02.
童國倫、賴正原、張景翔、張雅鈴 (2003) “含次微米級粒子懸浮液澄清過濾機制之研究”2003
年中國化學工程學會暨國科會化學工程學門成果發表會, Taipei, Taiwan, 22nd Nov., 4-15.
鄭東文、邱東林 (2003) “薄膜過濾應用於奈米分子溶液分離操作之探討” 2003 年中國化學工程
學會暨國科會化學工程學門成果發表會, Taipei, Taiwan, 22nd Nov., 4-18.
黃國楨、林立偉、周揚震 (2003) “精密製程中微過濾與高速離心分離機構之研究”2003 年中國
化學工程學會暨國科會化學工程學門成果發表會, Taipei, Taiwan, 22nd Nov., 4-24.
蘇酉申、李雍信、張珍永、王大銘 (2003) “TPX 疏水性多孔膜之製備及其在滲透蒸餾程序上之
應用”2003 年中國化學工程學會暨國科會化學工程學門成果發表會, Taipei, Taiwan, 22nd Nov.,
行政院國家科學委員會專題研究計畫成果報告
精密固液分離在高科技產業之應用
子計劃一
污泥膠羽對精密分離處置之影響 (2/3)
計畫編號:
NSC 92-2214-E-002-019
執行期限:
92 年 8 月 1 日至 93 年 7 月 31 日
主持人:李篤中
教授
計畫參與人員:
執行機構及單位名稱:國立台灣大學化學工程學系
I. 中文摘要
本計畫擬以三年時間,藉由數種表面分析與分子 生物學的方法,對污泥膠羽顆粒的內部結構作更進一 步的探討與解析,以了解及其對後續消化與固液分離 兩種操作間之關係。在第二年的報告中,我們採取病 理分析中常用的石蠟固定切片觀察污泥膠羽之截面影 像,取得二維結構資訊,並使用共軛焦掃描顯微鏡配 合核糖核酸螢光探針,建構污泥膠羽之三維模型與分 析其表面特性。在本報告中將比較由兩種技術所得到 的結構資訊,同時亦探討在經過物理與化學調理後污 泥膠羽結構之變化 關鍵詞:結構、膠羽、調理、石蠟切片、共軛焦雷射掃描 顯微鏡、核糖核酸螢光探針、三維模型 AbstractThis report summarized the experimental results of the second year in the three-year-project investigating the internal structure of sludge floc by surface analysis tools and molecular biological techniques. The target is to construct the correlation between the floc structure and the subsequent treatment of sludge. To continue the results of the first-year project, we used the paraffin-embedded slicing to obtain the two-dimensional structure from the sliced image of flocs. Confocal laser scanning microscopy tests with fluorescence in situ hybridization of 16S rRNA probes were performed to establish the 3D models of the floc. The variation in surface ruggedness and internal structure of sludge flocs in prior and after conditioning were examined in this report.
Keywords: Structure, flocs, conditioning, slicing, confocal
laser scanning microscopy, 16S rRNA probes
II. Introduction (計劃緣由與目的)
Sludge conditioning is required to alter the properties of the floc to improve its dewaterability (Moudgil and Shah, 1986). Cationic polyelectrolyte
flocculation and freezing/thawing have been widely investigated. Polyelectrolyte flocculation enhances the dewaterability of sludge by charge neutralization and polymer bridging, leading to the increase in floc size and decrease in the bound water content (Chu and Lee, 1999). On the other hands, freezing/thawing converts the loose floc structure into a compact form by interfacial dehydration of moving ice fronts. This conversion could lead to considerable improvement on the sludge dewaterability (Chu et al., 1997), reduced the pathogen activity (Chu et al., 1999), and separate the oily components from the solids phase of oily sludge (Jean et
al., 1999). However, the detailed information on the
change in floc structure after conditioning, however, is still largely lacking. This report considers the effects of cationic polyelectrolyte flocculation and freezing/thawing on the characteristics sludge flocs. Free settling tests, small-angle light scattering tests, microtome slicing, confocal laser scanning microscopy were performed to determine the geometric parameters. The fractal dimensions determined from different tests were compared to reveal possible correlations among these parameters.
III. Experimental (實驗方法)
Samples and conditioning
Waste activated sludge was sampled from the wastewater treatment plant of Neili Bread Plant, Presidential Enterprise Co., Taoyuan, Taiwan on July, 2000. A particle sizer (LS230, Coulter, USA) estimated the volume average floc diameters as 73.6 µm. The experimental details of cationic flocculation and freezing/thawing can be found elsewhere and are neglected here for brevity (Chu and Lee, 1999; Chu et al., 1997).
Microscopic techniques
The experimental details of confocal laser scanning microscope (CLSM), fluorescence in situ hybridization, and microtome slicing are available in the report of first-year project and are ignored in this section. Details of free settling tests, small angle light scattering (SALS) tests, and the fractal dimensions determined from the two tests are also reported in Wu et al. (2002).
Image processing
Sliced images in RGB (red-green-blue) mode are first converted to grayscale images to construct a histogram of pixels versus luminescence intensity by
INSPECTOR (Matrox, Canada). Our evaluation shows
that Otsu’s method (Otsu, 1979) yields more stable performance than other histogram-based algorithms and
is chosen to obtain the porosity. The MAX(ΣpC,p) method,
where pC,p represents the convex perimeter of the pores,
however, can probe the shapes and spatial distribution of the pores among the biomass granules
Establishing 3D models from CLSM images
Figures 1 display a typical series of CLSM images. Using the Otsu’s method, thresholding values of sliced images were determined. Figure 2 shows the corresponding bilevel images of Figs. 1. Noise was removed from the images before bilevel thresholding was performed. The 3D visualization and modeling software,
Amira 3.0 (TGS Inc., USA), was used to reconstruct the
thresholded sliced images as isosurfaces (polygonal surface models). The following procedure is employed (TGS, 2002).
Fig. 1 Example CLSM images in series
Fig. 2 Bilevel images of Figs. 2 (by Otsu’s method) (1) The first step is to reduce the resolution of the image
and adjust the physical shape of the voxel to almost a cube. The sliced image resolution was reduced from 512*512 to 128*128 so the ratio X : Y : Z of the voxel was about 1 : 1 : 1. The Lanczos filter is used in the resampling.
(2) The second step is to detect the edges in the bilevel images. Boundaries in the binary images are classified according to connectivity and whether they lie within the object or its complement. The connectivity of neighboring pixels in all analyses is set to four for edge detection. The edges in the images are white lines in Figure 3.
Fig. 3 Edges on the bilevel images of Figs. 2
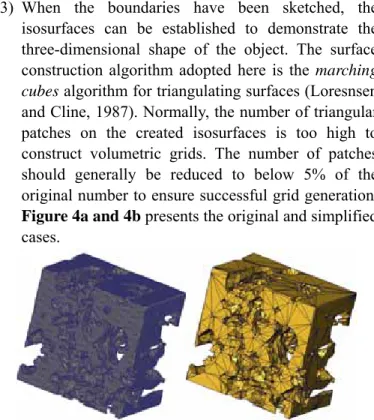
(3) When the boundaries have been sketched, the isosurfaces can be established to demonstrate the three-dimensional shape of the object. The surface construction algorithm adopted here is the marching
cubes algorithm for triangulating surfaces (Loresnsen
and Cline, 1987). Normally, the number of triangular patches on the created isosurfaces is too high to construct volumetric grids. The number of patches should generally be reduced to below 5% of the original number to ensure successful grid generation. Figure 4a and 4b presents the original and simplified cases.
Fig. 4 Polygonal surface model of pores: (a) before simplification (310,534 triangular patches); (b) after
simplification (9,000 triangular patches)
IV. Results and Discussion (結果與討論)
The phase contrast microphotographs of original and conditioned sludge flocs can be found elsewhere and are not shown here for brevity (Chen et al., 2001; Chu et
al., 2001). For original sludge flocs, filamentous bacteria
surrounded a highly porous structure consisting of several microbial aggregates. Polyelectrolyte flocculation significantly increased floc sizes by polymer bridging. Frozen/thawed sludge flocs were also larger and more compact.
The results of SALS tests indicate that floc size increased substantially after flocculation and
freezing/thawing. The scattering fractal dimension DS of
(1.95) decreased. The flocculated sludge had a lower
settling fractal dimension DF (1.30) than the original
sludge (1.47), while the frozen/thawed sludge had a higher value (1.55).
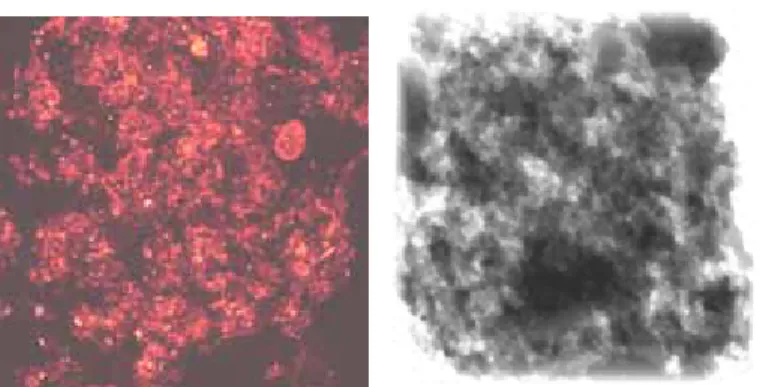
Figures 5 to 7 present several examples of typical microtome slices. For original sludge flocs (Fig. 5), the microphotograph displayed a cluster of sludges that consist of many flocs with open structures. Pores distributed among the biomass granules were of sizes 20~40 µm. Cationically flocculated sludge flocs had some large pores are larger than 50 µm. Some compact regions were also observed (Fig. 6). Frozen/thawed sludge flocs displayed very compact morphology in both microphotographs (Fig. 7). The rugged and irregular boundaries of original sludge flocs had become spherical or rectangular pellets after gross migration. The results of geometric parameters are summarized in Table 1.
Fig. 5 Sliced images of original sludge: (a) 100X; (b) 400X.
Fig. 6 Sliced images of cationcally flocculated sludge: (a) 100X; (b) 400X.
Fig. 7 Sliced images of frozen/thawed sludge: (a) 100X; (b) 400X.
Several typical cases of original, cationically flocculated, and frozen/thawed flocs were considered.
Figures 8 to 10 display CLSM sliced image and
three-dimensional views of the biomass portion of the nine selected flocs. The results of geometric parameters are summarized in Table 1. Unlike the surface model of reported by Zartarian et al. (1997), which only considered external contours, Figs. 8b to 10b exhibit the complex
porous configurations of the flocs. Measuring the volume and surface area of the biomass portion can yield other indices such as the fractal dimensionas. Blob analysis of the CLSM images (512 pixels * 512 pixels) using the
MAX(ΣpC,p) method also yields the relationship between
the area and the perimeters of the biomass granules and
the fractal dimension DB of the boundary. On average, the
cationically flocculated sludge flocs had a higher DB
(1.32 ~ 1.36) than the original and frozen/thawed flocs. Changing the resolution (voxel size) yields different results for the surface area of the sludge flocs, and thus this relationship can help obtain the box-counting fractal
dimension DP,3. The original sludge flocs had DP,3 of
about 2.57. Similar to the results for DB(L), cationic
flocculated sludge flocs with more irregular surfaces had
the highest DP,3 (2.62 ~ 2.70), and frozen/thawed sludge
flocs had lower DP (2.45~2.50) than the original flocs. DB
and DP,3 reflect similar morphological information.
Fig. 8 Original floc: (a) one typical CLSM sliced image; (b) three-dimensional view of floc biomass
Fig. 9 Flocculated floc: (a) one typical CLSM sliced image; (b) three-dimensional view of floc biomass.
Fig. 10 Frozen/thawed floc: (a) one typical CLSM sliced image; (b) three-dimensional view of floc biomass.
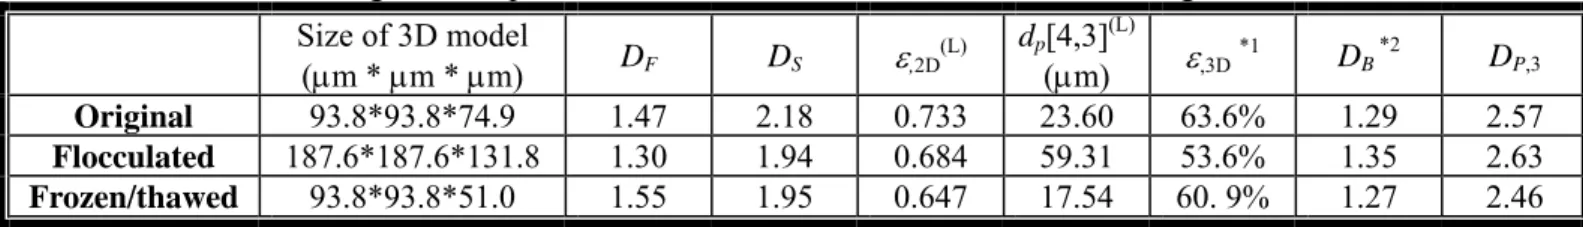
Table 1 The geometric parameters determined from microtome-sliced images and 3D models. Size of 3D model (µm * µm * µm) DF DS ε,2D(L) dp[4,3](L) (µm) ε,3D*1 DB *2 DP,3 Original 93.8*93.8*74.9 1.47 2.18 0.733 23.60 63.6% 1.29 2.57 Flocculated 187.6*187.6*131.8 1.30 1.94 0.684 59.31 53.6% 1.35 2.63 Frozen/thawed 93.8*93.8*51.0 1.55 1.95 0.647 17.54 60. 9% 1.27 2.46
*1 The porosity indicated the volumetric percentage of the empty portion in the cuboids.
*2 The area and perimeter were obtained from the image of resolution 512 pixels * 512 pixels.
Possible relationships among DF, DS and these
parameters, determined by microtome slicing, are
considered. Flocs of higher DF, such as frozen/thawed
samples, have a lower DP,3 and DB. However, a simple
correlation between porosity and DF and is hard to derive.
ε,2D(L) does not singly govern the variation of DF. A floc
with larger pores and lower porosity exhibits lower DF
than another whose size is of the same order of magnitude but with smaller pores and higher porosity. This finding is pertinent to comparisons between the flocculated sludge and frozen/thawed sludge. This result may suggest that free settling behavior might be determined by both the floc size and internal porous configuration, rather than porosity alone.
Notably, DS was neither correlated with the porosity,
nor related to DP,3 and DB. Although the flocculated and
frozen/thawed sludge flocs had lower porosity than the
original floc, the obtained values of DS obtained were still
significantly lower than that of the original floc. The evidence presented herein could not comprehensively
determine the relationship between DS and other
geometric parameters. It implies that the scattering characteristics of these aggregates might not be singly determined by surface morphology.
V. Conclusions (結論)
Based on the proposed image-processing algorithms, a series of sliced images were used to analyze the porous configuration of sludge flocs and reveal the effects of cationic polyelectrolyte flocculation and freezing/thawing. The three-dimensional models of flocs were established using the CLSM series images. Cationic flocculation links the original sludge flocs into a large networked structure with highly non-uniform mass distribution. Both compact biomass granules and large pores are observed. Freezing/thawing markedly compresses the flocs and the porous configuration largely collapses. For flocs with sizes of a particular order of magnitude, the free settling
fractal dimension (DF) correlates with the porosity and
pore size of the entire floc matrix. Moreover, flocs of
higher DF, such as frozen/thawed samples, have a lower
DP,3 and DB. The scattering fractal dimension (DS),
however, exhibits no simple relationship with any geometric parameter of the scattering aggregates.
VI. Reference (參考文獻)
Chen, L. C., Chian, C. Y., Yen, P. S., Chu, C. P. and Lee, D. J. (2001) High-speed freezing of sludge. Wat. Res., 35(14), 3502-3507.
Chu, C. P., Lee, D. J., Chang, B. V. and Liao, C. S. (2001) Effect of polyacrylamide on microbial density levels in waste activated sludge. J. Chem. Tech. Biotechnol, 76(6), 598-602.
Chu, C. P. and Lee, D. J. (1999) Moisture distributions in sludges: effects of cationic polymer conditioning. J.
Environ. Eng. ASCE, 125(4), 340-345.
Chu, C. P., Feng, W. H., Tsai, Y. H. and Lee, D. J. (1997) Uni-directional freezing of waste activated sludge: The presence of sodium chloride. Environ. Sci. Tech., 31(5), 1512-1517.
Jean, D. S., D. J. Lee, and J. C. S. Wu, (1999) Separation of oil from oily sludge by freezing and thawing. Wat. Res.,
33(7), 1756-1759.
Lorensen, W. E. and Cline, H. E. (1987) Marching cubes: a high resolution 3D surface construction algorithm.
Comput. Graph., 21(4), 163-169.
Moudgil, B. M. and Shah, B. D. (1986) Selection of flocculants for solid-liquid separation processes, in Advances in Solid-Liquid Separation. Ed. by H. S. Muralidhara, Battelle Press, Columbus, Ohio, USA.
Otsu, N. (1979) A threshold selection method from gray-level histogram. IEEE Trans. Syst. Man Cybern., 9(1), 62-66. TGS (2002) Amira® 3.0 User’s Guide and Reference Manual.
TGS Template Graphics Software, Inc., USA.
Wu, R. M., Lee, D. J., Waite, T. D. and Guan, J. (2002) Multilevel structure of sludge flocs. J. Colloid Interf. Sci.,
252(2), 383-392.
Zartarian, F., Mustin, C., Villemin, G., Ait-Ettager, T., Thill, A., Bottero, J. Y., Mallet, J. L. and Snidaro, D. (1997) Three-dimensional modeling of an activated sludge floc. Langmuir, 13(1), 35-40.
行政院國家科學委員會專題研究計畫成果報告
精密製程中微過濾與高速離心分離機構之研究( 1 / 2 )
Studies on the Mechanisms of Microfiltration and Centrifugal Separation in Fine
Chemical Processes (1/2)
計劃編號 : NSC 92-2214-E-032-002
執行期限 : 92 年 8 月 1 日至 93 年 7 月 31 日
主持人 : 黃國楨 教授
執行機構 : 淡江大學 化學工程與材料工程學系
一、中文摘要:
本研究旨在探討酵母菌/蛋白質雙成
分懸浮液之掃流微過濾與離心分離的機
構。在分離的過程中,懸浮液中的酵母菌
會被薄膜阻擋,而部分蛋白質則可通過,
以達到分離與純化的效果。在掃流微過濾
中,掃流速度增加會抑制濾餅的成長、降
低濾餅阻力,所以穩定濾速會提升。而增
加過濾壓差,雖然增加了過濾的驅動力,
卻也造成濾餅的厚度增加,造成過濾阻力
的增加。而牛血清蛋白之阻擋率取決於此
蛋白質在濾膜表面之沉積機率,以及濾餅
的厚度。此外,在離心過濾中,離心轉速
愈高則濾餅成長愈快、結構愈緊密,故比
阻愈高,蛋白質之阻擋率愈低;但是由於
其平均驅動力較高,故濾速仍然較高。最
後,並配合理論與模式分析,以期了解不
同操作條件下可達到之濾速與蛋白質之阻
擋率。
關鍵詞:微過濾、離心分離、阻擋率、分離技術ABSTRACT
The
mechanisms
of
cross-flow
microfiltration and centrifugal filtration of
yeast/protein binary suspensions are studied.
In cross-flow microfiltration, the filtration
rates increase with increasing the cross-flow
velocity and the filtration pressure. The
protein rejection is determined by the protein
depositing probability on the cake surface
and the cake thickness. On the other hand, in
the centrifugal filtration, a higher centrifugal
speed results in a more compact and higher
resistance cake. A theoretical model is
derived in this study. The pseudo-steady
filtration rate and protein rejection can be
predicted using the proposed model.
Keywords: cross-flow microfiltration, centrifugal
separation, protein rejection, separation technology
二、緣由與目的
在精密製程中,所遭遇的生物微胞或
微細粒子經常是可變形或高彈性的膠體或
巨分子等難過濾的物質。這些物質在過濾
的過程中,即使僅形成甚薄的濾餅層,亦
會導致嚴重的濾速衰減。故若分離裝置或
操作條件的選擇不正確,極容易導致效率
不彰、浪費能源、增加生產成本。一般生
物發酵槽產品的初步分離方法不外乎微過
濾或高速離心,但是其過濾機構的研究迄
今仍不完整,兩者之優劣與適用時機仍不
明確。所以本研究擬針對含生物微胞與蛋
白質之雙成份懸浮液進行其微過濾與離心
分離機構解析,以建立其適用之過濾理論
模式,並提供裝置選擇或程序最適化之參
考。
三、研究方法
生化發酵槽的產品中,通常同時含有
培養菌、蛋白質、酵素及其他雜質等。如
何將這些物質做有效的分離與純化,便成
為現今生化科技一個重要的研究方向。本
研究以酵母菌加上牛血清蛋白配製成雙成
分的懸浮液,分別以掃流微過濾及高速離
心過濾來探討其分離特性。
1. 實驗物料
本研究所用之物料分別為酵母菌,其
密 度 為 1140 kg/m
3; 以 及 牛 血 清 蛋 白
(BSA),其分子量為 67,000。濾膜則使用材
質為 Mixed cellulose ester,平均孔徑為
0.1m 之薄膜。
2.實驗裝置
本研究使用兩平行板式之掃流過濾裝
置,總過濾面積為 1.1x10
-3m
2。而所採用之
懸 臂 式 批 式 離 心 機 之 最 高 轉 速 為 4000
rpm , 過 濾 所 用 的 濾 室 過 濾 面 積 為 9.67
cm
2。實驗中,調整適當的操作條件,記錄
不 同 時 間 時 所 產 生 的 濾 液 量 。 再 以
UV/Visible Spectrometer 量測濾液中 BSA
的濃度。再秤取實驗後的濾餅重量。
3.理論模式
擬穩態濾速與濾餅厚度的關係
依粒子在濾膜表面的力平衡模式,可
推導穩定濾速, qs,與剪應力,
w,的關係式: f w p s f d C q 1 (1)
或與濾餅厚度, Lc,的關係:
2 2 c so s L H H u C q (2)
其中為H為濾室上下兩平板間的距離。
蛋白質之阻擋率
當濾餅可被視為深床過濾器,則蛋白
質的濃度可經由標準捕獲方程式而獲得。
故蛋白質之阻擋率可以下式估計:
c m
b i rej L L C C R 1 exp (3)
其中Ci為到達濾餅表面的蛋白質濃度,Lm
為濾膜之相當厚度,
γ
為一篩析係數。若引
入蛋白質在濾餅表面的沉積機率,
,則
1 1 i p rej C C C R(4)
再配合穩定濾速的分析,可得:
c m
rej rej s L L R R k q 1 1 exp ln(5)
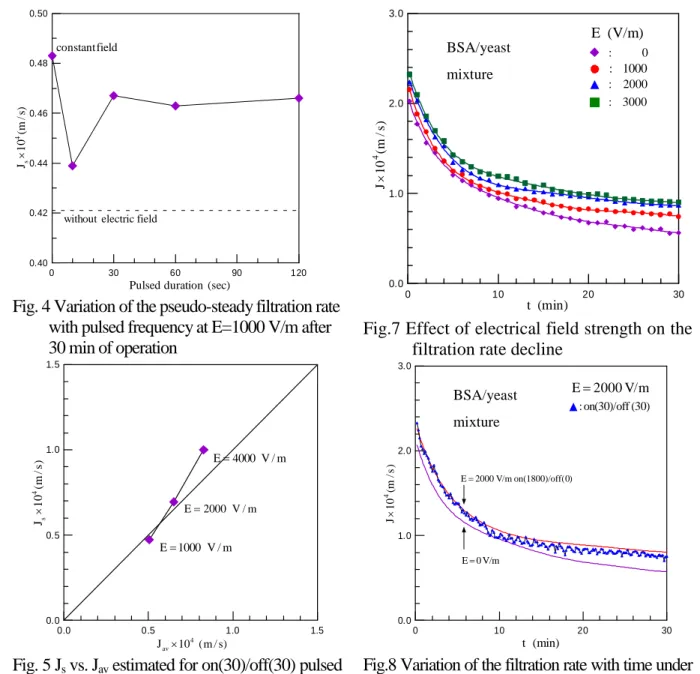
四、結果與討論
圖 1 為掃流過濾中純 BSA、純 yeast、
及 yeast/BSA 雙成分懸浮液的穩定濾速比
較圖。隨著掃流速度的增加,純 BSA、純
yeast、及 yeast/BSA 雙成分懸浮液的穩定
濾速皆有上升的趨勢。純 BSA 的穩定濾速
在三者中為最高,而 yeast/BSA 雙成分懸
浮液則最低。所以在雙成分懸浮液,除了
原本的濾餅阻力會影響穩定濾速外,可以
預期會有另一濃度極化層亦形成阻力。
圖 2 顯示各種來源之過濾阻力與掃流
速度之關係。隨著掃流速度的增加,不論
是濾餅阻力或是濃度極化層阻力,皆會有
下降的趨勢,但是濾餅阻力下降的趨勢會
較明顯。這是因為掃流速度的增加,使得
剪應力上升,有效地抑制了濾餅的成長的
緣故。而當掃流速度上升時,可以預期濃
度極化層的阻力亦將會增加。
圖 3 顯示剪應力與穩定濾速的比值對
蛋白質在濾面上之沉積機率的影響。圖中
顯示掃流速度的增加會使剪應力與穩定濾
速的比值上升,故 BSA 便較容易被掃走,
沉積機率下降。此外,過濾壓差的增加會
使得剪應力與穩定濾速的比值上升,於是
沉積機率上升,表示 BSA 更容易到達濾餅
表面。故沉積機率可由此圖獲得。
在圖 4 中,我們以穩定濾速對式(2)中
的右邊項作圖,經線性回歸可以得到一條
通過原點的直線,證實本研究所提出的模
式的適用性,可以僅由操作條件便可預估
穩定濾速。
圖 5 顯示在不同的操作條件下,預估
的穩定濾速與實驗值之比較。圖中可以看
出兩者之間的吻合度。此外,穩定濾速與
掃流速度及過濾壓差的關係亦可由圖中看
出:隨著掃流速度的上升,穩定濾速也上
升;這是因為掃流速度的增加抑制了濾餅
的成長,降低過濾阻力所致。此外,過濾
壓差的上升,雖然亦使穩定濾速跟著上
升,但增加的幅度卻不大。這是由於壓差
的增加雖然增大了過濾的驅動力,但也同
時增加了濾餅的成長量及其緻密性,兩相
抵消的結果,使得壓差對濾速的影響不若
掃流速度來得明顯。
將式(5)中的左方項對濾餅厚度作圖,
可如圖 6 所示。經線性迴歸後,可以獲得
一直線,與理論模式相當吻合。故只要透
過實驗獲得篩析係數與濾膜之相當厚度,
則可將濾餅厚度代入式(5)中,求出理論之
BSA 阻擋率。
不同離心轉速下所獲得的濾速隨時間
的變化圖如圖 7 所示。初期的濾速較快,
但衰減相當迅速;一段時間之後,曲線將
慢慢趨向平緩。因為此系統為批式操作,
故最終將會達到完全過濾,濾速趨近零。
比較各操作條件,離心轉速與濾速並沒有
絕對的關聯性;當轉速最高時,濾速反而
最為緩慢。故一味的增加離心力,不一定
可以獲得較快的分離速率或較多的濾液體
積。
圖 8 是濾餅質量隨時間的成長圖。以
圖中之趨勢看來,300 秒之前可歸類為濾
餅的成長期,大部分的濾餅會於此階段內
形成。在 300 秒以後濾餅的成長已經趨向
平緩。由圖中可發現:轉速越大則濾餅成
長越快,在 4000 rpm 時幾乎一開始濾餅就
已經完全成長,之後會因為壓縮而變得較
難過濾,這也是造成 4000 rpm 下的濾速會
比其它轉速慢的原因。
圖 9 顯示在不同離心轉速下獲得的濾
液量與時間之關係圖。隨著時間的增加,
濾液量也跟著增加,直到完全濾過為止。
由圖可知:本研究之模式的預估值與實驗
值相當接近。這表示由本研究之成果可以
準確估計離心過濾的性能。
圖 10 為各離心轉速下蛋白質的通透
率(1-阻擋率)與時間的關係。在 0~300 秒
間,因濾餅尚未完全形成,孔隙度較大,
濃度極化使得較多的 BSA 通過濾材,通透
濾會大於 1。而在 300 秒之後,濾餅已經
形成,並逐漸被壓縮,使得通透濾逐漸下
降至趨近於 1。由圖中可看出,過濾越快
的轉速(例如 3000 rpm),其通過率越快趨
於平緩,而過濾最慢的轉速(4000 rpm),其
通過率則是最慢趨近平緩的。
五、結 論
掃流速度增加會提升穩定濾速。而增
加過濾壓差,穩定濾速亦會增加,但其影
響較不明顯。BSA 之阻擋率取決於此蛋白
質在濾膜表面之沉積機率,以及濾餅的厚
度。增加掃流速度時, BSA 沉積的機率會
降低,而高的剪應力亦會造成濾餅厚度降
低,故 BSA 之阻擋率會上升。而在增加過
濾壓差時,BSA 沉積機率會上升,但同時
濾餅的厚度也隨之提高,故 BSA 阻擋率上
升的幅度較小。此外,在離心過濾中,離
心轉速愈高則濾餅成長愈快、結構愈緊
密,故比阻愈高,BSA 之阻擋率愈低;但
是由於其平均驅動力較高,故濾速仍然較
高。最後,並配合理論與模式分析,可以
僅由操作條件便可預估穩定濾速與蛋白質
之阻擋率。
圖 表
0 0.2 0.4 0.6 usm/s) 0 2 4 6 8 10 qs 1 0 5m 3/m 2s ) P=50kPa 0.1wt% yeast+0.1wt% BSA 0.1wt% yeast 0.1wt% BSAFig.1 A comparison of pseudo-steady filtration rates among pure BSA and pure yeast and yeast/BSA binary suspensions under
different cross-flow velocities.
0 0.2 0.4 0.6 usm/s) 0 1 2 3 R m ) 0.1wt% BSA 0.1wt% yeast pH=7.0 P=50kPa Rc Rp Rm
Fig.2 Effect of cross-flow velocity on the filtration resistances from various sources.
4 6 8 10 w/qskg/m2s) 0.1 1 10 0.1wt% BSA 0.1wt% yeast pH=7.0 P=50kPa us=0.1~0.5m/s us=0.3m/s P=25~125kPa Fig.3 A plot ofw/qsvs. ψ 0 0.02 0.04 0.06 usoH/(H-Lc)2s) 0 1 2 3 4 qs m 3/m 2s ) 0.1wt% BSA 0.1wt% yeast pH = 7.0 Fig.4 A plot of usoH/(H-Lc)2vs. qs. 0 0.2 0.4 0.6 usm/s) 0 1 2 3 4 qs m 3/m 2s ) 0 40 80 120 P kPa) 0.1wt% BSA 0.1wt% yeast pH=7.0 P=50kPa Experimental Data P=50kPa Estimated Data us=0.3m/s Experimental Data us=0.3m/s Estimated Data
Fig.5 A comparison of filtration rates between experimental data and model predictions under various operating conditions.
0 1 2 3 Lcm) 4 5 6 7 8 9 ln (e x p (qs /k ) Rre j /( 1 -R re j )+ 1 ) (-) 0.1wt% BSA 0.1wt% yeast pH = 7.0 us=0.3m/s P=25~125kPa
Fig.6 A plot of Lcvs. ln(exp(qs/k)xRrej/(1-Rrej)+1).
0 400 800 1200 1600 2000 t (s) 0 2 4 6 8 q x 1 0 5(m 3/m 2s ) 3 wt% Yeast 0.1wt% BSA 2000 rpm 3000 rpm 3500 rpm 4000 rpm
Fig.7 Filtration rates during centrifugal filtration under various rotational speeds. 0 400 800 1200 1600 2000 t (s) 0.4 0.5 0.6 0.7 0.8 Wc (k g /m 2) 3 wt% Yeast 0.1wt% BSA 2000 rpm 3000 rpm 3500 rpm 4000 rpm
Fig.8 The time courses of cake mass during centrifugal filtration under various rotational speeds.
0 400 800 1200 1600 2000 t (s) 0 1 2 3 V x 1 0 2(m 3/m 2) 3 wt% Yeast 0.1wt% BSA 2000 rpm 3000 rpm 3500 rpm 4000 rpm
Experimental Data Estimated Line
Fig.9 A comparison of filtrate volumes between the predicted values and experimental data.
0 400 800 1200 1600 2000 t(s) 0 0.01 0.02 0.03 B S A (g ) 3 wt% Yeast 0.1wt% BSA 2000 rpm 3000 rpm 3500 rpm 4000 rpm 0.1wt% BSA
Fig.10 The BSA on the filtrate during centrifugal filtration under various rotational speeds.
評估 TPX 複合膜之滲透蒸餾效能
李雍信、王大銘
台灣大學化工系 國科會編號:NSC 92-2214-E-002-015 計畫主持人在工程科技推展中心“國科會工程處人力資料庫"帳號:8501450摘要
本研究針對可應用於滲透蒸餾分離程序的聚四甲基-1-戊烯(TPX)複合膜之製備加以探討。根據以往的經驗, 利用濕式相轉換法可以製備出 TPX 疏水性微孔膜,但是由於機械強度過低,無論在製程上或是應用上均受到很 大的限制。本研究以中分子量 TPX 與一號濾紙(基材)製備出 TPX 微孔複合膜,成功地提升機械強度。進一 步將所製備的 TPX 微孔複合膜應用在滲透蒸餾分離程序上,藉著與商業化 PTFE 膜之比較,評估 TPX 微孔複合 膜的分離效能。實驗結果顯示:應用於滲透蒸餾程序,TPX 微孔複合膜與商業化 PTFE 膜的通量相差不大。最 後,將滲透蒸餾與恆壓過濾實驗比較,評估在濃縮蛋白質、peptide 及醣類的效能。結果對於三種進料,滲透蒸 餾程序擁有較高的分離效果,而且滲透蒸餾沒有結垢現象(fouling),因此通量可以維持穩定,適合長期操作。1、前言
生化科技已公認是繼電子科技後廿一世紀高科 技的主流,而在生化產品的製造成本中,50%是用於 分離及純化產品[1],因此,生化分離是生化產品能否 商業化的重要關鍵技術[2]。在生化產品的製程中包含 了許多的分離技術[3],其中產品的濃縮是十分重要的 一個步驟[4],通常附加價值越高的生化產品在製程中 的濃度越低[5],若能加以適當濃縮,可大幅降低後續 分離的成本及提高產品的純度[6]。 最簡單且常用的濃縮技術是蒸發,但許多生化產 品在加熱過程中會喪失其活性甚至變質,是以不適於 用蒸發來濃縮。減壓蒸發可在較低的溫度下進行濃 縮,可避免加熱所導致的問題,但若溶液中含有一些 會揮發的物質也會在減壓中散失。為避免上述的問 題,本研究擬以滲透蒸餾技術來進行生化產品之濃縮。 在進行滲透蒸餾時,所使用的膜材必須具強疏水 性,利用材質與水溶液間界面張力的關係,阻擋水流 入膜孔(non-wetting),本研究擬開發新的疏水多孔膜, 所採用的材質為聚四甲基一戊烯(商業化名稱 TPX)。 TPX 具有良好的機械性質、氣體透過性、強疏水性與 高結晶性,曾被應用於氣體分離與滲透蒸發,本研究 則將其製備為顆粒多孔膜,並利用複合材料的方法製 備複合膜,以提高機械強度。另外,亦對 TPX 微孔複 合膜進行滲透蒸餾分離程序之實驗,同時與商業化 PTFE 膜作比較。最後將 TPX 複合膜應用於滲透蒸餾, 並與恆壓過濾程序相比較,評估其優缺點2、實驗方法
2.1 實驗藥品
本研究中使用的聚四甲基一戊烯,Aldrich(產品 編號 19099-3)。使用的溶劑為環己烷,為試藥級;凝 聚劑正丙醇及甲醇為主,為工業級。基材選用一號濾 紙(Toyo Rshi Kaisha)。商業化 PTFE 膜,孔徑約為0.2µm,孔隙度約為 70%(宇明泰公司);商業化超濾
膜與商業化奈米過濾膜,其 MWCO 分別為 30,000 Da
與 150 Da(邁先生物技術顧問股份有限公司)。蛋白質
選用牛血清蛋白(BSA),SIGMA(產品編號 A-7906),
分子量約為 67,000;peptide 選用阿斯巴甜(aspartame), Aldrich(產品編號 858900-5G),純度 96%,分子量為 294.3;寡醣的選用是棉子糖(raffinose),SIGMA(產 品編號 R0250),分子量為 504.5。氯化鈣鹽類,RdH (產品編號 31307)。
2.2 TPX 微孔複合膜製備
取適量的 TPX 溶於環己烷中,溶解完成後在 50℃烘箱中靜置 12 小時以進行脫泡。調整刮製的厚度後, 將鑄膜液刮於基材上,並迅速浸於第一凝聚槽中 10 分 鐘,以待相分離固化。為了避免在膜材內的溶劑或非 溶劑揮發造成膜材收縮,因此將膜材再浸於第二凝聚 槽中 12 小時,以移除第一凝聚槽中的凝聚劑與殘留在 膜中溶劑。其中,第一凝聚槽中的凝聚劑以非溶劑正 丙醇為主,可加入環己烷或甲醇來調整與 TPX 的親合 度;第二凝聚槽中之凝聚劑則為甲醇。
2.3 機械強度之量測方法
利用拉張力測試機測量膜材的機械強度,設定如 表一所示。將待測膜材剪成啞鈴形後,以上下兩端的 夾具固定。藉著拉伸機的測量,可以得到膜材的最大 拉伸承受力(Max. Load)。待測膜材分別是 TPX 顆粒 膜(無基材)、TPX 複合膜(有基材)與基材。 表一 拉張力測試機設定值 Velocity (mm/min) Preload (N) Gauge Length (mm) 10 0.2 20 Max. Load (N) Senstivity (%) Break Defined2500 104.1 The load drops to
50% of max. load
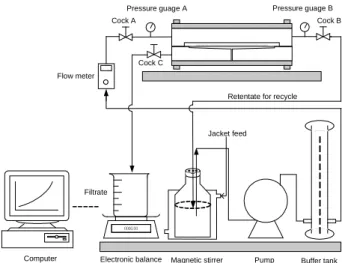
2.4 滲透蒸餾程序
利用 side-by-side cell 做為滲透蒸餾的主要裝置, 如圖一所示,將膜材置於 donor cell 與 receptor cell 之 中,在 donor cell 中裝入待分離之水溶液,在 receptor cell 中置入飽和氯化鈣鹽水溶液。利用 UV 連續取樣偵 測器偵測 donor cell 中待分離水溶液的濃度,藉由濃度 變化換算成通量,以此評估膜材的分離速率。待分離 的藥品:BSA 溶液,6000 ppm;aspartame 溶液,500 ppm;raffinose 溶液,500ppm。
2.5 UF 與 NF 過濾程序
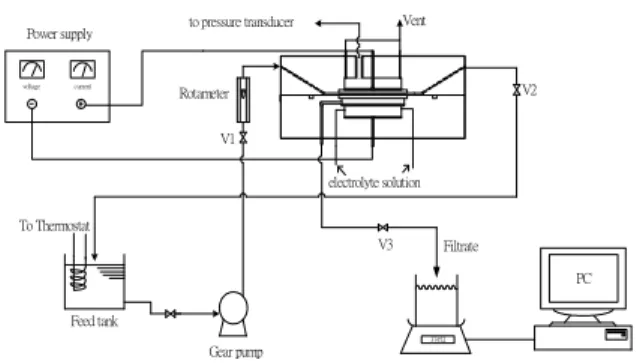
本實驗所設計的實驗裝置如圖二所示,系統的壓 力來源為高壓空氣,透過壓力調節閥調整所需的操作 壓力;溶液進料槽為內部直徑 18 公分、高 20 公分的 不鏽鋼容器,濾室是以屬於 dead-end 形式,實際過濾 面積為 7.07 平方公分,壓力調整為 3 大氣壓,出料端 收集的濾液利用電子天平量測後,以數位訊號傳至個 人電腦,以記錄濾液隨時間的變化量,在經過換算可 得通量。出料端的濾液經由分析儀器的測量可得其濃 度,其中,BSA 與 aspartame 溶液以 UV 偵測,raffinose 溶液以折射率測定器量測。待分離的溶液濃度均與滲 透蒸餾程序的溶液濃度相同。Donor Receptor
Water in Water out Water in
Membrane
Stirring Bar Stirring Bar
圖一、side-by-side cell 裝置圖 UV Dectector Compressed Air Air Filter Pressure Gauge Filter Chamber Feed Reservoir Regulator Valve 1234.56 Electronic Balance PC Computer Membrane 圖二、dead-end 恆壓過濾裝置圖
3、結果與討論
3.1 材料的選擇
根據本實驗室以往的研究,所製備之 TPX 顆粒膜 具有高效能的分離速率,但是受限於機械強度太低, 無論在製備或應用上都會造成很大的困難。在本實驗 中,試著採用複合的方法增加膜材的機械強度,成功 地開發出 TPX 微孔複合膜,靠著基材的支撐,機械強 度獲得很大的改善。第一凝聚槽之凝聚劑選擇 80%正 丙醇與 20%環己烷混合液,其中環己烷的加入是為了 減緩成膜速度,有利於 TPX 顆粒結構的形成,而第二 凝聚槽的凝聚劑採用甲醇, TPX 可以形成完整的顆粒 結構,如圖三所示。基材選用親水性的一號濾紙,雖然性質與疏水性的 TPX 不同,但是因為有部份高分子 滲入基材中,因此,使 TPX 與基材複合很穩定。 ×5000 ×2000 圖三、TPX 膜顆粒結構
3.2 機械強度的測試
加入基材後的 TPX 微孔複合膜,機械強度有明 顯的改善(見表二),藉由濾紙本身的機械強度,補強 TPX 顆粒膜強度低的嚴重缺點。表二是利用拉張力試 驗機測量 TPX 顆粒膜、TPX 複合膜與其基材(一號濾 紙)的數據,針對 TPX 顆粒膜測量時,因為 TPX 顆 粒膜太過脆弱,因此在以夾具固定時,膜材即碎裂, 無法量測。另外由基材與 TPX 複合膜的數據得知,當 TPX 高分子與基材複合時,不僅增加了 TPX 顆粒膜的 機械強度,相對於基材而言,機械強度也同樣地提升。 表二 利用拉張力試驗機機測量 TPX 顆粒膜、基材與 TPX 複合膜的機械強度 TPX 顆粒膜 基材 TPX 複合膜 Max. Load 太 脆 無 法量測 16.3 N 24.2 N3.3 滲透蒸餾程序之速率的評估
利用滲透蒸餾裝置測量膜材的分離速率。因為溫 度會影響水的飽和蒸氣壓與透過端鹽水的飽和濃度, 因此利用循環水槽固定系統溫度為 30℃。選取三種待 分離溶液(BSA、aspartame 與 raffinose)進行滲透蒸餾。 由圖四可知,以 BSA、aspartame 與 raffinose 溶液 為進料,所製備的 TPX 微孔複合膜為膜材,通量均在 4 kg/m2/hr 以上,顯示複合膜材滲透蒸餾上的高分離速 率。另外,與商業化的 PTFE 膜材做比較,進料溶液 為 6000ppm 的 BSA 溶液,結果如圖五所示。顯示出 TPX 微孔複合膜已具備與商業化 PTFE 膜相同的分離 速率。 20 60 100 140 180 0 40 80 120 160 Time (min) 1 3 5 7 0 2 4 6 8 Fl ux ( k g/ m 2 /h r) BSA aspartame raffinose 圖四、以 TPX 微孔複合膜分離 BSA、aspartame 與 raffinose 溶液,在滲透蒸餾程序的分離速率 20 60 100 140 180 0 40 80 120 160 Time (min) 1 3 5 7 0 2 4 6 8 Flux (kg /m 2 /hr) TPX composite membrane PTFE commercial membrane圖五、TPX 微孔複合膜與商業化 PTFE 膜在滲 透蒸餾上比較分離速率
3.4 與 UF、NF 做比較
針對滲透蒸餾所濃縮的三種樣品溶液,進行 UF 或 NF 恆壓過濾的濃縮程序,BSA 以商業超濾膜進行 UF;aspartame 或 raffinose 溶液以商業奈米濾膜進行 NF。試著與滲透蒸餾程序進行比較,分別測量分離速 率與出料端樣品濃度,比較滲透蒸餾程序的優缺點。 圖六是以 6000ppm 的 BSA 為進料進行 dead-end 恆壓過濾與滲透蒸餾程序,由圖可以清楚看見滲透蒸 餾的通量(約 4.5 kg/m2 /hr)大於恆壓過濾的通量(約 3 kg/m2/hr),因此以 BSA 為進料時,滲透蒸餾擁有比 較高的分離速率。在 retention 方面,濾液濃度為 110.46 ppm,所以 retention 約為 98.15%;而對滲透蒸餾而言, BSA 無法氣化,因此出料端沒有樣品,即 retention 為 100%。所以,在 retention 差不多的情況下,滲透蒸餾 擁有較高的分離速率。 圖七是以 500 ppm 的 aspartame 溶液為進料進行deadend 恆壓過濾程序與滲透蒸餾程序,由圖可知,在 分離速率上,兩者都差不多。但是在出料端濃度而言, deadend 過濾程序之出料端濃度以 UV 偵測器測量為 193.881 ppm,所以 retention 為 61.22%,相對地,滲 透蒸餾程序是 100%。所以 ,在分離速率差不多的情 形下,滲透蒸餾能擋住全部的樣品,而恆壓過濾卻不 行。 圖八是以 500 ppm 的 raffinose 溶液為進料進行 deadend 恆壓過濾程序與滲透蒸餾程序,由圖可知,在 分離速率上,兩者也都差不多。但是在出料端濃度而 言,deadend 過濾程序之出料端濃度經由折射率測定器 測量為 158.918 ppm,所以 retention 為 72.30%,相對 地,滲透蒸餾程序是 100%。所以 ,在分離速率差不 多的情形下,滲透蒸餾在 retention 方面有較大的優勢。 0.0 40.0 80.0 120.0 160.0 200.0 Time (min) 10 30 50 0 20 40 60 Flux ( k g/m 2 /h r) dead-end filtration osmotic distillation 圖六、以 6000 ppm BSA 溶液為進料,比較滲透蒸餾 程序與 dead-end 恆壓過濾程序的分離速率 0.0 40.0 80.0 120.0 160.0 200.0 Time (min) 10 30 50 0 20 40 60 Flux (kg/m 2 /h r) dead-end filtration osmotic distillation 圖七、以 500 ppm aspartame 溶液為進料,比較滲透蒸 餾程序與 dead-end 恆壓過濾程序的分離速率 0.0 40.0 80.0 120.0 160.0 200.0 Time (min) 10 30 50 0 20 40 60 Flux (kg/m 2 /h r) dead-end filtration osmotic distillation 圖八、以 500 ppm raffinose 溶液為進料,比較滲透蒸 餾程序與 dead-end 恆壓過濾程序的分離速率
4、結論
本研究成功地利用 TPX 與一號濾紙(基材)製 備出 TPX 微孔複合膜,改善了 TPX 顆粒膜機械強度 過低的缺點。TPX 複合膜最大拉伸承受力可達 24.2 N,而顆粒膜則因過脆而完全無法量測機械強度。利 用滲透蒸餾程序評估通量,進料端溶液選擇 6000 ppm 的牛血清蛋白溶液,出料端溶液選用飽和氯化鈣溶 液,系統溫度固定在 30℃。結果其通量與商業化 PTFE 膜相近。最後,滲透蒸餾與恆壓過濾程序相比較,發 現以 TPX 複合膜所進行的滲透蒸餾程序分離效果較 佳。恆壓過濾會因為結垢現象(fouling)而導致通量 快速下降,但是滲透蒸餾程序沒有結垢現象,因此通 量維持穩定,適合長期操作。以 BSA 溶液為進料溶液 時,兩者有相似的截留率,但是滲透蒸餾程序有較高 的通量;以 aspartame 溶液與 raffinose 溶液為進料溶液 時,其通量相近但滲透蒸餾程序擁有較高的截留率。5、參考文獻
1. B.J. Spalding, Biotechnology, 9(1991),229. 2. J. van Burnt, Biotechnology, 3(1985),419.3. P.C. Singh, and R.K. Singh, Trends in Food Science and Technology, 7(1996),49.
4. E.L. Cussler, and H. Ding, Bioseparation Processes in Foods, (1995),1.
5. K.H. Kroner, H. Hustedt, and M.R. Kula, Biotecnol. Bioeng., 24(1982), 1015
6. D.C. Szlag, A. Giuliano, and S.M. Snyder, ACS Symp. Ser., 419(1990),71