行政院國家科學委員會專題研究計畫 成果報告
國中自然與生活科技學習領域召集人領導結果與式態之研
究
計畫類別: 個別型計畫 計畫編號: NSC92-2413-H-003-020- 執行期間: 92 年 08 月 01 日至 93 年 07 月 31 日 執行單位: 國立臺灣師範大學工業科技教育學系(所) 計畫主持人: 李隆盛 報告類型: 精簡報告 報告附件: 出席國際會議研究心得報告及發表論文 處理方式: 本計畫可公開查詢中 華 民 國 93 年 12 月 1 日
摘 要 國中自 91 學年度起實施九年一貫課程,新課程將自然與生活科技整合為一個學習領域。新 學習領域召集人(簡稱「領召」)被期望扮演好領導課程變革的重要角色。為了了解領召的 領導結果(即領導績效)以及可由其領導式態(即領導風格)和人口調查特性預測領導績 效的情形,本研究採用 MLQ 問卷郵寄至隨機取樣的 252 所國中,請各校自然與生活科技 領召(領導者)和一名教師(被領導者)針對領召的領導績效和風格提供回饋。共有各 161 名(或 63.9%)領召和教師填覆。資料經統計分析後,結論如下:(1)領召有好的領導績 效、風格和人口調查特性,但領導績效應再提升。(2)各種領導風格都和領導績效有關。(3) 只有轉化型和被動規避型風格可以預測領導績效,且宜著重激發被領導者動機以提升績 效。(4)領域中的教師人數和領召領導績效正相關,領召和教師性別則和領召被動規避型 風格呈負相關。(5)只有領召及教師的年齡可以預測領召的領導績效。 關鍵詞:自然與生活科技課程、領導式態、領導績效 ABSTRACT
In Taiwan, both science and technology programs in the junior high schools (grades 7-9) have been integrated into a new key learning area (KLA)--Science and Technology (S&T)-since 2002. The new S&T program heads have been expected to play a vital role in leading the science and technology program change. In order to explore the program head’s leadership performance and how it can be predicted by leadership styles and some demographic characteristics, the
Multifactor Leadership Questionnaire (MLQ) was mailed to 252 randomly sampled junior high schools to solicit response from the S&T program head (as leader) and an S&T teacher (as follower) in each school. There were 161 program heads (or 63.9%) and 161 teachers (or 63.9%) responded. Consequently, the following conclusions were drawn: (1) S&T program heads
demonstrate good leadership performance and sound leadership styles and demographic
characteristics but the performance should be promoted. (2) All leadership styles in this study are related to leadership performance. (3) Only transformational and passive-avoidant styles can predict leadership performance and these styles should emphasize the factor of inspirational motivation (IM). (4) Number of teacher in S&T program positively related to program head’s leadership performance while gender negatively related to passive-avoidant style. (5) Only program heads’ and teachers’ ages can predict program heads’ leadership performance.
Keywords: science and technology program, leadership style, leadership performance
BACKGROUND AND PURPOSE
The Ministry of Education, Republic of China on Taiwan newly promulgated the national curriculum for grades 1-9. Following the new national curriculum, both science and technology programs in junior high schools (grades 7-9) have been integrated into a new key learning area (KLA)--Science and Technology (S&T)-since 2002.
Adopting a standard-based approach, the new junior-high-school S&T national curriculum prescribes a list of competency indicators and anticipates every school’s S&T program to develop its own school-based curriculum aiming to assist pupils to transcend the competency indicators. Thus, the new S&T program heads have been expected to play a vital role in leading the science and technology program change.
Within the school organization and as a school teacher, an S&T program head has the following responsibilities of leadership and management:
1. To lead colleagues in a process of change through program planning. 2. To encourage colleagues to focus on teaching and learning.
3. To use feedback from principals, directors, colleagues, parents and pupils to work on curricular and instructional improvement.
4. To provide resources to support, maintain or initiate change, improvement and reflection. 5. To speak with and question colleagues about program of study, pupils, projects, tests,
professional development, teaching supplies and materials, teaching facilities and equipment, as well as concerns and difficulties in their teaching (Clovis Municipal Schools, 2003;
Somerset Junior High School, n.d.).
Both leadership and management are important and overlap, but they are not the same. "Managers are people who do things right and leaders are people who do the right thing" (Bennis, 1997, p. 9). Compared to management which tends to be a science and is focused on planning and organizing, motivating and controlling, as well as directing human and material resources,
leadership is closer to be an art and is more focused on influencing people.
With increasing demand for effective leadership in the S&T program change in the junior high schools in Taiwan, selection, preparation and reflection of program heads should be based on the leadership outcomes and leadership attributes. Researchers in related literature (Bass, Avolio, Jung & Berson, 2003; Lai, 2003; Liang, Chiou & Liou, 2001) have pointed that it is necessary to know about what leaders’ leadership styles and their demographic characteristics make their leadership effective. Without this information, the selection, preparation and reflection of an S&T program head might suffer in the chaos of grasping anything within reach without having a strong knowledge base for professional action.
Accordingly, the primary purpose of this study was to identify program heads’ leadership styles (X) which are related to their leadership performance (Y) and examine the leadership styles (X) which can be used to predict leadership performance (Y) in the junior high schools in Taiwan. The secondary purpose of this study was to examine the relationship between program heads’ demographic characteristics (Z) and leadership performance (Y) and between leadership styles (X) and demographic characteristics (Z). Also included in the second purpose is an examination of the regression of leadership performance (Y) on demographic characteristics (Z). To accomplish these purposes, this study sought to answer the following questions within the context of the S&T programs of junior high schools in Taiwan:
1. What is the relationship between leadership styles (X) and leadership performance (Y)? 2. What leadership styles (X) predict leadership performance (Y)?
3. What is the relationship between demographic characteristics (Z) and leadership performance (Y)?
4. What demographic characteristics (Z) predict leadership performance (Y)?
METHODOLOGY AND PROCEDURES
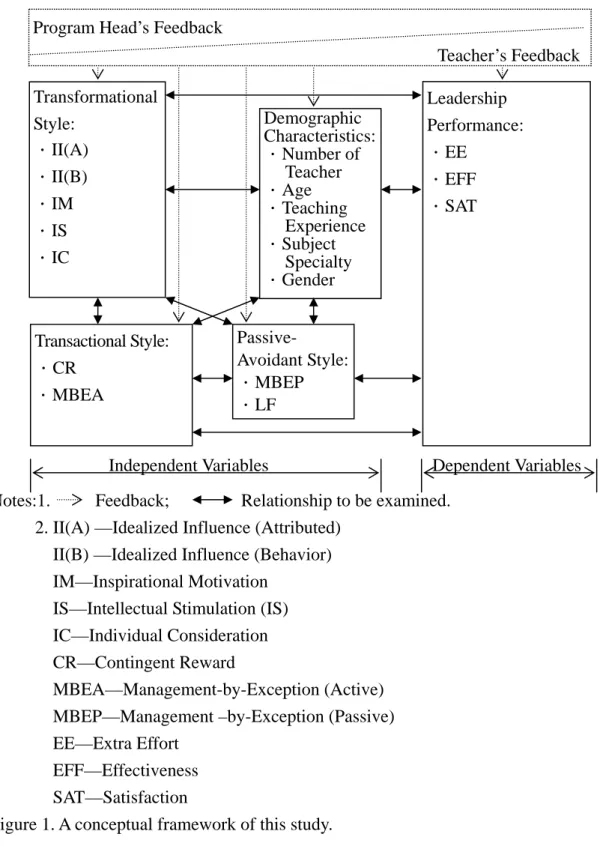
A review of pertinent literature led to the specific variables investigated in this study: (1) independent variables—leadership styles consisting of transformational, transactional and passive-avoidant styles; demographic characteristics comprised of number of teacher in S&T program as well as program head’s age, teaching experience, subject specialty and gender; and (2) dependent variable—leadership performance including follower’s extra efforts (EE) owing to program head’s leadership, program head’s leadership effectiveness (EFF), and follower’s satisfaction (SAT) to program head’s leadership. A conceptual framework of variables to be identified and examined is presented in Figure 1.
The target population of this study was all 734 S&T program heads in all junior high schools (722 public, 12 private) in Taiwan’s 25 counties and large cities. Based upon the following
stratifications-- school category (public/private) and school location (in specific county/city), 252 sample junior high schools were randomly selected. The confidence interval of sample size is 5%. The Multifactor Leadership Questionnaire (MLQ Form 5 X) (Bass & Avolio, 2000) was
translated and adapted into Chinese and added demographic questions. In early 2004, the coded questionnaire with its cover letter was mailed to 252 sample schools’ academic affair directors. Every director was requested to forward the questionnaire to their S&T program head and an S&T teacher, who were requested to mail back filled-out questionnaires by themselves. About 20 days after the initial mailing, a follow-up with another copy of the questionnaire was mailed to all non- respondents. Finally, 161 (or 63.9%) program heads and 161 (or 63.9%) teachers responded. The 216 respondents returned questionnaires before the follow-up were called earlier respondents, whereas the remaining 106 were called later respondents..
Descriptive statistical analyses such as frequencies, percentages, means, and standard deviations were employed to describe the data collected. To examine the relationships between, and the regression of variables, relevant correlation coefficients and stepwise multiple regression analysis (SMRA) were respectively used to test their null hypotheses.
According to Bass and Avolio (2000) as well as Bass, Avolio, Jung and Berson, (2003), the nine leadership style factors (II(A), II(B), IM, IS, IC, CR, MBEA, MBEP, LF) can be
appropriately categorized into three leadership styles (transformational, transactional and passive-avoidant) and the following six factors (Bass & Avolio , 2000, p. 29): (1)
Charisma/Inspirational (CH)—Provides followers with a clear sense of purpose that is energizing : a role model for ethical conduct which builds identification with the leader and his/her articulated vision. (2) Intellectual Stimulation (IS)—Gets followers to question the tried and true ways of solving problems ; encourages them to question the methods they use to improve upon them. (3) Individualized Consideration (IC)—Focuses on understanding the needs of each follower and works continuously to get them to develop to their full potential. (4) Contingent Reward
(CR)—Clarifies what is expected from followers and what they will receive if they meet expected levels of performance. (5) Active Management-by-Exception (MBEP)—Focuses on monitoring task execution for any problems that might arise and correcting those problems to maintain current performance levels. (6) Passive Avoidant (PA)—Tends to react only after problems have become serious to take corrective action. Often times will avoid making any decisions at all. The
relationships between the three styles, nine factors and six factors are shown in Figure 2.
Notes:1. Feedback; Relationship to be examined. 2. II(A) —Idealized Influence (Attributed)
II(B) —Idealized Influence (Behavior) IM—Inspirational Motivation
IS—Intellectual Stimulation (IS) IC—Individual Consideration CR—Contingent Reward
MBEA—Management-by-Exception (Active) MBEP—Management –by-Exception (Passive) EE—Extra Effort
EFF—Effectiveness SAT—Satisfaction
Figure 1. A conceptual framework of this study.
Transformational Transactional Passive-Avoidant
II(A) II(B) IM IS IC CR MBEA MBEP LF
CH IS IC CR MBEA PA
Effective Ineffective Active Passive Figure 2. The relationships between three styles, nine factors and six factors.
Program Head’s Feedback
Teacher’s Feedback Transformational Style: .II(A) .II(B) .IM .IS .IC Leadership Performance: .EE .EFF .SAT Passive- Avoidant Style: .MBEP .LF Transactional Style: .CR .MBEA Demographic Characteristics: .Number of Teacher .Age .Teaching Experience .Subject Specialty .Gender
FINDINGS AND DISCUSSIONS
As a result of these analyses, major findings of this study can be described and discussed as follows:
1. Program heads’ and teachers’ feedback can be combined
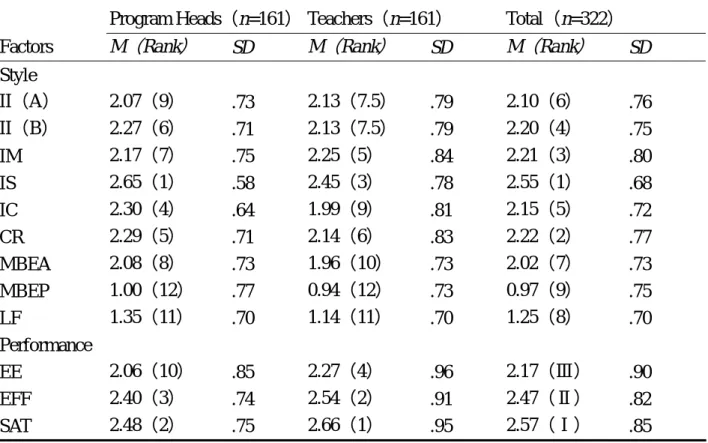
Program heads are leaders while teachers are followers. As summarized in Table 1, the Spearman rank coefficient between the program heads’ and the teachers’ feedback on leadership styles and leadership performance (rs=.718*, p < .05) indicates that the program heads’ feedback
appears to be like the teachers’, and the two group’s feedback can be combined.
Table 1. The means and standard deviations of leadership styles and performance at the five point scale (0-4): Categorized by program heads and teachers.
Program Heads(n=161)Teachers(n=161) Total(n=322) Factors M(Rank) SD M(Rank) SD M(Rank) SD
Style II(A) 2.07(9) .73 2.13(7.5) .79 2.10(6) .76 II(B) 2.27(6) .71 2.13(7.5) .79 2.20(4) .75 IM 2.17(7) .75 2.25(5) .84 2.21(3) .80 IS 2.65(1) .58 2.45(3) .78 2.55(1) .68 IC 2.30(4) .64 1.99(9) .81 2.15(5) .72 CR 2.29(5) .71 2.14(6) .83 2.22(2) .77 MBEA 2.08(8) .73 1.96(10) .73 2.02(7) .73 MBEP 1.00(12) .77 0.94(12) .73 0.97(9) .75 LF 1.35(11) .70 1.14(11) .70 1.25(8) .70 Performance EE 2.06(10) .85 2.27(4) .96 2.17(Ⅲ) .90 EFF 2.40(3) .74 2.54(2) .91 2.47(Ⅱ) .82 SAT 2.48(2) .75 2.66(1) .95 2.57(Ⅰ) .85 rs=.718*, p < .05.
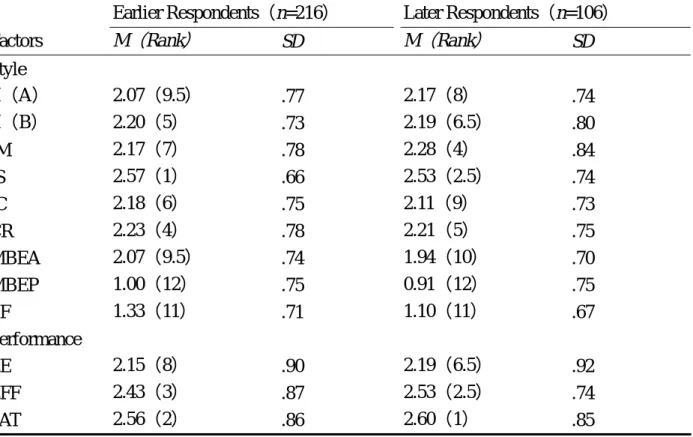
2. The study results could be generalized to the target population
Non-respondents will be the most like the late respondents (Miller & Smith, 1993). As summarized in Table 2, the Spearman rank coefficient between the earlier respondents’ and the later respondents’ feedback on leadership styles and leadership performance (rs=.896*, p < .05)
indicates that the usable sample appears to be like the non-respondents, and study results could be generalized to the population from which the sample was drawn.
Table 2. The means and standard deviations of leadership styles and performance at the five point scale (0-4): Categorized by earlier respondents and later respondents.
Earlier Respondents(n=216) Later Respondents(n=106)
Factors M(Rank) SD M(Rank) SD
Style II(A) 2.07(9.5) .77 2.17(8) .74 II(B) 2.20(5) .73 2.19(6.5) .80 IM 2.17(7) .78 2.28(4) .84 IS 2.57(1) .66 2.53(2.5) .74 IC 2.18(6) .75 2.11(9) .73 CR 2.23(4) .78 2.21(5) .75 MBEA 2.07(9.5) .74 1.94(10) .70 MBEP 1.00(12) .75 0.91(12) .75 LF 1.33(11) .71 1.10(11) .67 Performance EE 2.15(8) .90 2.19(6.5) .92 EFF 2.43(3) .87 2.53(2.5) .74 SAT 2.56(2) .86 2.60(1) .85 rs=.896*, p < .05.
3. The S&T program heads tend to demonstrate transformational and transactional leadership styles
As shown in Table 1, the program heads tend to demonstrate transformational and
transactional leadership styles. The leader demonstrating the former style adapts his/her style and behavior to meet the perceived expectations of the followers. The leader demonstrating the later style seeks to motivate followers by appealing to their own self-interest.
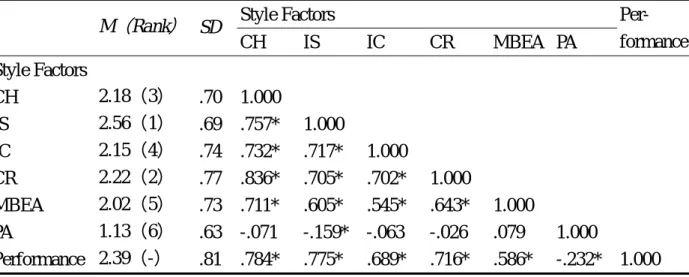
4. The S&T program heads’ leadership performance is mid-high
As shown in Table 3, the program heads’ average score of leadership performance is 2.39 at the five point scale (0-4), which is above average (2) but not very high.
Table 3. Relationships between leadership style factors and leadership performance examined by using the Pearson product-moment coefficient (N=322).
Style Factors M(Rank) SD CH IS IC CR MBEA PA Per- formance Style Factors CH 2.18(3) .70 1.000 IS 2.56(1) .69 .757* 1.000 IC 2.15(4) .74 .732* .717* 1.000 CR 2.22(2) .77 .836* .705* .702* 1.000 MBEA 2.02(5) .73 .711* .605* .545* .643* 1.000 PA 1.13(6) .63 -.071 -.159* -.063 -.026 .079 1.000 Performance 2.39(-) .81 .784* .775* .689* .716* .586* -.232* 1.000 * p < .05
5. The S&T program includes about 13 teachers on average, 35 years old on average and have about eight years of teaching experience
It was found that the S&T program has 12.52 S&T teachers (including a program head) on average, In addition, the program heads’ and teachers’ age is 35.43 on average and their teaching experience is 7.55 years on average (see Tables 7 and 8).
6. All leadership style factors and styles related to leadership performance
Tables 3 and 4 indicate that in the set of leadership styles all six style factors and three styles were related to leadership performance (p < .05). It should be noted that the passive-avoidant (PA) negatively related to leadership performance.
Table 4. Relationships between leadership styles and leadership performance examined by using the Pearson product-moment coefficient (N=322).
Styles
M(Rank) SD Transformational Transactional Passive-Avoidant Per- formance Styles Transformational 2.25(1) .65 1.000 Transactional 1.80(2) .51 .687* 1.000 Passive-Avoidant 1.13(3) .63 -.109 .427* 1.000 Performance 2.39(-) .81 .825* .529* -.232* 1.000 * p < .05
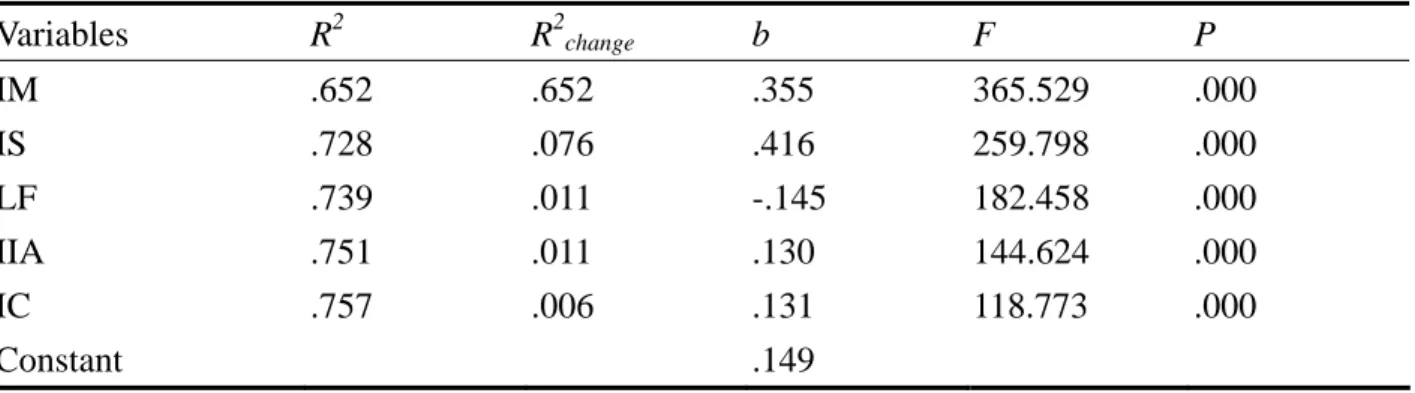
7. Five leadership style factors can predict leadership performance
It was found that program heads’ leadership performance can be explained with a linear combination of five leadership style factors (R2=.757, p< .05). As shown in Table 5, 75.7% of the variance of program heads‘ leadership performance can be explained by using the linear
percentage, 65.2%, of the variance of program heads’ leadership performance can be explained by the factor IM (R2=.652, p< .05). An additional 7.6% of the variance in program heads’
leadership performance can be attributed to the factor IS. A third factor, LF, accounted for another 1.1% of variance (R2change = .011, p<.05) and when added to the first two factors (i.e., IM and IS).
Consequently, the prediction equation is:
Predicted program heads’ leadership performance = .149 + .355 * (IM) + .416 * (IS) - .145 * (LF) + .130 * (IIA) +.131 * (IC)
Table 5. Stepwise multiple regression of program heads’ leadership performance on their leadership style factors (N = 322).
Variables R2 R2change b F P IM .652 .652 .355 365.529 .000 IS .728 .076 .416 259.798 .000 LF .739 .011 -.145 182.458 .000 IIA .751 .011 .130 144.624 .000 IC .757 .006 .131 118.773 .000 Constant .149
8. Two leadership styles can predict leadership performance
It was found that program heads’ leadership performance can be explained with a linear combination of two leadership styles (R2=.734, p< .05). As shown in Table 6, 73.4% of the variance of program heads’ leadership performance can be explained by using the linear
combination of the following two leadership styles: transformational and Passive-Avoidant. The prediction equation is:
Predicted program heads’ leadership performance = .367 + 1.002 * (Transformational ) -.217 * (Passive-Avoidant)
Table 6. Stepwise multiple regression of program heads’ leadership performance on their leadership styles (N = 322).
Variables R2 R2change b F P
Transformational .704 .704 1.002 463.450 .000
Passive-Avoidant .734 .030 -.217 267.043 .000
Constant .367
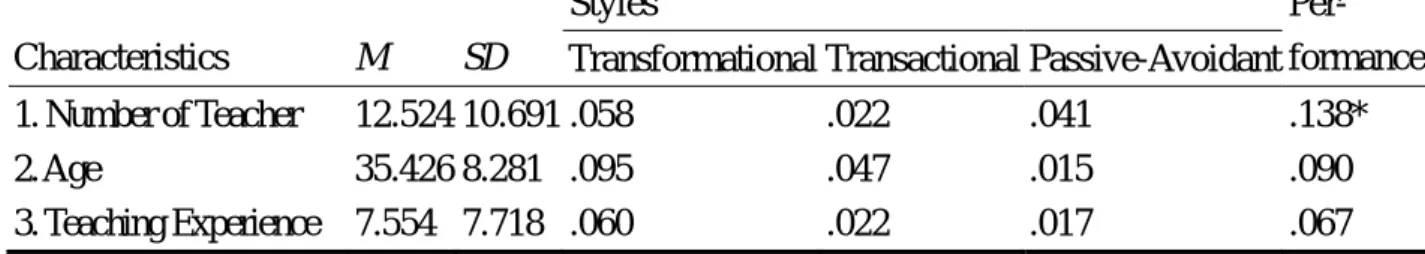
9. One demographic characteristic positively related to leadership performance
Tables 7 and 8 indicate that in the set of demographic characteristics one characteristic, number of teacher, was positively related to leadership performance (p < .05). In addition, gender was negatively related to passive-avoidant style (p < .05).
Table 7. Relationships between demographic characteristics and leadership performance examined by using the Pearson product-moment coefficient (N=322).
Styles
Characteristics M SD Transformational Transactional Passive-Avoidant Per- formance 1. Number of Teacher 12.524 10.691 .058 .022 .041 .138* 2. Age 35.426 8.281 .095 .047 .015 .090 3. Teaching Experience 7.554 7.718 .060 .022 .017 .067 * p < .05
Table 8. Relationships between demographic characteristics and leadership performance examined by using the point-biserial coefficient (N=322).
Styles
Characteristics Transformational Transactional Passive-Avoidant Per- formance
1.Subject Specialty -.065 -.028 .053 -.019
2.Gender .007 -.055 -.227* .041
Notes: 1. Subject Specialty—0: other than physics and chemistry; 1: physics and chemistry 2. Gender—0: female; 1: male
3. *p < .05
10. One demographic characteristic can predict leadership performance
It was found that program heads’ leadership performance can be explained with a demographic characteristic (R2=.016, p< .05). As shown in Table 9, 1.6% of the variance of program heads‘ leadership performance can be explained by using program heads’ and teachers’ ages. The prediction equation is:
Predicted program heads’ leadership performance = 1.887 + .013 * (Age)
Table 9. Stepwise multiple regression of program heads’ leadership performance on heads’ and teachers’ demographic characteristics (N = 322).
Variable R2 R2change b F P
Age 0.016 0.016 0.013 4.526 0.034
Constant 1.887
CONCLUSIONS AND IMPLICATIONS
From the preceding findings, some conclusions can be drawn as follows:
1. S&T program heads demonstrate good leadership performance and sound leadership styles and demographic characteristics but the performance should be promoted.
2. All leadership styles in this study are related to leadership performance.
3. Only transformational and passive-avoidant styles can predict leadership performance and these styles should emphasize the factor of inspirational motivation (IM).
4. Number of teacher in S&T program positively related to program head’s leadership performance while gender negatively related to passive-avoidant style
5. Only program heads’ and teachers’ ages can predict program heads’ leadership performance. Based upon the above conclusions, the implications with this study are as follows:
1. Junior high schools, teacher educators, and educational authorities need to use the results of this study to examine their S&T program leadership to improve the selection, preparation and reflection of program heads.
2. Additional variables that might explain variation in leadership performance should be investigated.
3. Other feedback sources than program heads and other methods than questionnaire surveys should be employed to integrate with the ones used in this study.
REFERENCES
Bass, B., & Avolio, B. (2000). Multifactor Leadership Questionnaire (2nd ed.). Redwood City, CA:
Mind Garden.
Bass, B. M., Avolio, B. J., Jung, D. I., Berson, Y. (2003). Predicting unit performance by by assessing transformational and transactional leadership. Journal of Applied Psychology, 88 (2). Retrieved April 5, 2003, from
http://www.apa.org/journals/apl/press_releases/april_2003/apl882207.pdf.
Bennis, W. (1997). Learning to lead: A workbook on becoming a leader. Boston, MA: Addison Wesley.
Clovis Municipal Schools. (2003, February). Job description. Retrieved May 20, 2003, from http://www.cms.k12.nm.us/personnel/job_descriptions/Teachers/Depart%20Chairperson.pdf. Lai, C. C. (2003). A study of leadership performance and styles of child care center directors in
Taiwan. Taipei: Psychology.
Liang, C. L., Chiou, S. B., & Liou, T. M. (2001). The relationships between leadership attributes, behaviors and the effectiveness of principals at private vocational high schools in Taiwan .
2001 UICEE Global Journal of Engineering Education, 5(2). Retrieved April 5, 2003, from
http://www.eng.monash.edu.au/uicee/gjee/vol5no2/Liang.pdf.
Miller, M. D., & Smith, K. L. (1993). Handling nonresponse issues. Journal of Extension, 21, 45-50.
Somerset Junior High School. (n.d.). Faculty handbook 2004 – 2005. Retrieved September 30, 2004, from
http://www.somerset.k12.tx.us/JuniorHigh/Policies/SJHFacultyHDBK2004-2005.pdf.
NOTES
1. The former version of this paper has been presented at a conference as follows:
Lee, L. S., & Lai, C. C. (2003). Science and technology program head’s leadership styles and
demographic characteristics predicting leadership performance in the junior high schools in Taiwan. Paper presented at the TENZ/ICTE 2003 (Technology Education New
Zealand/International Conference on Technology Education), Hamilton, New Zealand, September 30-October 3.