筆電材質設計對台灣消費者行為之影響 - 政大學術集成
50
0
0
全文
(2) . 筆電材質設計對台灣消費者行為之影響 How Laptop Materials Design Affect Taiwanese Consumer Purchase Behavior. 研究生:張雅茹. Student: Yaru Chang. 指導教授:何富年. 立. Advisor: Foo Nin Ho. 政 治 大. ‧ 國. 學 國立政治大學. ‧. 商學院國際經營管理英語碩士學位學程. y. A Thesis. n. a. er. io. sit. Nat. 碩士論文. v. i l to Submitted C International MBAnProgram. i U. h. e n g c hUniversity National Chengchi. in partial fulfilment of the Requirements for the degree of Master in Business Administration. 中華民國一O三年六月 June 2014 .
(3) . Acknowledgement I want to thank my family who always support and respect what I want to do. Also, I want to expand my gratitude to Hugh Lee and Ya Ching Chang who fully support and lead me the direction to study the NCCU IMBA in my hometown Taiwan. It opens a wonderful and unforgettable journey for me. Also, thanks to my best friends Angela Lee and Mindy Kung who always share their great ideas and passion to bring me the courage. During these two year. 政 治 大. journey, I got chance to suffer the impossible challenge, frustration, but also learn to defeat. 立. obstacles and overcome my weaknesses.. ‧ 國. 學. Most importantly, I want to grant my thankful to my adviser professor Foo Nin Ho who helps. ‧. me to achieve the IMBA final mission-impossible dissertation on time. He always spends time to instruct me and share his precious knowledge and experiences. Indeed, I am not only. y. Nat. er. io. sit. strongly inspired from Professor Ho’s professional academic and pragmatic knowledge, but also learnt from him about the “Gung Ho” spirit which is my secret of success to complete my. n. al. Ch. i n U. v. IMBA journey and thesis perfectly. Last but not least, I want to thank all IMBA staff and. engchi. IMBAers who are all important to bring me such extraordinary experience of my life.. i .
(4) . Abstract How Laptop Materials Design Affect Taiwanese Consumer Purchase Behavior By Yaru Chang In Taiwan, the laptop market is much matured with fierce price competition. It seems the most. 政 治 大. important differentiation features of laptop industry are brand, price band and laptop design. 立. and look. Therefore, the objective of the research is to find out the most important feature to. ‧ 國. 學. affect consumer purchase behavior. Also, regarding to laptop design, company always has limited resource to make the best product design decision. Hence, I will try to find the best. ‧. laptop material combination. I will adopt perceptual map, conjoint analysis and run market. Nat. sit. y. simulation from research results to understand consumer preference regarding to above. n. al. er. io. features. Indeed, the perceptual map shown Apple and Sony are ranked as top 2 preferred. i n U. v. brands with premium design, innovation, quality and performance. Furthermore, according to. Ch. engchi. the conjoint result, brand is the most important feature and consumer prefer low price band between NTD$18,000~$24,000. However, it shows inverse relationship between brand preference and Taiwan market brand distribution. This is due to laptop brands distinction is not strong enough while compared with good price laptop offered in the market. Therefore, I conclude price band is actually the most important features to affect Taiwanese consumer purchase behavior. Further, consumers prefer pure Metal laptop and they care more about A cover (lid cover) material design than C cover. Therefore, I will suggest the best product design is the A cover with Metal and C cover with Plastics which could help company to gain incremental market share based on market simulation results. ii .
(5) . TABLE OF CONTENTS. 1.1. Research Background and Motivation ....................................................................... 1. 1.2. Purpose and Objective of the Study ........................................................................... 1. 政 治 大. Preliminary Research Study ............................................................................................ 2. 2.1. 立. Taiwan Laptop Market Overview ............................................................................... 2. 學. 2.1.1 Brand Distribution .................................................................................................. 2. ‧. Price Band Distribution .......................................................................................... 2. 2.1.3. Market Trend (Customer is the Boss) ..................................................................... 3. al. n. 2.3. sit. io. 2.2. y. Nat. 2.1.2. er. 2.. Introduction ...................................................................................................................... 1. ‧ 國. 1.. i n U. v. Product Design Dilemma ........................................................................................... 4. Ch. engchi. Factors Affect TWN Consumer Laptop Purchase Behavior....................................... 4. 2.3.1. Situational Factors .................................................................................................. 4. 2.3.2. Personal Factors...................................................................................................... 5. 2.3.3. Psychological Factors ............................................................................................. 6. 2.3.4 Social Factors ......................................................................................................... 7. iii .
(6) . Research Methodology ..................................................................................................... 9. 3.1. Research Design ......................................................................................................... 9. 3.1.1. Hypothesis and Assumption ................................................................................... 9. 3.1.2. Target Segment ....................................................................................................... 9. 3.1.3. Target Survey Pool ............................................................................................... 10. 學. 3.2.2. Conjoint Analysis ................................................................................................. 11. 3.2.3. Survey questionnaire design ................................................................................. 11. ‧. Perceptual Map ..................................................................................................... 10. y. sit. io. al. v. Survey Results ................................................................................................................. 15. n. 5.. 3.2.1. Nat. 4.. ‧ 國. 3.2. 政 治 大 Research Method ...................................................................................................... 10 立. er. 3.. Ch. engchi. i n U. 4.1. General Information ................................................................................................. 16. 4.2. Perceptual map ......................................................................................................... 17. 4.3. Conjoint Analysis Result .......................................................................................... 18. 4.4. Market Simulation Results ....................................................................................... 19. Survey Analysis ............................................................................................................... 20. 5.1. General Information ................................................................................................. 20 iv .
(7) . 5.1.1. Gender Distribution .............................................................................................. 20. 5.1.2. Age Distribution: .................................................................................................. 20. 5.1.3 Salary Distribution: (TWD$ , Monthly) ............................................................... 20. 5.1.4. Occupation Distribution ....................................................................................... 20. 5.1.5. Brand distribution ................................................................................................. 21. 政 治 大 Purchase Objective ............................................................................................... 21 立. 學. ‧ 國. 5.1.6. Perceptual Map ......................................................................................................... 22. 5.3. Conjoint Analysis ..................................................................................................... 23. ‧. 5.2. y. Nat. 5.3.2. A Cover and C cover Material Average Importance............................................. 24. n. al. er. sit. Average Importance Among Four Attributes........................................................ 23. io. 5.3.1. Ch. engchi. i n U. v. 5.3.3 Price Band Preference ($TWD) ............................................................................ 25. 5.3.4. 5.4. Brand Preference .................................................................................................. 26. Market Simulation Analysis ..................................................................................... 27. 5.4.1. A/C Cover Material Design Comparison ............................................................. 28. 5.4.2. What Is the Consumer Willing to Pay Varied from Cover Material Design?....... 29. 5.4.3. What Is the Best Combination Laptop Cover Design with Maximum Market v .
(8) . Share? ................................................................................................................... 31. 6.. Conclusion ....................................................................................................................... 33. Reference ................................................................................................................................. 34. Appendices .............................................................................................................................. 35. 立. 政 治 大. ‧. ‧ 國. 學. n. er. io. sit. y. Nat. al. Ch. engchi. i n U. v. vi .
(9) . List of Figures and Tables Figure 1: Taiwan Market Brand Distribution ............................................................................. 2 Figure 2: Taiwan Price Band Distribution .................................................................................. 2 Figure 3: Top 5 Search Laptops .................................................................................................. 3 Figure 4: A/C Cover ................................................................................................................... 9 Figure 5: ACA Pairs.................................................................................................................. 13. 政 治 大. Figure 6: ACA Calibration........................................................................................................ 13. 立. Figure 7: General Information Results ..................................................................................... 16. ‧ 國. 學. Figure 8: Positioning Map Results ........................................................................................... 17 Figure 10: Conjoint Features Average Importance ................................................................... 24. ‧. Figure 11: A/C Cover Average Importance .............................................................................. 25. Nat. sit. y. Figure 12: Price Band Average Importance .............................................................................. 26. n. al. er. io. Figure 13: Brand Average Importance...................................................................................... 26. i n U. v. Figure 14: Average Market Share 1 .......................................................................................... 32. Ch. engchi. Figure 15: Average Market Share 2…………………………………………………………..32. Table 1: A/C Cover Price Band Range ..................................................................................... 14 Table 2: Features & Brands of Perceptual Map ........................................................................ 17 Table 3: ACA OLS Summary Results ...................................................................................... 18 Table 4: Market Simulation Results ......................................................................................... 19 Table 5: Perceptual Data ........................................................................................................... 22 Table 6: Brand Strength and Weakness .................................................................................... 23 Table 7: Brand Preference Comparison .................................................................................... 27 vii .
(10) . Table 8: A1A2 vs. B1B2 (Market Share) ............................................................................... 29 Table 9: A2A3 vs. B2B3 (Market Share) ................................................................................. 30 Table 10: Average Market Share Simulation ............................................................................ 31. 立. 政 治 大. ‧. ‧ 國. 學. n. er. io. sit. y. Nat. al. Ch. engchi. i n U. v. viii .
(11) . 1. Introduction 1.1 Research Background and Motivation Observe the Taiwan laptop market; it is not hard to aware the price is the key competitive point. Wandering around the website, 3C store, traditional stores and electronic shows, it’s clear to see how strong and fierce the price war around. Also, each brand offers “me-too” product with similar specification. Obviously, the only difference between each brand will be. 政 治 大. the design and look of laptops. Indeed, the most basic way to measure the laptop design is the. 立. material being used. Normally, there are three main materials which are Plastics, Metal and. ‧ 國. 學. Glass. And it makes me wondering is price the most important competitive advantage of the market? Or the design and look of the laptop is the most critical concern for the consumer?. ‧. Therefore, the motivation of this thesis is that I am eager to know which factor is most. Nat. sit. n. al. er. io. purchase decision.. y. important between Price, Material, or Brand to influence Taiwanese consumer to make laptop. 1.2 Purpose and ObjectiveCof the Study. hengchi. i n U. v. The objective of this thesis is to find out what is the most important feature between price, laptop material design, and brand of the laptop while Taiwanese consumer making the purchase decision. Meanwhile, I will focus on laptop material design to further understand consumer preference and contribute the results to product design team of laptop industry.. 1 .
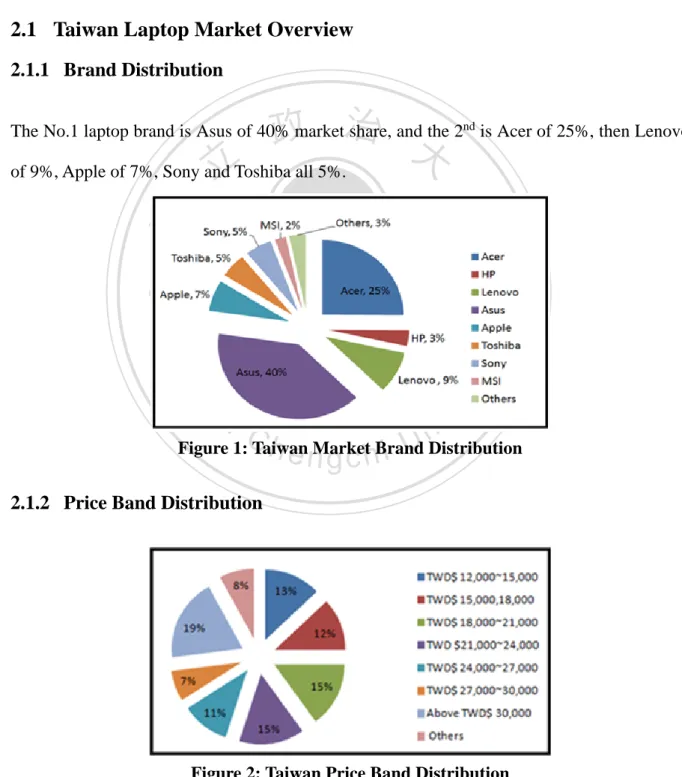
(12) . 2. Preliminary Research Study I would base on three angles which are market, consumer preference, and product design perspective to design the survey for analysis.. 2.1 Taiwan Laptop Market Overview 2.1.1 Brand Distribution. 政 治 大. The No.1 laptop brand is Asus of 40% market share, and the 2nd is Acer of 25%, then Lenovo. 立. of 9%, Apple of 7%, Sony and Toshiba all 5%.. ‧. ‧ 國. 學 er. io. sit. y. Nat. al. n. v i n C h Market Brand Figure 1: Taiwan e n g c h i U Distribution. 2.1.2 Price Band Distribution. Figure 2: Taiwan Price Band Distribution 2 .
(13) . TWD$18,000~21,000 and TWD$21,000~24,000 and Above TWD$30,000 are the main price band; that is, there are basically two main laptop consumer group. One aim to low cost laptop (1/3 of market) ,and the other aim to premium laptop with high price band. . 2.1.3 Market Trend (Customer is the Boss) Analyze Taiwan laptop price band distribution from Figure 2, the price band of TWD$18,000~24,000 accounts for almost one third of the market share. However, it is very. 政 治 大. interesting to see there is almost 20% people prefer the laptop which above TWD$30,000. 立. price band. Further, accordingly to the e-price.com of Figure 3, most top searched laptops. ‧ 國. 學. from online users are the premium laptops with good design, big brand company, with higher price band level. Therefore, it seems consumers tend to prefer laptop with good design even it. ‧. positioned at higher price band.. n. er. io. sit. y. Nat. al. Ch. engchi. i n U. v. Figure 3: Top 5 Search Laptops. 3 .
(14) . 2.2 Product Design Dilemma Since price war is fierce in Taiwan PC market, the most important thing of product design stage for Taiwanese top two brands: ASUS and Acer is always cost, cost, and cost! Therefore, it is very important to make the best decision to utilize the limited resource and budget of product design. For instance, should we use Plastics or Metal? Should we use Plastics for laptop covers to save cost and enhance the panel type with better resolution? That is, there is. 政 治 大 am very curious to know the laptop cover material design. What if we could only use Metal 立. always the trade-off between laptop specifications, materials for product design stage. And I. ‧ 國. 學. on A cover (lid) or C cover (keyboard) due to cost constraint? What material type such as Plastics, Glass and Metal will be consumer’s preference? Will consumer willing to purchase a. sit. y. Nat. answer and that will be the key part of the research.. ‧. better material laptop with higher price band? Only the consumer could tell us the right. er. io. 2.3 Factors Affect TWN Consumer Laptop Purchase Behavior. al. n. v i n C h consumer purchase From the observation of Taiwan laptop e n g c h i U behavior, I conclude as below: 2.3.1 Situational Factors Physical: consumer touch the laptop and feel the texture, also the atmosphere and areas around such as the layout design, store decoration , the sales or representative, the music played, and the location of the store are all related. For example, people always attract by beautiful or special design or color laptops while they entering into a PC shops. Also, if the shop decoration could enhance the brand or laptop design image, it would really affect the consumer purchase 4 .
(15) . behavior strongly.. Time: Whether the consumer has the urgent need of the laptop would be a factor. If a consumer is in urgent needs, he may purchase for a very basic or select the top-sale model due to time constraint. Another good example will be limited time discount promotion or electronics exhibition, consumer not only is very price sensitive but also has strong demand triggered by finding the best deal.. The reason of the purchase:. 立. 政 治 大. ‧ 國. 學. Different purchase objective would affect consumer purchase behavior. For instance, to purchase a birthday present, the consumer will be very carefully chose a good quality laptop. ‧. with higher price band. On the other hand, if it’s for home basic use only, consumer will aim. y. Nat. er. io. Mood:. sit. for entry laptop with low cost accordingly.. al. n. v i n If consumer is in a good mood, C theyhwill be less pickyUand more positive to check the laptop engchi products. Also, they would lower down the acceptance level of laptop quality and cost. But if consumer is in angry or negative mood, it is almost impossible for consumer to purchase the laptop and they will not feel satisfied even with a good laptop product.. 2.3.2 Personal Factors Self-concept: Consumer will need to find the identity and feel connected with the product. For instance, some people choose white and premium look to represent their own style is elegant and 5 .
(16) . high-class. Gamer would prefer powerful and battle- look design laptop with the backlit keyboard as professional gamer style.. Lifestyle: Lifestyle would affect consumer’s criteria of laptop purchase behavior. That is, people who love to hang out with friends would prefer the portable slim design laptop. Also, they would care more about laptop design and look; for people who love to stay home would purchase for. 政 治 大 design and look; for people who are gamers would focus more on CPU performance and 立. bigger screen size with good audio performance for entertainment and less care about laptop. ‧. ‧ 國. Gender:. 學. graphic rather than the look as well.. Normally, females care more about laptop appearance whereas males care more about. y. Nat. sit. performance and price. Also, females prefer elegant look and colorful design but males prefer. n. al. er. io. simple and mechanical design.. Age and stage of life:. Ch. engchi. i n U. v. Young people and students will aim for entry level with low cost laptop. Middle age people would aim for functional laptop with better quality such as entertainment or financial help. Elder people may not purchase the laptop but get it from their children as second hand laptop.. 2.3.3 Psychological Factors Learning: New technology such as touch panel, new apps, Cloud service, and social network would attract people to purchase the laptop if they think it could benefits their life. However, it could 6 .
(17) . also make people avoid to use and purchase the laptop if they don’t like the new technologies at all.. Maslow’s Hierarchy of Needs theory: At lower level of Maslow theory, consumer will prefer low cost, entry level laptop; at middle level, consumer will prefer premium design, good quality and performance laptop. At the top of the pyramid, consumer will aim for luxurious laptop with extremely high level of. 政 治 大 theater, special texture design and look like Acer Ferrari edition. 立. specifications such as high resolution (Full HD), Dolby audio sound with premium home. ‧ 國. 學. Attitude: (Mental positions). How consumer value the laptop would be the attitude to position the laptop criteria they want.. ‧. For instance, 宅男 cares more about the quality and function of the laptop over the design. y. Nat. sit. and look since they always use it at home for long time. Furthermore, most of them are tech. n. al. er. io. geeks and fevers. They will do the evaluation report of laptop performance analysis by. i n U. v. themselves before the purchase. As for gamer group, they will aim for good graphic and. Ch. engchi. performance laptop. On the other hand, for office lady, they tend to prefer the design and look over the specifications.. 2.3.4 Social Factors Consumer‘s culture: Normally, Asian prefers colorful notebooks whereas European and Pan America consumer prefer dark and simple design look such as black and gunmetal laptops. In Taiwan, especially you can see Taiwanese females prefer to have pink laptop with cute and colorful design such as Hello kitty. You could also see males prefer to put some special stickers with colorful 7 .
(18) . design laptop as well.. Reference group: Taiwanese would be influenced strongly by celebrity endorsement of the product. For instance, very popular singer “A Mei” represents for ASUS for T100 product and got a great attention and sales. Also, if a laptop brand be used from popular actor or actress in Taiwanese popular drama series, it would also be a hot product easily.. Opinion leaders:. 立. 政 治 大. In Taiwan, people love to post their purchase laptop experience and evaluation insight on. ‧ 國. 學. website such as mobile 01 (website). Also, many professional users such as gamer or geek would conduct the performance testing and release the report online for discussion. They. ‧. usually are the key person to influence Taiwanese consumer purchase behavior.. n. er. io. sit. y. Nat. al. Ch. engchi. i n U. v. 8 .
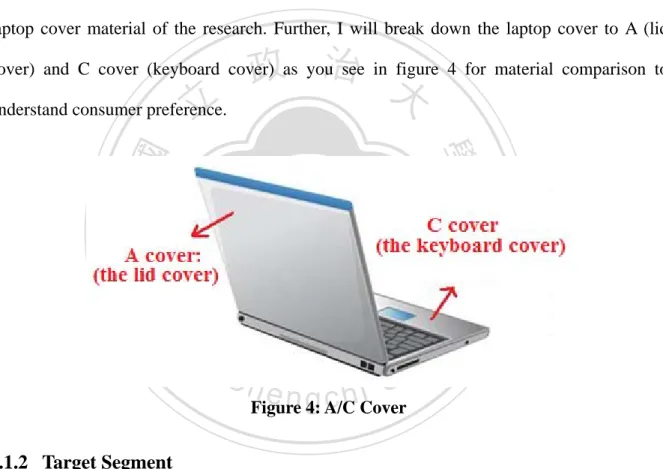
(19) . 3. Research Methodology 3.1 Research Design 3.1.1 Hypothesis and Assumption In order to find out what is the most important feature to influence laptop consumer purchase behavior, I will focus on key differentiation features in Taiwan PC market: Brand, price band, laptop cover material of the research. Further, I will break down the laptop cover to A (lid. 政 治 大. cover) and C cover (keyboard cover) as you see in figure 4 for material comparison to. 立. understand consumer preference.. ‧. ‧ 國. 學. n. er. io. sit. y. Nat. al. Ch. engchi. i n U. v. Figure 4: A/C Cover. 3.1.2 Target Segment The research would focus on middle age people who has disposable income, and we would want to exclude gamers who cares more about specifications and don’t consider the laptop design normally.. 9 .
(20) . Nationality: Taiwanese Age: 25~ 45 Financial status: with disposable income. 3.1.3 Target Survey Pool We would focus on the high potential of laptop buyers of “ 2014 Taiwan Spring electronics Show” attendees.. 3.2 Research Method. 立. 政 治 大. ‧ 國. 學. 3.2.1 Perceptual Map. It’s derived from customer perceptions of brand image via varied attributes with different. ‧. levels of preferences. It could help to measure the brand position from consumer perspective.. sit. y. Nat. io. n. al. er. 3.2.1.1 Attributes. (1). Cost-performance ratio (2). Quality. Ch. engchi. i n U. v. (3). Performance (4). Customer-Oriented (5). Design (6). Innovation. 3.2.1.2 Brands Select from Taiwan top 6 brands: Acer, Apple, Asus, Lenovo, Sony, and Toshiba. 10 .
(21) . 3.2.2 Conjoint Analysis It’s a systematic approach to understand the relative preference level with several attributes of a product at the same time, and find the key attribute (trade-off) in early product design stage.. 3.2.2.1 Attributes (1) A cover material (the lid): Plastics, Metal or Glass (main material in market). 政 治 大 (3) Brand: Acer, Apple, Asus, Lenovo, Sony, and Toshiba (Taiwan top 6 brands) 立. (2) C cover material (keyboard cover): Plastics, Metal (main material in market). ‧ 國. 學. (4) Price band: (TWD$): define by Taiwan laptop price band distribution (Figure 2) (4.1) Below 18,000. ‧. (4.2) 18,000~21,000. sit. y. Nat. (4.3) 21,000~24,000. al. n. (4.6) Above 30,000. io. (4.5) 27,000~30,000. er. (4.4) 24,000~27,000. Ch. engchi. i n U. v. 3.2.2.2 Market Simulation Analysis Use conjoint analysis data to find best product features combination by market share review.. 3.2.3 Survey questionnaire design 3.2.3.1 General information collect Gender, Age, Occupation, salary, objective of purchase, laptop brand owned from respondents. 11 .
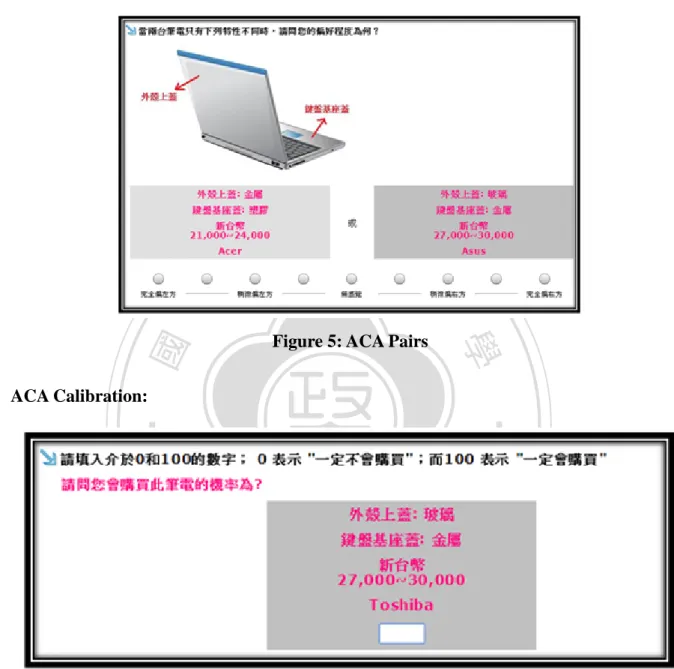
(22) . 3.2.3.2 Perceptual Map Part 1: Evaluate the preference level (5 levels of each brand) of 6 brands together Part 2: Evaluate the matching level (5 levels) of each brand in each feature together.. Features: (1). Cost-performance ratio (2). Quality (3). Performance. 立. (4). Customer-Oriented. ‧. ‧ 國. (6). Innovation. 學. (5). Design. 政 治 大. sit. y. Nat. 3.2.3.3 Conjoint Analysis. n. al. er. io. ACA Ratings: rate the preference level within each feature elements. i n U. v. ACA Importance: rate the importance level within each feature elements. Ch. engchi. ACA Pairs: select the preference level between 2 products with paired or more features ACA Calibration: provide the possible purchase rate of assigned combined-features-product. Example Question: If two laptops were acceptable in all other ways, how important would this difference be to you? (9 Levels from left to the right). 12 .
(23) . ACA Pairs:. 政 治 大. 立. ‧ 國. 學. Figure 5: ACA Pairs. ACA Calibration:. ‧. n. er. io. sit. y. Nat. al. Ch. engchi. i n U. v. Figure 6: ACA Calibration. 3.2.3.4 Market Simulation Utilize the results of conjoint analysis to simulate market share of each product.. 3.2.3.4.1 Price Band Concept Basically set by market price, and I expect the price band of Metal/Plastics or Plastics/Metal will between pure Metal and pure Plastics price band as below details: 13 .
(24) . Table 1: A/C Cover Price Band Range. 3.2.3.4.2 Product Combination Select Concept. 政 治 大. According to the market, the most common laptop materials are Plastics, Metal and Glass.. 立. Therefore, I assume each brand provides three types of A & C cover design which are pure. ‧ 國. 學. Plastics, pure Metal, and A cover of Glare with C cover of Metal design. Except for Apple and Sony, I exclude the pure Plastics product since both brands aimed for premium design without. ‧. providing pure Plastics laptops. Further, I only select one brand: Acer to replace the pure. y. Nat. sit. Plastics laptop to Plastics/Metal or Metal /Plastics (A/C cover) of cover material combination. n. al. er. io. to understand consumer preference. Furthermore, in order to find out what is the customer. i n U. v. willing to pay range regarding to varied A/C cover material design. I will adopt the price band. Ch. engchi. range to do market simulation scenario for comparison. In sum, there are two reference data group classified by Acer A/C cover combination of Plastics and Metal as below:. ✽ A Groups: Acer A/C Cover is Metal/Plastics, price band increase progressively from A1 to A3. ✽ B Groups: Acer A/C Cover is Plastics /Metal, price band increase progressively from B1 to B3. 14 .
(25) . 4. Survey Results We got 101 surveys and filter out invalid data as below criteria: 1. People who are gamer 2. People without disposable income 3. People who is not Taiwanese 4. People who did not complete the survey. 治 政 大survey results and analysis. Hence, we got 50 valid survey data to represent following 立 ‧. ‧ 國. 學. n. er. io. sit. y. Nat. al. Ch. engchi. i n U. v. 15 .
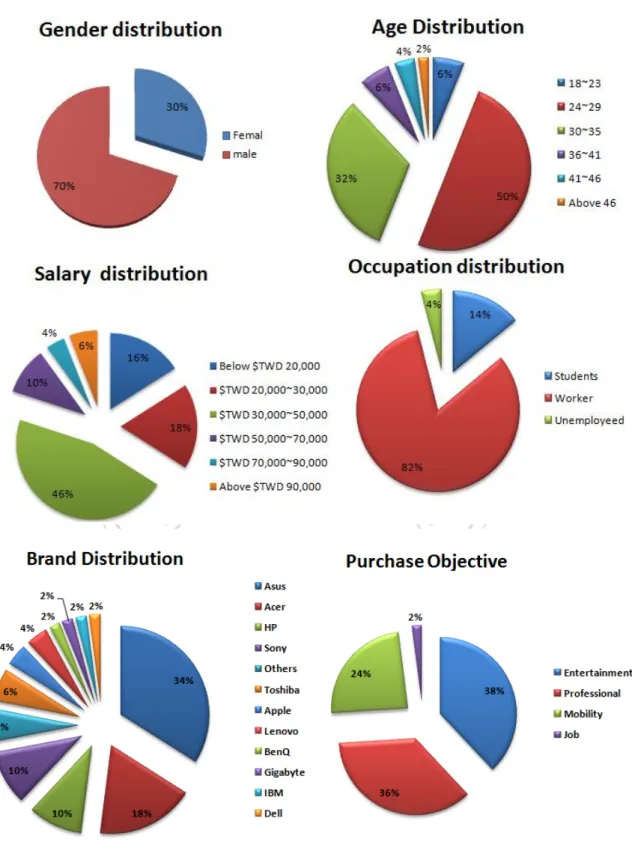
(26) . 4.1 General Information. 立. 政 治 大. ‧. ‧ 國. 學. n. er. io. sit. y. Nat. al. Ch. engchi. i n U. v. Figure 7: General Information Results 16 .
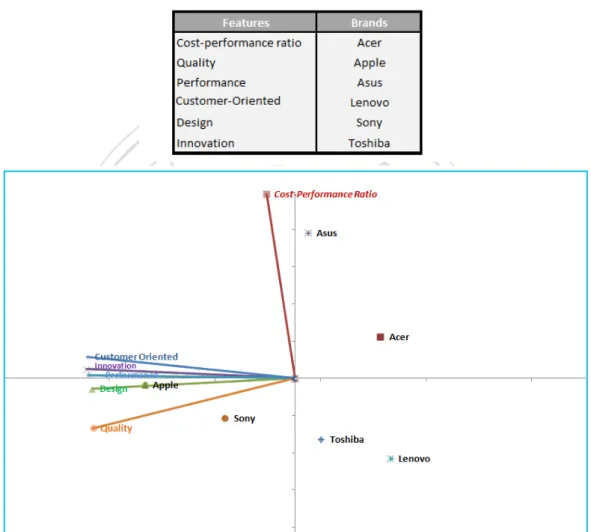
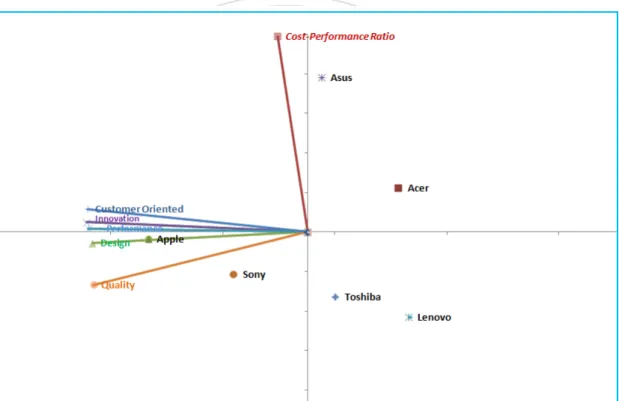
(27) . 4.2 Perceptual map Compare each feature with six brands from consumer perspective:. Table 2: Features & Brands of Perceptual Map. 立. 政 治 大. ‧. ‧ 國. 學. n. er. io. sit. y. Nat. al. Ch. engchi. i n U. v. Figure 8: Positioning Map Results Result: Cost performance: Asus > Acer > Apple > Sony > Toshiba > Lenovo Design: Apple > Sony > Toshiba >Asus > Acer > Lenovo Innovation: Apple > Sony > Asus > Toshiba > Lenovo = Acer Performance: Apple > Sony > Asus > Toshiba > Acer > Lenovo. 17 .
(28) . Quality: Apple > Sony > Toshiba > Asus > Lenovo > Acer Customer Oriented: Apple > Sony > Asus > Toshiba > Acer > Lenovo. 4.3 Conjoint Analysis Result Table 3: ACA OLS Summary Results. 立. 政 治 大. ‧. ‧ 國. 學. n. er. io. sit. y. Nat. al. Ch. engchi. i n U. v. 18 .
(29) . 4.4 Market Simulation Results ✽ A Groups: Acer A/C Cover is Metal/Plastics, price band increase progressively from A1 to A3. ✽ B Groups: Acer A/C Cover is Plastics/Metal, price band increase progressively from B1 to B3. 政 治 大. Table 4: Market Simulation Results. 立. ‧. ‧ 國. 學. n. er. io. sit. y. Nat. al. Ch. engchi. i n U. v. 19 .
(30) . 5. Survey Analysis 5.1 General Information 5.1.1 Gender Distribution Males is the major laptop consumers of 70% where as females are 30% only. It also shows male is much priced sensitive and interested in laptop exhibition to find good deal. (Figure 7). 政 治 大. 5.1.2 Age Distribution:. 立. People between the age of 24~29 is the key laptop consumer of 50%, and 30~35 is the second. ‧ 國. 學. major age group. These groups are our target consumer who would relatively care more about the brand identity and laptop design since they are very energetic age groups. (Figure 7). ‧ sit. y. Nat. 5.1.3 Salary Distribution: (TWD$ , Monthly). n. al. er. io. The average monthly salary level is between TWD$30,000~50,000 which is the group who. i n U. v. has the average disposable income to make a reasonable laptop purchase. Only 16% of. Ch. engchi. people’s monthly salary is below TWD$20,000, and they will be more price sensitive than other groups. That’s the reason to filter out people without disposable income, because most of them would mainly focus on the price of laptops while making the purchase decision. To conclude, Taiwanese are able to purchase middle or high level price band laptops. (Figure 7). 5.1.4 Occupation Distribution The main group is office worker with unemployed group whereas student group is 14% only. The office worker is the key segment of market and the core group of this research. Since the price band will not be the only reason of their laptop purchase decision. (Figure 7) 20 .
(31) . 5.1.5 Brand distribution. 立. 政 治 大. ‧ 國. 學. As timeline perspective, I compare the TWN market brand distribution (Figure 1) as present with brand owned by survey respondents (Figure 9) as previously timeline to see the brand. ‧. preference trend. We could see HP is almost vanishing in consumer market since it focuses on. Nat. sit. y. commercial market now. Therefore Asus and Acer grasp the market share from HP and still. n. al. er. io. dominate the market. Apple and Lenovo also gain some market share which reflects the two. i n U. v. extremely market trend that consumers either prefer low cost laptop or aim for premium and. Ch. engchi. high class laptops. As for Sony and Toshiba still kept fixed market share due to Taiwanese still regards good quality laptop of Japanese brand. In sum, Asus and Acer still dominate the market with fierce price competition, but we could also see people gradually aim for premium laptops compared with 3~5 years ago. Figure 9. 5.1.6 Purchase Objective Refer to Figure 7, Taiwanese laptop purchase objective are evenly distributed mainly for entertainment and professional function usage, and then opt to mobility. It also linked with Taiwanese cultural and lifestyle. As cultural perspective: the collectivism, people loved to 21 .
(32) . share life and hang out with friends in café or for business discussion. For lifestyle perspective, Taiwanese tend to care more about life and work balance now, so they loved to use laptop for entertainment such as social connection or enjoy the movies anytime. Further, they loved to take the laptop to café or outdoors anytime, anywhere for fun.. 5.2 Perceptual Map. 立. 政 治 大. ‧. ‧ 國. 學. n. er. io. sit. y. Nat. al. Ch. engchi. i n U. v. Table 5: Perceptual Data. 22 .
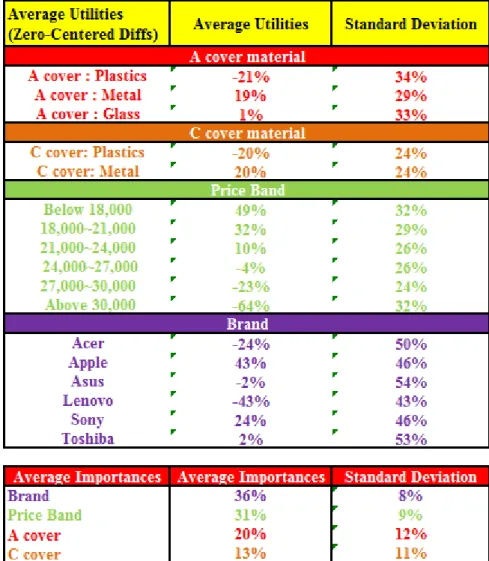
(33) . *Perceptual Data comparison: Cost performance: Asus > Acer > Apple > Sony > Toshiba > Lenovo Design: Apple > Sony > Toshiba >Asus > Acer > Lenovo Innovation: Apple > Sony > Asus > Toshiba > Lenovo = Acer Performance: Apple > Sony > Asus > Toshiba > Acer > Lenovo Quality: Apple > Sony > Toshiba > Asus > Lenovo > Acer Customer Oriented: Apple > Sony > Asus > Toshiba > Acer > Lenovo. 政 治 大 Based on perceptual map and data, I conclude each brand core position and strength and 立. ‧ 國. 學. weakness upon consumer perspective as below:. Table 6: Brand Strength and Weakness. ‧. n. er. io. sit. y. Nat. al. 5.3 Conjoint Analysis. Ch. engchi. i n U. v. 5.3.1 Average Importance Among Four Attributes According to Figure 10, among four attributes (Brand, Price band, A Cover- lid cover, C cover-K/B cover), brand is the most important feature for consumer, and price band is the 2nd, third is A cover material design and the least important is C cover material design. It could be explained by Taiwan laptop matured market which laptops are with similar specifications. Brand is an important differentiate point and usually along with laptop design. Further, from culture perspective, Taiwanese culture changed from conservative to open mind in recent years. People will care their self-esteem and personal image a lot which would directly linked 23 .
(34) . with laptop brands they used. Therefore, Brand is the most important factor for consumer to consider of purchase decision. As for price, it is still a critical feature for consideration due to fierce market competition over the laptop cover design. Further, A cover will be the 1st look and image of a person’s style yet the C cover (keyboard cover) is less critical since it is the internal part of laptop which people not usually aware the look of it.. 立. 政 治 大. ‧. ‧ 國. 學. n. er. io. sit. y. Nat. al. i n U. v. . Figure 10: Conjoint Features Average Importance. Ch. engchi. 5.3.2 A Cover and C cover Material Average Importance Accordingly to Figure 11, consumers strongly prefer A cover with Metal and the 2nd favorite is Glass, and least like A cover with Plastics. Normally, the texture and touch feeling of Metal and Glass is better than Plastics. Also, both Metal and Glass with premium look and better quality performed. Obviously, Metal is definitely the top star of cover design of its lightness and beautiful pattern covered. On the other hand, the benefits of Glass are the toughness and the high class crystal-like look. However, Glass is quite a new material in market but with certain technical constraint and higher level price band than others. As for Plastics, there is a 24 .
(35) . negative value correspondently with Metal. That is, consumer will not purchase Plastic laptop as long as they have Metal or Glass as another option. For C cover, consumers prefer Metal strongly and don’t like Plastics at all. I think besides of above reasons, C cover with Metal could also split the heat of laptop effectively whereas Plastics would cause the computer overheat. Also, Metal are usually lighter than Plastics within same standard of sturdy level. That is why consumer doesn’t like Plastic if they have Metal as the option.. 立. 政 治 大. ‧. ‧ 國. 學 er. io. sit. y. Nat. al. v. n. Figure 11: A/C Cover Average Importance. Ch. e. ngch 5.3.3 Price Band Preference ($TWD). i. i n U. According to Figure 12, 90% of price band are below $24,000. That is, consumers prefer low price laptops mainly below 18,000 and secondly price band is between 18,000~21,000. Further, there is a negative value once the laptop price is over $24,000 ~ $27,000 price band onwards and a very strong negative value reflect if over $30,000. It shows Taiwanese consumer still cares a lot about price band and strongly not willing to pay high price for a laptop.. 25 .
(36) . 政 治 大. Figure 12: Price Band Average Importance. 立. ‧ 國. 學. 5.3.4 Brand Preference 5.3.4.1 Brand Image Rank. ‧. n. er. io. al. sit. Nat. (1). Apple (2).Sony (3).Toshiba (4) Asus (5) Acer (6) Lenovo. y. Brand Image measure by consumers ranked as below (Figure 13) :. Ch. engchi. i n U. v. Figure 13: Brand Average Importance 26 .
(37) . 5.3.4.2. Brand Preference Table 7: Brand Preference Comparison. However, by compare between consumers owned brand distribution and ACA brand. 政 治 大. preference from survey as well as the Taiwan brand market share of Table 7. It is clearly to. 立. see the brand preference has inverse relationship with market share achieved. That is,. ‧ 國. 學. consumers prefer Apple, Sony and Toshiba (Group1) but most of them still purchase for Acer, Asus and Lenovo (Group 2). The clear differentiation between these two brand groups is the. ‧. price level and A & C cover material design. Apparently, group 1 position at higher price band. y. Nat. sit. and premium material design whereas group 2 mainly focuses on good price with basic. n. al. er. io. material design. That is why the higher the brand value is, the higher price level and the lower market share it would have in Taiwan Laptop market.. Ch. engchi. i n U. v. 5.4 Market Simulation Analysis ✽ A Groups:. Acer A/C Cover is Metal/Plastics, price band increase progressively from A1 to A3. ✽ B Groups: Acer A/C Cover is Plastics/Metal, price band increase progressively from B1 to B3. 27 .
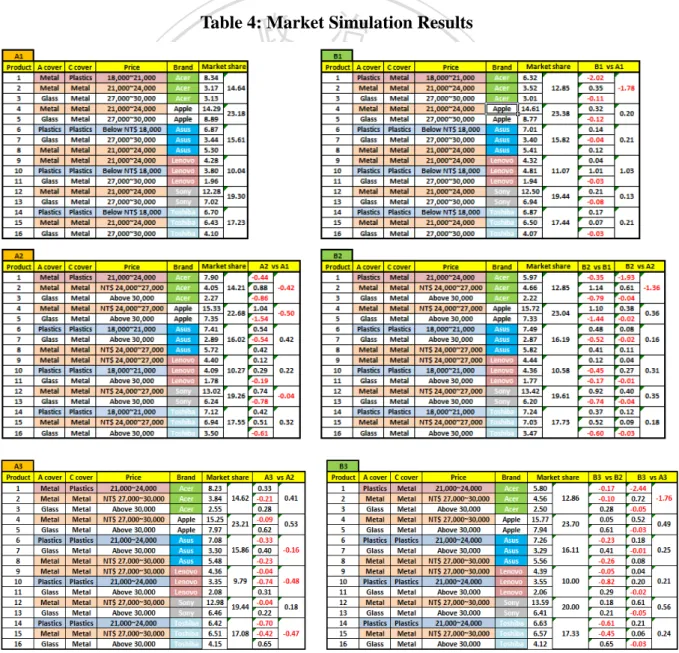
(38) . 5.4.1 A/C Cover Material Design Comparison By compare market share of Acer between A1/B1 & A2/B2/ & A3/B3 of Table 4 , it is very clear to see consumer prefer A cover with Metal and C cover with Plastics of laptop material design with 2% incremental market share growth. That is, consumer will prefer to purchase either Metal/Plastics or Glass/Metal with increased demand whereas decrease the demand for pure Metal and pure Plastics laptops. Furthermore, the lower the price band of Metal/Plastics. 政 治 大 reflects that consumer would rather spend less money to purchase Metal/Plastics laptop rather 立. laptop, the higher incremental demand of Metal/Plastics and Glass/Metal laptops achieved. It. ‧ 國. 學. than pure Metal one. Also, consumer would rather spend more money to purchase Glass/Metal laptop and avoid purchasing pure Plastics laptops. Furthermore, consumer cares. ‧. A cover more than C cover due to A cover is important for consumer to associate their own. sit. y. Nat. personality or style. As long as the A cover made with Metal, they will less prefer to purchase. io. er. the pure Plastics or pure Metal laptops. Therefore, they would either purchase Metal/Plastics laptop or pay more for Glass/Metal laptop then. That is, the Metal/Plastics laptop will grasp. al. n. v i n the market share from both pureCMetal pure Plastics laptop and enhance the demand of U h e and i h ngc Glass/ Metal laptops of all brands in the market correspondently.. 28 .
(39) . 5.4.2 What Is the Consumer Willing to Pay Varied from Cover Material Design? Table 8: A1A2 vs. B1B2 (Market Share). 立. 政 治 大. ‧. ‧ 國. 學 sit. y. Nat. n. al. er. io. By compare A1with A2 and B1 with B2 of shown on Table 8 , both groups get same result. i n U. v. that the market share of Metal/Plastics, Plastics/Metal and Glass/Metal design were decreased,. Ch. engchi. but the pure Plastics and pure Metal design laptops were increased which reflects that consumer accept for the price band. Therefore, I add up price band level to see the limitation of consumer willing to pay price range of A3 and B3.. By compare A2 with A3 and also B2 with B3 of Table 9, both groups get same implication. That is, the market share of both pure Plastics and pure Metal laptops plump immediately, but while compare B2 and B3, it’s very interesting to see only Sony and Apple had increased market share even with higher price band of pure Metal products. It could be explained by perceptual map and consumer brand preference from survey that both brands’ image are. 29 .
(40) . premium with great design. Also, based on previous ACA study, consumer values brand as the most important feature while selecting laptops. Therefore, consumer willing to pay more compared with other competitors. Table 9: A2A3 vs. B2B3 (Market Share). 立. 政 治 大. ‧. ‧ 國. 學. n. er. io. sit. y. Nat. al. Ch. engchi. i n U. v. To conclude: please refer to below consumer maximum willing to pay: 1. Plastics/Plastics: Up to TWD$ 21,000 2. Metal/ Plastics & Plastics/Metal: Up to TWD$ 21,000 3. Metal/Metal: Up to TWD$ 27,000 4. Glass/Metal: Up to TWD$ 30,000. Further, if we compare between Taiwan price band distribution and A/C cover price range as well as above consumer maximum willing to pay as below Figure 2 and Table 1, we could conclude the consumer willing to pay price range of each material as below: 30 .
(41) . 1. Plastics/Plastics: $6,000~ between 15,000~21,000. 政 治 大. 2. Metal/ Plastics & Plastics/Metal: $3,000~ between 18,000~21,000. 立. 3. Metal/Metal: $6,000~ between 21,000~27,000. ‧ 國. 學. 4. Glass/Metal: $3,000~ between 27,000~30,000. Also, according to the market simulation comparison of Sony and Apple brand, the pay range. ‧. could be enhanced by strong brand value from consumer perspective.. y. Nat. er. io. Market Share?. sit. 5.4.3 What Is the Best Combination Laptop Cover Design with Maximum. al. n. v i n C h Market Share Table 10: Average e n g c h i U Simulation. 31 .
(42) . iFigure 14: Average Market Share 1. Figure 15: Average Market Share 2. By summarize A & B market simulation group with average market share results as Table 10, and classified Plastics/Metal and Metal/Plastics to Plastic market share as “average market. 政 治 大. share 1” as well as classified Plastics/Metal and Metal/Plastics to Metal market share. 立. as ”average market share 2” for comparison. Based on average market share view, we could. ‧ 國. 學. see consumer prefer pure Metal laptop most which occupied almost half of the average market share in market share 1 and gain incremental market share in market share 2. ‧. accordingly. To conclude the consumer preference laptop material design by market share. y. Nat. n. al. er. io. sit. perspective, the best product combination will be the pure Metal material laptop.. Ch. engchi. i n U. v. 32 .
(43) . 6. Conclusion Based on research result and market evaluation, I conclude the most important features upon Brand, Price band, A cover material design (lid cover) and C cover material design (keyboard cover) is the price band. Although from conjoint feature average importance, brand is the most important feature for consumer to make the purchase decision. However, while I compare the brand preference from research respondents with Taiwan market brand. 政 治 大. distribution, there is an inverse relationship between market share and brand preference. It. 立. reflects that consumers regard brand as a very critical feature in their mind, but when they. ‧ 國. 學. take the real purchase action, they actually choose to sacrifice brand as long as a good price offered. This is due to the distinction between laptop brands is not strong enough compared. ‧. with price band offered in the market for consumers. Therefore, I conclude price band is the. Nat. er. io. sit. y. most important feature to affect Taiwanese consumer laptop purchase behavior.. Furthermore, for the objective to maximize the market share, the best laptop material design. n. al. Ch. i n U. v. from market simulation results is the pure Metal laptop design. Also, consumers care more. engchi. about A cover material and less care about C cover material from A & C cover average importance result. Therefore, when company has limited budget to provide pure Metal laptop design, the best product to offer is the A cover with Metal and C cover with Plastics upon consumer preference and market simulation conclusion. It could also help the company to grasp the market share of pure Plastics laptop and pure Metal laptops from competitors with incremental market share and growth. In sum, making a good laptop material design decision will not only attract consumer purchase preference, but also is a powerful strategy to differentiate company itself from other competitors successfully.. 33 .
(44) . Reference Janell D. Townsend, Wooseong Kang, Mitzi M. Montoya and Roger J. Calantone. “Brand-Specific Design Effects: Form and Function” Journal of Product Innovation Management, Volume 30, Issue 5, pages 994–1008, September 2013. Karl T. Ulrich, “Design Is Everything?” Journal of Product Innovation Management, Volume. 政 治 大. 28, Issue 3, pages 394–398, May 2011. 立. Michael G. Luchs, Jacob Brower and Ravindra Chitturi, “Product Choice and the Importance. ‧ 國. 學. of Aesthetic Design Given the Emotion-laden Trade-off between Sustainability and. 29, Issue 6, pages 903–916,November 2012. Nat. sit. y. ‧. Functional Performance” Journal of Product Innovation Management, Volume. er. io. Scott K. Radford and Peter H. Bloch, “Linking Innovation to Design: Consumer Responses to. al. n. v i n Visual Product Newness” C hJournal of ProductUInnovation Management, Volume engchi 28, Issue s1, pages 208–220, November 2011. GFK DATABASE. 34 .
(45) . Appendices Appendix 1:. 立. 政 治 大. ‧. ‧ 國. 學. n. er. io. sit. y. Nat. al. Ch. engchi. i n U. v. 35 .
(46) . Appendix 2:. 立. 政 治 大. ‧. ‧ 國. 學. n. er. io. sit. y. Nat. al. Ch. engchi. i n U. v. 36 .
(47) . Appendix 3:. 立. 政 治 大. ‧. ‧ 國. 學. n. er. io. sit. y. Nat. al. Ch. engchi. i n U. v. 37 .
(48) . Appendix 4:. 立. 政 治 大. ‧. ‧ 國. 學. n. er. io. sit. y. Nat. al. Ch. engchi. i n U. v. 38 .
(49) . Appendix 5:. 立. 政 治 大. ‧. ‧ 國. 學. n. er. io. sit. y. Nat. al. Ch. engchi. i n U. v. 39 .
(50) . Appendix 6:. 立. 政 治 大. ‧. ‧ 國. 學. n. er. io. sit. y. Nat. al. Appendix 7:. Ch. engchi. i n U. v. 40 .
(51)
數據


+7
相關文件
interview and AHP in order, it comes out that this research can describe the correlation between the economic recession and the investment intentions, and this will help the
In order to partition the GPS market into different segments, this paper used purchase motives, product attributes and consumer lifestyle as the variables for market
This thesis will focus on the research for the affection of trading trend to internationalization, globlization and the Acting role and influence on high tech field, the change
The purpose of this research is to explore the important and satisfaction analysis of experiential marketing in traditional bakery industry by using Importance-Performance and
The aim of this research is to design the bus- related lesson plans based on the need of the students of the 3 rd to 6 th grade of an elementary school in remote
The research works are (1) make out the strategic model, (2) make out the technical code of landfill mining and its reclamation, (3) make out the technical code for surveying
In order to serve the fore-mentioned purpose, this research is based on a related questionnaire that extracts 525 high school students as the object for the study, and carries out
This research is based on the consumer decision- making theory, to study what may affect people to join the army force and the intention to enlist oneself in military force.. We
