National Chiao Tung University
Department of Materials Science and Engineering
PhD Thesis
Synthesis and Study of Novel Chemosensing Probes
for Selective Detection of Metal Ions and Ru-Based
Supramolecular Dendrimers for Solar Cell
Applications
對金屬離子選擇性檢測之新穎化學感側探針與含 Ru
樹枝狀超分子做為太陽能應用之合成及研究
Rudrakanta Satapathy (盧達侃)
Advisor: Prof. Hong-Cheu Lin, PhD. (林宏州 教授)
Synthesis and Study of Novel Chemosensing
Probes for Selective Detection of Metal Ions and
Ru-Based Supramolecular Dendrimers for Solar
Cell Applications
對金屬離子選擇性檢測之新穎化學感側探針與含 Ru
樹枝狀超分子做為太陽能應用之合成及研究
Rudrakanta Satapathy (盧達侃)
Advisor: Prof. Hong-Cheu Lin, PhD. (林宏州 教授)
A Thesis submitted to
Department of Materials Science and Engineering
College of Engineering
National Chiao Tung University
In partial fulfillment of the requirement for the degree of
Doctor of Philosophy
In materials science and engineering
(I)
Abstract
The main objective of this dissertation is to synthesize novel chemosensing binding probe for selective detection of metal ions. In the introduction of the thesis we have described about several chemosensing mechanisms and the advantages of polymeric cheosensors over small molecular analogue. Several sensing probes have been developed for selective sensing of
Pb2+, Hg2+, and Zn2+. Here we have developed novel thieno-benzo-imidazole based small
molecules for the sensing of toxic metal ion Pb2+ in aqueous solutions. Again, we discussed
about thieno-imidazole based homopolymer for the colorimetric detection of Hg2+ and
fluorometric detection of Zn2+. Furthermore, we discussed about the amendment of
sensitivity of chemosensing polymers upon variation of their attached imidazole based
pendants. In addition to these novel chemosensing moieties, we synthesized mono, bis, and tris Ru containing thiophene dendrimers for the application in photovoltaic cell.
In the first chapter we synthesized two novel dithieno-benzo-imidazole-based compounds
(M2 and A2), which showed remarkable sensitivities towards Pb2+ by 12-fold enahancement
and 10-fold decay of fluorescence, respectively, in aqueous solutions. Substituent effects of different dithieno-benzo-imidazole-based moieties (M1, M2, A1, and A2) on the quantum
yields, fluorescence lifetimes and sensitivities to Pb2+ along with the reversibilities by S
2-were investigated.
In the second chapter we synthesized novel thieno-imidazole-based polymer P, which
showed both colorimetric, and ratiometric detections of Hg2+ as well as fluorometric
detection of Zn2+ via fluorescence turn-on response with augmented lifetime. Its model
polymer M did not show any such sensing capability under similar conditions, which further
confirmed the unique sensitivity of P towards Hg2+ and Zn2+ via the chelation of metal ions to
both ‘S’ and ‘N’ hetero-atoms.
In the third chapter three novel electron donor-acceptor conjugated polymers (P1-P3) with various imidazole pendants were synthesized, and their excellent photo-physical along with electrochemical properties led them to become suitable transduction materials for chemosensing applications. Herein, polymers (P1-P3) showed remarkable sensing
capabilities towards H+ and Fe2+ in semi-aqueous solutions. Upon titration with H+, polymers
P1 and P2 showed hypsochromic shifts of absorption and PL maxima with enhanced
fluorescence intensities. However, P3 showed diminished abosorption as well as fluorescence intensities under similar conditions due to static quenchning. The anomalous behaviour of P3 compared with P1 and P2 was clarified by the electronic distributions via computational
analysis. Furthermore, P3 (Ksv= 1.03×10⁷) showed the best sensing ability towards Fe2+
compared with P1 (Ksv= 2.01×10⁶) and P2 (Ksv= 4.12×10⁶) due to its improved molecular
wire effect. Correspondingly, fluorescence lifetime of P3 was decreased intensively (almost
11 times) than polymers P1 (4.6 times) and P2 (6.2 times) in the presence of Fe2+. By means
of fluorescence on-off-on tactics, the chemosensing reversibilities in protonation-deprotonation and metallation-demetallation were achieved by triethylamine (TEA) and
disodium salt of ethylenediaminetetraacetic acid (Na2-EDTA)/phenanthroline, respectively,
as the suitable counter ligands. 1H NMR titrations revealed the unique behaviour of P3
compared with P1 and P2. To the best of our knowledge, no reports of Fe2+ sensors were
provided by solo imidazole receptors conjugated to the main chain polymer with diverse sensitivity pattern depending on their attached substituents.
(II)
In the fourth chapter mono (G1RuG1, G2RuG2, G3RuG3), bis (BT2RuG1, BT2RuG2,
BT2RuG3) and tris (TPA3RuG1, TPA3RuG2, TPA3RuG3) ‘Ru’ containing
supramolecular thiophene dendrimers were constructed. Their photophysical, electrochemical and thermal properties were investigated. Due to the donor-acceptor, benzothiadiazole-hexyl thiophene cored architecture in bis ‘Ru’ containing thiophene dendrimers, these showed higher photovoltaic efficiency than other two series. Tris ‘Ru’ containing architecture with terthiophene-triphenylamine core, showed moderate photovoltaic performance due to their star shaped branched structure. Among the three generations (G1-G3) of bis ‘Ru’ containing dendritic series, BT2RuG3 showed the highest solar cell efficiency 0.77% without the aid of any additives or anealing conditions. This solar cell efficiency value is the highest among all metal containing dendritic supramolecule reported so far.
Thus in the conclusion, novel chemosensing probes for the selective and sensitive detection of metal ions has been developed. Amendments of sensitivity pattern upon the variation of substituents were discussed. Synthesis and photovoltaic properties of metal containing thiophene dendrimers were described.
(III) 摘要 本論文的主要目的是合成新型化學感測器結合探測金屬離子的選擇性檢測。在本論 文中,我們介紹了幾個化學感測機制及分析高分子勝過相似結構小分子的原因。針對 感測Pb2+ 和Hg2+,Zn2+ 的幾個化學感測器探針已由此研究開發出來。同時,我們已開 發出在水溶液中針對有毒鉛離子金屬進行感測的新型噻吩苯並咪唑小分子。再者,我 們討論了有關噻吩並咪唑基於比色法檢測Hg2+ 和Zn2+ 的螢光檢測聚合物。此外,我們 探討論改變咪唑基之附屬側鏈結構後聚合物化學感測的靈敏度。除了這些新型化學感 測分子外,我們合成了含單,雙和三Ru金屬的噻吩樹枝狀高分子並應用在光伏電池 中。 在第一章中,我們合成了兩種新型dithieno-苯並咪唑基化合物(M2 和A2),這裡 顯示在水溶液中針對Pb2+ 各別具有 12 倍的螢光強度增加和 10 倍的螢光衰變。不同 dithieno-苯並咪唑基(M1,M2,A1 和A2)的量子產率,螢光壽命和靈敏度的取代基 效應,針對S2-進行了調查,其對Pb2 +檢測是具有可逆性的。 我們在第二章中,合成出新的噻吩-咪唑基的聚合物P,這裡顯示透過色度和比例檢 測,對Hg2+ 以及Zn2+ 的螢光檢測螢光的開啟響應增強其生存週期。它的比較聚合物M 中沒有表現出任何類似的條件下,這進一步證實了在“S”和“N”雜原子通過金屬離子螯 合的情況下,P對Hg2+ 和Zn2+ 具有檢測之能力。 在第三章合成出三種新型電子給體 - 受體與各種咪唑垂吊基的共軛聚合物(P1-P3),其優異的光、物理與電化學性能,使他們成為良好的傳導材料及化學感測的應 用。此外,聚合物(P1-P3 的)對H+ 和Fe2+ 的半水溶性液體表現出其具有明顯的感測 能力。當滴定與H+,聚合物P1 和P2 螢光強度增強,吸收和PL有極大變化。然而,P3 的顯示吸收度減少以及螢光強度下降,這是由於其具有靜態焠滅的情況發生。通過理 論計算分析,P3 電子分佈的異常行為與P1 和P2 的結果不同。此外,與P1(KSV = 2.01×10⁶)和P2(KSV = 4.12×10⁶)相比,P3(KSV = 1.03×10⁷)表現出最好的Fe2+ 感 應能力,此乃由於其提昇的分子導線效應。相對地,在Fe2+存在的條件下,P3 的螢光 壽命降低程度(將近 11 倍)比聚合物P1(4.6 倍)和P2(6.2 倍)有更大的下降。通 過螢光 on-off-on 機制,在質子 - 質子和金屬化及去金屬化的化學感測中,分別得到了 具可逆性的三乙胺(TEA)和乙二胺四乙酸二鈉(NA2-EDTA)/鄰菲羅啉來做為適合 的配位基。氫核磁共振滴定透露P3 與P1-P2 的差異行為。據我們所知,之前並沒有運 用由咪唑受體共軛主鏈聚合物做為Fe2+ 的感測器,且取決於其不同取代基會具有不同 的敏感性。 在第四章,含單(G1RuG1,G2RuG2,G3RuG3),二(BT2RuG1,BT2RuG2, BT2RuG3)和三(TPA3RuG1,TPA3RuG2,TPA3RuG3)“Ru”超分子噻吩樹枝狀 結構。進行了他們的光物理,電化學性能和熱性能研究。由於給體 - 受體,苯並噻二 唑 - 己基噻吩芯雙“釕噻吩樹枝狀的結構,這些表現比其他兩個系列高出更多的光伏效 率。三 Ru 含噻吩三苯核心的架構,由於他們的星型分支結構顯示中等的光伏性能。 在三代雙 Ru 含樹突狀系列(G1-G2),在無任何添加劑或退火條件援助的情況下, BT2RuG3 顯示最高的太陽能電池的效率 0.77%。這種太陽能電池的效率值是在迄今 所有含樹枝狀超分子金屬報告中最高的。
(IV)
因此,得出結論為新型化學感測探針的金屬離子的高選擇性和高靈敏度的檢測已被
開發出來。之後,針對取代基的變化靈敏度模型進行了討論。並對金屬含有噻吩的樹 枝狀高分子合成及其光電特性也進行了描述。
(V)
Acknowledgement
With a great honour and deep submission, I am grateful to my PhD advisor
Professor Hong-Cheu Lin for his encouragement and faith in me during my
research period. I appreciate for all his precious time, motivation, suggestions,
and funding for my research. I am highly motivated by his imperturbable
personality and understanding power.
I owe my thanks to Prof Chen, San-Yuan (chairman), and all professors and
secretaries of Department of Material Science and Engineering, NCTU. The
financial support of my PhD work by grant from National Science Council
(NSC), Office of International affairs and National Chiao Tung University,
Taiwan, ROC is greatly acknowledged.
My greatest gratitude to my parents for their eternal blessings and immense
sustenance for my rising. I am beholden to my loving brother Surya kanta for
his pray and heartfelt well-wishes. My devotional greetings to my grandparents
for their perpetual blessings aimed at my immense growth both in humanity and
studies.
I am extremely thankful to my teacher Mr. Nishikant Mishra, O.F.S (I) and
my professor Dr. Satyaban Jena for being the factual motive of my love towards
organic chemistry and approach in organic synthesis.
My personal thanks to Smruti bhai, Hari bhai, Kartik bhai, Udit bhai,
Duryodhan bhai and Dhananjaya bhai for all their affection, support and
creating a friendly as well as homely atmosphere dwell around me which made
my living possible in abroad. I am thankful to all my present and previous lab
mates for their timely suggestions and co-operations in my research.
Last but not the least, being a true friend of mine and sustaining me in all my
ups and downs during my PhD journey, I am intensely indebted to dear
Madhusmita.
(VI)
Table of Contents
Abstarct ………I Abstarct (Chinese)………... III Acknowledgement………V Table of Contents………VI List of Figures and Schemes………IX List of Tables………...XVII
Chapter 1. Introduction………..1
1.1 General introductions for Chemosensors………1
1.2 Mechanisms of analyte detection………..5
1.2.1 Photoinduced electron transfer (PET)……… 5
1.2.2 Electronic energy transfer (EET)……… 7
1.2.3 Photoinduced Charge Transfer (PCT)……… 8
1.2.4 Fluorescence Resonance Energy Transfer (FRET)……… 9
1.2.5 Excimer or exciplex formation………...10
1.2.6 Irreversible reaction-based sensors (chemodosimeters)………...11
1.2.7 Metal-to-ligand charge transfer (MLCT)………12
1.2.8 Paramagnetic fluorescence quenching………...13
1.2.9 Aggregation Induced Emission (AIE)………13
1.3 Literature Survey……….16
1.3.1 Pb2+ Sensors………16
(VII)
1.3.3 Advantages of conjugated polymer sensor over small molecular sensors…28 Chapter 2.
2.1 Introduction……….32
2.2 Experimental Section………...33
2.2.1 Reagents, measurements and characterizations………33
2.2.2 Synthesis……….34
2.2.3 Synthetic procedures………36
2.3 Results and Discussion……….43
2.4 Conclusion………54
Chapter 3 3.1 Introduction………..55
3.2 Experimental Section………57
3.2.1 Reagents, Measurements, and Characterizations……….57
3.2.2 Synthesis………57
3.2.3 Synthetic Procedures……….59
3.3 Result and Discussion………..64
3.4 Conclusion………76
Chapter 4 4.1 Introduction………..77
4.2 Experimental Section……….79
4.2.1 Reagents, Measurements, and Characterizations……….79
(VIII)
4.2.3 Synthetic procedure………..82
4.3 Results and Discussion………..89
4.3.1 Photo-physical characterization……….89
4.3.2 Electrochemical characterization………90
4.3.3 pH sensing and reversibility………91
4.3.4 Selectivity, sensitivity, and reversibility in metal ion sensing……….95
4.3.5 F- sensing of 1-B, 2-B, 3-B, and 4-B………..101
4.4 Conclusions……….103
Chapter 5 5.1 Introduction………104
5.2 Experimental section 5.2.1 Materials and Instrumentation………...106
5.2.2 Synthesis and Structural Characterization………..107
5.2.3 Synthetic Procedures………..115
5.3 Results and Discussion………120
5.3.1 Optical properties and Electrochemical Properties……….120
5.3.2 Photovoltaic Properties………124
5.4 Conclusion ………..127
Chapter 6 ………..129
(IX)
List of Figures and Schemes
Figure 1.1 Schematic illustration of a sensor device (especially a chemical sensor
device)………. 3
Figure 1.2 Main aspects of fluorescent molecular sensors for cation recognition….. 4
Figure 1.3 Orbital energy diagrams for fluorescence “turn-on” PET sensors before and after binding cation and (a) forward electron transfer; (b) backward electron transfer; (c) fluorescence emission processes……… 7
Figure 1.4 Orbital energy diagrams for fluorescent “turn-off” PET sensors before and after binding cation and (a) fluorescence emission; (b) forward electron transfer; (c) backward electron transfer processes………... 8
Figure 1.5 Orbital energy diagrams for double exchange transfer between the excited fluorophore to the cation bound by receptor followed by cation return to the ground state by non-radiative decay………. 9
Figure 1.6 Spectral displacements of PCT sensors resulting from interaction of a bound cation with an electron-donating or electron-withdrawing group……….. 10
Figure 1.7 Fluorescence resonance energy transfer (FRET)……… 11
Figure 1.8 Excimer or exciplex formation……… 12
Figure1.9 Irreversible reaction-based sensors……… 12
Figure 1.10 (a) Possible stoichiometry of metal-tpy complex. (b) Structure of metal-bound TPE2TPy. (C) Proposed mechanism for the spectral red-shift of TPE2TPy upon binding to metal ion (Zn2+)……….. 13
Figure 1.11 Paramagnetic fluorescence quenching………. 14
Figure 1.12 (a) Planar luminophoric molecules such as perylene tend to aggregate as discs pile up, due to the strong p–p stacking interactions between the aromatic rings, which commonly turns ‘‘off’’ light emission. (B) Non-planar luminogenic molecules such as hexaphenyl-silole (HPS) behave oppositely, with their light emissions turned ‘‘on’’ by aggregate formation, due to the restriction of the intramolecular rotation (RIR) of the multiple phenyl rotors against the silole stator in the aggregate state. (b) Example of sensing process based on AIE mechanism……… 16
Figure 1.13 UV/Vis spectra of receptor 1 with the addition of different metal ions (left); Fluorescence spectra of receptor 1 the addition of increasing amounts of Pb2+ [0, 0.5, 1, 1.5, 2, 3, 5, and 7 equiv.] (right)………. 17
(X)
Figure 1.14. Organic–inorganic hybrid material containing 1,10-phenanthroline (left);
Adsorption capacity (%) of hybrid material upon the addition of metal ions (right)……… 18
Figure 1.15 (Left): (a) Changes in the absorption spectra of 3 (black) (5 x 10⁻⁵ M) in CH3CN upon addition of increasing amounts of Pb(ClO4)2 , until 1 equiv (purple). (b) Visual features observed by passing from 3 to the complex 3.Pb2+. (Right): Changes in the fluorescence emission spectra of 3 (black) (c = 1 x 10⁻⁵ M in CH3CN) upon addition of increasing amounts of (a) Pb(ClO4)2 until 0.5 equiv (purple) and (b) [(n- Bu)4 N]H2PO4 until 2 equiv (blue)……….. 19
Figure 1.16 (Left): (a) Changes in the fluorescence spectra of 6a (1 x 10⁻⁵ M) in CH3CN upon addition of Pb2+ (dotted line) and Cu2+ (dashed line) metal cations (ëexc = 330 nm). (b) Fluorescence emission intensity of 6a upon addition of 0.5 equivalents of Pb2+ in the presence of 0.5 equivalents of interference metal ions in CH3CN. (Right): Changes in the fluorescence spectra of 6b (1 x 10⁻⁵ M) in CH3CN upon addition of Hg2+ (dotted line) and Cu2+ (dashed line) metal cations (ëexc = 310 nm). (b) Fluorescence emission intensity of 6b upon addition of 0.5 equivalents of Hg2+ in the presence of 0.5 equivalents of interference metal ions in CH3CN……… 21
Figure 1.17 (Left): Changes in the absorption spectra of 4 upon addition of increasing amounts of Pb(ClO4)2. (Middle): Changes in the fluorescence emission spectrum of 4 upon addition of Pb(ClO4)2. (Right): Changes in the fluorescence emission spectrum of 7 upon titration with Hg(OTf)2………. 22
Figure 1.18 (Left and Middle): Selective association between LFS-1 and Pb2+. (Left): Fluorescence emission spectra of LFS-1 (1.0 ìM) upon addition of different metal ions (100 equiv) in 10 mM HEPES buffer (containing 10% DMSO at pH 7.4) (ëex = 355 nm). (Middle): The gray bars represent the ratio of excimer emission fluorescence at 469 nm to monomer emission at 395 nm (I469 /I395 ) in presence of indicated cations. (Right): Selective fluorescence quenching of LFS-2 upon metal binding with no excimer formation. Fluorescence emission spectra of LFS-2 (1.0 ìM) upon addition of different metal ions (100 equiv) in 1.0 mM HEPES buffer (containing 10% DMSO at pH 7.4) (ëex = 355 nm)……. 23
Figure 1.19 Hg2+-sensing process of S1 and S2………. 24
Figure 1.20 Hg2+ induced ICT ON–OFF………. 25
Figure. 1.21 Hg2+ induced absorption and fluorescence sensing of DMS1……….. 25
Figure 1.22 Hg2+ and Pb2+ sensing by 4……….. 26
Figure 1.23 Zn2+ sensing pattern of 1……… 27
Figure 1.24 Zn2+ sensing by C3-symmetric Schiff-base L……… 28
(XI)
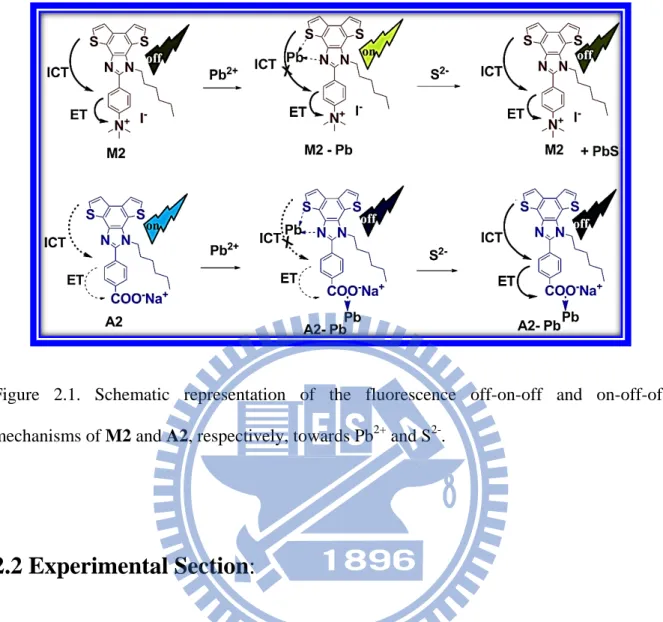
Fig 1.26 This schematic representation demonstrates sensory signal amplification using the molecular wire approach………... 32 Figure 2.1. Schematic representation of the fluorescence off-on-off and on-off-off
mechanisms of M2 and A2, respectively, towards Pb2+ and S2-………. 34
Scheme 2.1 Synthesis of M1, M2, A1 and A2………. 36 Scheme 2.2 Synthesis of M………... 36 Figure 2.2 Computational analysis showing coagulation of HOMO electron clouds in the electron donating part and coagulation of LUMO electron clouds in the electron withdrawing part favouring the direction of electron flow in M2, M1, A2 and A1……….. 45
Figure 2.3 (a) Fluorescence emission spectra of M2 (ëex = 240 nm) upon the addition of
various metal ions. The concentration of M2 (1.4×10⁻⁵ M) in DMSO/H2O (1:1), metal ions
added (1.5×10⁻³ M) in H2O. (b) Histogram representing the fluorescence spectral responses of
M2 upon the addition of different metal ions. (c) Histogram representing the emission
profiles of M2 in presence of Pb2+ and equivalent amount of other background metal ions
(Dual metal system)……… 46
Figure 2.4 (a) Fluorescence emission spectra of A2 (ëex = 265 nm) upon the addition of
various metal ions. The concentration of A2 (1.4×10⁻⁵ M) DMSO/H2O (1:1), metal ions
added (1.5×10⁻³ M) in H2O. (b) Histogram representing the fluorescence spectral responses of
M2 upon the addition of different metal ions. (c) Histogram representing the emission
profiles of A2 in presence of Pb2+ and equivalent amount of other background metal ions
(Dual metal system)……….. 47
Figure 2.5 Fluorescence spectral changes of (a) M2 (1.4x10⁻⁵ M) in DMSO/H2O (1:1) (ëex =
240 nm) and (b) A2 (1.4x10⁻⁵ M) in DMSO/H2O (1:1) (ëex = 265 nm) upon titration of Pb2+
(0 - 1.5x10⁻³ M). Insets show PL speactral responses of (a) M2 and (b) A2 as a function of
Pb2+……… 48
Figure 2.6 1H NMR titration of M2 upon the addition of 0-1 equiv. of Pb2+………. 48
Figure 2.7 Absorption spectral titration of M2 upon the addition of Pb2+ metal ions. The
concentration of M2 (1.4×10⁻⁵ M) DMSO/H2O (1:1), Pb2+ ions added (1.5×10⁻⁵ M) in
H2O………. 49
Figure 2.8 (a) Job’s Plot for M2 by plotting the variation of the absorption at 406 nm as a
function of [Pb2+]/[M2]. Total concentration of M2+Pb2+ was kept constant at 14 ìM. (b)
Calculation of detection limit from the linear fit equation and standard deviation………… 49
Figure 2.9 (a) Time-resolved fluorescence spectra of M2 (empty circle), and M2+Pb2+ (solid
(XII)
Figure 2.10 (a) 1H NMR titration of M upon the addition of 0-2 equiv. of Pb2+.(b)
Fluorescence spectral changes of M (1.4×10⁻⁵ M) in DMSO/H2O (1:1) (ëex = 290 nm) upon
the addition of Pb2+ (1.5×10⁻³ M) in H2O……….. 50
Figure 2.11 Stern-Volmer plots for the fluorescence quenching of A2 by Pb2+ at 25°C, 45°C and 65°C………. 51
Figure 2.12 Fluorescence spectral changes of (a) A1 (1.4×10⁻⁵ M) in THF/H2O (1:1) (ëex = 240 nm) and (b) M1 (1.4×0-5 M) in DMSO/H2O (1:1) (ëex = 245 nm) upon titration with Pb2+ (0 - 1.5×10⁻³ M) in H2O……… 52
Figure 2.13 1H NMR spectra of M1 in D6-DMSO/D2O=1/1 before (down) and after (up) the addition of 10 equiv. of Pb2+ in D2O……… 52
Figure 2.14 Fluorescence spectral response of M2 (1.4×10⁻⁵ M) in DMSO/H2O (1:1) (ëex = 240 nm) upon the addition of S2- (1.4×10⁻⁶ M) and other anions (1.4×10⁻⁴ M) in the presence of Pb2+ (1.5×10⁻³ M)……… 53
Figure 2.15 Fluoroscence recovery responses of M2-Pb and A2-Pb upon titration with 0-0.1 equiv. of S2- (i.e., 0-1.4 x10⁻⁶ M) w.r.t the concetration of M2/A2 (1.4x10⁻⁵ M) (ëex M2 = 240 nm/A2 = 265 nm)………. 54
Figure 2.16 Fluorescence spectral response of (a) A1 (1.4×10⁻⁵ M) in THF/H2O (1:1) (ëex = 240 nm)and (b) M1 (1.4×10⁻⁵ M) in DMSO/H2O (1:1) (ëex = 245 nm) upon titration with S 2-(0 - 1.4×10⁻⁶ M) in the presence of Pb2+ (1.5×10⁻³ M)………. 54
Figure 2.17 Fluorescence spectral response of (a) M2 (1.4×10⁻⁵ M) in DMSO/H2O (1:1) (ëex = 240 nm) and (b) A1 (1.4×10⁻⁵ M) in THF/H2O (1:1) (ëex = 240 nm) upon the addition of S 2-(1.4×10⁻⁵ M) in H2O.……… 54
Figure 2.18 Absorption spectral response of 4 (1.4×10⁻⁵ M) (a) upon the addition of 1 equiv. of different anions (b) titration of 4 upon the sequential addition of F- ions (0-1 equiv. w.r.t. 4)………. 55
Figure 3.1 Overview of the sensing pattern for P………... 57
Scheme 3.1 Synthesis of Polymer P……… 59
Scheme 3.2 Synthesis of Polymer M……….. 59
Figure 3.1 Absorption spectral response of polymer P (1.1 × 10⁻⁵ M) in THF/H2O:(1/1) acquired by the sequential addition of 0-10 equiv of different metal ions. Inset: Photographs of solution of polymer P upon the addition of various metal ions……… 66
Figure 3.2 (a) Absorption spectral changes of P (1.1 × 10⁻⁵ M) in THF/H2O (1:1) upon
(XIII)
Lower inset: color change upon the addition of Hg2+ (b) Absorption spectral ratio A305/A248
and (c) Absorption spectral ratio A395/A205as a function of equiv of Hg2+ added…………..
66
Figure 3.3 Job’s plot for polymer P plotting the variation of the difference in absorption
(A385-A305) as a function of molar ratio XM = [Hg2+]/{[Hg2+]+ [P] showed 1:1
stoichiometry……….. 67
Figure 3.4 1H NMR spectra (aromatic region) of monomer 6 upon the addition of 0-1.1 equiv
of Hg2+ w.r.t. [6]………. 68
Figure 3.5 Calculation of binding constant for Hg2+ with polymer P from the plot (AF
-A0)/( AX-A0)Vs 1/
[Hg2+]………..68
Figure 3.6 Absorption spectral response of polymer M (1.1×10⁻⁵ M) in THF/H2O: (1/1)
acquired by the addition of 10 equiv of Hg2+……….69
Figure 3.7 Fluorescence spectral response of polymer P (1.1×10⁻⁵ M) in THF/H2O:(1/1)
acquired by the addition of 0-10 equiv of different metal ions………..70 Figure 3.8 Histograms representing the fluorescence spectral responses of polymer P upon the addition of 10 equiv of different metal ions……….70
Figure 3.9 Fluorescence spectral response of P (1.1 × 10⁻⁵ M) in THF/H2O:(1/1) acquired by
the sequential addition of 0-10 equiv of Zn2+. Inset: Intensity of P as a function of equiv of
Zn2+ added………71
Figure 3.10 Fluorescence emission response profiles (I/I0) of polymer P in THF/H2O:(1/1).
The polymer concentration (1.1 × 10⁻⁵ M), [Zn2+] = 1.1 × 10⁻⁴ M and in the presence of other
metal ions = 1.1 × 10⁻⁴ M. (Dual metal system)……….71
Figure 3.11. 1H NMR spectra (aromatic region) of monomer 6 upon the addition of 0-1.1
equiv of Zn2+ w.r.t. [6]………71
Figure 3.12. Fluorescence spectral response of polymer P (1.1 × 10⁻⁵ M) in THF/H2O:(1/1)
acquired by the addition of 10 equiv of Zn2+……….72
Figure 3.13 Fluorescence spectral response of monomer 5 (1.1 × 10⁻⁵ M) in THF/H2O:(1/1)
acquired by the sequential addition of 0-10 equiv of Zn2+……….73
Figure 3.14. Time resolved fluorescence spectral responses for polymer P before and after
the addition of Zn2+……….74
Figure 3.15 Time resolved fluorescence spectral responses for polymer M before and after
(XIV)
Figure 3.16 Evolution of cyclic voltametry of polymer P in THF/[(n-Bu)4]PF6 scanned at 0.1
V s-1 in the presence of increasing amounts of Zn2+……….75
Figure 3.17 Absorption spectral response of (1) polymer P (1.1 × 10⁻⁵ M) and (2) P+Zn2+ (1.1
× 10-5 M) in THF/H2O:(1/1) upon the further addition of (a): (3) F-, (4) Cl-, (5) Br-, (6) I-, (7)
S2-, (8) NO3-, (9) Ac-, (10) PO43-, and (11) SCN-.(Each anion 1 equiv w.r.t. concentration of
polymer P) (b) Progressive change in the absorption pattern of polymer P upon the sequential
addition of I- (0-1 equiv w.r.t. polymer P)………..76
Figure 3.18 Fluorescence spectral response of polymer P+Zn2+ (1.1 × 10⁻⁵ M) in THF/H2O,
upon the sequential addition of Na2-EDTA, showing retrieval of original fluorescence of
polymer P due to the reversible association of Zn2+ with polymer P………76
Figure 3.19 Reversible association of Zn2+ with polymer P for 5 successive cycles achieved
by the alternate addition of Zn2+ and Na2-EDTA………77
Scheme 4.1 Synthetic procedures of 1-A and M………82 Scheme 4.2 Synthetic routes of Monomers and Polymers………..83 Figure 4.1 Normalized (a) UV absorption and (b) photoluminescence spectra of P1, P2, and
P3 in THF solutions and solid films………91
Figure 4.2 Cyclic voltamograms of polymers (a) P1, (b) P2, and (c) P3 in solid films at a
scan rate of 100 mVs-1……….92
Figure 4.3. UV-vis absorption spectra of (a) P1, (b) P2, and (c) P3 in THF/H2O=1/1 (1.4 ×
10-5 M) at various concentrations of trifluoroacetic acid (TFA) and the final neutralizations
with triethylamine (TEA)………93 Figure 4.4 PL spectra of (a) P1, (b) P2, and (c) P3 in THF/H2O=1/1 (1.4 × 10⁻⁵ M) at various concentrations of trifluoroacetic acid (TFA) and the final neutralizations with
triethylamine (TEA). (d) Stern-Volmer plots for the fluorescence quenching of P3 by H+ at
25°C and 50°C………94 Figure 4.5 Coagulation of electron clouds in HOMO and LUMO of P1-P3 before (left) and
after (right) complexation with H+………96
Figure 4.6 Fluorescence emission response profiles (I0/I) of P1, P2, and P3. The polymer
concentration (1.2 × 10⁻⁵ M), Fe2+ added = 10 eq (1.2 ×10⁻⁴ M), other metals ions added =
30eq (3.6 ×10⁻⁴ M) (Single metal system)………97
Figure 4.7 Fluorescence emission response profiles (I/I0) of P1, P2, and P3. The polymer
concentration (1.2 × 10⁻⁵ M), [Fe2+] = 1.2 ×10⁻⁴ M (10 eq) and in the presence of other metal
(XV)
Figure 4.8 Sequential PL quenching of P1-P3 (1.2×10⁻⁵ M) in THF/H2O (1/1) acquired by
the addition of 0-10 eq of Fe2+ and recovery of fluorescence by the addition of Na2-EDTA
and phenantroline. Upper inset PL quenching of P1 as a function of 0-10 eq [Fe2+]. Lower
inset photographs of fluorescence quenching in polymer solutions upon the addition of Fe2+
and regain of original fluorescence upon the addition of phenanthroline or Na2
-EDTA……...100
Figure 4.9 Time-resolved fluorescence of polymers P1-P3, before (empty circle) and after (solid circle) the addition of Fe2+………...100
Figure 4.10 The switches of on-off-on fluorescent spectra of P1, P2, and P3 for seven successive cycles upon the addition of Fe2+ and phenanthroline………..101
Figure 4.11 1H NMR titrations of monomers M1-M3 (in d8-THF) upon the sequencial addition of 0-1 equiv of Fe2+ (in D2O). (Arrow marks show the shifts of the peak corresponding to the dibromothophene units)………..102
Figure 4.12 (a-d) Fluorescence spectral responses during the addition of different halides (F-, Cl-, Br-, and I-) to 1-B, 2-B, 3-B, and 4B; (e-h) Fluorescence spectral changes upon the addition of F- to 1-B, 2-B, 3-B, and 4B (each 1.0 x10⁻⁵ M in THF/H2O=1/1)...103
Figure 5.1 Shematic representations of one, two and three metal systems……….109
Scheme 5.1 Synthesis of The Dendrimers………110
Scheme 5.2 Synthesis of terpyridine derivatives………111
Scheme 5.3 Synthesis of one metal systems………...111
Scheme 5.4 Synthesis of core for two metal systems………..112
Scheme 5.5 Synthesis of core for three metal systems………....112
Figure 5.2 Final structures of one metal systems………....113
Figure 5.3 Final structures of two metal systems………114
Figure 5.4 Final structures of three metal systems………..116
Figure 5.5 UV-Vis absorption spectra of Ru cored supramolecular thiopehene dendrimers in CHCl3 (1 x 10⁻⁵M) and solid films………..123
(XVI)
Figure 5.7 Current–voltage curves of BHJ solar cells using blended films of “mono, bis, tris
Ru(II)-containing metallo-dendrimers”:PC70BM (1 : 1 w/w) under the illumination of AM
1.5G, 100 mW cm-2………126
Figure 5.8 Current–voltage curves of BHJ solar cells using blended films of BT2RuG2 and
BT2RuG3 with PC70BM in two different ratios (1:2 & 1:3) under the illumination of AM
1.5G, 100 mW cm-2………127
(XVII)
List of Tables
Table 2.1 Phtophysical Properties of M2, M1, A2, and A1……… 45 Table 3.1 Quantum Yields, Fluorescence Lifetimes, Association Constants, and CHEF
Values of Polymers P and M upon the Addition of Zn2+……… 73
Table 4.1 Photo-Physical, Electrochemical, and Thermal Properties of P1, P2, and P3……91 Table 5.1 Optical, properties of Supramolecular Ru containing thiophene dendrimers……122 Table 5.2 Electrochemical properties of Supramolecular Ru containing thiophene dendrimers………..124
Table 5.3 Photovoltaic properties of a BHJ solar cell device with a configuration of
ITO/PEDOT:PSS/compound:PC70BM/Ca/Al………126
Table 5.4 Photovoltaic properties of a BHJ solar cell device with a configuration of
0
Om Jay Sriram
Dedicated to my beloved Parents
“In the path of life certain stage comes when it seems all the doors to go forward are closed.
1
Chapter 1
1.1 Introduction:
Owing to their demand in analytical, biomedical, biotechnological, and nanotechnological applications, great effort has recently been devoted to the design and construction of
molecular sensory systems.1-6 A sensor is defined by the Oxford dictionary as “device which
detects or measures a physical property and records, indicates, or otherwise responds to it.” A sensor achieves this goal by responding to an external stimulus and converting it into a signal which can be measured or recorded. A chemical sensor is a device that qualitatively or quantitatively detects the presence of specific chemical substances, a class of chemicals or a specific chemical reaction.
Detecting cations is of great interest to many scientists, including chemists, biologists, clinical biochemists and environmentalists. Among the numerous analytical methods that are available for the detection of cations, flame photometry, atomic absorption spectrometry, ion sensitive electrodes, electron microprobe analysis, neutron activation analysis, etc., are expensive, often require samples of large size and do not allow continuous monitoring. In
contrast, the methods based on fluorescent sensors1,6 offer distinct advantages in terms of
sensitivity, selectivity, response time, local observation (e.g. by fluorescence imaging
spectroscopy). Moreover, remote sensing is possible by using optical fibres with a molecular sensor immobilized at the tip. Therefore, considerable efforts are being made to develop selective fluorescent sensors for cation detection.
Generally, a sensor device contains three elements: a receptor, a signal transducer and a
read-out (Figure 1.1). The receptor should have the ability to discriminate and bind a specific
target substance known as the analyte. Successful, selective receptor–analyte complex formation depends on the size, shape and binding energy of the receptor and analyte molecules. Signal transduction is the process through which an interaction of receptor with
2
analyte yields a measurable form of energy change and is converted to a signal change that can be read and quantified. The read-out domain is the part responsible for reporting the binding event. Some parameters that define a sensor’s performances are selectivity, sensitivity, stability, reproducibility, and cost.
Figure 1.1. Schematic illustration of a sensor device (especially a chemical sensor device).
Chemical sensors are generally understood to be devices that transform chemical information into analytically useful signals. The term chemosensor has been defined as a molecule of abiotic origin that signals the target presence of matter or energy. The three elements of a sensor device are not necessarily independent and physically separated into the three components. Sometimes, one part of the molecule can act as a combination of two or more elements. Fluorescence is the emission of photons following relaxation from an excited
electronic state to the ground state. Chemosensors based on fluorescence signal changes are
commonly referred to as fluorescent chemosensors. Fluorescent chemosensors are gaining
increased attention due to their high sensitivity and ease of measurement. Fluorescent chemosensors capable of selectively recognizing guest species are receiving considerable attention in supramolecular chemistry because of their potential applications in environmental
detection, molecular catalysis, and biological fluorescence imaging, etc.7,8 On account of
3
and temporal resolution, fluorescent chemosensors can be conveniently used as a tool to analyze and measure the amount of guest species as well as sense biologically important
species in vitro and in vivo to clarify their function in living systems.9,10 Fluorescent
chemosensors that recognize guest species are currently of critical importance for the
development of supramolecular chemistry. Such fluorescent sensors consists of a fluorophore
linked to an ionophore and is thus called a fluoroionophore (Figure 1.2). In the design of such sensors, attention should be paid to both recognition and signaling moieties. The signaling moiety acts as a signal transducer, i.e. it converts the information (recognition event) into an
optical signal expressed as the changes in the photophysical characteristics of the fluorophore.
These changes are due to the perturbation (by the bound cation) of photoinduced processes such as electron transfer, charge transfer, energy transfer, excimer or exciplex formation or disappearance, etc. These aspects are relevant to the field of photophysics.
4
A fluorescent chemosensor is a molecular system for which the physicochemical properties change upon interaction with a chemical species so that a change in fluorescence is produced. The construction of a fluorescent chemosensor usually involves two integrated components. One is a signaling fluorophore and another is a guest receptor that possesses a recognition capability, both are connected by a spacer to form a so called fluorophore–spacer–receptor
scaffold.11 Therefore, an ideal fluorescent chemosensor must meet two basic requirements:
firstly, the receptor must have the strongest affinity with the relevant target
(binding-selectivity). Secondly, on the basis of good binding-selectivity, the fluorescence signal
should avoid environmental interference (signal-selectivity), such as photo bleaching, sensor molecule concentration, the environment around the sensor molecule (pH, polarity, temperature, and so forth), and stability under illumination. When a guest species is bound to
the receptor, the photophysical characteristics of the fluorophore, such as fluorescence
intensity, emission wavelength and fluorescence lifetime, will change via different
mechanisms, and such a change provides a signal that indicates guest binding. In most cases,
the spacer is not responsible for signal transduction. The read-out of a fluorescent
chemosensor usually is measured as a change in fluorescence intensity, intensity decay
lifetime, or a shift of the emission wavelength. An important feature of the fluorescent
chemosensors is that signal transduction of the analytes binding event into the readout can happen in a very short time and without any other assistance. This makes time and real-space detection of the analyte possible as well as imaging associated with analyte distribution. As chemosensors are applied in food analysis, process control, environmental monitoring, medical diagnosis, and many other disciplines, a thorough understanding of the available constructions at the molecular level can help elucidate and improve the design of fluorescent
5
1.2 Mechanisms of analyte detection:
There are several mechanisms of fluorescence sensing. Photoinduced electron transfer (PET) and electronic energy transfer (EET) are mechanisms that have been extensively studied and widely used in the design of the chemosensors. Both mechanisms result in changes in fluorescence intensity. This review will be focused on the detection of cations by either mechanism. These sensing mechanisms are applicable to a broad array of analytes as has
been reviewed previously. 1,2,15
1.2.1. Photoinduced electron transfer (PET):
PET is a deactivation process involving an internal red-ox reaction between the excited state of the fluorophore and another species able to donate or to accept an electron. A fundamental point explaining this process is to consider that in the excited state the properties of the species are quite different compared with those of the ground-state. In particular, due to its higher energy content, an excited state is both a stronger reducing and oxidant than the corresponding ground state. The presence of a coordinated metal ion lowers the energy of the lone pair involved in the coordination preventing the PET, thus causing the switch-ON of the fluorescence. PET strongly depends on the solvent polarity which affects the oxidation potential of the lone pairs of the coordinating moiety. Higher solvent polarity makes easier the electron transfer; as a consequence, the PET-mediated quenching effect of the
fluorescence occurs more quickly in high-polar environments.16 PET type fluorescent
response does not cause any spectroscopic shifts in the emission band upon complexation of
metal ions. Photoinduced electron transfer sensors can be classified into two categories:
fluorescence “turn-on” or fluorescence “turn-off” upon binding cations. For fluorescence “turn-on” sensors, the receptors usually contain a relatively high-energy non-bonding electron pair. PET takes place from a lone pair of the coordinating atoms (e.g. N, O, S, P) to the HOMO of the excited fluorophore. Thus, in the absence of analytes, these electron pairs quench the emission by rapid intramolecular electron transfer from the receptor to the excited
6
fluorophore, as shown in Figure 1.3. When this electron pair coordinates to Lewis acid cations in solution, the HOMO of the receptor is lowered. This decreases the driving force for
the PET process effectively stopping the quenching event and turning on the fluorescence of
the chromophore.
In some cases, the receptor takes part only indirectly in the photophysical process. If the energy level of the cation LUMO is between the energy levels of the fluorophore HOMO and LUMO, the binding of the cations by the receptor provides a non-radiative path to dissipate the excitation energy, resulting in a quenching of the fluorescence of the chemosensor (Figure 1.4).
The difference between these two mechanisms is that the PET process takes place either before or after the cation binding. For the “turn-on” sensor, the PET process is participated in by the HOMO, LUMO of the fluorophore and the HOMO of the receptor before cation binding. For the “turn-off” sensor, the PET process involves the HOMO, LUMO of the fluorophore and the LUMO of the cation after complex formation.
Figure 1.3. Orbital energy diagrams for fluorescence “turn-on” PET sensors before and after
binding cation and (a) forward electron transfer; (b) backward electron transfer; (c) fluorescence emission processes.
7
Figure 1.4. Orbital energy diagrams for fluorescent “turn-off” PET sensors before and after
binding cation and (a) fluorescence emission; (b) forward electron transfer; (c) backward electron transfer processes.
1.2.2. Electronic energy transfer (EET):
Electronic energy transfer is another mechanism for the fluorescence quenching upon binding
cations. There are two kinds of EET mechanisms: the double electron exchange (Dexter)
energy transfer and the dipole–dipole coupling (F¨orster) energy transfer.17,18 In the organic
fluorophore–cation system, usually the Dexter energy transfer dominates as shown in Figure
1.5. In this case, the fluorophore goes back to its ground state by non-radiative decay. The
Dexter energy transfer requires close contact between the fluorophore and the cations and
also direct orbital overlap. This type of fluorescence quenching not only requires the
appropriate relative energy levels between fluorophore and cation, but also requires some
specific characteristics of the spacer, such as flexibility and a shorter distance between the donor and acceptor. The F¨orster energy transfer mechanism involves the long range coupling of dipoles, allowing for an exchange of excitation energy through space, i.e. without a path of direct orbital overlap. These two mechanisms of energy transfer are differentiated primarily in their dependence on the distance between the donor and acceptor states. The F¨orster mechanism is more likely to occur at extremely short and extremely long distances. For most chemosensory systems where conjugation is involved, the Dexter mechanism of direct orbital
8
Figure 1.5. Orbital energy diagrams for double exchange transfer between the excited fluorophore to the cation bound by receptor followed by cation return to the ground state by non-radiative decay.
1.2.3. Photoinduced Charge Transfer (PCT):
When a fluorophore contains an electron-donating group (often an amino group) conjugated to an electron-withdrawing group, it undergoes intramolecular charge transfer from the donor to the acceptor upon excitation by light. The consequent change in dipole moment results in a Stokes shift that depends on the microenvironment of the fluorophore; polarity probes have
been designed on this basis.25 It can thus be anticipated that cations in close interaction with
the donor or the acceptor moiety will change the photophysical properties of the fluorophore
because the complexed cation affects the efficiency of intramolecular charge transfer.
22-24
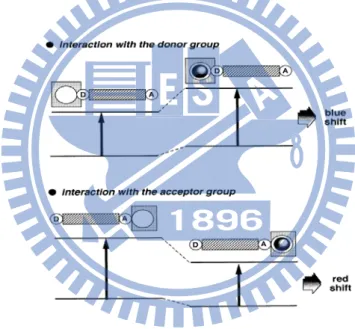
When a group (like an amino group) playing the role of an electron donor within the fluorophore interacts with a cation, the latter reduces the electron-donating character of this group; owing to the resulting reduction of conjugation, a blue shift of the absorption spectrum is expected together with a decrease of the extinction coefficient. Conversely, a cation interacting with the acceptor group enhances the electron-withdrawing character of this group; the absorption spectrum is thus red-shifted and the molar absorption coefficient is increased. The fluorescence spectra are in principle shifted in the same direction as those of the absorption spectra. In addition to these shifts, changes in
9
quantum yields and lifetimes are often observed. All these photophysical effects are obviously dependent on the charge and the size of the cation, and selectivity of these effects are expected. The photophysical changes upon cation binding can also be described in terms
of charge dipole interaction.26 Let us consider only the case where the dipole moment in the
excited state is larger than that in the ground state. Then, when the cation interacts with the donor group, the excited state is more strongly destabilized by the cation than the ground state, and a blue shift of the absorption and emission spectra is expected (however the fluorescence spectrum undergoes only a slight blue shift in most cases; this important observation will be discussed below). Conversely, when the cation interacts with the acceptor group, the excited state is more stabilized by the cation than the ground state, and this leads to a red shift of the absorption and emission spectra (Figure 1.6).
Figure 1.6. Spectral displacements of PCT sensors resulting from interaction of a bound cation with an electron-donating or electron-withdrawing group.
1.2.4. Fluorescence Resonance Energy Transfer (FRET):
FRET is a distance dependent interaction between the electronic excited state of a fluorophore and another fluorophore in which the excitation is transferred from a donor molecule to an acceptor molecule without emission of photons; if FRET takes place exciting a fluorophore, the emission of another fluorophore is detected. FRET needs of some essential
10
conditions: donor and acceptor molecules must be in close proximity (typically 10–100 ˚A);
the absorption spectrum of the acceptor must overlap the fluorescence emission spectrum of the donor; donor and acceptor transition dipoles orientation must be approximately parallel. The efficiency of FRET is dependent on the inverse sixth power of the intermolecular separation. The presence of a metal ion forces the two fluorophores to move close or far each other. In the first case, exciting the free fluorophore A (Figure 1.7) the emission spectra of A
is detected because FRET is prevented due the great distance between the two fluorophores.
By coordination of the metal ion, the distance between the two fluorophores decreases
switching on the FRET, thus exciting the fluorophore A the emission spectra of B can be detected.
Figure 1.7. Fluorescence resonance energy transfer (FRET).
1.2.5 Excimer or exciplex formation:
In the case in which the interaction between excited and ground-state components in a metal sensor is sufficiently strong, new chemical species called excimers or exciplexes are formed. Excimer and exciplex formation is a reversible process and both can be luminescent chemical entities. The emission of an excimer or exciplex is always at lower energy compared with the monomer emission, and usually the corresponding band is rather weak and broad. Once again, the presence of metal ions strongly encourages or disrupts excimer or exciplex affecting the emission spectra (Figure 1.8). Often, the ratio between the emission intensity of monomer
11
and excimer gives a quantitative measure of the amount of metal ion present in solution. Sensors based on this concept are called “ratiometric sensors”.
Figure 1.8. Excimer or exciplex formation.
1.2.6 Irreversible reaction-based sensors (chemodosimeters):
Chemodosimeters are mainly used to obtain OFF-ON sensors for those metal ions usually quenching the fluorescence (e.g. Cu (II)). They are non-emissive molecules converted in emissive ones via irreversible chemical reaction promoted by the metal ion (Figure 1.9). Many of these sensors suffer several issues, often they only act in organic solvents or require specific conditions as high temperature.
12
1.2.7. Metal-to-ligand charge transfer (MLCT):
Metal-to-ligand charge-transfer (MLCT) complexes arise from transfer of electrons from molecular orbitals with metal like character to those with ligand like character. This is most
commonly observed in complexes with ligands having low-lying π* orbitals especially
aromatic ligands. The transition will occur at low energy if the metal ion has a low oxidation number for its d orbitals will relatively be high in energy. Examples of such ligands taking part in MLCT include 2,2';6',2"-terpyridine (tpy), 2,2’-bipyridine (bipy), 1,10-phenanthroline
(phen), CO, CN- and SCN-. For examole, Terpyridine-containing tetraphenylethenes (TPEs)
can work as “turn-off” fluorescent chemosensors for metal ions and display different
fluorescence responses to various metal ions. A characteristic red shift in the emission spectra
is observed in the presence of Zn2+, which facilitates the discrimination of Zn2+ from other
metal ions. Because of the MLCT process, terpyridine-substituted TPEs display an obvious
magenta color upon selectively binding with Fe2+, allowing a rapid identification of Fe2+ in
the aqueous media by naked eyes (Figure 1.10).27
Figure 1.10. (A) Possible stoichiometry of metal-tpy complex. (B) Structure of metal-bound TPE2TPy. (C) Proposed mechanism for the spectral red-shift of TPE2TPy upon binding to
13
1.2.8. Paramagnetic fluorescence quenching:
In a wide variety of metal complexes the formally forbidden intersystem crossing (isc) become faster due to the presence of a paramagnetic atom (the metal ion) in the proximity of the fluorophore (Figure 1.11). This phenomenon is called paramagnetic effect, and it is the
principal cause of the fluorescence quenching by the d9
Cu (II) ion. Metal complexes
containing this metal ion undergo isc by excitation, from S1 to T1 state of the fluorophore
that is deactivated by bimolecular non-radiative processes. For this reason classical probes for Cu (II) and other strongly paramagnetic metal ions such as Fe (III), Cr (III), Co (II) are usually based on the quenching of the fluorescence.
Figure 1.11 Paramagnetic fluorescence quenching.
1.2.9. Aggregation Induced Emission (AIE):
This is mainly attributed to the conformational restriction of intramolecular rotation comprising aggregation-induced emission. In general, Luminescence is often weakened or quenched at high concentrations, a phenomenon widely known as ‘‘concentration
quenching’’.28 A main cause for the quenching process is mechanistically associated with the
‘‘formation of aggregates’’,28,29 which is probably why the concentration quenching effect
has frequently been referred to as ‘‘aggregation-caused quenching’’ (ACQ). Because of the
ACQ effect, the application of many organic fluorophores in organic light-emitting diodes
14
overcome the ACQ effect, branched chains, bulky cyclic species and dendritic wedges have
been covalently attached to the fluorophores to suppress the formation of aggregates. However, some organic molecules that are almost nonfluorescent in solution were shown to become strongly fluorescent upon aggregation, which is an abnormal behavior. In 2001, Tang et al. discovered this “abnormal” system, in which luminogen aggregation plays a constructive, instead of destructive, role in the light-emitting process (Figure
1.12a).30 Hexylphenylsilole (HPS) dissolved in its good solvent is nonemissive. Addition of
large amounts of water into the solution causes the silole molecules to aggregate and induces them to emit efficiently. This was coined as “aggregation-induced emission” (AIE) for this novel phenomenon, because the nonluminescent silole molecules are induced to emit by aggregation. Thus, the restriction of intramolecular rotation of the peripheral phenyl rings in
the aggregate is the main cause for the AIE effect. Recently, metal (Al3+) induced aggregation
15
Figure 1.12 (a) Planar luminophoric molecules such as perylene tend to aggregate as discs pile up, due to the strong p–p stacking interactions between the aromatic rings, which
commonly turns ‘‘off’’ light emission. (B) Non-planar luminogenic molecules such as
hexaphenyl-silole (HPS) behave oppositely, with their light emissions turned ‘‘on’’ by aggregate formation, due to the restriction of the intramolecular rotation (RIR) of the multiple phenyl rotors against the silole stator in the aggregate state. (b) Example of sensing process based on AIE mechanism.
16
1.3 Literature Survey:
1.3.1 Pb2+ Sensors: 1.3.1.1:
Phenanthroline-based colorimetric sensors 1 and 2 have been designed, synthesized,
and compared with phenanthrene-based receptor 3 for sensing of Pb2+ by color change.
Receptor 1 imparts color change (from yellow to red) selectively with Pb2+ in
acetonitrile/water (9:1) as well as in methanol/water (9:1) when in the presence of other metal ions studied (Li+, Na+, K+, Ca2+, Mg2+, Ba2+, Fe3+, Co2+, Ni2+, Cu2+, Zn2+,
Cd2+, Hg2+, and Mn2+ as their perchlorate salts). Receptor 1 also shows fluorescence
enhancement upon addition of lead perchlorate in acetonitrile/water (9:1) solvent possibly due to the chelation enhanced fluorescence (CHEF) effect (See Figure 1.13).
However, the binding behavior of 2 with Pb2+ is found to be less effective compared
to that of receptor 1.32
Figure 1.13. UV/Vis spectra of receptor 1 with the addition of different metal ions (left);
Fluorescence spectra of receptor 1 the addition of increasing amounts of Pb2+ [0, 0.5, 1, 1.5, 2,
17
1.3.1.2:
A novel organic–inorganic fluorescent material as chemosensor containing 2-substitute imidazole-[4,5-f]-1,10-phenanthroline derivative was prepared by sol–gel reaction, and the binding ability of hybrid material with metal ions was evaluated, and the results indicated that
the hybrid material can selectively recognize Pb2+ (Figure 1.14). By examining the ability of
hybrid material to adsorb Pb2+ in solid liquid phase, 98.3% of Pb2+ was adsorbed onto the
surface of hybrid material, and the hybrid material can be repeatedly utilized with suitable treatment, where the “off-on-off” process was due to the pH modulation of the phenanthroline ligand. The combination of well-defined inorganic matrix and functionalized organic receptor can play a pivotal role in the development of a novel generation of
functionalized composites.33
Figure 1.14. Organic–inorganic hybrid material containing 1,10-phenanthroline (left); Adsorption capacity (%) of hybrid material upon the addition of metal ions (right).
1.3.1.3:
The ferrocene-imidazopyrene dyad, bearing the imidazole ring as the only receptor site, acts as a redox and optical molecular sensor for ion pairs, exhibiting an easily detectable signal change in the redox potential of the ferrocene/ferrocinium redox couple and in the emission
18
cations and H2PO4- > AcO- for anions (Figure 1.15). ie. The ferrocene-imidazopyrene dyad 3
behaves as a host-separated ion pair receptor. A salient feature of this simple receptor is the presence of only one receptor site, the imidazole ring, which is able simultaneously to recognize an anion and a cation through variation of the oxidation potential of the ferrocene/ferrocinium redox couple and a remarkable perturbation of the emission
spectrum.34
Figure 1.15. (Left): (a) Changes in the absorption spectra of 3 (black) (5 x 10⁻⁵ M) in CH3CN
upon addition of increasing amounts of Pb(ClO4)2 , until 1 equiv (purple). (b) Visual features
observed by passing from 3 to the complex 3.Pb2+. (Right): Changes in the fluorescence
emission spectra of 3 (black) (c = 1 x 10⁻⁵ M in CH3CN) upon addition of increasing amounts
19
1.3.1.4:
Among Ferrocene-imidazoquinoxaline dyads 6a and 6b, showed selective sensitivity towards
Pb2+ and Hg2+ respectively (Figure 1.16) Dyad 6a behaves as a highly selective redox,
chromogenic and fluorescent chemosensor molecule for Pb2+
cations in CH3CN solutions; the
oxidation redox peak is anodically shifted (ΔE1/2 = 110 mV); in the absorption spectrum a
new low-energy band appeared at λ= 463 nm, and the emission band is red-shifted (Δλ = 31
nm) along with an important chelation-enhanced fluorescence factor (CHEF = 276), upon
complexation with this metal cation. The dyad 6b, bearing two additional pyridine rings as
substituents, has shown its ability for sensing Hg2+ cations through three different channels:
the oxidation peak is anodically higher shifted (ΔE1/2 = 300 mV), a new low-energy band
appears in the absorption spectrum at λ = 483 nm, and the emission band was also red-shifted (Δλ = 28 nm) and underwent an important chelation-enhanced fluorescent factor (CHEF = 227). The changes in their absorption spectra are accompanied by color changes from yellow to orange which allow their potential use for the “naked eye” detection of these metal cations.
Linear sweep voltammetry revealed that Cu2+ cations induced oxidation of the ferrocene unit
in both dyads, which is accompanied by an important increase of the emission band.35
20
Figure 1.16 (Left): (a) Changes in the fluorescence spectra of 6a (1 x 10⁻⁵ M) in CH3CN
upon addition of Pb2+ (dotted line) and Cu2+(dashed line) metal cations (λexc = 330 nm). (b)
Fluorescence emission intensity of 6a upon addition of 0.5 equivalents of Pb2+ in the
presence of 0.5 equivalents of interference metal ions in CH3CN. (Right): Changes in the
fluorescence spectra of 6b (1 x 10⁻⁵
M) in CH3CN upon addition of Hg2+ (dotted line) and
Cu2+ (dashed line) metal cations (λexc = 310 nm). (b) Fluorescence emission intensity of 6b
upon addition of 0.5 equivalents of Hg2+ in the presence of 0.5 equivalents of interference
metal ions in CH3CN.
1.3.1.5:
Ferrocene–imidazophenazine dyads 4 and 7 showed selective sensing towards Pb2+ and Hg2+
respectivily (Figure 1.17). Dyad 4 behaves as a highly selective chemosensor molecule for
Pb2+ cations in CH3-CN/H2O (9:1). The emission spectrum ( λexc = 317 nm) undergoes an
important chelation-enhanced fluorescence effect (CHEF = 47) in the presence of
Pb2+ cations. A new low-energy band appeared at 502 nm, in its UV/vis spectrun, and the
oxidation redox peak is anodically shifted (ΔE1/2 = 230 mV). The presence of Hg2+ cations
also induced a perturbation of the redox potencial although in less extension than those found
with Pb2+ cations. Dyad 7, bearing two fused pyridine rings, has shown its ability for sensing
21
oxidation redox peak is anodically shifted (ΔE1/2 = 200 mV), a new low-energy band of the
absorption spectrum appeared at 485 nm, and the emission spectrum (λexc = 340 nm) is
red-shifted by 32 nm accompanied by a remarkable chelation-enhanced fluorescent effect (CHEF
= 165). Linear sweep voltammetry revealed that Cu2+ cations induced oxidation of the
ferrocene unit in both dyads. 1H NMR studies have been carried out to obtain information
about the molecular sites which are involved in the binding process.36
Figure 1.17. (Left): Changes in the absorption spectra of 4 upon addition of increasing
amounts of Pb(ClO4)2. (Middle): Changes in the fluorescence emission spectrum of 4 upon
addition of Pb(ClO4)2. (Right): Changes in the fluorescence emission spectrum of 7 upon
22
1.3.1.6:
A new pyrene-based sensor that functions as a fluorescent probe for Pb2+ sensing with high
selectivity (Figure 1.18) . LFS-1 coordinates Pb2+ with 1:1 complex stoichiometries. LFS-1
displayed significant pyrene excimer emission as well as the quenching of monomer in the
presence of Pb2+. In contrast to LFS-1, LFS-2 showed fluorescence quenching upon addition
to Pb2+ but without emission of the pyrene excimer, indicating distinct mechanisms
underlying fluorescence quenching and the formation of the pyrene dimer necessary for excimer formation. These measurements emphasize a requirement for sufficient flexibility in the probe scaffold in the rational design of fluorescent sensors requiring pyrene–pyrene
interactions.37
Figure 1.18. (Left and Middle): Selective association between LFS-1 and Pb2+. (Left):
Fluorescence emission spectra of LFS-1 (1.0 μM) upon addition of different metal ions (100
equiv) in 10 mM HEPES buffer (containing 10% DMSO at pH 7.4) (λex = 355 nm). (Middle):
The gray bars represent the ratio of excimer emission fluorescence at 469 nm to monomer
emission at 395 nm (I469 /I395 ) in presence of indicated cations. (Right): Selective
fluorescence quenching of LFS-2 upon metal binding with no excimer formation.
Fluorescence emission spectra of LFS-2 (1.0 μM) upon addition of different metal ions (100
23
1.3.2: Colorimetric Hg
2+Sensors:
1.3.2.1:
Two new highly selective colorimetric chemosensors for Hg2+, based on azobenzene and
highly selective Hg2+-promoted deprotection of adithioacetal have been designed and
synthesized. In the presence of as little as 20 μM Hg2+, the sensors change their color from
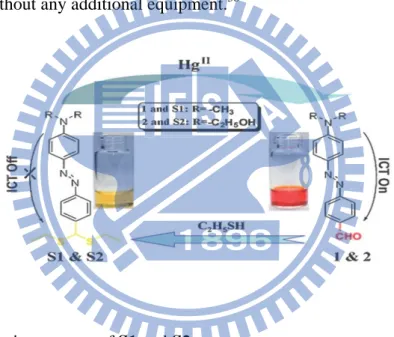
light yellow to deep red, which can easily be observed by the naked eye. The underlying signaling mechanism is intramolecular charge transfer (Figure 1.19) . The sensors have good
selectivity for Hg2+ with respect to several common alkali, alkaline earth, and transition
metal ions. Furthermore, they can be used for in-the-field measurements by virtue of a
dipstick approach without any additional equipment.38
Figure 1.19. Hg2+-sensing process of S1 and S2.
1.3.2.2:
A chiral conjugated polymer sensor with incorporated (R,R)-salen and perylenyl moieties in the main chain backbone was obtained by the polymerization of 1,7-bis((3-formyl-4-hydroxyphenyl) ethynyl)perylene-3,4:9,10-tetracarboxylic tetrabutylate (M-1) with (R,R)-1,2-diaminocyclohexane (M-2) via a nucleophilic addition–elimination reaction. The polymer sensor can emit the fluorescence situated at 635 nm due to the introduction of a strong
fluorophore perylenyl group. Compared with the other cations (including Na+
24
Ni2+, Cd2+, Pb2+, Cr3+, Al3+, Fe3+, Co2+, Zn2+), only Hg2+ can lead to the most pronounced
response of the polymer sensor, which is as high as a 26-fold fluorescence enhancement
without interference from other metal ions. More importantly, the fluorescent color of the
polymer sensor displays an obvious change from red to bright yellow upon addition of Hg2+ ,
which could be easily detected by the naked eye (Figure 1.20) . The results indicate that the polymer sensor with incorporated (R,R)-salen and perylenyl moieties can be favorably
utilized for the development of a potential sensor for Hg2+ detection.39
Figure 1.20. Hg2+ induced ICT ON–OFF.
1.3.2.3:
The synthesis and sensing characteristics of a new class of colorimetric and fluorometric dual-modal probe DMS1 for mercury ion was outlined. Judicious placement of two dithia-dioxa-aza macrocycles on the BODIPY chromophore generates this interesting molecule. A
highly Hg2+-selective fluorescence enhancing property (>7-fold) in conjunction with a visible
colorimetric change from purple to red-pink can be observed, leading to potential fabrication
of both “naked-eye” and ratiometric fluorescent detection of Hg2+(Figure 1.21).40
25
1.3.2.4:
The synthesis and characterization of ferrocene (Fc) derivatives 4-[2,5-diferrocenyl-4-(4-pyridyl)imidazolidin-1-yl-methyl]pyridine (1), ferrocenylmethylenepyridin-3-ylmethylamine
(2), N,N′-bis(ferrocenylmethylene)-2,4,trimethylbenzene-1,3-diamine (3), and
6-ferrocenyl-5,6-dihydro[4,5]imidazo[1,2-c]-quinazoline (4) have been described. Structures of
1, 2, and 4 have been determined by single-crystal X-ray diffraction analyses. At 25 °C,
1−3 are nonfluorescent, while 4 displays moderate fluorescence and chromogenic,
fluorogenic, and electrochemical sensing selectively toward Hg2+ and Pb2+ ions. Association
constants (Ka ) for Hg2+ and Pb2+ have been determined by the Benesi−Hildebrand method.
Job’s plot analysis supported 1:1 and 1:2 stoichiometries for Hg2+ and Pb2+ ions. Cyclic
voltammograms of 1−4 exhibited reversible waves corresponding to a ferrocene/ferrocenium
couple. The wave associated with 4 (+0.0263 V) exhibited positive (ΔEpa = 0.136 V) and
negative (ΔEpa = 0.025 V) shifts in the presence of Hg2+ and Pb2+ ions, respectively (Figure
1.22). The mode of interaction between metal ions and 4 has been supported by 1H NMR and
mass spectrometry studies and verified by theoretical studies. It presents the first report
dealing with ferrocene-substituted quinazoline as a multichannel chemosensor for Hg2+/Pb2+
ions.41
![Figure 3.16 Evolution of cyclic voltametry of polymer P in THF/[(n-Bu) 4 ]PF 6 scanned at 0.1 V s -1 in the presence of increasing amounts of Zn 2+ ……………………………………….75 Figure 3.17 Absorption spectral response of (1) polymer P (1.1 × 10 -5 M) and (2) P+](https://thumb-ap.123doks.com/thumbv2/9libinfo/8426004.180840/16.892.112.792.450.804/evolution-voltametry-presence-increasing-absorption-spectral-response-polymer.webp)


![Figure 1.13. UV/Vis spectra of receptor 1 with the addition of different metal ions (left); Fluorescence spectra of receptor 1 the addition of increasing amounts of Pb 2+ [0, 0.5, 1, 1.5, 2, 3, 5, and 7 equiv.] (right)](https://thumb-ap.123doks.com/thumbv2/9libinfo/8426004.180840/36.892.159.768.427.1028/receptor-addition-different-fluorescence-spectra-receptor-addition-increasing.webp)

![Figure 2.8 (a) Job’s Plot for M2 by plotting the variation of the absorption at 406 nm as a function of [Pb 2+ ]/[M2]](https://thumb-ap.123doks.com/thumbv2/9libinfo/8426004.180840/68.892.138.754.432.725/figure-job-plot-plotting-variation-absorption-function-pb.webp)
