國立臺灣大學理學院地理環境資源學系 碩士論文
Department of Geography College of Science
National Taiwan University Master Thesis
東亞航班延誤影響因素:機場、航線及網絡 Determinants of Flight Delays in East Asia: Airport,
Route, and Network
陳昀暄
Yun-Hsuan Chen
指導教授:林楨家 博士 Advisor: Jen-Jia Lin, Ph.D.
中華民國 108 年 2 月
February, 2019
i
謝 誌
能完成這兩年的學業和這本論文,首先要感謝的是我的指導教授林楨家老師。
學習如何按部就班完成一個長期的研究,是我向老師學到的寶貴經驗。另外這兩年 來,對於我的各種生涯規劃上的嘗試和轉換,老師總是都笑咪咪地冷靜以對,給予 我很大的自由空間和溫暖的支持。也謝謝兩位口試委員,除了給予我研究上的建議 外,也和林老師及溫在弘老師一起參加魁北克的研討會,以及旁聽溫裕弘老師生動 有趣的課;另外也擔任了徐進鈺老師的助教,這些都是我碩士生涯中美好的回憶。
謝謝 404 研究室及地理系的夥伴們。土豆哥各種大小事的幫忙,讓我們能無後 顧之憂地做研究;鴻錡和孟璋在我初入陌生的地理系以及各種選課、研究問題時給 了我很多幫助;邑孺和家禎總是給研究室帶來很多歡笑(和食物);謝謝專討好夥 伴晧宇,你是我的好榜樣;謝謝可愛的研究室新夥伴珈羽、章鈞、京津、詩悅和肖 凡,以及七樓的好夥伴育安、善榆和昆霖,陪伴我度過很多歡樂的時光。謝謝舒涵 常常跟我一起吃飯買飲料閒聊買東西,畢業後也能繼續分享工作心得,很開心能有 你的陪伴。
謝謝我的好朋友芳維、彥如和敬沂,即使在不同領域中奮鬥,很慶幸能有你們 的傾聽和建議,給了我莫大的幫助;也很開心有你們在生活和旅途中相伴,讓我這 兩年過得很精采。
最後,感謝我最親愛的家人。謝謝爸爸和媽媽願意支持我的各種決定,並給我 良好的態度和觀念,讓我能勇敢地面對挑戰,快樂地享受當下。謝謝姐姐和安團,
對於我的各種決定都給予建議和幫助,並在我有所斬獲時為我感到開心。你們的支 持和陪伴是我最大的動力。
陳昀暄 謹誌於 國立臺灣大學地理環境資源學系 中華民國一零八年二月
ii
摘要
近十年來東亞的民用航空運量急遽成長,而此地區的航班延誤情形也甚為嚴重。
惟在學術上,過去探討航班影響因素之文獻多集中於北美及歐洲區域,東亞則幾乎 付之闕如;另外,現有文獻多探討機場或航線面向之影響因素,而較少探討網絡面 向影響因素,亦即「連結機場」之可能影響。
本研究之目的為探討東亞航班延誤之影響因素,除了現有文獻有探討的機場與 航線影響因素,亦探討與起迄機場直接相連之連結機場之影響,以納入網絡之觀點。
本研究使用 318 個東亞機場間 4,611 條航線,於 2017 年下半年之航班資料,採用 追蹤資料迴歸模型,以航線之日平均航班到達延誤為應變數,並以三面向變數及控 制變數為自變數,分析三面向變數對東亞航班延誤之影響。
研究發現在機場面向,過去文獻所發現的延誤內化和樞紐效應並未出現於東亞 機場;航線面向變數則在不同國家或類型的航線而有不同的影響,競爭-服務品質 等假說並不全然適用於東亞航線;網絡面向變數確實顯著影響航班延誤。上述發現 不僅顯示北美及歐洲的經驗與理論轉移到東亞的侷限性,同時也補足航班延誤影 響因素之理論缺口,並且提供東亞機場擁擠稅之規劃建議,以及作為航空公司航班 調派等營運之參考。
關鍵詞:航班延誤、機場、航線、網絡、追蹤資料分析
iii
Abstract
In the last decade, air traffic volume in East Asia has increased rapidly, and flights in the region suffer from severe delays. Nevertheless, most previous studies on flight delay determinants were conducted in North America and Europe, and very few of them were based on East Asia. Furthermore, previous research focused on such determinants from airport and route perspectives and disregarded the network perspective (i.e., influence of
“connected airports”).
This study aims to explore the determinants of flight delays in East Asia, and it covers not only airport and route determinants explored in previous research but also those regarding directly connected airports to include the network perspective. This study adopts panel data regression models to verify how the variables of the three perspectives influence flight delays in East Asia. The flight data of 4,611 routes among 318 airports in the second half of 2017 are used. The daily average arrival delay of routes is employed as the dependent variable, and three perspective and control variables are utilized as independent variables.
The empirical findings indicate that from the airport perspective, congestion internalization and the “hubness” effect suggested in previous research do not exist in East Asia. The route variables affect delays in various countries and route types differently, and connected airports are crucial determinants of flight delays in East Asia.
These findings imply that the experiences of and theories from North America and Europe are inapplicable in explaining flight delays in East Asia. This study not only addresses the gap in existing literature but also provides a meaningful basis for the establishment of airport congestion tax, aircraft deployment, and other operational carrier strategies for East Asia.
Keywords: flight delay, airport, route, network, panel data analysis
iv
Contents
摘要 ... ii
Abstract ... iii
1. Introduction ... 1
1.1 Research Motivation and Objectives ... 1
1.1.1 Research Motivation ... 1
1.1.2 Research Objectives ... 3
1.2 Research Scope ... 4
1.2.1 Research Object ... 4
1.2.2 Temporal Scope ... 6
1.2.3 Geographical Scope ... 7
1.3 Research Process ... 8
1.3.1 Research Background ... 9
1.3.2 Research Design and Data Processing ... 9
1.3.3 Empirical Analysis and Conclusion ... 10
1.4 Research Methods ... 12
2. Literature Review ... 13
2.1 Flight Delay Propagation among Airports ... 13
2.1.1 Review of Relevant Literature ... 13
2.1.2 Comparisons and Analyses ... 16
2.2 Determinants of Flight Delays ... 19
2.2.1 Review of Relevant Literature ... 19
2.2.2 Comparisons and Analyses ... 30
2.3 Overall Remarks ... 38
3. Research Design ... 40
3.1 Study Issues ... 41
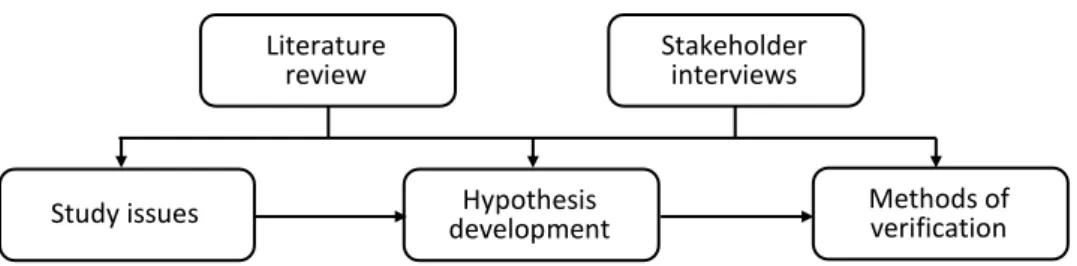
3.2 Hypothesis Development ... 48
3.2.1 Causal Relationships between the Three Perspective Variables and Delays 48 3.2.2 Causal Relationships between Control Variables and Delays ... 59
3.3 Method of Verification ... 63
3.3.1 Verification Framework ... 63
3.3.2 Verification Method ... 64
4. Empirical Analysis ... 70
4.1 Data ... 70
4.1.1 Data Collection ... 70
v
4.1.2 Descriptive Statistics ... 74
4.2 Results ... 78
4.2.1 Full Observation Models ... 78
4.2.2 Major Airport Models ... 83
4.2.3 China and Non-China Models ... 86
4.2.4 Domestic and International Models ... 91
4.3 Discussion ... 96
4.3.1 Three Perspective Variables ... 96
4.3.2 Control Variables ... 103
5. Conclusion ... 107
5.1 Conclusion ... 107
5.2 Recommendation ... 110
5.2.1 Recommendation for Practical Application ... 110
5.2.2 Recommendation for Future Research ... 111
References ... 113
Appendix A. Study airports, slot control level, number of connections and hub size ... 116
Appendix B. Interview records (in Traditional Chinese) ... 120
Appendix C Panel data random effect models for all routes ... 148
vi
List of Figures
Figure 1.1. Global airport delays in May, 2017 ... 2
Figure 1.2. Definition of arrival delay in this study ... 5
Figure 1.3. Geographical scope, airports and routes of this study ... 6
Figure 1.4. Research process ... 8
Figure 1.5. Concept of research methods ... 12
Figure 3.1. Framework of research design ... 40
Figure 3.2. Concept of airport, route and network perspectives ... 43
Figure 3.3. Framework of Verification ... 63
vii
List of Tables
Table 2.1. Literature regarding flight delay propagation ... 15
Table 2.2. Definitions of flight delay in the literature of Table 2.1 ... 17
Table 2.3. Influencing factors considered by literature in Table 2.1 ... 18
Table 2.4. Literature regarding determinants of flight delays ... 25
Table 2.5. Analyzed subjects of literature in Table 2.4 ... 31
Table 2.6. Dependent variables of literature in Table 2.4 ... 32
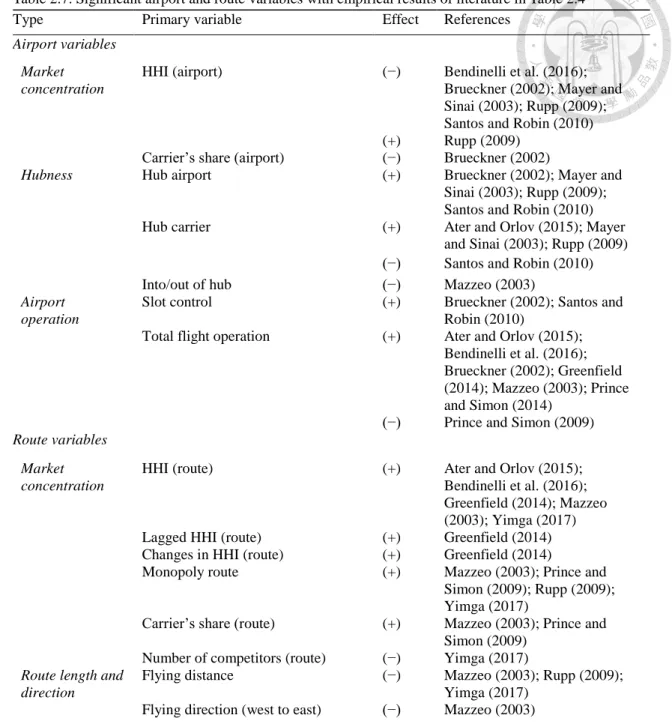
Table 2.7. Significant airport and route variables with empirical results of literature in Table 2.4 ... 34
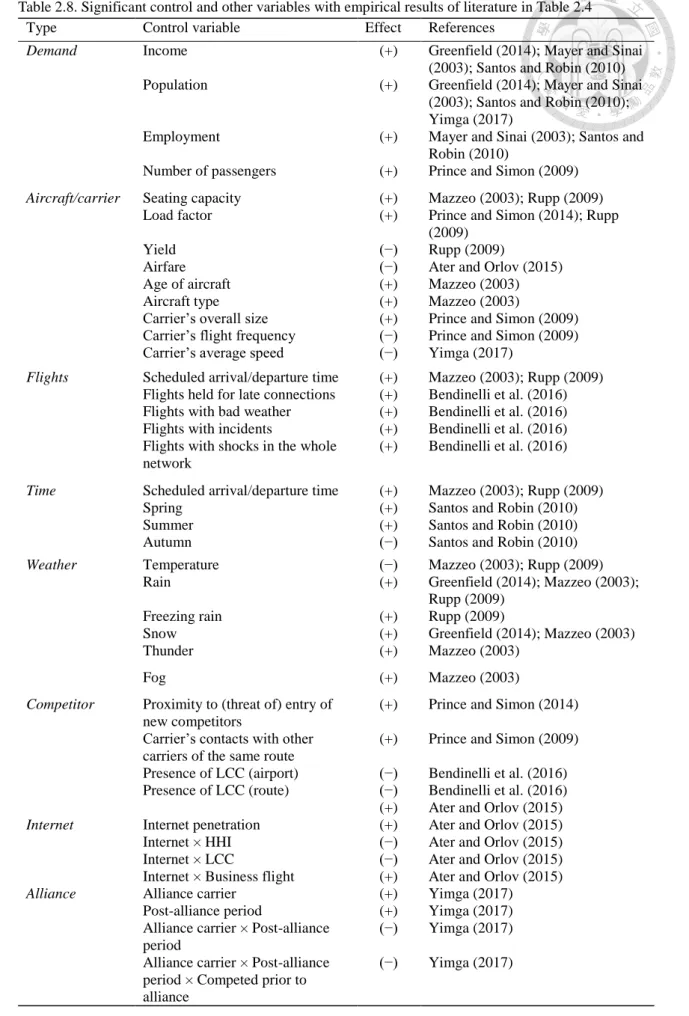
Table 2.8. Significant control and other variables with empirical results of literature in Table 2.4 ... 35
Table 3.1. Slot control proportion of three main air transport regions ... 44
Table 3.2. Hypothetical effects of three perspective independent variables on delays ... 49
Table 3.3. Hypothetical effects of control variables on delays ... 60
Table 3.4. Definitions of dependent and independent variables ... 66
Table 4.1. Sources of data ... 71
Table 4.2. Descriptive statistics of variables of study sample ... 75
Table 4.3. Panel data random effect models of all routes ... 79
Table 4.4. Panel data random effect models of major airport routes ... 84
Table 4.5. Panel data random effect models for routes among China’s airports ... 87
Table 4.6. Panel data random effect models for routes among non-China airports ... 89
Table 4.7. Panel data random effect models for domestic routes ... 92
Table 4.8. Panel data random effect models for international routesa ... 94
Table 4.9. Number of each slot control level’s airports in the study sample ... 97
Table 4.10. Comparison between this study and previous studies on three perspective independent variables’ effects on delays ... 101
Table 4.11. Comparison between this study and previous studies on control variables’ effects on delays... 105
1
1. Introduction
1.1 Research Motivation and Objectives 1.1.1 Research Motivation
In the past few decades, the size and scope of commercial air transport in Asia Pacific, which includes East Asia, have increased rapidly (Duval, 2014). In 2011, the number of passengers carried by flights in Asia Pacific reached 816 million, thereby making Asia Pacific the leading region in terms of air traffic, followed by Europe and North America;
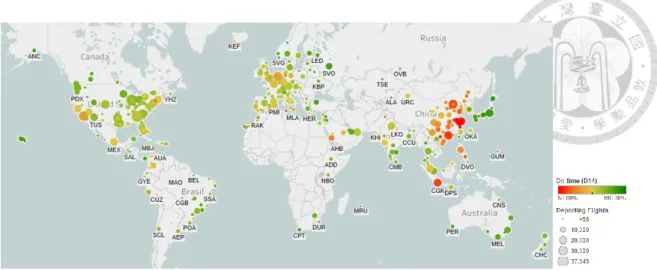
this figure reached 1,485 million in 2017 (ICAO, 2011, 2017). However, the on-time performance of airports in East Asia is poor (Figure 1.1). In 2015, according to data published by FlightStats (2015), 18 of the world’s 20 most delayed airports are found in East Asia, and their on-time rate ranges from 32.15% to 53.22%.
Poor flight punctuality in airports is a serious issue for different stakeholders, including governments, airport operators, carriers, and passengers. For example, poor on- time rates of an airport or a carrier may result in passengers being reluctant to travel to, from, or transfer in that airport or carrier, which may decrease the revenue of the airport operator or carrier and hamper the developments of a city or country set by its government (Diana, 2009). Therefore, determining the factors that cause flight delays in East Asia is crucial.
However, in the academia, two research gaps have not been addressed by available literature. First, due to policy issues of whether and how congestion pricing should be imposed in the United States, current literature focuses on determinants regarding airports or routes, such as hub size of airports and airlines, or concentration degree and competition of airports and routes (Bendinelli et al., 2016; Diana, 2017; Mayer & Sinai, 2003; Santos & Robin, 2010). The network perspective appears to be lacking in studies
2
Figure 1.1. Global airport delays in May, 2017 (FlightStats, 2017)
on the determinants of flight delays. That is, the influence of “connected airports,” which are defined in this study as airports with direct routes to the origin or destination airports concerned, is rarely discussed. Although Hao et al. (2014) regarded connected airports’
delays as a determinant of other airports’ delays, the other characteristics of connected airports and connecting routes were ignored. Second, literature on the determinants of flight delays is mostly based in the United States (Ater & Orlov, 2015; Brueckner, 2002;
Greenfield, 2014; Mayer & Sinai, 2003; Mazzeo, 2003; Prince & Simon, 2009, 2014;
Rupp, 2009), with some based in Europe and Brazil (Bendinelli et al., 2016; Santos &
Robin, 2010). To our best knowledge, no such research is based in East Asia. This situation may result in the omission of possible key factors, particularly those that belong to the region.
Hence, further research is required to investigate the determinants of flight delays in East Asia in consideration of the comprehensive perspectives of airports, routes, and networks.
3
1.1.2 Research Objectives
This study aims to analyze the determinants of flight delays in East Asia. In addition to the determinants identified by previous literature, other determinants based on the network perspective or those that exist in East Asia are also discussed. The research objectives include the following:
1. Examine whether the determinants of flight delays and the hypotheses raised by previous studies are applicable to flight delays in East Asia.
2. Investigate the influences of network determinants.
3. Consider the possible determinants that specifically exist in East Asia.
After fulfilling these objectives, this study is expected to provide the following academic contributions.
1. Confirm or revise current knowledge on the determinants of flight delays.
2. Develop new knowledge in the field of flight delay.
Furthermore, the following are the practical contributions of this study.
1. Governments and airport operators are considered a reference to improve the on-time performance of airports.
2. Carriers are considered a reference to reduce the delay rates of respective flights, arrange risk management, and adjust or plan current or future routes.
4
1.2 Research Scope
This section clarifies the research object and temporal and spatial scopes to specify the span of this study.
1.2.1 Research Object
“Flight delay” in this study is defined as the daily average arrival delay per passenger flight of a route between East Asian airports.
This study focuses on passenger air transport. The two main segments of airline industries are passenger and freight transport. This study includes passenger flights only because the development history, industrial requirements, and flight routes of freight air transport are different from those of passenger transport, and freight air transport is usually considered a unique research discipline (Chang, 2012).
This study focuses on arrival delays. Flight delays can be categorized into several types of delays, such as arrival and departure delays and excess travel time of minimum feasibility. Mayer and Sinai (2003) measured delays as the excess travel time of minimum feasibility (defined as “actual travel time less the minimum feasible travel time”) because the scheduled arrival time may be manipulated by carriers to demonstrate good on-time performance. However, such a measurement does not conform to the real experience of passengers (Rupp, 2009). This study measures arrival delays, similar to several previous studies (Ater & Orlov, 2015; Bendinelli et al., 2016; Greenfield, 2014; Hao et al., 2014;
Mazzeo, 2003; Prince & Simon, 2009, 2014; Rupp, 2009; Santos & Robin, 2010; Yimga, 2017; Zhang et al., 2010), because arrival delays usually directly affect the subsequent itinerary of a passenger and the subsequent departure of the same aircraft (Rupp, 2009;
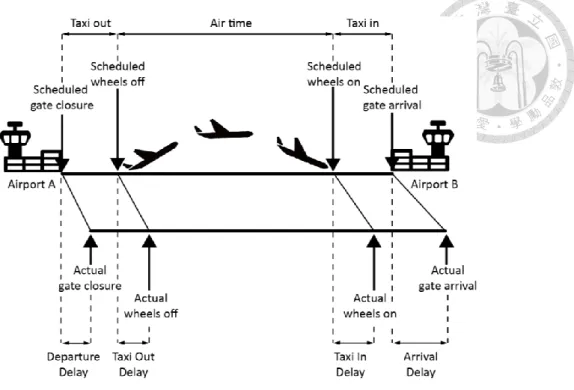
Yimga, 2017) and due to data limitations . Specifically, this study defines arrival delay as the time difference between the scheduled and actual times of a flight arriving at the gate (Figure 1.2).
5
Figure 1.2. Definition of arrival delay in this study [adapted from Azadian et al. (2012) and Zhang (2016)]
Moreover, this study does not apply a delay threshold, although competent air traffic authorities usually set a threshold for flight delays. For example, the Bureau of Transportation Statistics (BTS) in the USA considers a flight delayed at arrival if it arrives at the gate 15 minutes or more after the scheduled arrival time (BTS, 2017). This study does not apply a threshold for delays to observe the time difference between the actual and scheduled arrival times, similar to several previous studies (Ater & Orlov, 2015;
Bendinelli et al., 2016; Greenfield, 2014; Mayer & Sinai, 2003; Mazzeo, 2003).
Furthermore, early arrivals are counted as negative delays to observe the on-time performance of each route accurately, following several previous studies (Ater & Orlov, 2015; Bendinelli et al., 2016; Greenfield, 2014; Mayer & Sinai, 2003; Mazzeo, 2003).
This study defines a flight route as a directional airport pair with one or more carriers operating non-stop flights on it (Greenfield, 2014). Although flight routes arriving in East Asia include those from East Asian airports and airports outside the region, this study only includes routes among East Asian airports due to data limitations; previous literature
6
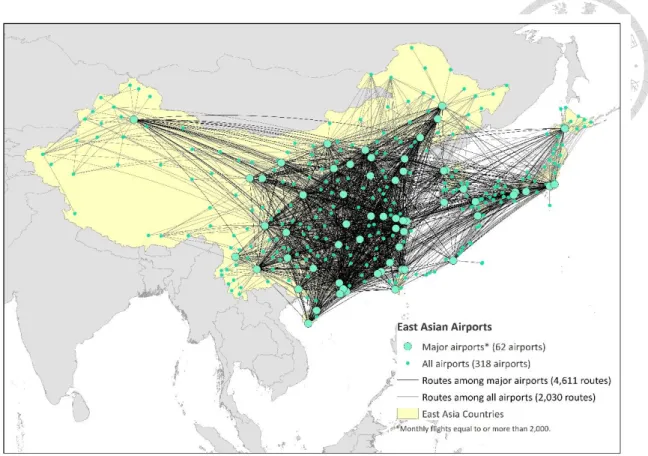
Figure 1.3. Geographical scope, airports and routes of this study
also only included routes or airports in a certain country or region (see the study regions indicated in Table 2.1 and Table 2.4).
Furthermore, this study measures the daily average arrival delay in half a year to understand the possible difference among days and months and to reduce the calculation burden while having sufficient observations for regression analyses.
1.2.2 Temporal Scope
This study focuses on flight delay determinants, particularly those in East Asia, and uses the daily average delay of each route as the outcome measure. This study utilizes the second half of 2017 (July 1, 2017 to December 31, 2017) as the temporal scope to ensure that timeliest data are adopted to fit in with the status quo and due to data limitations. The reason for selecting the second half of the year instead of the first half is that the on-time performance and amount of flights in East Asia considerably fluctuate in the second half of a year (VariFlight, 2017), during which the effect of months and delays due to
7
congestion may be observable. Considering the effects of historical events and daily and seasonal fluctuations, this study includes dummy variables for the month and days of a week to control for time and seasonal factors.
1.2.3 Geographical Scope
As shown in Figure 1.3, the geographical scope of this study is East Asia, which includes China, Hong Kong, Japan, Macau, South Korea, and Taiwan. In our sample, 4,611 routes exist among 318 East Asian airports. For analysis purposes, this study also estimates samples with major airports1, China airports, and international and domestic routes respectively. This study only includes routes among East Asian airports due to data limitations, and routes from or to airports out of East Asia are excluded. Appendix A shows the list of 318 East Asian airports.
1 Major airports are defined as those whose monthly flights are equal to or more than 2,000 in this study (VariFlight, 2017).
8
1.3 Research Process
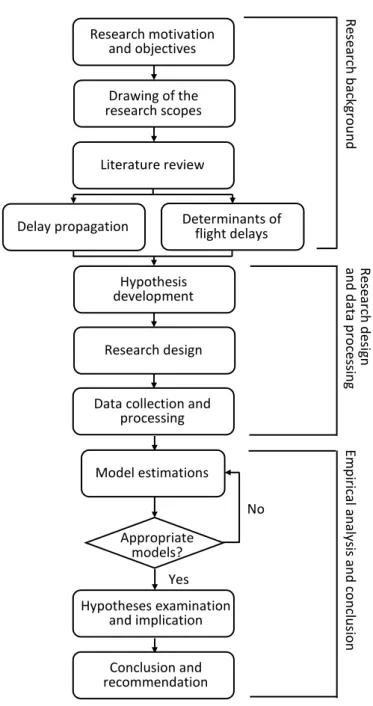
This study has three phases, namely, research background, research design and data processing, and empirical analysis and conclusion (Figure 1.4). The details of each phase are described as follows.
Figure 1.4. Research process Research motivation
and objectives
Drawing of the research scopes
Literature review
Delay propagation Determinants of flight delays
Research design
Data collection and processing Hypothesis development
Model estimations
No Appropriate
models?
Yes Hypotheses examination
and implication
Conclusion and recommendation
Research background Research design and data processing Empirical analysis and conclusion
9
1.3.1 Research Background
The first phase of this study focuses on clarifying the study’s motivation and objectives, drawing of the research scopes, and reviewing literature to provide the background of the study. The following text explains the content and purpose of each part.
1. Research motivation and objectives
Research motivation and objectives are used to clarify the origin and goals of this study, set the research scopes, and direct the literature review and research design.
2. Drawing of the research scopes
After describing the research’s motivation and objectives, the research object is set, that is, temporal and geographical scopes as the daily average arrival delays of 4,611 routes among 318 East Asian airports in the second half of 2017.
3. Literature review
The literature review contains two topics, namely, delay propagation and flight delay determinants, because this study aims to explore the determinants of flight delays in East Asia. The first topic is reviewed to understand how previous studies explored how delays are affected by other airports’ delays, which is defined as network determinants of flight delays in this study. The second topic (i.e., determinants of flight delays) is reviewed to understand how previous studies addressed this kind of research question, the variables they considered, and the temporal and geographical scopes they set.
1.3.2 Research Design and Data Processing
The second phase of this study involves hypothesis development, research design, and data collection and processing. The following text explains the content and purpose of each part.
1. Hypothesis development
10
This study combines important knowledge concluded from the literature review and findings from interviews with stakeholders (including competent authority of air transportation and senior executives of airport companies and carriers) to develop hypotheses regarding the determinants of delays from airport, route, and network perspectives.
2. Research design
The analysis method in this study is designed according to previous studies reviewed and includes model specifications and data processing to examine the established hypotheses.
3. Data collection and processing
This study initially identifies the sources and content of the data used to confirm whether these data are suitable for the research questions. Then, the data are arranged into forms required by the dependent variables (i.e., daily average arrival delay) and independent variables. Descriptive statistical analyses are conducted to understand the basic attribute information of the data.
1.3.3 Empirical Analysis and Conclusion
The last phase of this study involves the empirical analysis and conclusion, which include model estimations, examination of the hypotheses, discussion of the implications of empirical results, and provision of conclusions and recommendations.
1. Model estimations
Panel data regression is used for analysis because this study uses the data of each route in half a year as an observation. The empirical results of the model are utilized to understand the influencing relationships among the three perspectives’ determinants and flight delays.
2. Hypothesis examination and implication
11
The proposed hypotheses are examined after estimating the regression models using the collected data. The differences between the empirical results and hypotheses are discussed and compared with those in previous studies to identify the determinants of flight delays in East Asia. The implications of the empirical findings are also discussed.
3. Conclusion and recommendation
By summing up the research results, this study provides conclusions on the determinants of flight delays in East Asia to make up for the lack of studies of this kind in the region and to provide a new perspective, namely, considering the influences of connected airports, in this research field for future studies.
12
1.4 Research Methods
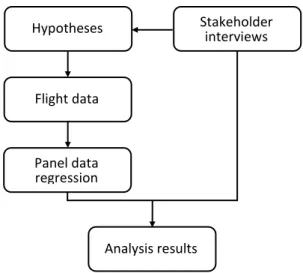
This study adopts a quantitative method (panel data regression model) as the main analysis method supplemented by interviews with relevant stakeholders through a qualitative approach (Figure 1.5).
Figure 1.5. Concept of research methods
Panel data regression models are applied to analyze the study data, which denote data based on the cross sections of individuals observed over time. Panel data analysis is the most appropriate regression method for this study to handle autocorrelations of time- series and cross-sectional data because this study uses flight route data during the second half of 2017, and these data include scheduled arrival times, actual arrival times, and other information on flights over half a year.
Moreover, interviews are conducted with senior executives from the Civil Aeronautics Administration, Taiwan Taoyuan International Airport Cooperation, and two flag carriers of Taiwan to thoroughly understand the characteristics of air transportation and flight delay conditions in East Asia for hypothesis development, consideration of possible variables or interaction terms, and explanation of the empirical results. The interview records (in Chinese) are shown in Appendix B.
Flight data
Panel data regression
Stakeholder interviews
Analysis results Hypotheses
13
2. Literature Review
This study aims to identify the determinants of flight delays in East Asia. Thus, this chapter reviews two topics from previous studies on flight delays, namely, flight delay propagation and flight delay determinants. After the literature review for these topics, overall remarks are proposed, and the research gaps that need to be fulfilled are identified as the foundation of this study.
2.1 Flight Delay Propagation among Airports 2.1.1 Review of Relevant Literature
Flight delays propagate because of the network pattern of air transportation, that is, a flight’s delay during one flying segment affects its subsequent flying tasks. Thus, a delay can spread from one part of the network to another (Hao et al., 2014). Many studies have been conducted on flight delay propagation, and their scales ranged from a single flight to multiple airports or even the airspace system of a country (i.e., with perspective from microscopic to macroscopic ones) (Hao et al., 2014; Yue & Wei, 2014). Only studies with a macroscopic perspective are reviewed (Table 2.1) because the current study explores the determinants of flight delays in East Asia.
Yue and Wei (2014) analyzed the correlation among different airports’ delays through the element extension method because most previous studies focused on flight delays in a single airport and due to the lack of research on delay propagation among airports or regions. Ten airports in China with a relatively large capacity were selected, and the average delay of each airport was used as a characteristic value to calculate and compare the delay index of each airport. A small absolute value of the difference between two delay index values was considered highly correlated. The researchers found that the
14
delays of other airports are positively related to an airport’s departure delay. By considering this finding, the prediction of airport delays can be improved.
Similar to Yue and Wei (2014), Zhang (2016) explored the influence of nine hub airports in China on Beijing Capital International Airport (PEK). To further determine the main factors that induce delay propagation, the research included not only the average delay of each hub airport but also the amount of flights from a hub airport to PEK, the total delay to PEK, and the amount of delays of a hub airport as the delay indices. Thus, the connecting relationship between a hub airport and PEK and the characteristics of a hub airport itself were considered. Moreover, using the element extension method and analytic network process (ANP) to decide the weight of each delay index, Zhang (2016) found that the total delay and amount of flights to PEK are influential delay indices, and each index has different effects on delay propagation. This finding indicates that a model that considers only one delay index is not convincing.
Adopting a more macroscopic perspective, Hao et al. (2014) investigated the influence of New York airports’ delays on the National Airspace System’s (NAS) delays (i.e., overall delays of the United States). Instead of “propagation,” they used the term
“impact” to emphasize that their research purpose is to determine how much delay is caused by a certain region’s delays rather than how much delay propagates from that region. Two different methods, namely, econometric (simultaneous equation regression model) and simulation (system-wide analysis capability model of United States’ Federal Aviation Administration or SWAC), were employed. The results of the two models suggest that the portion of delay in NAS caused by New York airports is less than the publicized estimates.
15 Table 2.1. Literature regarding flight delay propagation
References Subject; data; study region Analysis method Delay type Influencing factors Conclusion Hao et al. (2014) Airports in a region to a large
airports system; OEP 35 airportsa from 2004 to 2010;
the United States
Simultaneous equations regression model, SWAC* model
Arrival delay (daily average)
(1) Arrival delay of other airports
(2) Deterministic queuing delay (3) Adverse weather
(4) Total flight operations
The portion of delay in the NASa system caused by New York airports is much less than the publicized estimates.
Yue and Wei (2014)
Airport to airport; 10 airports on November, 4th, 2013;
China
Matter Element Extension, support vector machine
Departure delay (hourly average)
Delays of other airports Delay of other airports are positively related to one airport's delay, and with consideration of them the future delays of the airport can be improved.
Zhang (2016) Several airports to one airport;
10 airports, date not provided;
China
Matter Element Extension, Analytic Network Process
Daily total departure delay
Following figures of other airports:
(1) Airport average delay (2) Amount of delayed flight (3) Amount of flight to PEKa (4) Total delay to PEK
1. Total delay to PEK and amount of flight to PEK are more important delay indices than others.
2. Each index has different influence on delay propagation, thus considering an analysis not convincing if only one delay index is considered.
a OEP 35: 35 Operational Evolution Plan airports in the United States; SWAC: System-Wide Analysis Capability model of United States’ Federal Aviation Administration; NAS:
Nation Airspace System; PEK: Beijing Capital International Airport.
16
2.1.2 Comparisons and Analyses
This subsection compares and analyzes the reviewed flight delay propagation studies, as indicated in Table 2.1.
(1) Research region
The literature review shows that previous studies on flight delay propagation focused on airports in a single nation, either in the United States or in China, whereas studies on a multi-nation region, such as East Asia, are limited. The flight delay determinants in a single nation may not be able to fully explain the flight delay of a multi-nation region because of possible differences between domestic and international routes.
Furthermore, literature on delay propagation at either nation or region level is limited, indicating that additional studies are necessary to understand how the delays of an airport or route can be affected by its connected airports.
(2) Research subject
Depending on each study’s purpose, the reviewed studies in this section can be categorized into two types: delay propagation from an airport to another airport (Yue &
Wei, 2014; Zhang, 2016) and delay propagation from airports in a specific region to a larger air transportation system (Hao et al., 2014). However, the effect of a route’s delay on connected airports, which is the subject of this study, remains unclear.
(3) Delay type
Two types of delays, namely, arrival and departure, have been investigated in extant literature, and their definitions are similar, that is, they pertain to the difference between scheduled and actual times of arrival or departure (Table 2.2). Delay measurements in literature can also be categorized into two types due to different research purposes. Hao et al. (2014) applied daily average delays per flight in New York airports and 32 other operational evolution plan (OEP) airports as the dependent variables in their models to
17
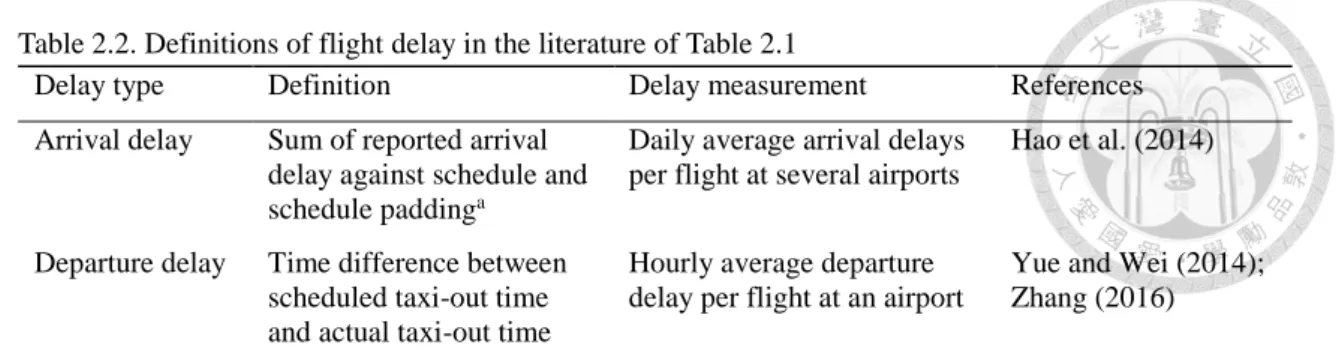
Table 2.2. Definitions of flight delay in the literature of Table 2.1
Delay type Definition Delay measurement References
Arrival delay Sum of reported arrival delay against schedule and schedule paddinga
Daily average arrival delays per flight at several airports
Hao et al. (2014)
Departure delay Time difference between scheduled taxi-out time and actual taxi-out time
Hourly average departure delay per flight at an airport
Yue and Wei (2014);
Zhang (2016)
a Schedule padding is defined as the difference between scheduled flight time and the 20th percentile of the actual flight time (Hao et al., 2014).
avoid the influence of daily fluctuation of arrival delay. By contrast, Yue and Wei (2014) and Zhang (2016) used hourly average delays per flight in each airport to clarify the correlation of the flight delays of multiple airports and to conduct hourly delay forecasting for airports.
(4) Analysis methods
Yue and Wei (2014) and Zhang (2016) applied the matter element extension method to calculate the delay index of each airport and compared each airport’s delay index with PEK’s delay index to determine which airport’s delay has a higher impact on PEK’s delay.
In addition, Hao et al. (2014) applied the simultaneous equation regression model to investigate the impact of three New York airports on NAS delays. The delays of New York and other US major airports were used separately as dependent variables in two equations and as one of the independent variables in each other’s equation to identify the counter-impact on delay between New York and other major US airports.
(5) Influencing factors
The factors that influence flight delays considered in the reviewed studies are listed in Table 2.3 and can be classified into two categories: network and airport factors.
Network factors can be subdivided into two types: factors regarding the characteristic of a connected airport and factors regarding the connecting relationship between a connected airport and the airport concerned.
18
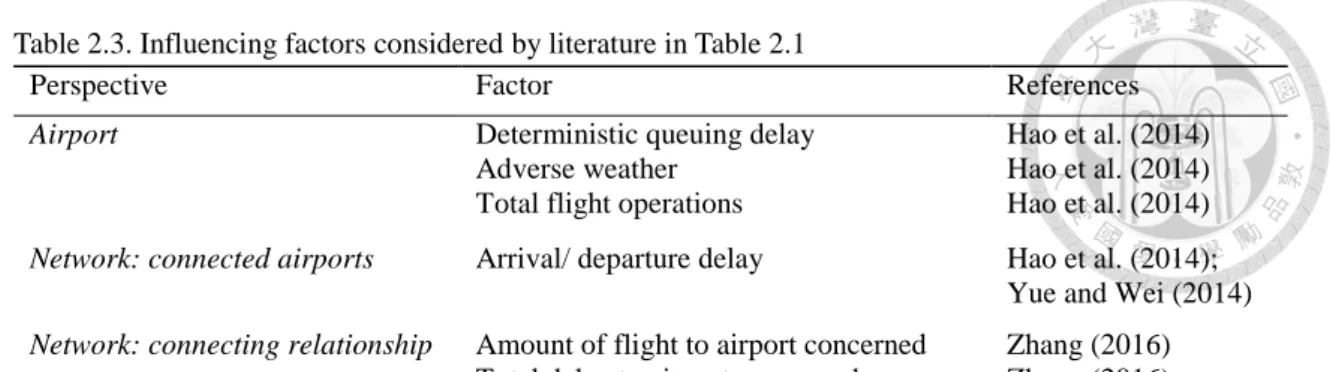
Table 2.3. Influencing factors considered by literature in Table 2.1
Perspective Factor References
Airport Deterministic queuing delay Hao et al. (2014)
Adverse weather Hao et al. (2014)
Total flight operations Hao et al. (2014) Network: connected airports Arrival/ departure delay Hao et al. (2014);
Yue and Wei (2014) Network: connecting relationship Amount of flight to airport concerned Zhang (2016)
Total delay to airport concerned Zhang (2016)
For network factors regarding a connected airport, Hao et al. (2014) and Yue and Wei (2014) selected the arrival or departure delay of connected airports, which is the characteristic of connected airports themselves, as a factor. For network factors regarding the connecting relationship, Zhang (2016) considered the number of flights between connected airports and the airport concerned and the total delay for flights from connected airports to the airport concerned.
For airport factors, various determinants, such as deterministic queuing delay of an airport, total flight operations at airports, and adverse weather in the region where the airport is located, were considered (Hao et al., 2014).
19
2.2 Determinants of Flight Delays 2.2.1 Review of Relevant Literature
This section reviews studies that focused on exploring the determinants of flight delays and summarizes their contents in Table 2.4. The research reviewed in Section 2.1 may be regarded as being related to this section. However, the research in Section 2.1 only focused on one determinant, which is the delays of other airports. The following studies focused on a certain aspect of possible determinants of flight delays, most of which pertain to the influence of competition and congestion effects either from the airport or route perspective2. Several discussed other determinants, such as Internet or carrier codeshare alliances.
Category 1: Airport perspective – airport congestion internalization
Adopting an airport perspective, the reviewed research mostly focused on examining whether having a higher market share at an airport generates more incentives for a major carrier to internalize its own delays to avoid affecting the on-time performance of other flights of its own, which is called the “congestion internalization hypothesis” (Bendinelli et al., 2016).
Different from road transportation, in which each driver is atomistic, air transportation carriers are non-atomistic. Brueckner (2002) examined congestion theory from road pricing theory, which assumes that each user does not consider the delays he/she imposes on fellow users, to check its applicability in air transportation. Using data from 25 US airports in 1999, research examined the theory through multiple linear regression models. The dependent variable for the regression was the total delays of an airport in 1999, and three measures of airport concentration were used as primary
2 Bendinelli et al. (2016) named determinants regarding an airport’s characteristics as “airport-level”
determinants, and those regarding a route’s characteristics as “route-level” determinants. This study continues using such idea while replacing the term of “level” with “perspective” to prevent the misunderstanding that there is a hierarchical relationship existing between airports and routes.
20
independent variables. He found that in monopoly and oligopoly cases, a carrier internalizes the congestion each flight imposes on other flights it operates, which is different from the assumption of road pricing theory.
However, airports that are dominated by one large carrier in the US still have the largest overall delays. Mayer and Sinai (2003) examined two factors that may induce air traffic congestion and delays, namely, network benefits due to hubbing and congestion externalities. A dataset of flight information on Fridays from January 1988 to November 2000 was used for fixed-effect regression models. Given that carriers can adjust their schedules to compensate for expected delays, the study constructed a measure of delay, that is, actual travel time minus minimum feasible travel time, as the dependent variable.
The Herfindahl–Hirschman index (HHI)3 of origin and destination airports and the hub size of airports and carriers were included as independent variables to examine the two aforementioned factors. The results showed that network benefits due to hubbing make up a more important factor for air traffic congestion than congestion externalities.
Considering that previous literature measured delays from the carriers’ point of view, Rupp (2009) examined previous hypotheses from the perspectives of carriers and passengers by differentiating delay measures as follows: excess travel time as the carriers’
perspective and arrival/departure delay as the passengers’ perspective. Apart from independent variables regarding concentration and hub airports and carriers, Rupp (2009) also considered demand, economic, logistical, and weather variables as control variables.
Through fixed-effect regression models and by using a dataset of randomly selected 1%
flights from January 1995 to December 2004, the study found that carriers are not internalizing the costs of flight delays, especially from passengers’ point of view.
3 Defined as the sum of the squares of the market shares of the firms within the industry, which is a commonly used measure of market concentration.
21
Most previous studies are based on the US, and studies that are suitable for the European setting are limited. Therefore, Santos and Robin (2010) compared the differences between US and European settings and used the variables adopted by Mayer and Sinai (2003) to determine if these variables have the same effects on delays at European airports. The flight data of all domestic and intra-European flights from 2000 to 2004 were used, and the seasonal average delay of a carrier for a route was adopted as the dependent variable. The independent variables included airport concentration, slot control level, and hub size of the airport and carrier. The research results showed that the coefficients of primary independent variables may differ from those in research based on the US possibly due to the local characteristics of Europe.
Category 2: Route perspective – competition and quality
Another category of literature examined the influence of competition on service quality and regarded on-time performance as an indicator of carrier quality. Different from this research category, route perspective research analyzed the route delays of origin–destination pairs. The main hypothesis was that route concentration generates low incentives for dominant carriers to engage in good service quality with respect to on-time performance (Bendinelli et al., 2016).
Mazzeo (2003) conducted the first study that examined the relationship between competition and service quality and considered on-time performance a proxy of service quality. Arrival delay was used as a dependent variable in the base regression. Among the independent variables, competition was measured by monopoly route, market share of the carrier in origin and destination airports, and HHI index; the control variables included weather conditions and flight, airport, and airplane characteristics. Multiple linear regression models and a dataset of 50 major airports in April and July 2000 were used.
22
The empirical results indicated that flights are frequently on-time on routes that are served by few carriers. Carriers schedule long flight times on routes under their monopoly.
While previous studies regarded market structure (i.e., concentration) as exogenously determined with respect to on-time performance, Greenfield (2014) addressed the endogeneity of market structure through two instrument variables, namely, lagged HHI and changes in HHI after the 2008 merger between Delta Air Lines and Northwest Airlines in the US. Greenfield (2014) found the same correlation between concentration and on-time performance by using a panel dataset from 2005:Q4 to 2010:Q3 and a fixed-effect model; the effect of competition on route delays was three times stronger than that in previous studies’ findings.
Bendinelli et al. (2016) examined the hypotheses of previous research from both perspectives and the hypothesis about the impact of low-cost carriers (LCCs) stating that LCC entry affects the airport congestion internalization and on-route service quality improvement of incumbent carriers. A fixed-effect model of flight delays was developed, and a dataset of a panel of 209 routes in Brazil between January 2002 and December 2013 was used for analysis. Combining airport and route variables in the empirical analysis, Bendinelli et al. (2016) discovered that the hypotheses for airport and route variables in previous research, that is, the congestion internalization hypothesis and the competition–
quality hypothesis, are observable in the Brazilian airline market. LCC entry induces internalization from the airport perspective, and they found evidence on incumbents reducing the prevalence of flight delays (but no evidence on the impact on the duration of such delays). However, they did not find sufficient evidence to support an accentuation effect of LCC entry on the competition–quality relationship.
Category 3: Others
23
Previous studies that focused on other determinants of flight delays apart from airport and route factors are placed in the third category.
While previous studies examined the relationship between market structure and service quality, Prince and Simon (2009) were interested in the effect of multimarket contact on the service quality of carriers, with the proposition that firms meeting in multiple markets compete less aggressively to avoid the possible revenge of competitors in other markets. Their hypotheses were that multimarket contact negatively affects service quality, and multimarket contact in competitive markets has minimal effect on service quality. The hypotheses were tested using US domestic flight data on Fridays from January 1995 to August 2001. Different measurements of on-time performance of a carrier on a route in a month were used as dependent variables, and the average multimarket contact of that carrier was employed as independent variables. Applying fixed-effect models, they found strong evidence for the first hypothesis and some support for the second one.
Suspecting that the Internet makes the market highly competitive and motivates firms to reduce prices, Ater and Orlov (2015) examined the effect of the Internet on on- time performance of flights through a fixed-effect regression model and a dataset of one Thursday in each quarter in 1997, 1998, 2000, 2001, 2003, and 2007 of nine carriers.
They found that Internet access leads to long scheduled flight times, and actual flight times and arrival delays increase when many passengers have Internet access.
Yimga (2017) was interested in the influence of code-sharing agreement on on-time performance of carriers by using a fixed-effect regression model and a dataset of the 3rd and 4th quarters of 2002 and 2004 of 19 carriers. The research found that code-sharing agreement improves alliance carriers’ on-time performance, and those that competed before the agreement was built improve more than those who did not.
24
Prince and Simon (2014) investigated how incumbent firms’ service quality changes in response to entry and entry threats. The data they used included the on-time performance of other carriers on routes treaded by Southwest Airline in 1993–2004. They used fixed-effect regression models to address the research question. The dependent variables included different measurements of on-time performance of a carrier on a route in a quarter. The independent variables of interest were dummy variables indicating periods before or after the entry or entry threats by Southwest. The research results showed that incumbent on-time performance worsens in response to entry and entry threats when the entrant is an LCC. This result differs from that in previous research that concluded a positive relationship between service quality and competition (Mazzeo, 2003;
Prince & Simon, 2009; Rupp et al., 2006).
This review reveals that previous studies focused on airport and route determinants, multimarket contact, Internet, competitor’s entry, code-sharing agreement, and entry threats but seemingly overlooked the network determinants on delays.
25 Table 2.4. Literature regarding determinants of flight delays
References Subject; data; study region
Analysis method Dependent variables Independent variables Conclusion
Primary variables Control variables Category 1: Airport perspective – airport congestion internalization Brueckner
(2002)
Airport-year; 25 most delayed airports in 1999; the United States
Multiple linear regression model
Total delay HHIb (airport)
Flight share of the airport’s largest carrier
Flight share of the airport’s largest carrier exceeds 65 percenta
Total flight operations at the airport
Airport huba Slot-controlleda Precipitation
When an airport is dominated by a monopolist, congestion is fully internalized; when in oligopoly situation, carriers only internalize the congestion they impose on themselves.
Mayer and Sinai (2003)
Route-carrier- month-year; Fridays between January 1988-November 2000; the United States
Multiple linear regression model
(1) Excess travel time (2) Departure delay (3) Taxi-out time (4) Flight time (5) Taxi-in time (6) Difference in excess
travel time between outbound and return flights
(7) Difference in total travel time between outbound and return flights
HHI (airport) Airport hub sizea Carrier hub sizea
Annual population Employment Per capita income Yeara
Montha Carriera
Airport (fixed effect)a
1. Congestion externalities (that carriers only internalize the congestion they impose on themselves) do lead to air traffic delays.
2. However, hubbing effect is the dominant contributor to delays, that delay increases more with the size of a hub.
Rupp (2009) Flight; randomly selected 1% flights from January 1995 to December 2004;
the United States
Multiple linear regression model
(1) Excess travel time (2) Arrival delay (3) Departure delay
HHI (airport) Airport hub sizea Carrier hub sizea Airport hub size × HHI Carrier hub size × HHI
Annual population Income per capita Employment
Normalized departure time Flight distance
Seating capacity Average monthly load factor
Yield per flight Monopoly routea
The use of new delay measures reverses earlier studies’ findings, that carriers do not internalize flight congestion.
26 References Subject; data; study
region
Analysis method Dependent variables Independent variables Conclusion
Primary variables Control variables Carrier
Month Year
Airport (fixed effect)a Santos and
Robin (2010)
Route-carrier- season-year; 2000- 2004; Europe
Multiple linear regression model
Arrival delay HHI (airport) Slot coordinationa Airport hub sizea Carrier hub sizea
Annual GDP per capita Population
Unemployment rate Seasona: Spring & Summer;
Autumn Yeara Carriera
Airport (fixed effect)a
1. The effect of airport hub size does not increase monotonically, which probably because the hub- and-spoke system in Europe is not as extensive as in the US, and that most hub airports in Europe are slot controlled.
2. The result for congestion internalization support previous studies’ hypothesis (Brueckner, 2002; Mayer & Sinai, 2003).
Category 2: Route perspective – competition and quality Mazzeo (2003) Flight; 50 major
airports in January, April and July of 2000; the United States
Multiple linear regression model
(1) Arrival delay (2) Probit of a flight
which is more than 15 (45) minutes late (3) Minutes late for a
flight/average minutes late for all flights into that airport during the same period
Monopoly routea HHI (route)
Carrier’s share of total flights at origin and destination airports
Weathera
Scheduled arrival time Length of flight
Travels from west to east Num. of flights scheduled to land at the same airport Into huba
Out of huba Age of aircraft Num. of seats Airbusa Boeinga
Airport (fixed effect)a Carrier (fixed effect)a
Flights delays more on routes that are served by only one carrier and in cases where the carrier’s market share at the airports served are higher. Thus, less competition decreases the service quality (on- time performance) of a route.
27 References Subject; data; study
region
Analysis method Dependent variables Independent variables Conclusion
Primary variables Control variables Greenfield
(2014)
Carrier-route- quarter; 2005: Q4- 2010: Q3; the United States
Multiple linear regression model
(1) Arrival delay (2) Log odds of an
arrival delay (3) Departure delay (4) Log odds of a
departure delay
HHI (route)
HHI (route, nonstop traffic only)
Six-quarter-lagged HHI Changes in HHI
Income Population Weather
Total number of flights in airport
Carrier-route (fixed effect)a
The result supports the hypothesis of previous studies, but the effect of competition on carrier’s on-time performance is three times stronger than previous studies suggest.
Bendinelli et al. (2016)
Route-month;
January 2002 to December 2013, 209 routes; Brazil
Panel data regression model (fixed-effects)
(1) Log odds of arrival delay
(2) Arrival delay (3) Log odds of
departure delay (4) Departure delay
Num. of flights in congested hours
Num. of flights in uncongested hours HHI (city pair)
LCCb presence (city pair)a HHI (maximum value between endpoint cities) LCC presence (on either of the endpoint cities)a
Proportion of flights held for late connections Codeshare agreementa Proportion of flights with bad weather
Proportion of flights with incidents
Max proportion of city delayed flights
1. When airport and route
perspective effects are estimated simultaneously, congestion internalization and the
relationship between competition and quality found in previous studies are also observed in the Brazilian airline market.
2. Entry of LCC improves on-time performance.
Category 3: Others Prince and
Simon (2009):
multimarket contact – delay
Carrier-route-month;
Fridays in January 1995 to August 2001 of 10 major carriers;
the United States
Panel data regression model (fixed-effects)
(1) Arrival delay (2) Flights arriving at
least 15 (30) minutes late (%)
(3) Scheduled flight time (4) Travel time
(5) Non-airtime (6) Airtime (7) Departure delay (8) Flights departing at
least 15 (30) minutes late (%)
Average multimarket contact
Average multimarket contact on low, medium and high-concentration routes
Monopoly routea HHI (route) Route passengers Average market share at route airports
Num. of routes carriers offers from route airports Num. of routes carriers offers from other airports Num. of departures carrier makes on the route Average num. of flights departing from the origin
Carriers with higher multimarket contact provide worse on-time performance.
28 References Subject; data; study
region
Analysis method Dependent variables Independent variables Conclusion
Primary variables Control variables
airport and arriving in the destination airport of a route in same hour Prince and
Simon (2014):
entry - delay
Carrier-route- quarter; 1993-2004 of 58 airports; the United States
Panel data regression model (fixed-effects)
(1) Arrival delay for more than 15 (30) minutes late (%) (2) Arrival delay (3) Scheduled flight time (4) Travel time
Proximity to threat of entry Proximity to entry
Load factor
Carrier’s flights on the route
Num. of flights arriving at destination airport Num. of flights departing from origination airport
Incumbents do not improve on-time performance in response to entry, while this phenomenon can only be observed when the (potential) entrant is a low-cost carrier.
Ater and Orlov (2015):
internet and delay
Flight; one Thursday in each quarter in 1997, 1998, 2000, 2001, 2003 and 2007, 9 carriers; the United States
Panel data regression model (fixed-effects)
(1) Scheduled elapsed flight time
(2) Actual elapsed time (3) Arrival delay (4) Shortest scheduled
flying time
Internet HHI (route) Internet × HHI LCCa
Internet × LCC Internet × HHI × LCC Morning flights (business flights)a
Internet × Morning flights Flights connect to large cities (business flights) (large)a
Internet × large × morning
Num. of flights departing from and arriving at the origin and destination airports within the same hour
Average fare
The result shows that increased Internet use led to longer scheduled elapsed flight times and arrival delay, particularly in more competitive environments.
Yimga (2017):
Code-sharing - delay
Carrier-origin- destination-month- year; 3rd and 4th quarters of 2002 and 2004, 19 carriers; the United States
Multiple linear regression model
(1) Arrival delay (2) Arrival delay for
more than 15 (30) minutes late (%) (3) Departure delay
Alliance carriera Post-alliance perioda Alliance carrier × post- alliance period Competed prior to the alliancea
Hub carriera Carrier hub size Population Flying distance Carrier’s relative speed Monopoly routea Num. of competitors
Codeshare alliance improves both arrival and departure on-time performance for the alliance firms, and the effects are larger in markets where the partners competed in prior to the alliance.
29 References Subject; data; study
region
Analysis method Dependent variables Independent variables Conclusion
Primary variables Control variables (4) Departure delay for
more than 15 (30) minutes late (%)
Alliance carrier × post- alliance period × competed prior to the alliance
Carrier (fixed effect) a Time (fixed effect) a
a Dummy variable.
b HHI: Herfindahl-Hirschman index; LCC: low-cost carrier.