Trends and characteristics of pethidine use in Taiwan: a six-year long survey
Running title: pethidine use in Taiwan
Hsueh-Hsing Pan,I Chung-Yi Li,II,III Tso-Chou Lin,IV Ju-O Wang,V Shung-Tai Ho,IV,VI Kwua-Yun WangVII,VIII
I
Graduate Institute of Medical Science, National Defense Medical Center, Taipei, Taiwan.
II
Department of Public Health, National Cheng Kung University, Tainan, Taiwan.
III
Department of Public Health, China Medical University, Tainan, Taiwan.
IV
Department of Anesthesiology, Tri-Service General Hospital, Taipei, Taiwan.
V
Graduate Institute of Life Science, National Defense Medical Center, Taipei, Taiwan. Department of Anesthesiology, Taipei Veterans General Hospital, Taipei, Taiwan.
VI
Department of Anesthesiology, Taipei Veterans General Hospital, Taipei, Taiwan.
VII
Department of Nursing, Taipei Veterans General Hospital.
VIII
School of Nursing, National Defense Medical Center, Taipei, Taiwan.
Corresponding authors: K. Y. Wang
Address: Department of Nursing, Taipei Veterans General Hospital, No.201, Sec.2, Shipai Rd., Taipei 112, Taiwan; School of Nursing, National Defense Medical Center, No.161, Sec. 6, Minquan E. Rd., Neihu Dist., Taipei City 114, Taiwan.
Tel: 886-2-28757233 or 886-2-87923100 ext.18766 Fax: 886-2-28752932
E-mail: [email protected]
2
Trends and characteristics of pethidine use in Taiwan: a six-year long survey
ABSTRACT
OBJECTIVES: To investigate the trends and characteristics of pethidine prescriptions and users in Taiwan from 2002-2007.
METHOD: A sample of pethidine users (n=3,301,136) recruited in 2002-2007 was linked to National Health Insurance claims to identify their pethidine prescriptions. We examined the trends of pethidine users and prescriptions and calculated the prevalence of pethidine users and the proportion of pethidine prescriptions. We also used logistic regression models to compare patient demographics and health care characteristics for all pethidine prescriptions between 2002 and 2007.
RESULTS: Although the numbers of pethidine users and prescriptions decreased over the six-year period, there were more than half a million people prescribed
pethidine annually. An increasing proportion of pethidine prescriptions were in clinics, outpatient settings, and operations with cancer diagnoses. Additionally, pethidine prescriptions were mostly associated with non-operation status without cancer
diagnosis (>60%). However, about 10% of total pethidine prescriptions were found in cancer diagnoses but without operations. Compared to those in 2002, pethidine prescriptions in 2007 were significantly to be found in people >=80 years, rural residents, patients from clinics, outpatient settings and operations with cancer diagnoses.
CONCLUSIONS: Certain health care settings accounted for an increased proportion of pethidine use in Taiwan. There were still 10% of total pethidine prescriptions found in cancer patients without operations, suggesting for further careful evaluation for
4 their appropriateness.
KEYWORDS: Pethidine; Prescription; Consumption; Defined daily dose; Population-based.
INTRODUCTION
Pethidine (meperidine) because of its short action duration, had been a widely used analgesic, routinely prescribed for moderate-to-severe pain in medical and surgical patients (1, 2). Pethidine is metabolised by the liver into a variety of metabolites, most important of which is the active metabolite, normeperidine (3). Later pethidine use became known to be associated with certain unique side effects such as serotonergic crisis and normeperidine toxicity, including central nervous system excitatory effects such as seizures, tremor, myoclonus, hyperreflexia and psychosis. These adverse effects become evident if multiple doses are given over a period of time (3-5). In addition, the adverse reactions from normeperidine can occur in patients with normal renal function if administered doses are sufficiently high (4). Besides this issue, the once-purported theoretical advantages of pethidine over morphine for patients with cholecystitis or pancreatitis have also been challenged (6). Consequently, updated pain management protocols have called for pethidine’s cautious use, as awareness of its adverse effects grows (3). One example is the Agency for Health Care Policy and Research’s recommendation, who suggest that oral pethidine should not be used for pain management and strongly recommend that parenteral pethidine be restricted to patients who have a true allergies or intolerance to other opioids and then, that it should only be used in acute pain situations for very brief courses (7, 8).
Despite clinical guidelines that have been issued against pethidine use in many nations (9), it continues to be used in many parts of the world including in Taiwan (10-13). One of the arguments supporting the use of pethidineis that concurrent
analgesics given with pethidine can achieve adequate analgesiawithout causing adverse effects in patients with renal failure or medicationscontraindicated with pethidine use
6
(14). Moreover, pethidine was found to produce fewer side effects than morphine if it is used for short term periods (15). Therefore, pethidine is still a frequently ordered opioid analgesic today, especially for patients who receive shorter courses of narcotics (16, 17).
To our knowledge, information concerning recent trends and factors associated with pethidine use in Taiwan and other nations is rather limited in the literature. We therefore conducted this population-based study, using data from National Health Insurance (NHI) claims to investigate the trends and characteristics of pethidine prescriptions and users in Taiwan from 2002-2007.
MATERIALS AND METHODS
Source of data
Data analyzed in this study was retrieved from the National Health Insurance Research Database (NHIRD) provided by the Bureau of National Health Insurance (BNHI) (18). Taiwan reformed health its insurance programs into the universal National Health Insurance (NHI) system in 1995, and more than 99% of residents in Taiwan were enrolled in the NHI program in 2007 (18). This NHI research database contains registration files and original claim data for reimbursement, and offers information on each patient’s characteristics, diagnosis, treatments, prescriptions, and associated ambulatory and inpatient medical benefit claims. It also protects the privacy and confidentiality of all beneficiaries and only transfers the health insurance data to health researchers after ethical approval has been obtained.
For the current analysis, we used all pethidine prescriptions issued in outpatient and inpatient claims from 2002 to 2007. All NHI datasets can be inter-linked with each individual’s personal identification number (PIN). The research protocol of this analysis has been ethically approved by the Review Committee of the National Health Research Institutes.
Study subjects and measurements
This was a descriptive study that depicts secular trends and characteristics of pethidine prescriptions and users in Taiwan from 2002 to 2007. During the study period, a total of 3,380,884 prescriptions, of which 99.1% and 0.9% were injections (drug code: A005874209) and tablets (drug code: A005858100), respectively, were prescribed to 3,301,136 patients. From each prescription claim, we retrieved information on the patient’s date of birth, gender, and urbanization level of the
8
patient’s residential area, medical institution accreditation level (clinic, local, regional hospital, or medical center), setting (hospital, outpatient, or emergency department), operation status, and cancer diagnosis status. Age of the study patient was calculated as the difference between the date of the prescription and date of birth. The
urbanization level for each of the 365 townships in Taiwan is categorized (i.e., urban, suburban, or rural) according to the National Statistics of Regional Standard
Classification (19). Outpatient claims provided one procedure code and up to three diagnostic codes for each ambulatory care visit. Inpatient claims included up to five codes for procedures and diagnoses separately. All codes are based on the
International Classification of Diseases codes, 9th version Clinical Modification (ICD-9-CM). The operation was determined by any procedure code of ICD-9-CM issued except an obstetrical procedure (72-75), miscellaneous diagnostic and
therapeutic procedure (87-99), and diagnosis procedures on the nervous system (01.1, 03.3, 05.1), endocrine system (06.1, 07.1), eye (08.1, 09.1, 10.2, 11.2, 12.2, 14.1,15.0, 16.2), ear (18.1, 20.3), nose, mouth, and pharynx (21.2, 22.1, 24.1, 25.0, 26.1, 27.2, 28.1, 29.1), respiratory system (31.4, 33.2, 34.2), cardiovascular system (37.2, 38.2), hemic and lymphatic system (40.1, 41.3), digestive system (42.2, 44.1, 45.1, 45.2, 48.2, 49.2, 50.1, 51.1, 52.1, 54.2), urinary system (55.2, 56.3, 57.3, 58.2, 59.2), male genital organs (60.1, 61.1, 62.1, 63.0, 64.1), female genital organs (65.1, 66.1, 67.1,68.1,70.2,71.1), musculoskeletal system (76.1, 78.8, 80.2, 80.3, 83.2), and integumentary system (85.1, 86.1). Any claims with accompanied primary or secondary diagnoses of malignancy (140-209, 230-239) were classified as a cancer diagnosis.
The amount of pethidine prescription was expressed as the defined daily dose (DDD) per 1000 inhabitants per day (20). DDD is a technical unit of measurement,
established by an expert panel as the assumed average maintenance dose when the drug is used for its main indication by an adult, and is based on the Anatomical Therapeutic Chemical (ATC) classification index (20). The following formula is used in this analysis:
Number of DDD/1000 inhabitants/day = (number of packages dispensed × number of doses per package × number of mg per dose) / (DDD in mg × number of 1000 inhabitants in the mid-year population × 365 days).
The DDD values of pethidine in milligrams are 400 (20). The mid-year population in each year over the study period was obtained from the Ministry of the Interior of Taiwan (21).
Data analysis
We first describe the secular trend of annual numbers of pethidine users, total prescriptions, total amounts, and DDD/1000 inhabitants/day according to the forms of pethidine (i.e., injections or tablets). We then calculated the prevalence rate of
pethidine users in each year. We also calculate the proportion of total pethidine prescriptions in each year associated with selected health care characteristics. To further compare patient demographics and health care characteristics for all pethidine prescriptions between 2002 and 2007, we perform simple and multiple logistic
regression models, with a generalized estimation equation accounting for clustering of prescriptions administered to the same patient. This estimates the odds ratio (OR) of receiving pethidine prescription in 2007 in relation to the selected patient
demographics and health care characteristics. In addition, we calculate the proportion of primary diagnosis distribution based on ICD-9-CM diagnostic codes for pethidine prescriptions according to non-operation status with and without cancer diagnosis
10
over the six-year period. All statistical analyses were performed with SAS (version 9.2; SAS Institute, Cary, NC). A P value <0.05 was considered statistically significant.
RESULTS
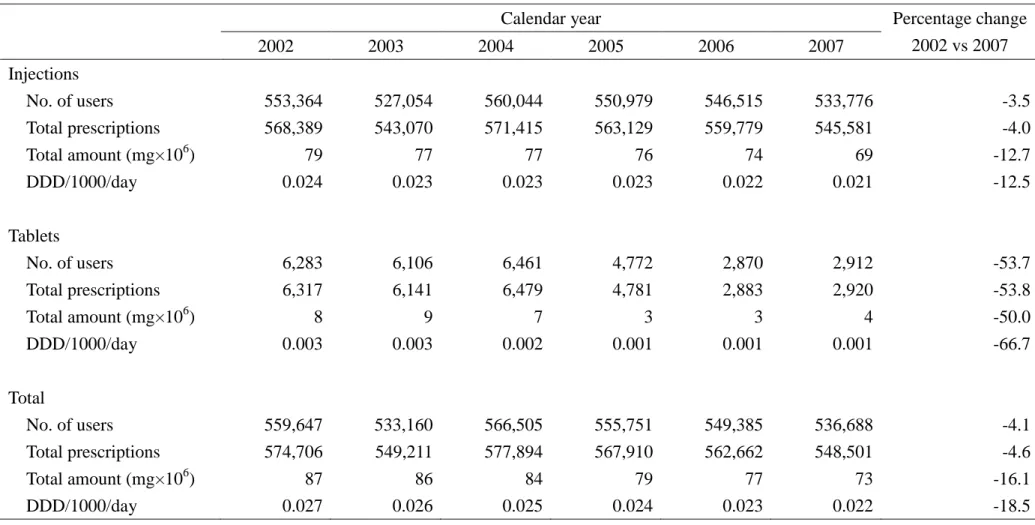
Pethidine was prescribed to more than 500,000 people annually for pain relief from 2002 to 2007, albeit the numbers of pethidine users and total prescriptions decreased slightly, by 4.1% and 4.6%, respectively, over the study period. The DDD/1000 /day decreased from 0.027 to 0.022, representing a reduction of 18.5%. This decreasing trend is more obvious for tablets than for injections (Table 1).
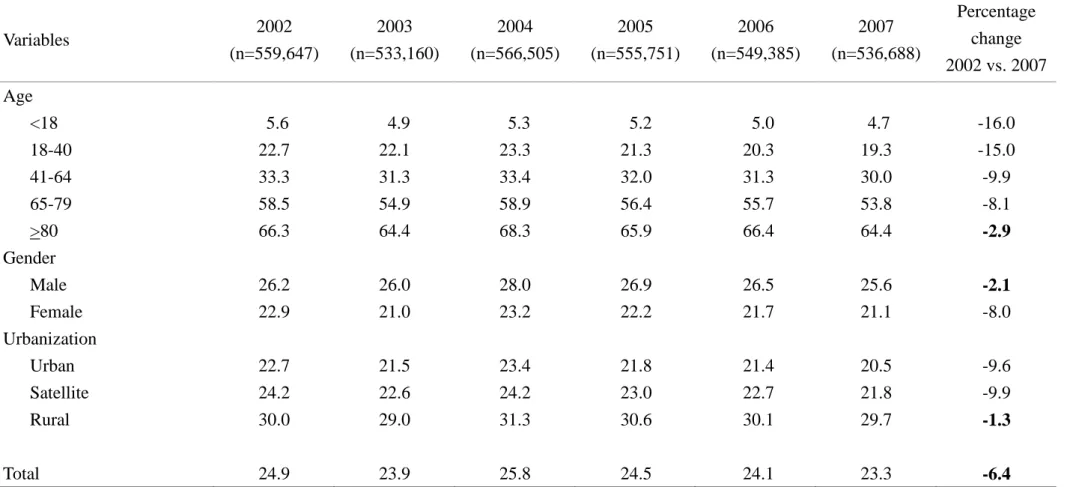
Table 2 shows the prevalence rate of pethidine users during the study period. The overall prevalence of pethidine users was 24.9 per 1,000 people in 2002, increased slightly in 2004, and then declined gradually in 2007, representing a 6.4% decrease over the study period. The prevalence rate increased with age, especially high in very old people (>=80 years), ranging from 64.4 to 68.3 per 1,000 people. Men had a higher prevalence than females. Additionally, there was an apparent geographic variation in the prevalence of pethidine use; people living in rural areas had higher prevalence rate of pethidine use than in urban areas. We also note that the subgroups with higher prevalence rates of pethidine users tended to have a smaller percentage reduction in prevalence over the study period. People aged >=80 years, men, and those from rural areas all experienced small reductions in prevalence at 2.9%, 2.1% and 1.3%, respectively. On the other hand, the largest reduction in prevalence of pethidine users was among people <40 years (15%-16.0%); the corresponding figures for women and urban residents are 8.0% and 9.6%.
Table 3 illustrates the distributions of pethidine prescriptions across various health care characteristics. Medical centers accounted for the largest proportion of
prescriptions, which however, decreased 9.6% from 2002 to 2007. Although the proportion of pethidine prescriptions for clinics was very small (<2%), it showed a
12
substantial increase (19.7%). More than 70% of pethidine prescriptions were given in inpatient settings; and 61.9% to 63.4% of pethidine was prescribed to non-operation status without cancer diagnoses. Despite that, the proportion of prescriptions for inpatient settings and for those non-operation status without cancer diagnoses
decreased by 4.1% and 1.5%, respectively, during the study period. On the other hand, pethidine prescriptions from outpatient settings and operations with cancer diagnoses demonstrated notable increases in proportion, at 20.1% and 22.7%, respectively.
The patient demographics and health care characteristics in pethidine prescriptions between 2002 and 2007 are shown in Table 4. In terms of age, pethidine prescriptions tended to be among older people in 2007. Pethidine prescriptions in 2007 compared to 2002 were 1.27 times and 1.77 times more likely among people aged 65-79 years and >=80 years, respectively. Additionally, pethidine was more likely to be prescribed to people living in rural cities (OR=1.09, 95% confidence interval (CI)=1.08-1.10) in 2007. With respect to health care characteristics, compared to those issued in 2002, the prescriptions in 2007 were more likely to be seen in clinics (OR=1.48, 95% CI=1.43-1.54) and outpatient settings (OR=1.27, 95% CI=1.26-1.29), as well as in operations with cancer diagnoses (OR=1.24, 95% CI=1.22-1.27).
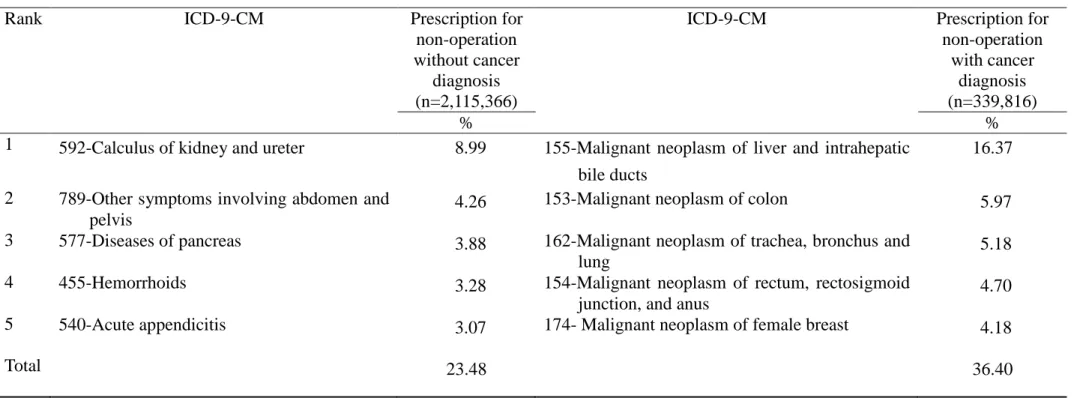
Since non-operation status without cancer diagnoses accounted for more than 60% of total prescriptions, we further examined the leading causes of disease associated with these prescriptions. We note that the top five leading causes of disease included kidney and ureter calculus and other symptoms involving the abdomen and pelvis, such abdominal pain, pancreatic diseases, hemorrhoids, and acute appendicitis; these causes accounted for 23.48% of all prescriptions (Table 5). In addition, we also note that about 10% of pethidine prescriptions were associated with cancer diagnoses but without operation, and prescriptions to non-operated cancer patients are usually
considered potentially inappropriate. The top five cancer diagnoses without operation status included malignant neoplasm of liver and intrahepatic bile ducts, malignant neoplasm of colon, malignant neoplasm of trachea, bronchus and lung, and malignant neoplasm of rectum, rectosigmoid junction, and anus, and malignant neoplasm of female breast (Table 5).
14 DISCUSSION
This is the first national study to analyze the trends and characteristics of pethidine use in Taiwan. Although there were declining trends in prevalence of pethidine users, total prescriptions, and DDD/1000 inhabitants/day in Taiwan over the study years, there were still more than 500,000 people, accounting for 2.4% of total Taiwanese, who were prescribed pethidine for pain relief annually. Additionally, older people, men, and people living rural areas showed a smaller reduction in prevalence rate of pethidine users than the national average (6.4%). Moreover, there were an increasing proportion of pethidine prescriptions for clinics, outpatient settings, and operation with cancer diagnosis. We noted that pethidine prescription was mostly found in non-cancer diagnosis (85%). However, some 10% of total pethidine prescriptions were found in cancer diagnosis without operation which deserved careful evaluation for its appropriateness.
Such decreasing trends in pethidine use are consistent with some previous reports from other nations (11, 12, 22-24). Joranson et al. (23) retrospectively surveyed the U.S. medical record database, which revealed a decrease of 35% (5.2 to 3.4 million grams) in the medical use of pethidine from 1990 to 1996. Gilson et al. (22) also used the same database to demonstrate that there was a further decline in medical use of pethidine by over 6% (5.8 to 5.4 million g) from 1997 through 2002. Additionally, in Israel from 2000-2008, pethidine consumption fell by 65%, from 0.07 DDD/1000 inhabitants/day to 0.02 (12). However, two population-based surveys that pethidine consumption was found to be less than 0.01 DDD/1000 inhabitants/day and remained constant in Spain during 1992-2006 (11), and in the Slovak Republic during
1998-2002 (24). The fall in pethidine consumption in recent years may reflect the campaign towards declination of regular and long-term use of pethidine by major
authorities. This may also signify the growing awareness of pethidine’s shortcomings including a short duration of action and conversion to a long-lived toxic metabolite (4). Moreover, through multifaceted education, combining a pethidine formulary restriction and a computerized provider order entry regulation initiative, also
minimized pethidine prescribing (25-27). Besides, restricting the use of pethidine in patients allergic to or unable to tolerate all other opioids has been advocated in Taiwan as well as in many countries in the world (3, 12).
Despite a decrease in prevalence of pethidine use, our study disclosed an increased number and proportion of pethidine users aged >=80 years. Similar increases in number and proportion were also noted in pethidine prescriptions in operations and with cancer diagnoses, as well as in those from rural areas, regional hospitals, clinics, outpatient settings, and emergency departments. Elderly patients usually have higher risks of suffering from both acute and chronic pain (28). Valano et al. conducted a cross-sectional study and reported that the majority of patients treated with opioid were aged 41-65 years, which is similar to our findings (29). Previous studies also reported that pethidine was administered to only approximately 1 in 8 older surgical patients (10) mainly due to a greater likelihood of the elderly experiencing side effects from pethidine, which may have affected physician prescribing behavior (30). An increased number and proportion of elderly pethidine users in recent years, noted in our study, warrants further interventions to effectively reduce the use of pethidine in this vulnerable population.
The geographic and medical institutional variations in pethidine use might be due to varying barriers of access to healthcare use. Sadowski et al. (31) conducted a cross-sectional population-based study to describe accessibility and intensity of
16
sex-standardized accessibility and intensity measures revealed that the highest overall analgesic use was in the most rural/remote regions of the province. Valano et al. (29) used a cross-sectional study design to demonstrate that adherence to analgesic treatment guidelines was higher in large hospitals than in medium and small-sized hospitals. A recent study also reported that pethidine was prescribed to 7.6% and 4.3% of all study patients at a large private tertiary care teaching hospital and a smaller academically affiliated Veterans Affairs medical center, but the number of doses administered was similar at both sites (10). The variation of pethidine dose prescribed to patients treated in hospitals with different accreditation levels may reflect the different severity of diseases that required different strategies to manage pain. Alternatively, ordering pethidine was also found to be associated with physician specialty, hospital location, patient race, insurance coverage, and physician gender (17), which might also be responsible for the observed variations in pethidine use among geographic and medical institutions in Taiwan.
We were not surprised by the increased proportion of pethidine prescriptions in cancer diagnoses together with operations, which is consistent with previous findings (29). This is particularly true for patients who had operations for cancer treatments. Previous studies reported that after surgery, patients with cancer were treated more frequently with analgesics than other patients (29). Also, a cancer diagnosis was found to be associated with greater access and use intensity of all analgesics classes (31). Physicians do not appear hesitant to prescribe higher amounts of opioid analgesics to individuals with cancer diagnoses (32). Jarlbaek et al. (33) analyzed the changes in opioid use from 1994 to 1998 in an entire cohort of cancer patients (n=24,190) in a Danish county. The results indicate that the overall consumption of opioids increased from 20 kg to 37 kg oral morphine equivalents (omeq) per year, the average
consumption increased from 7.6 to 10.7 g omeq/opioid user/year, the annual proportion of users increased from 17% to 20%, and the proportion of patients who were alive two years after their first opioid prescription increased from 38% to 55%. They also indicate that 14% of the population’s opioid users were cancer patients, and that they consumed 23% of the total opioids from 1993-1997.
Our findings demonstrate that a large proportion of pethidine was prescribed to the non-operation patients without cancer diagnoses. The indications for pethidine use documented by emergency departments include abdominal pain, back pain, biliary pain, chest pain, migraine/headache, pancreatitis, renal colic, trauma/fracture, and morphine allergy (26), which were all non-cancer diagnoses. On the other hand, our data shows that about 10% of total pethidine prescriptions were also found in cancer diagnoses without operations. Pethidine is recommended to be restricted to patients who have true allergies or intolerances to other opioids and that they should only be used in acute pain situations for very brief courses (7, 8). Therefore, there was a potential for improper use of pethidine in non-operated cancer patients in Taiwan. This calls for further careful evaluation of the appropriate pethidine prescriptions in non-operated cancer patients in Taiwan, to avoid the occurrence of adverse events from its use.
This study has the following strengths. First, it is population-based and includes all eligible pethidine users in Taiwan during the study period. Therefore, the data is highly representative and allows does not have much room for selection bias. Second, the study sample was collected from the NHI database, which makes it possible to cover all pethidine claims of individual patients with little likelihood of non-response of the study subjects. Finally, the advantage of using insurance claim datasets in
18 sample of geographically disperse patients (34).
Despite the above strengths, there are several limitations in our study. First, the data contains no information on compliance with prescribing drugs in outpatient settings, which could entail a degree of pethidine use misclassification in this study. However, there is no evidence showing the medication-taking compliance varies with secular years. This provides reassurance that the potential pethidine use misclassification should not pose a great effect on the secular trends reported in this study. Second, although we used the ICD-9-CM procedure codes to determine whether a pethidine user had an operation, we were unable to differentiate between acute and chronic pain associated with the operation.
In conclusion, the prevalence of pethidine users and prescriptions steadily decreased from 2002-2007 and so did the total amount and DDD. Despite that, our data shows that the number and proportion of pethidine prescriptions increased in certain subgroups including elderly patients, rural residents, patients who had operations with cancer diagnoses, and patients from regional hospitals/clinics and outpatient/emergency settings. We suggest that further studies investigate the appropriateness of prescribing pethidine to these patients,and call for clinicians’ attention to these patients to further reduce the potential risk of toxicity associated with pethidine use in Taiwan.
ACKNOWLEDGMENTS
This study was supported by the grants from the National Bureau of Controlled Drugs, Department of Health, Taiwan (DOH98-NNB-1031), and National Science Council (NSC100-2314-B-006 -052).
AUTHOR CONTRIBUTIONS
Hsueh-Hsing Pan, Chung-Yi Li, Ju-O Wang, and Tso-Chou Lin participated in the conception and design, acquisition of data, analysis and interpretation of data.
Shung-Tai Ho, and Kwua-Yun Wang were drafting the article and revising it critically for important intellectual content. All authors were final approval of the version to be published.
20 REFERENCES
1. Gourlay GK. Advances in opioid pharmacology. Support Care Cancer. 2005; 13: 153-9.
2. Costantini R, Affaitati G, Fabrizio AGiamberardino MA. Controlling pain in the post-operative setting. Int J Clin Pharmacol Ther. 2011; 49: 116-27. 3. Latta KS, Ginsberg BBarkin RL. Meperidine: a critical review. Am J Ther.
2002; 9: 53-68.
4. Todd M. Meperidine and the management of pain: what you need to know. Lippincotts Case Manag. 2004; 9: 241-2.
5. Vermeulen LC, Bollinger KA, Antonopoulos J, Meek PD, Goshman LMPloetz PA. Multifaceted approach to medication use policy development: the
restriction of meperidine. Pharm Pract Manag Q. 1997; 16: 66-75.
6. Thompson DR. Narcotic analgesic effects on the sphincter of Oddi: a review of the data and therapeutic implications in treating pancreatitis. Am J
Gastroenterol. 2001; 96: 1266-72.
7. American Pain Society Quality of Care Committee. Quality improvement guidelines for the treatment of acute pain and cancer pain. American Pain Society Quality of Care Committee. JAMA. 1995; 274: 1874-80.
8. Golembiewski J. Safety concerns with meperidine. J Perianesth Nurs. 2002; 17: 123-5.
9. O'Callaghan JP. Evolution of a rational use of opioids in chronic pain. Eur J Pain. 2001; 5 Suppl A: 21-6.
10. Kornitzer BS, Manace LC, Fischberg DJLeipzig RM. Prevalence of meperidine use in older surgical patients. Arch Surg. 2006; 141: 76-81.
11. Garcia del Pozo J, Carvajal A, Viloria JM, Velasco AGarcia del Pozo V. Trends in the consumption of opioid analgesics in Spain. Higher increases as fentanyl replaces morphine. Eur J Clin Pharmacol. 2008; 64: 411-5.
12. Ponizovsky AM, Marom E, Zeldin ACherny NI. Trends in opioid analgesics consumption, Israel, 2000-2008. Eur J Clin Pharmacol. 2011; 67: 165-8. 13. Hsu CCLi JH. The trends of requirements in medical opioid analgesics from
1987 through 1996 in Taiwan. Chinese Journal of Public Health. 1998; 17: 495-503.
14. Pellegrini JE, Paice JFaut-Callahan M. Meperidine utilization and compliance with Agency for Health Care Policy and Research guidelines in a tertiary care hospital. CRNA. 1999; 10: 174-80.
effects of opioids during short-term administration: effect of age, gender, and race. Clin Pharmacol Ther. 2003; 74: 102-12.
16. Kredo TOnia R. Pethidine--does familiarity or evidence perpetuate its use? S Afr Med J. 2005; 95: 100-1.
17. Panda M, Desbiens N, Doshi NSheldon S. Determinants of prescribing meperidine compared to morphine in hospitalized patients. Pain. 2004; 110: 337-42.
18. Lu JFRHsiao WC. Does universal health insurance make health care unaffordable? Lessons from Taiwan. . Health Affairs (Millwood). 2003; 22: 77-88.
19. Directorate-General Budget AaS, ed. National Statistics of Regional Standard Classification Data. Taipei, Taiwan. 1993.
20. WHO. WHO Collaborating Centre for Drug Statistics Methodology. Complete ATC index 2010 2009.
21. Department of Statistics. statistical yearbook of interior. 2009; Available from: http://sowf.moi.gov.tw/stat/year/list.htm.
22. Gilson AM, Ryan KM, Joranson DEDahl JL. A reassessment of trends in the medical use and abuse of opioid analgesics and implications for diversion control: 1997-2002. J Pain Symptom Manage. 2004; 28: 176-88.
23. Joranson DE, Ryan KM, Gilson AMDahl JL. Trends in medical use and abuse of opioid analgesics. JAMA. 2000; 283: 1710-4.
24. Hudec R, Tisonova J, Bozekova LFoltan V. Trends in consumption of opioid analgesics in Slovak Republic during 1998-2002. Eur J Clin Pharmacol. 2004; 60: 445-8.
25. Taylor SE, Braitberg GLugt J. Multifaceted education initiative minimizes pethidine prescribing in the emergency department. Emerg Med Australas. 2007; 19: 25-30.
26. Kaye KI, Welch SA, Graudins LV, Graudins A, Rotem T, Davis SR, et al. Pethidine in emergency departments: promoting evidence-based prescribing. Med J Aust. 2005; 183: 129-33.
27. O'Connor AB, Lang VJQuill TE. Eliminating analgesic meperidine use with a supported formulary restriction. Am J Med. 2005; 118: 885-9.
28. Scudds RJOstbye T. Pain and pain-related interference with function in older Canadians: the Canadian Study of Health and Aging. Disabil Rehabil. 2001; 23: 654-64.
29. Vallano A, Malouf J, Payrulet PBanos JE. Analgesic use and pain in the hospital settings. Eur J Clin Pharmacol. 2007; 63: 619-26.
22
pharmacodynamic considerations]. Anasthesiol Intensivmed Notfallmed Schmerzther. 2004; 39: 527-37.
31. Sadowski CA, Carrie AG, Grymonpre RE, Metge CJSt John P. Access and intensity of use of prescription analgesics among older Manitobans. Can J Clin Pharmacol. 2009; 16: e322-30.
32. Morley-Forster PK, Clark AJ, Speechley MMoulin DE. Attitudes toward opioid use for chronic pain: a Canadian physician survey. Pain Res Manag. 2003; 8: 189-94.
33. Jarlbaek L, Andersen M, Hallas J, Engholm GKragstrup J. Use of opioids in a Danish population-based cohort of cancer patients. J Pain Symptom Manage. 2005; 29: 336-43.
34. Jollis JG, Ancukiewicz M, DeLong ER, Pryor DB, Muhlbaier LHMark DB. Discordance of databases designed for claims payment versus clinical information systems. Implications for outcomes research. Ann Intern Med. 1993; 119: 844-50.
Table 1- Numbers of pethidine users, total prescriptions, total amounts, and defined daily dose, 2002-2007.
Calendar year Percentage change
2002 vs 2007 2002 2003 2004 2005 2006 2007 Injections No. of users 553,364 527,054 560,044 550,979 546,515 533,776 -3.5 Total prescriptions 568,389 543,070 571,415 563,129 559,779 545,581 -4.0 Total amount (mg×106) 79 77 77 76 74 69 -12.7 DDD/1000/day 0.024 0.023 0.023 0.023 0.022 0.021 -12.5 Tablets No. of users 6,283 6,106 6,461 4,772 2,870 2,912 -53.7 Total prescriptions 6,317 6,141 6,479 4,781 2,883 2,920 -53.8 Total amount (mg×106) 8 9 7 3 3 4 -50.0 DDD/1000/day 0.003 0.003 0.002 0.001 0.001 0.001 -66.7 Total No. of users 559,647 533,160 566,505 555,751 549,385 536,688 -4.1 Total prescriptions 574,706 549,211 577,894 567,910 562,662 548,501 -4.6 Total amount (mg×106) 87 86 84 79 77 73 -16.1 DDD/1000/day 0.027 0.026 0.025 0.024 0.023 0.022 -18.5
24 Table 2- Prevalence rate of pethidine users, 2002-2007.
Variables 2002 (n=559,647) 2003 (n=533,160) 2004 (n=566,505) 2005 (n=555,751) 2006 (n=549,385) 2007 (n=536,688) Percentage change 2002 vs. 2007 Age <18 5.6 4.9 5.3 5.2 5.0 4.7 -16.0 18-40 22.7 22.1 23.3 21.3 20.3 19.3 -15.0 41-64 33.3 31.3 33.4 32.0 31.3 30.0 -9.9 65-79 58.5 54.9 58.9 56.4 55.7 53.8 -8.1 >80 66.3 64.4 68.3 65.9 66.4 64.4 -2.9 Gender Male 26.2 26.0 28.0 26.9 26.5 25.6 -2.1 Female 22.9 21.0 23.2 22.2 21.7 21.1 -8.0 Urbanization Urban 22.7 21.5 23.4 21.8 21.4 20.5 -9.6 Satellite 24.2 22.6 24.2 23.0 22.7 21.8 -9.9 Rural 30.0 29.0 31.3 30.6 30.1 29.7 -1.3 Total 24.9 23.9 25.8 24.5 24.1 23.3 -6.4
Table 3- Proportion of total pethidine prescriptions according to health care characteristics, 2002-2007 Variables 2002 (n=574,706) 2003 (n=549,211) 2004 (n=577,894) 2005 (n=567,910) 2006 (n=562,662) 2007 (n=548,501) Percentage change 2002 vs. 2007 Accreditation level Medical center 47.4 45.6 45.3 43.9 45.0 42.8 -9.7 Regional hospital 36.0 36.6 36.8 38.4 38.5 41.4 15.1 Local hospital 15.7 16.7 16.3 15.9 15.2 14.7 -6.6 Clinic 1.0 1.1 1.6 1.8 1.4 1.2 19.7 Patient setting Inpatient 73.6 71.8 73.2 71.7 71.0 70.6 -4.1 Outpatient 10.9 11.8 12.6 13.5 13.1 13.1 20.1 Emergency department 15.5 16.4 14.2 14.8 15.9 16.3 5.1 Operation/Cancer status Operation
With cancer diagnosis 4.4 4.7 5.0 5.2 5.4 5.4 22.7
Without cancer diagnosis 22.0 21.6 22.6 23.0 22.7 22.4 2.2
Non-operation
With cancer diagnosis 10.2 10.5 10.2 9.8 10.0 9.7 -5.4
26
Table 4- Comparisons of patient demographics and health care characteristics in pethidine prescriptions between 2002 and 2007.
Variables
Pethidine prescriptions
Crude estimate Adjusted estimate
in 2002 (Controls) in 2007 (Cases) n n OR 95% CI OR 95% CI Demographics Age(years) <18 30,849 23,685 reference reference 18-40 209,079 169,413 1.06 1.04-1.08 1.04 1.02-1.06 41-64 206,909 217,571 1.37 1.35-1.39 1.32 1.29-1.34 65-79 102,193 102,205 1.30 1.28-1.33 1.27 1.24-1.29 >80 25,676 35,627 1.81 1.77-1.85 1.77 1.73-1.81 Gender Male 307,001 299,759 1.02 1.01-1.03 1.00 0.99-1.01
Female 259,357 248,741 reference reference
Urbanization
Urban 228,234 211,054 reference reference
Satellite 161,113 151,828 1.02 1.01-1.03 1.02 1.01-1.03
Rural 185,359 185,619 1.08 1.07-1.09 1.09 1.08-1.10
Health care characteristics Accreditation level
Regional hospital 206,631 227,008 1.28 1.26-1.29 1.28 1.27-1.29
Local 90,224 80,448 1.03 1.02-1.05 1.05 1.03-1.06
Clinic 5,671 6,477 1.33 1.28-1.37 1.48 1.43-1.54
Patient setting
Inpatient 422,710 387,078 reference reference
Outpatient 62,727 71,907 1.25 1.24-1.27 1.27 1.26-1.29
Emergency department 89,269 89,516 1.10 1.08-1.11 1.12 1.11-1.13
Operation/Cancer status Operation
With cancer diagnosis 25,322 29,647 1.25 1.22-1.27 1.24 1.22-1.27
Without cancer diagnosis 126,202 123,102 1.04 1.03-1.05 1.08 1.07-1.09
Non-operation
With cancer diagnosis 58,706 53,020 0.96 0.95-0.97 0.90 0.89-0.91
Without cancer diagnosis 364,476 342,732 reference reference
28
Table 5- Leading diagnoses associated with pethidine prescriptions for both non-operation with and without cancer diagnoses, 2002-2007.
Rank ICD-9-CM Prescription for
non-operation without cancer
diagnosis (n=2,115,366)
ICD-9-CM Prescription for
non-operation with cancer
diagnosis (n=339,816)
% %
1 592-Calculus of kidney and ureter 8.99 155-Malignant neoplasm of liver and intrahepatic bile ducts
16.37
2 789-Other symptoms involving abdomen and pelvis
4.26 153-Malignant neoplasm of colon 5.97
3 577-Diseases of pancreas 3.88 162-Malignant neoplasm of trachea, bronchus and
lung
5.18
4 455-Hemorrhoids 3.28 154-Malignant neoplasm of rectum, rectosigmoid
junction, and anus
4.70
5 540-Acute appendicitis 3.07 174- Malignant neoplasm of female breast 4.18
Total 23.48 36.40