國立交通大學
分子醫學與生物工程研究所
碩士論文
熱帶念珠菌藉由在 FCY2 基因上的無意義突變
伴隨異質性缺失的發生獲得抗氟胞嘧啶的能力
Development of flucytosine resistance in Candida tropicalis is caused
by nonsense mutations in FCY2, followed by loss of heterozygosity
研 究 生 : 陳妍寧
指導教授 : 楊昀良博士
熱帶念珠菌藉由在 FCY2 基因上的無意義突變
伴隨異質性缺失的發生獲得抗氟胞嘧啶的能力
Development of flucytosine resistance in Candida tropicalis is caused
by nonsense mutations in FCY2, followed by loss of heterozygosity
研究生 : 陳妍寧 Student : Yen-Ning Chen
指導教授 : 楊昀良 博士 Adviser : Dr. Yun-Liang Yang
國 立 交 通 大 學
分子醫學與生物工程研究所
碩 士 論 文
A Thesis
Submitted to Institute of Molecular Medicine and Bioengineering National Chiao Tung University
in Partial Fulfillment of the Requirements for the Degree of
Master in
Molecular Medicine and Bioengineering July 2010
Hsinchu, Taiwan, Republic of China
摘要
熱帶念珠菌(Candida tropicalis)是一種雙倍體的病原真菌。在念珠菌屬中,熱帶念珠 菌極具侵略性且是最常見的非白色念珠菌之一。先前的實驗中發現 31.25%對 flucytosine (5FC)敏感的臨床菌株具有產生抗藥性子代的能力,並進一步證實所觀察到的 5FC 抗藥 性與帶有特定一群多型性核苷酸(SNP)的 FCY2 基因(會產生運輸 cytosine 的蛋白質)處在 同質二倍體的狀態(homozygous state)有關。本研究將針對熱帶念珠菌對 5FC 的抗藥機制 做更深入的探討。首先,利用另一個關係較遠的臨床菌株建構 FCY2 同質二倍體的突變 株,在 5FC 藥物敏感性測試實驗中顯示,只有跟上述帶有同樣一群多型性核苷酸的同質 二倍體突變株具有抗此藥物的能力。接著分析對 5FC 極為敏感的臨床菌株在 FCY2 基因 上的各個多型性核苷酸,發現有三個多型性核苷酸只有在具有抗 5FC 能力的菌株中才存 在,經建構這三個多型性核苷酸的點突變株,顯示 G145T 的點突變加上 FCY2 基因處在 同質二倍體的狀態(145 T/T)與衍生株的抗藥性有關。這個 G145T 的點突變會造成無意義 突變(nonsense mutation)使得 FCY2 不會合成具有功能的運輸蛋白產物(purine-cytosine permease)。最後,分析全部具有產生抗藥性子代能力的臨床菌株的基因型,發現大部分 的親代菌株都帶有 145 T/G 這種基因型。除了分析 FCY2 基因與抗 5FC 藥物之間的關係, 本 研 究 也 針 對 兩 隻 臨 床 菌 株 和 它 們 的 衍 生 株 之 間 所 發 生 的 異 質 性 缺 失 (loss of heterozygosity; LOH)做探討。藉由基因多型性圖譜觀察到多數的 LOH 涵蓋了大部分染 色體的區域,甚至延伸到其端粒,這些 LOH 可能是由於 allelic recombination 或者 break-induced replication 所造成。另外有一個小範圍的 LOH 則可能是由 gene conversion 所產生。總結,在 FCY2 基因中產生的無意義突變伴隨大範圍 LOH 的發生是造成本實 驗中熱帶念珠菌衍生株產生抗 5FC 的主要原因。Abstract
Candida tropicalis, a diploid yeast, has been regarded as one of the most invasive and
prevalent species of non-albicans Candida. Previous work has shown that 31.25% (30/96) of flucytosine (5FC) susceptible clinical isolates could generate drug resistant progeny. It has revealed that there was an association between a set of polymorphic nucleotides in FCY2 (encoding a cytosine transporter) and the observed drug resistant phenotype. In this study, the molecular mechanisms of 5FC resistance in these C. tropicalis have been further investigated. First of all, homozygous mutants carrying the same set of SNPs in FCY2 under different genetic background displayed similar levels of resistance to 5FC. Second, nucleotide sequences of the FCY2 alleles in hyper-susceptible strains indicated three SNPs in FCY2 were unique to those resistant strains. Subsequently, a homozygous SNP at position 145 (T/T) in the FCY2 gene was proven to be fully accounted for the 5FC resistance observed in the drug resistant derivatives. Since the G145T mutation resulted in a nonsense mutation, it might lead to the loss of purine-cytosine permease. Finally, two types of nonsense mutations (G145T and G201A) were found in FCY2 of the clinical isolates that had potential to produce 5FC resistant derivatives, where the majority was 145 T/G genotype. Meanwhile, the nature and the extent of loss of heterozygosity (LOH) events have been examined by SNP mapping. The results showed that most of the LOH events covered large chromosomal regions, which even extended to the telomere, suggesting allelic recombination or break-induced replication, whereas one was a localized LOH event, caused by gene conversion. All in all, nonsense mutations in FCY2 coupled with LOH events are responsible for 5FC resistance in those C.
誌謝
很幸運在碩班三年學習的道路上能夠有這麼多良師益友相伴,由於你們不吝惜的指 導與鼓勵,讓我不但順利取得學位,更獲得許多難能可貴的人生經驗。對於大家的照顧 與恩惠,我將銘記在心。 首先,感謝指導教授楊昀良老師給予我在研究上極大的揮灑空間,並適時分享個人 的經驗以勉勵學生更加精進,此外還耐心的修改我不純熟的英文論文。同樣地,很感激 羅秀容老師不但讓我有機會在國衛院做實驗,更提供我許多研究上的方向與想法,在羅 老師身上,我見識到身為一個科學人的熱誠。還要謝謝口試委員藍忠昱老師和梁美智老 師給予我許多的寶貴建議,讓我的論文得以更加完備。 接著,感謝所有國衛院的伙伴們,讓我在竹南的日子過得極為充實快樂。文靜又調 皮的惠菁學姐;無論身在何地總讓人很有安全感的佳真;率直可愛的小善;很有媽媽的 味道的向寧;讓人不想直接誇獎她的小芭樂瑋婷;和我有麥當勞緣的琬立;松鼠、海狸、 野雁精神兼具的啟宏;看似溫和實則極具行動力的志兆;名不虛傳的偉得王誌偉;廚藝 極佳又很貼心的好鄰居德斌;總是很有朝氣的昱果;說出來的話總讓我嚇一跳的馬靈; 有義氣也很有勇氣的奕瑄;笑容可掬的天竺鼠裕傑。 再來要感謝交大實驗室的學長姐以及一群可愛的學弟妹們,讓我在新竹的日子回味 無窮,而在竹南時也無後顧之憂。在實驗室和我一同奮鬥到清晨,又帶我去南寮漁港遊 玩的淑萍;親切可人又有一副好歌喉的淑貞;熱心服務的敏書;唱歌很會帶動氣氛的旻 秀;對於實驗問題總是親切給予指導的志達;口試期間幫了我大忙的好戰友小倩;認真 努力的好鄰居馨儀;有著燦爛微笑的阿毛;大家公認的陽光男孩毓駿;對研究極為用心 的愛貓學弟重延;有著一股純真氣質的禎憶;總是逗得大家很開心的開心果阿大;積極 進取的漂亮學妹幸璇;很有趣的助理阿金吳;乖巧有禮貌的學弟阿賢;化學一把罩也很 搞笑的凱薩;很有自己想法的阿白;溫柔有氣質的于鈴學姐;修課的好夥伴音汝。 還要感謝以前工作時的同事們、大學同學以及大學實驗室的同伴們對我的關心以及 協助;321 室最親愛的室友芷婷;越陳越香的老朋友們小碗、猪猪、杜杜、小葉、阿福、 孟芯,最後,要感謝我最愛的家人,由於你們的支持與鼓勵,讓我得以全心投入做自己 想做的事。Contents
Abstract (Chinese) ... i
Abstract (English) ... ii
Acknowledgement ... iii
Contents ... iv
Contents (Tables)... vii
Contents (Figures) ... vii
Appendix ... ix
Chapter 1. Introduction
1.1 Clinical significance of Candida tropicalis ... 11.2 Mechanisms of action of antifungal agents ... 2
1.3 Molecular mechanisms of flucytosine resistance in yeasts ... 3
1.4 The association between loss of heterozygosity and antifungal drug resistance ... 4
1.5 Previous works ... 5
1.6 Purpose of this study ... 7
Chapter 2. Materials and Methods
2.1 Materialsts ... 82.1.1 Strains ... 8
2.1.3 Chemicals and reagents ... 8
2.1.4 Buffers ... 9
2.1.5 Medium... 9
2.1.6 Equipments ... 9
2.1.7 Strains and media ... 10
2.2 Methods ... 10
2.2.1 DNA methods ... 11
2.2.2 Polymerase chain reaction (PCR) ... 11
2.2.3 Transformations ... 12
2.2.4 Constructions of plasmids ... 13
2.2.5 Sequence analysis ... 15
2.2.6 Susceptibility testing ... 15
2.2.7 Quantitative analysis of the mRNA level by real-time PCR ... 16
2.2.8 Identification of the boundary of loss of heterozygosity (LOH) events ... 18
Chapter 3. Results
3.1 Phenotypic analysis of the clinical isolates and their homozygous mutants ... 193.2 Sequence analysis of the 5’ and 3’ untranslated regions of the FCY2 locus in hyper- susceltible strains ... 20
3.3 Construction of plasmids carrying a single mutation at the FCY2 locus... 21
3.4 Construction of G-69T (G145T), T-69G (T145G), G273T (G486T), T273G (T486G), C1518T (C1731T) or T1518C (T1731C) single mutation strain ... 22
3.5 Phenotypic analysis of the single mutation strains ... 23
3.6 Contribution of the polymorphic nucelotide in the promoter region of the FCY2 gene .. 25
3.7 Nucleotide sequence analysis of the FCY2 gene ... 26
3.8 Genotypic characterization of clinical isolates ... 27
3.9 Characterization of loss of heterozygosity events in clinical isolate-derivative pairs ... 28
3.10 Characterization of the loss of heterozygosity boundaries ... 30
Chapter 4. Discussion
4.1 The redefinition of FCY2 open reading frame in C. tropicalis ... 324.2 Contribution of the FCY2 gene to flucytosine susceptibility in C.tropicalis ... 33
4.2.1 LOH at the FCY2 locus was associated with 5FC resistance ... 33
4.2.2 The nonsense mutation in the FCY2 gene, accompanied by LOH, contributed to 5FC resistance in C. tropicali ... 33
4.2.3 Isolates exhibiting 145 T/G genotype might represent a subgroup associated with the generation of 5FC resistant derivatives ... 35
4.3 Other possibilities that might involve in flucytosine resistance in C. tropicalis ... 36
4.4 The cause of differential mRNA levels of FCY2 of yeasts carrying a nonsense mutation ... 37
4.5 Characterization of the loss of heterozygosity events ... 38
Chapter 5. Future work
5.1 Evaluation of the mechanism of 5FC resistance in C. tropicalis ... 415.2 Examination of the feature of the boundaries that might be related to recombination
event ... 41
References ... 43
Contents (Tables)
Table 1. Yeast strains used in this study ... 49Table 2. Plasmids used in this study ... 50
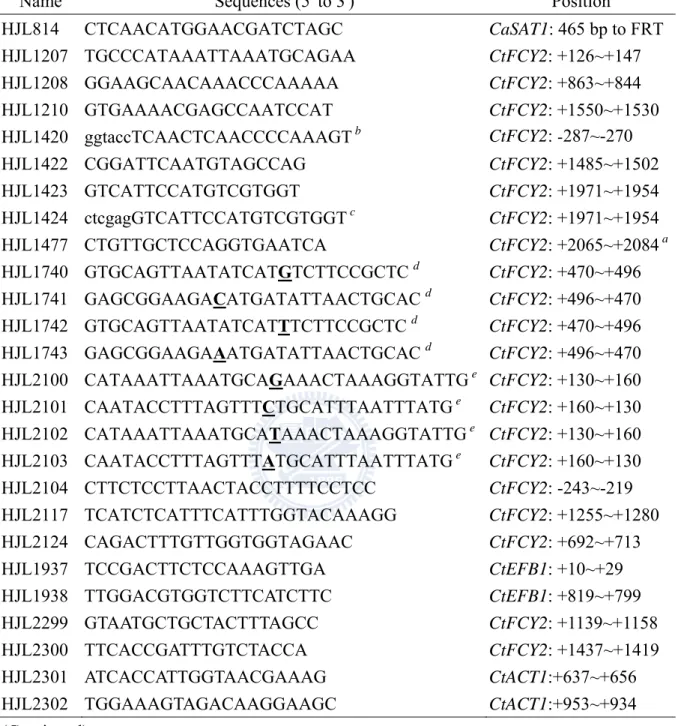
Table 3. Primers used in this study ... 51
Table 4. Summary of broth microdilution data with 5FC/DMSO ... 59
Table 5. Summary of broth microdilution data with 5FC/H2O ... 60
Table 6. Summary of 5FC susceptibility testing ... 61
Table 7. Phenotypes and genotypes of the 13 previously selected clinical isolates ... 62
Table 8. Phenotypes and genotypes of the remaining 22 clinical isolates (out of 35 pairs) ... 63
Table 9. Genotypes of the clinical isolates ... 64
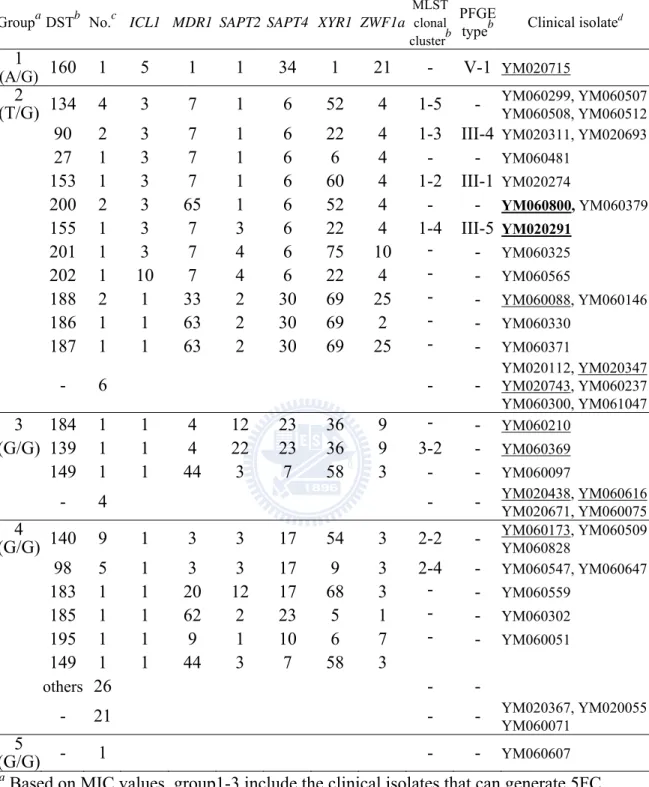
Table 10. Classification and association of FCY2 genotype, MLST and PFGE of the clinical isolates ... 65
Contents (Figures)
Figure 1. 5FC susceptibility testing of two clinical isolates and their homozygous mutants by both microdilution ... 66Figure 2. The SNPs at position -224 (-11) in FCY2 promoter region among hyper-susceptible strains ... 67
Figure 3. The SNPs at position -69 (145) in FCY2 promoter region among hyper-susceptible strains ... 68
Figure 4. The SNP in the 3’ UTR of FCY2 gene among hyper-susceptible clinical isolates ... 69
Figure 6. Verification of plasmids carrying FCY2S[C1518T (C1731T)] or FCY2R[T1518C
(T1731C)] allele ... 71
Figure 7. Nucleotide sequences of FCY2 gene in LOB385 and LOB386 ... 72
Figure 8. Nucleotide sequences of plasmids carrying either FCY2S[G-69T (G145T)] or FCY2R [T-69G (T145G)] allele ... 73
Figure 9. Nucleotide sequences of plasmids carrying either FCY2S[G273T (G486T)] or FCY2R [T273G (T486G)] allele ... 74
Figure 10.Verification of plasmids carrying FCY2S[G-69T (G145T]] or FCY2R [T-69G (T145G)] allele ... 75
Figure 11.Verification of plasmids carrying FCY2S[G273T (G486T)] or FCY2R [T273G (T486G)] allele ... 76
Figure 12.Evaluation the constructs of the single mutation strains by colony PCR ... 77
Figure 13.Constructions of the single mutation strains ... 78
Figure 14.Nucleotide sequences of FCY2 gene in single mutation strains ... 80
Figure 15.E-test validation of broth microdilution data ... 81
Figure 16.FCY2 expression levels among clinical isolate, its homozygous mutants and its single mutation strains by real-time quantitative PCR ... 82
Figure 17. Amino acid sequence alignments of the N terminal of the PCP ... 83
Figure 18. Nucleotide sequence of a 2258 bp DNA segment containing the entire FCY2 gene and the deduced amino acid sequence of the purine cytosine permease protein .... 84
Figure 19.SNP map of the chromosome carrying FCY2 gene in clinical isolates, YM020291 and YM060800, and their derivatives ... 85
Figure 20.Genotypes of clinical isolates and their derivatives on the chromosome, containing FCY2 gene... 87
Figure 21. 5’ end of the chromosome in the clinical isolate YM060800 and the derivatives of YM020291 ... 88
Figure 22.The LOH boundary on the right end side of the chromosome downstream of the FCY2 gene in YM020291-1 ... 89
FCY2 gene in YM020291-2 ... 90
Figure 24.The LOH boundary on the right end side of the chromosome downstream of the FCY2 gene in YM060800-1 ... 91
Figure 25.The LOH boundary on the right end side of the chromosome downstream of the FCY2 gene in YM060800-2 ... 92
Figure 26.The LOH boundary on the left end side of the chromosome preceding the FCY2 gene in YM060800-2 ... 93
Figure 27. The LOH boundary on the left end side of the chromosome downstream of the FCY2 gene in YM060800 ... 94
Figure 28.Nucleotide sequences of the LOH boundaries ... 95
Figure 29.Nucleotide sequence alignment of the LOH boundaries ... 97
Figure 30.A deletion polymorphism in YM060800 ... 98
Appendix
Appendix 1. Metabolism of 5FC ... 99Chapter 1. Introduction
1.1 Clinical significance of Candida tropicalis
The prevalence and the severity of fungal infections have significantly increased over the past two decades (Beck-Sague and Jarvis, 1993; Chen et al., 1997; Fridkin and Jarvis, 1996). In particular, Candida species, leading to a high mortality rate of patients with candidemia in a range from 35% to 60%, has emerged as the most common cause of opportunistic fungal infections worldwide (Ruan and Hsueh, 2009). Although Candida albicans is the major pathogen that causes candidemia, the contributions of other Candida species are rising, especially in seriously ill patients. Among the non-albicans Candida species, Candida tropicalis, Candida glabrata and
Candida parapsilosis are the three most important pathogens responsible for the
infections. According to the reports of Taiwan Surveillance of Antimicrobial Resistance of Yeasts (TSARY), Candida tropicalis has been identified as the most frequently encountered non-albicans Candida species in Taiwan (Yang et al., 2005; Yang et al., 2008). It is notable that the proportion of this pathogen in Taiwan (16-25%) seems to be higher than that in other regions (5-11%), such as North America (Ruan and Hsueh, 2009). In addition, the diploid yeast C. tropicalis is more often related to neutropenia and malignancy (Abi-Said et al., 1997; Kontoyiannis et
al., 2001; Marr et al., 2000; Wingard, 1995). Previous study has demonstrated that C. tropicalis is the second most virulent pathogen comparing to seven other medically
important Candida species in an immunocompetent animal model (Arendrup et al., 2002). Another research has implied that the gene families likely to involve in pathogenicity and virulence are enriched in C. tropicalis, such as genes encoding Als adhesins and Hyr/Iff proteins (Butler et al., 2009). Moreover, a report has indicated the frequent appearance of drug resistance of this yeast. For example, while a 3% incidence of resistance to fluconazole was identified within the C. albicans, more than one half of the C. tropicalis isolates were resistant to this drug (Law et al., 1996). Because of its high invasiveness, the high incidence of drug resistance and the affinity for causing diseases in immunocompromised patients, C. tropicalis has become a clinically significant pathogen (Kothavade et al., 2010).
1.2 Mechanisms of action of antifungal agents
The treatment of fungal infections is a serious issue due to the increase of the immunosuppressed patients and the prevalence of drug resistance. Since fungi and human beings are both eukaryotes, the drug targets are limited to four categories.
(1) Polyene
The polyenes, such as amphotericin B, pimaricin and nystatin, attack ergosterol-containing membranes. As a consequence, pores are formed on the membranes, which cause the leakage of cellular components and, ultimately, cell death (Vanden Bossche et al., 1994). Their usages are compromised by the severe and potentially lethal side effects as a result of the similarity between ergosterol in fungal cell membranes and cholesterol in mammalian cell membranes. Clinically, polyenes are used to treat the systemic fungal infections, and only when the azole treatments are failed (Louie et al., 2001).
(2) Ergosterol biosynthesis inhibitors
This class of antifungals is widely used for the treatment of fungal diseases due to their relatively low cytotoxicity. Thiocarbamates (tolnaftate and tolciclate), allylamines (naftifine and terbinafine) and azoles belong to this class because they all prevent yeast growth by blocking the function of enzymes that are involved in the synthesis of ergosterol from squalene. The first two types of drugs are against squalene epoxidase, encoded by ERG1, and thus disturb the conversion of squalene to 2’3-oxidosqualene (Ryder, 1992). The third type of drugs, azoles, includes both imidazoles (ketoconazole and miconazole) and triazoles (fluconazole, itraconazole and voriconazole). They inhibit the function of lanosterol demethylase, a cytochrome p-450 enzyme, encoded by ERG11, and lead to the depletion of ergosterol as well as the accumulation of lethal byproducts, such as methylated sterol (Hitchcock, 1991; Kelly et al., 1997). Since azoles are fungistatic drugs, cells become resistant to such type of drugs after long term exposure.
The newest class of antifungals, echinocandins (including caspofungin, micafungin and anidulafungin), interferes with cell wall synthesis by interaction with the β-1,3 glucan synthase (Radding et al., 1998). As the β-1,3 glucan is an essential cell wall component, disruption of its synthesis causes loss of cell wall integrity and severe cell wall stress.
(4) Nucleic acid synthesis inhibitor
Flucytosine (5FC) is one of the oldest antifungal agents, and has an important role in the management of serious candidal sepsis. It was at first synthesized to treat tumors, but its effect on tumor treatment did not meet the expectation. After the antifungal activity of 5FC was proven in animal models, it was used to treat candidosis and cryptococcosis (Vermes et al., 2000). Since 5FC is a fluorinated analogue of cytosine, it is metabolized via the pyrimidine salvage pathway, and converted from a prodrug into a harmful metabolite that inhibits fungal RNA and DNA synthesis (Appendix 1). 5FC is actively transported into cells by the enzyme purine-cytosine permease (PCP). Once inside the fungal cells, it is rapidly converted via 5-fluorouracil (5FU) to 5-fluorouridine monophosphate (FUMP), which is catalyzed by two enzymes, cytosine deaminase and uracil phosphoribosyl transferase (UPRT), respectively. FUMP is in turn phosphorylated by two kinases to 5-fluorouridine triphosphate (FUTP), which disturbs the protein synthesis by incorporation into RNA (Waldorf and Polak, 1983; White et al., 1998). Alternatively, the reduction of FUMP to 5-fluoro-2’-deoxyuridylate (FdUMP) leads to the inhibition of the enzyme thymidylate synthetase, and thus DNA synthesis (Diasio et al., 1978). 5FC has no direct effect on mammalian cells due to their lack of the enzyme cytosine deaminase. However, its monotherapy is limited by the prevalence of primary resistant strains and the frequent development of secondary resistance during treatment. As a result, 5FC has been used only in combination antifungal therapy (Kauffman and Carver, 1997; Sheehan et al., 1999; Viviani, 1995).
1.3 Molecular mechanisms of flucytosine resistance in yeasts
previous studies. First, interference of any protein involved in the pyrimidine salvage pathway could lead to 5FC resistance (Fasoli and Kerridge, 1988; Jund and Lacroute, 1970; Papon et al., 2007) (Appendix 1). For example, a disruption in the FCY1 gene, encoding cytosine deaminase, as well as a disruption in the FUR1 gene, encoding UPRT, would inhibit the conversion of 5FC into an antifungal metabolite. Also, the disruption in the FCY2 gene, encoding PCP, could block the uptake of 5FC into cells. Second, the interference of proteins involved in the pyrimidine de novo biosynthetic pathway, increasing the production of end products, could result in 5FC resistance because of the feedback inhibition on the salvage pathway or the substrate-enzyme competition between UMP and 5FUMP. Different degrees of the feedback inhibition between salvage and de novo pathways have been found in Saccharomyces cerevisiae. The presence of the exogenous uracil (an activated precursor) promotes the synthesis of nucleotide through salvage pathway and simultaneously suppresses the de novo pathway (Kern et al., 1991). In contrast, the production of UMP through the de novo pathway might inhibit the salvage pathway. For instance, a disruption in the URA3 gene, encoding orotidine 5’-phosphate decarboxylase (ODCase), might increase the synthesis of UMP via the de novo synthesis pathway. The overproduction of UMP reduces the metabolism of 5FC by competing with the harmful products (FUMP and FdUTP) for thymidylate synthetase and UMP kinase, or by allosterically inhibiting the UPRT activity (Desnos-Ollivier et al., 2008; Natalini et al., 1979). Third, interference of the regulatory enzymes may also cause the resistant to 5FC due to the loss of feedback inhibition of de novo pyrimidine nucleotide synthesis, enabling the overproduction of UMP (Jund and Lacroute, 1970).
1.4 The association between loss of heterozygosity and antifungal
drug resistance
The linkage between genetic alterations and phenotypic changes is more complex in diploid cells than in haploid cells because most phenotypic changes observed in the diploid cells require one more genetic event. The first is to generate a genetic polymorphism, and the second is to replace the original genotype with the new one. The latter event can lead to the expression of the recessive allele or the intensification of the original effects, and is known as loss of heterozygosity (LOH).
This phenomenon has been recently reported for C. albicans and its resistance to azoles and micafungin (Coste et al., 2007; Dunkel et al., 2008; Niimi et al., 2010). For example, a disruption in TAC1 (encoding a transcriptional activator of CDR genes) results in constitutive high expression of ATP-binding cassette transporters, which mediates azole susceptibility. Nevertheless, homozygosity for the gain-of-function
TAC1 alleles via LOH is required for a high azole resistance levels in C. albicans
because the hyperactive alleles are codominant with wild type alleles (Coste et al., 2006). In contrast, the presence of an MRR1 hyperactive allele (encoding a transcription factor regulating the expression of MDR1) leads to the upregulation of another efflux transporter, and thus mediates fluconazole susceptibility. The hyperactive allele in the presence of a wild type allele is enough to confer drug resistance in C. albicans; however, higher drug resistance is acquired when the presence of two instead of one such MRR1 allele is existed (Dunkel et al., 2008). Likewise, a disruption in GSC1, a glucan synthase catalytic subunit, alone is enough to generate micafungin resistance, yet two such GSC1 alleles achieve a higher level of micafungin resistance (Niimi et al., 2010). Previous studies have demonstrated antifungal pressure, similar to UV irradiation, may promote genome alterations, including LOH (Coste et al., 2007; Dunkel et al., 2008; Takagi et al., 2008; Tsang et
al., 1999). Analysis of the serial isolates from a patient treated with fluconazole has
revealed an intermediate isolate which contains a gain-of-function allele of MRR1 in the presence of the wild-type allele and displays intermediate drug resistance, while its progeny become homozygous for the hyperactive allele and exhibit increased drug resistance (Dunkel et al., 2008; Franz et al., 1998). The stepwise development of drug resistance provides a competitive advantage for yeasts to adapt for the stress condition. Therefore, the acquisition of mutations in genes involved in drug resistance is, ultimately, coupled with different LOH events, such as gene conversion, allelic recombination/break-induced replication (BIR) or chromosome loss and replication (Andersen et al., 2008; Coste et al., 2007).
1.5 Previous works
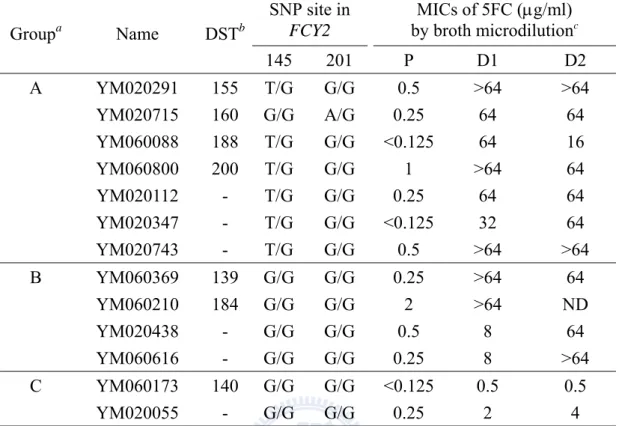
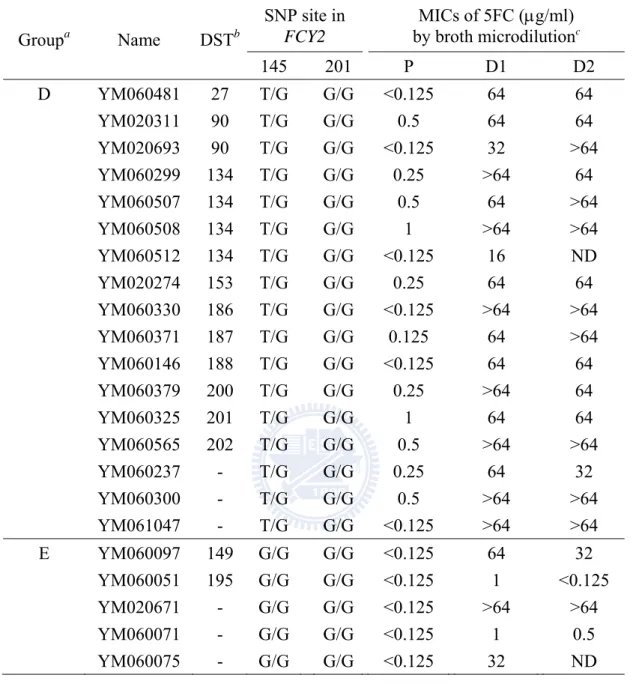
Overall 97 clinical isolates of C. tropicalis were collected from 22 to 24 hospitals in Taiwan during the TSARY programs in 2002 and 2006. According to 5FC
susceptibility testing conducted by the lab fellow Hui-Ching Ko, one was resistant, and 96 remained susceptible (unpublished). Among the susceptible strains, 35 produced progeny within the E-test inhibition ellipses after 24 to 72 h of incubation. Later, 30 isolates were proven to be 5FC resistance by broth microdilution. 5FC resistance in C. tropicalis was first investigated in 13 clinical isolate-derivative pairs by sequencing four genes FCY1, FCY2, FUR1 and URA3, which code for cytosine deaminase, PCP, UPRT, and ODCase, respectively. In six clinical isolate-derivative pairs, a correlation between particular polymorphic nucleotides and resistance to 5FC was found within FCY2, as well as LOH events. To examine whether the homozygosity with a set of SNPs at the FCY2 locus was associated with the 5FC resistance observed in the drug resistant derivatives, the FCY2 homozygous mutants and the fcy2 single knockout strains were constructed from one of the clinical isolates, YM020291. Two distinct DNA sequences corresponding to the entire FCY2 coding region and its flanking sequences were identified by sequencing. For conveniences,
FCY2R was referred to the allele exhibiting the set of SNPs found at the FCY2 locus
carried by the 5FC resistant derivatives, whereas FCY2S was the allele exhibiting the other genotype. The MICs of 5FC for the clinical isolate YM020291 and its genetic engineered derivatives have revealed that while the FCY2R/FCY2R homozygous mutants and the FCY2R/fcy2∆ single knockout strains were resistant to 5FC, the
FCY2R/FCY2S heterozygous clinical isolate, the FCY2S/FCY2S homozygous mutants
and the FCY2S/fcy2∆ single knockout strains were susceptible to 5FC. Sequence analysis showed that seven SNPs were present at the FCY2 locus, including two at the upstream region, four at the ORF and one at the downstream of this gene. Among them, four polymorphic nucleotides were potentially involved in point mutations linked to 5FC resistance. In the following content, the positions of these polymorphic nucleotides were indicated based on the FCY2 ORF in yeast MYA-3404 (available on the C. tropicalis database), and the number in parentheses represented the SNPs relative to the new coding sequence of this gene, identified in this study. Two polymorphic nucleotides were in the promoter region of FCY2 gene, including a thymine (T) to cytosine (C) substitution at position -224 (-11) and a guanine (G) to thymine (T) substitution at position -69 (145), which might influence the expression of FCY2 gene. The third was the substitution of guanine for thymine at nucleotide 273 (486) in the ORF, resulting in the replacement of methionine (ATG) with isoleucine
(ATT) at amino acid position 91 (162) in PCP; the last SNP was a cytosine (C) to thymine (T) substitution at position 1518 (1731) (i.e., the 201 nucleotide downstream of the stop codon of the FCY2 gene), located in the 3’ UTR, which might involve in the translation efficiency and mRNA stability (Chia-Chen Wu, 2009).
1.6 Purpose of this study
The aims of this study were to access the association between the SNPs in FCY2 and 5FC resistance on molecular levels, and to investigate the nature and molecular basis of the LOH events occurred among two clinical isolates, YM020291 and YM060800, and their derivatives. In the beginning, the effect of the homozygous
FCY2R allele in another susceptible isolate YM060800 was tested. 5FC resistant
phenotype in its FCY2R/FCY2R homozygous mutants showed that the contribution of the specific FCY2R allele to drug resistance was largely comparable in the different strain backgrounds. To further identify which one (or ones) of the polymorphic nucleotides may play a role in the mechanism of 5FC resistance, the DNA sequences of FCY2 from four highly susceptible clinical isolates were compared to those of
FCY2R and FCY2S alleles. It showed that three SNPs [-69 (145), 273 (486) and 1518
(1731)] were unique to the FCY2R allele and might be responsible for the resistance ability in C. tropicalis. Introduction of these single-base mutations into the drug susceptible isolate YM020291 revealed that the single mutation G-69T (G145T), resulting in the homozygous SNP (T/T) at position -69 (145), could be solely accounted for the level of 5FC resistance observed in most derivatives of the clinical isolate-derivative pairs. Meanwhile, SNP mapping has shown that four strains were differed by large LOH events (i.e., allelic recombination or break-induced replication), whereas one strain was differed by a localized LOH event (gene conversion).
Chapter 2. Materials and methods
2.1 Materials
2.1.1 Strains
(1) Escherichia coli (DH5α) (2) Candida strains: Table 1
2.1.2 Plasmids and primers
Plasmids and primers used in this study are listed in Tables 2 and 3, respectively.
2.1.3 Chemicals and reagents
z Difco Laboratories
Bacto agar (Cat. No. 214040); BHI (Cat. No. 0037-17); LB agar (Cat. No. 244520); LB broth (Cat. No. 244620); Sabouraud dextrose agar (SDA; Cat. No. 291940); YPD broth (Cat. No. 242820); yeast nitrogen base w/o amino acid (Cat. No. 291940)
z Merck
Chloroform (Cat. No. 1.0244511000); Dimethyl sulfoxide (DMSO) (Cat. No. S26740); Sodium dodecyl sulphate (SDS) (Cat. No. 1.01116.0500); Ethanol (Cat. No. K33534874); Ethidium bromide (Cat. No. K27928515); Glucose (Cat. No. K33069537); Isopropanol (Cat. No. K32632434); Sodium acetate (Cat. No. 1.06268.0250); Sodium carbonate (NaHCO3) (Cat. No. A375692); Sodium
chloride (NaCl) (Cat. No. K29779304); Sodium hydroxide (NaOH) (Cat. No. B886298); Hydroxymethyl aminomethane hydrogen chloride (Tris-HCl) (Cat. No. 8382T006)
z Gibco BRL
RPMI 1640 pH7.0 (Cat. No. 31800022) z Invitrogen
1 kb plus DNA ladder (Cat. No. 12308-011); Agarose (Cat. No. 242820) z NEB
SacI (R0157); SacII (R0157); XhoI (R0146)
z Promega
T4 DNA ligase (Cat. No. M-1801) z Sigma Chemical Co.
Disodium ethylenediaminetetraacetate (EDTA) (Cat. No. D9779); Dithiothreitol (DTT) (Cat. No. D9779); 5-Flucytosine (SI-F7129); Glassbeads (425~600µm) (Cat. No. G9268-500G), Histidine (Cat. No. H8125); Lithium acetate (LiOAC) (Cat. No. L-6883); Lithium chloride (LiCl) (Cat. No. L9650)
z USB
Glycerol (Cat. No. US16374) z Qiagen
RNeasy Mini Kit (Cat.No. 74106): Buffer RLT, Buffer RW1, Buffer RPE
2.1.4 Buffers
z 10 × Tris-EDTA (10 × TE)
100 mM Tris-HCl (pH 7.5), 10 mM EDTA (pH 7.5) z 10 × (1M) LiOAC
20g LiOAC dissolved in sterile ddH2O to 200 ml (pH 7.5)
z 50 × TAE [Bio-Rad, Cat. No. 161-0773] 2 M Tris base, 2 M acetate, 0.05 M EDTA
2.1.5 Medium
z BHI broth
33.7% Calf brain infusion solid, 13.5% Beef heart infusion solids, 27% Proteose peptone, 5.4% Glucose, 13.5% Sodium chloride, 6.7% Disodium phosphate z LB (Luria-Bertani) broth
1% tryptone, 0.5% yeast extract, 1% NaCl; 1.5% agar for plate cultures z YPD medium
1% yeast extract, 2% Bacto-peptone, 2% dextrose
z RPMI 1640 broth (pH 7.0) with 0.165 mol/L MOPS
10.4 g RPMI 1640, 34.53 g MOPS (3-[N-morpholino] propanesulfonic acid), 2 g NaHCO3 dissolved in sterile ddH2O to 1 L (pH 7.0)
Peltier Thermal Cycler PTC-200 (MJ Research) Orbital shaking incubator OSI500 (TKS)
AlphaImager 2000 (Alpha Innotech Corporation) Vortex-2 genie (Scientific Industry)
Dry bath incubator (Violet Bioscience Inc.)
Brushless microcentrifuge Denville 260D (Scientific Industry) Power pac 300 (Bio-Rad)
Gene Pulser II Electroporation System (Bio-Rad) High speed refrigerated centrifuges (Heraes) Centrifuge (SORVALL RT7)
Mettler AT261 DeltaRange (METTLER TOLEDO) Mettler GG4002-S (METTLER TOLEDO)
Digitale camaera COOLPIX 900 (Nikon) Spectrophotometer (Molecular Devices) pH meter (HANHA instruments)
Hot plates/ Stirrers (CORNING) Water bath (CHERNG HUEI Co.) Rotor-GeneTM 3000 (Corbett Research)
2.1.7 Strains and media
Escherichia coli DH5α were used for all plasmid manipulations. They were
grown in LB broth supplemented with 100 µg/ml ampicillin (AMP) (for E.coli carrying pGEM-T cloning vehicle) or 34 µg/ml chloramphenicol (CAM) (for those carrying pSFS2A), and incubated at 37°C. They were cultivated in YPD medium at 30°C. Solid media were made by adding 2% Bacto agar. Selection of nourseothricin (NAT)-resistance transformants (carrying SAT1 cassette) was performed on YPD agar plates containing 200 µg/ml NAT. In broth microdilution experiments, C. albicans ATCC90028 was used as a reference strain and Candida krusei ATCC6258 and
Candida parapsilosis ATCC22019 were incorporated as quality control strains. All
clones were stored as frozen stocks in glycerol at -80°C.
2.2.1 DNA methods
Plasmid DNA was purified from E.coli based on the instruction of the Plasmid DNA Extraction Mini Sample Kit (Favorgen, Cat. No. FAPDE 001). Genomic DNA of C. tropicalis was prepared according to the direction of MasterPureTM Yeast DNA Purification Kit (Epicentre, Cat. No. MPY80200). Restriction digestions (NEB) and DNA ligations (Epicentre, Cat. No. LK6201H) were carried out according to the supplier’s recommendations. PCR and enzyme digested products were purified using the FavorPrep GEL/PCR DNA Clean-UP Kit (Cat. No. FAGCK 100) according to the manufacturer’s instructions. PCR-generated DNA fragments were cloned into plasmid pGEM-T easy vector (Promega, Cat. No. A1360).
2.2.2 Polymerase chain reaction (PCR)
Typical PCR amplifications from plasmids or genomic DNA were carried out using DreamTaqTM DNA polymerase (Fermentas, Cat. No. EP0701) in a final volume of 25 µl or 50 µl. When PCR was performed in 50 µl volumes, the reaction mixture contained 1.25 U of DreamTaqTM DNA polymerase, 5 µl 10 × DreamTaqTM buffer,
0.2 mM deoxynucleoside triphosphate (dNTP), 2.5 mM MgCl2, 0.5 µM forward and
reverse primers, and template DNA (0.01-1 ng for plasmid DNA and 0.1-1 µg for genomic DNA). The PCR cycles comprised an initial denaturation step at 95°C for 5 min, followed by 30 cycles of 95°C for 30 s, 50-65°C for 30 s, and 72°C for indicated times (basically, 1 min/kb). After that, a final extension step at 72°C for 5 min. The resulting PCR products were visualized by electrophoresis in 1-2% agarose gels.
Colony PCR:
A colony PCR-based technique was performed using DreamTaqTM DNA polymerase to detect an insert within a plasmid after E. coli transformation. Test colonies were inoculated into 12 µl of PCR reaction mix, in which the components and their final concentration remained the same. The PCR conditions were modified as follows: 95°C for 10 min; 30 cycles of 95°C for 1 min, 55°C for 1 min, and 72°C for 2 min; 72°C for 5 min.
Fusion PCR:
first two reactions of fusion PCR. PCR was performed in a 50 µl volume containing 1 U of PhusionTM DNA polymerase, 10 µl 5 × Phusion™ HF Buffer, 0.2 mM dNTP, 0.5 µM forward and reverse primers, and 10 ng plasmid DNA. The PCR conditions were as follows: 98°C for 30 s; 30 cycles of 98°C for 10 s, 55°C for 10 s, and 72°C for 15 s; and 72°C for 10 min. In the third step of fusion PCR, Blend Taq- Plus- (Toyobo, Cat. No. TYB-BTQ-201) was used because it produced amplification products that were ready to clone directly into TA cloning vectors. When a final volume was 50 µl, the PCR mixture contained 1.25 U of Blend Taq-Plus-, 5 µl 10 × Buffer for Blend Taq, 0.2 µM dNTP, 0.2 µM forward and reverse primers, and 200 ng template DNA (100 ng each of the two purified PCR products sharing a 27 or 31 bp overlapping sequence). The PCR conditions were as follows: 98°C for 30 s; 30 cycles of 98°C for 10 s, 55°C for 10 s, and 72°C for 15 s; and 72°C for 10 min.
2.2.3 Transformations
The cells of E. coli transformation was carried out by following the HIT Non-Heat Shock Transformation Protocol, with some modification. E.coli cells HIT-DH5α were used as the competent cells (RBC, Cat. No. RH617). 5 µl of the DNA ligation products were mixed with 50 µl of thawed competent cells by vortex for 1 s. The mixtures were incubated on ice for 20 min, followed by heat shock for 1 min at 42°C, and then placed on ice again for 2 min. The transformants were resuspended in 1ml LB broth and incubated for 1 h at 37°C under agitation (180 rpm). Subsequently, the cells were spread on LB plates containing 100 µg/ml of AMP or 34 µg/ml CAM and incubated at 37°C. Resistant colonies were picked after 1 day of growth and the transformants were streaked on LB plates with 100 µg/ml of AMP or 34 µg/ml CAM for single colonies.
The preparation of yeast competent cells was carried out according to Reuβ et al. (2004), and the C. tropicalis strains were transformed by electroporation as described previously (Kohler et al., 1997), with slight modifications. Inserts from plasmids LOB381, LOB382, LOB383, LOB384, LOB385 and LOB386 were excised as
KpnI–SacI fragments and purified by gel extraction. As soon as 5 µl (~ 2 µg) of the
linear DNA fragments was mixed with 50 µl of electrocompetent cells, the electroporation was conducted in a Gene Pulser II Electroporation System (0.2 cm
cuvette, 1.8 kV). The cells were then washed in 1 ml of 1 M sorbitol and resuspended in 1 ml YPD medium. After incubated for 4 h at 30°C under agitation (180 rpm), the yeasts were spread on YPD plates containing 200 µg/ml of NAT and cultured at 30°C. Antibiotic-resistant colonies were picked after 2-3 days of growth and the clones were streaked on YPD plates with 200 µg/ml of NAT.
2.2.4 Constructions of plasmids
The schematic linear map of the plasmids is shown in Figure 5. Two plasmids LOB319 and LOB320, containing the FCY2S allele and the FCY2R allele, respectively, were designed and created previously (Chia-Chen Wu, 2009). Major components of these plasmids are described as follows:
(1) FCY2-A: a 2258 bp KpnI-XhoI fragment composed of the entire FCY2 coding region and its flanking sequences was amplified from the genomic DNA of yeast YM020291, using primer pair HJL1420 and HJL1424.
(2) FCY2-B: a 528 bp SacII-SacI fragment including 46 bp 3’end sequence of FCY2 ORF and its downstream region (from 1531 bp to 1971 bp) as well as 43 bp nucleotide sequence derived from pGEM-T easy vector was amplified from the genomic DNA of yeast YM020291, using a primer pair HJL1422 and HJL1423. (3) SAT1 flipper: a cassette which possessed a dominant NAT resistance marker has
been designed to contain a few unique restriction sites on the left (KpnI and XhoI) and right (SacII and SacI) borders for cloning target sequences by homologous recombination (Reuss et al., 2004).
In this study, two strategies were adopted to introduce a point mutation at one of the three polymorphic sites [-69 (145), 273 (486) and 1518 (1731)] in FCY2 allele carried by plasmids LOB319 or LOB320. One was performed when the proper restriction sites were present (i.e., the enzyme-digested products included only one target polymorphic nucleotide), and the point mutation was created by exchanging a digest fragment (containing the SNP) between two plasmids LOB319 and LOB320. Alternatively, when no suitable restriction site was found, the point mutation was generated by fusion PCR, in which three separate PCR reactions were conducted. The overlapping regions between two PCR products, separately synthesized from the first two reactions, allowed a third PCR to create the entire FCY2-A carrying the expected point mutation. Following are the procedures to construct each plasmid.
(1) LOB381, FCY2S-A [G273T (G486T)]-SAT1-FCY2S-B: FCY2 5’ and 3’ end separately amplified from LOB319 in two PCR reactions by primer pairs HJL1420 and HJL1743, and HJL1742 and HJL1424. A third PCR was conducted to fuse the two resulting PCR products with primers HJL1420 and HJL1424.
FCY2S-A [G273T (G486T)] was first cloned into pGEM-T easy vector, and then
subcloned into the KpnI-XhoI restriction sites of LOB319.
(2) LOB382, FCY2R-A [T273G (T486G)]-SAT1-FCY2R-B: FCY2 5’ and 3’ end separately amplified from LOB320 by primer pairs HJL1420 and HJL1741, and HJL1740 and HJL1424. A third PCR was conducted with primers HJL1420 and HJL1424. FCY2R-A [T273G (T486G)] was first cloned into pGEM-T easy vector, and then subcloned into the KpnI-XhoI restriction sites of LOB320.
(3) LOB383, FCY2S-A [G-69T (G145T)]-SAT1-FCY2S-B: FCY2 5’ and 3’ end separately amplified from LOB319 by primer pairs HJL1420 and HJL2103, and HJL2102 and HJL1424. A third PCR was conducted with primers HJL1420 and HJL1424. FCY2S-A [G-69T (G145T)] was first cloned into pGEM-T easy vector, and then subcloned into the KpnI-XhoI restriction sites of LOB319.
(4) LOB384, FCY2R-A [T-69G (T145G)]-SAT1-FCY2R-B: FCY2 5’ and 3’ end separately amplified from LOB320 by primer pairs HJL1420 and HJL2101, and HJL2100 and HJL1424. A third PCR was conducted with primers HJL1420 and HJL1424. FCY2R-A [T-69G (T145G)] was first cloned into pGEM-T easy vector, and then subcloned into the KpnI-XhoI restriction sites of LOB320.
(5) LOB385, FCY2S-A [C1518T (C1731T)]-SAT1-FCY2S-B: LOB319 was digested
with HindIII, and calf intestinal alkaline phosphatase (CIP) was added to prevent self-ligation. After gel extraction, the 2101 bp DNA segment, containing 208 bp 3’end sequence of FCY2 ORF and its downstream region [including the cytosine at position 1518 (1731)] as well as 1452 bp nucleotide sequence from SAT1 cassette, was removed from LOB319. The deletion was then replaced by the 2101 bp HindIII-HindIII DNA fragment of LOB320.
(6) LOB386, FCY2R-A [T1518C (T1731C)]-SAT1-FCY2R-B: LOB320 was digested with HindIII, and CIP was added. After gel extraction, the 2101 bp DNA segment, containing 208 bp 3’end sequence of FCY2 ORF and its downstream region [including the thymine at position 1518 (1731)] as well as 1452 bp nucleotide sequence from SAT1 cassette, was removed from LOB320. The deletion was then replaced by the 2101 bp HindIII-HindIII DNA fragment of LOB319.
2.2.5 Sequence analysis
The FCY2 ORF was identified by the ORF Finder, available on the National Center for Biotechnology Information website (NCBI; http://www.ncbi.nlm.nih.gov). The homology search was performed with the Basic Local Alignment Search Tool (BLAST) programs, available on the NCBI. The nucleotide and amino acid sequence of FCY2 and FCY21 of C. lucitaniae, and FCY2 of S. cerevisiae was acquired from the GenBank database (accession nos. AY506866, AY506867 and X51715, respectively); likewise, the nucleotide sequences of FCY2 of C. tropicalis ODL4-302, ODL3-231 and CBS94 were also acquired from the GenBank database (accession nos. EU327985, EU327984 and EU327983, respectively) (http://www.ncbi.nlm.nih.gov/ nuccore); the nucleotide and amino acid sequences of FCY2 and FCY21 of C.
albicans were obtained from the Stanford database (orf19.1357, orf 19.333)
(http://www.candidagenome.org/).
2.2.6 Susceptibility testing
Broth microdilution:
Each strain was initially tested for 5FC susceptibility with slight modifications of broth microdilution method recommended by the Clinical and Laboratory Standard Institute (CLSI, 1997). Stock solution of 5FC was prepared by dissolving the drug in sterile distilled water at concentration of 5.12 µg/ml or in DMSO at concentration of l28 mg/ml, and its final concentrations ranged from 0.125 to 64 µg/ml. Strains in the frozen state were directly inoculated to 1 ml BHI, and incubated at 35°C for 24 h. Testing was conducted in 96-well plates with RPMI 1640 buffered to pH 7.0 with 0.165 M MOPS and 2 g/L NaHCO3. The suspensions equivalent to a 0.5 McFarland
standard of each strain were diluted to a final cell count of approximately 0.25×10³ to 1.25×10³ CFU/ml. After 48 h of incubation at 35°C, the final growth of each strain was measured at 595 nm with Biotrack II plate reader. Photos were taken daily. According to CLSI guidelines, the MIC was defined as the lowest drug concentration that inhibited growth by 50% compared to the drug-free growth control. The classification of the 5FC MIC results as sensitive, intermediate, or resistant was defined as an MIC of ≤4, 8 to 16, ≥32 µg/ml, respectively.
E-test:
The MIC values of some strains were also confirmed by E-test (AB Biodis Solna). Briefly, three colonies were picked and subcultured onto SDA (0.67% bacto-yeast nitrogen base without amino acid, 2% dextrose, 20 mg/l histidine-HCl, 2% agar). After incubated at 35°C for 24 h, the cells were diluted in 0.85% NaCl to achieve 0.5 McFarland turbidity (106 to 5×10⁶). A sterile swab was soaked in the inoculums suspension and used to streak the entire agar surface of RPMI plate evenly, rotating 90° in three directions. The plates were allowed to dry before E-test strips were applied. Subsequently, they were incubated at 35°C for 48 h. Photos were taken daily. The classification of the 5FC MIC results was followed the CLSI guidelines.
2.2.7 Quantitative analysis of the mRNA level by real-time PCR
The yeasts were grown on YPD agar supplemented with or without 200 µg/ml NAT at 30°C for 2 days. Suspensions were prepared by picking three distinct colonies and grown in YPD broth at 30°C overnight under agitation (180 rpm). The overnight cultures were diluted to an OD600 of 0.2 in YPD broth and incubated at 30°C under
agitation (180 rpm) until the cultures reached an OD600 of 0.5. The broth cultures were
individually divided into two portions (50 ml each). While the first portion was the treatment of 0.5 µg/ml of 5FC, the second portion was the addition of sterile water. After incubated at 30°C for 1 h, the cells were pelleted, washed in ice-cold sterile water, and allocated to three vials. After the supernatant were removed, cell pellets were stored at -80°C.
RNA isolation:
Total RNA was extracted using the RNeasy Mini Kit (Qiagen, Cat. No. 74106) associated with the Baseline-ZEROTM DNase set (Epicentre, Cat. No. DB0711K). The procedure was performed following the manufacturer's direction, with some modification. The frozen cells (5×10⁷ cells) were loosen by flicking the tube, and resuspended in 600 µl Buffer RLT (containing 1% β-ME). After the addition of the acid-washed glass beads (~ 300 µl), cells were broken using a FastPrep®-24 (5× 30s at 4.5 m/s, with 30 s intervals on ice). The lysates were transferred to a new tube, centrifuged for 2 min at top speed, and transferred to another new tube. An equal volume of 70% ethanol was mixed thoroughly with the homogenized lysate, and the
mixture was transferred to a spin column placed in a 2 ml collection tube, followed by centrifugation for 15 s at top speed, and the flow-through was discarded. The spin column membranes were then washed thrice: first in 700 µl Buffer RW1, followed by centrifugation for 15 s at top speed; second in 500 µl Buffer RPE followed by the centrifugation for 15 s at top speed; third in 500 µl Buffer RPE followed by the centrifugation for 2 min at top speed. The RNeasy spin columns were placed in a new collection tube and centrifuged for 1 min at full speed. Subsequently, they were transferred to a new 1.5 ml tube. 30 µl of RNase-free water was added directly to the spin column membrane and incubated for 10 min, followed by centrifugation for 1 min at top speed. Another 30 µl RNase-free water were added to elute the RNA. Next, 6.5 µl of 10x Baseline-ZERO DNase Reaction Buffer and 2 µl (2 MBU) of Baseline-ZERO DNase were added to the sample. After 1 h of incubation at 37°C, an equal volumn (200 µl) of 4 M LiCl was added to the sample and RNA was precipitated for at least 1 h at -20°C. The RNA precipitate was then centrifuged for at least 30 min at 4°C at top speed, washed with 70% ethanol twice and dissolved in 35 µl of RNase-free water by 5 min incubation at 64°C. The concentrations of RNA were determined with a spectrophotometer at λ280 and λ260.
Reverse transcription:
Reverse transcription was performed on 1 µg of total RNA using ImProm-IITM
Reverse Transcription System with oligo(dT) according to the instructions of the manufacturer (Promega, Cat. No. A3800). cDNA were used for SYBR green quantitative PCR (Roche, Cat. No. 04 193 850 001) and analyzed by Rotor-Gene 6 software version 6.1 (Info-Zip Pty Ltd.). The cDNA of FCY2 mRNA normalized with transcripts ACT1, using a Rotor-GeneTM 3000 instrument (Corbett Research, Australia). Primers of each gene were designed to amplify approximately 300 bp PCR products (Table 3). The condition for real-time PCR was as follows: denaturation (10 min at 95°C), 40 cycles of repeated amplification (15 s at 95°C and 60 s at 60°C). To eliminate the existence of DNA contamination, 1 µg of total RNA and 1 ng cDNA were separately used as templates and amplified by PCR with the primer pair HJL1937 and HJL1938, of which the sequences were deduced from the intron and exon of the C. tropicalis EFB1 gene and therefore could distinguish the resulting PCR
product between the genomic DNA (810 bp) and the spliced RNA (588 bp).
2.2.8 Identification of the boundary of loss of heterozygosity (LOH) events
At first, four genes evenly spreading on the chromosome (corresponding to supercontig 2 in the C. tropicalis database) (http://www.broadinstitute.org/annotation/ genome/candida_group/FeatureSearch.html) were selected. After the sequences of these fragments were analyzed, the state of heterozygosity of each chromosomal region was determined (detail was mentioned in the following contents). Accordingly, the boundary range would be narrowed down to a section where the SNPs have changed from heterozygous state to homozygous state or from homozygous state to heterozygous state. Again, genes evenly spreading in this section were selected and their sequences were analyzed. The process of sequence analysis and boundary localization was repeated until the boundary region was reduced to a range between two genes, and the entire sequence of this region was sequenced to precisely pinpoint the LOH boundary.
The scanning process of SNP markers was carried out by the amplification of specific regions of the chromosome in two clinical isolates YM020291 and YM060800. The PCR products were then sequenced in one direction and the nucleotide sequences were analyzed for polymorphism using the software ChromasPro Version1.21 (Technelysium Pty Ltd.) and Vector NTI software version 10.3.0 (Invitrogen). Heterozygosity was defined by the presence of superimposed peaks in the sequence data. Since the length of PCR products were 800-1600 bp (generally, sequencing data could cover a 400-700 bp region with clarity), sequencing in the opposite direction was performed when no SNP was observed on one end of the fragment. Each primer pair was designed by the Vector NTI software version 10.3.0 (Invitrogen) based on the C. tropicalis strain MYA-3404 genome sequence (taxid: 294747) deposited at Broad institute (www.broadinstitute.org/annotation/genome/ candida_group/MultiHome.html) (Table 3). The corresponding regions where SNPs were found in the selected locus of the parental strains were further amplified from the genomic DNA of their derivatives using the same primer pairs. Two states were observed at each locus, a heterozygous state or a homozygous state, and the LOH boundaries were defined as the regions flanked by adjacent heterozygous and homozygous SNPs.
Chapter 3. Results
3.1 Phenotypic analysis of the clinical isolates and their homozygous
mutants
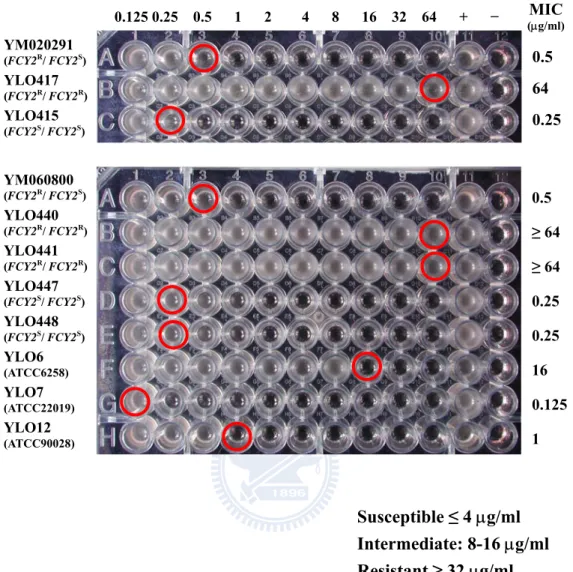
The 5FC susceptibilities of two clinical isolates YM020291 and YM060800, their homozygous resistant mutants (FCY2R/FCY2R) and homozygous sensitive mutants (FCY2S/FCY2S) were determined by broth microdilution method. In previous study, the MICs of 5FC for one of the clinical isolates YM020291 and its genetic engineered derivatives were measured, and revealed that only the FCY2R/FCY2R homozygous mutants (YLO417 and YLO418) and FCY2R/fcy2∆ single knockout strains (YLO419 and YLO421) were resistant to 5FC (Chia-Chen Wu, 2009). Here, the association between genotype and 5FC resistance phenotype was confirmed by another isolate, YM060800, with different genetic background, its homozygous resistant mutants YLO440 and YLO441, and homozygous sensitive mutants YLO447 and YLO448. The 5FC MICs of YM020291 and its homozygous mutants were also measured to examine the consistency of their susceptibilities comparing to the previous work. The 5FC susceptibility testing result of the two clinical isolates YM020291 and YM060800 as well as their homozygous mutants at 48 h is given in Figure 1. According to CLSI guidelines, the MIC was defined as the lowest drug concentration that inhibited growth by 50% compared to the drug-free growth control after 48 h of incubation at 35°C. For both clinical isolates YM020291 and YM060800, the MIC was 0.5 µg/ml, and for their homozygous sensitive mutants YLO415, YLO447 and YLO448 (FCY2S/FCY2S), the MIC was 0.25 µg/ml. In contrast, for the homozygous resistant mutants YLO417, YLO440 and YLO441 (FCY2R/ FCY2R), the MICs were higher than or equal to 64 µg/ml. The 5FC susceptibility testing was conducted twice in six strains YM020291, YLO417, YLO415, YM060800, YLO441 and YLO447; thus, the MIC values for both clinical isolates and their engineered derivatives from each experiment are summarized in Table 4. The MICs of each strain from the two independent experiments were either identical or within one dilution of each other. Based on the criteria of CLSI (1997), yeast cells with MIC ≤ 4 µg/ml were considered susceptible, while those with MIC ≥ 32 µg/ml were considered resistant.
The results from two different genetic backgrounds showed that the FCY2R/FCY2S heterozygous and FCY2S/FCY2S homozygous mutants were susceptible to 5FC, while the FCY2R/FCY2R homozygous mutants were resistant to 5FC.
3.2 Sequence analysis of the 5’ and 3’ untranslated regions of the
FCY2 locus in hyper-susceptible strains
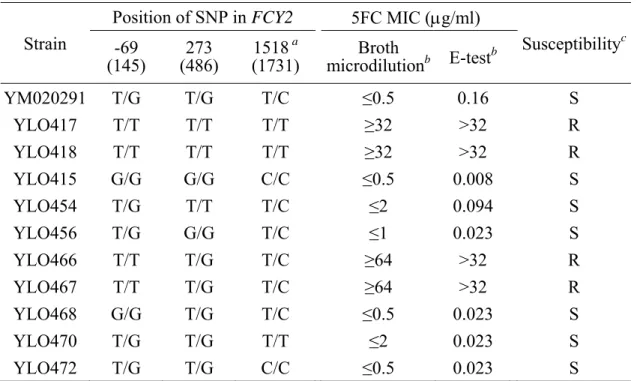
Sequence analysis of the FCY2 locus was performed in four clinical isolates that did not produce 5FC resistant progeny (a.k.a., hyper-susceptible strains) to eliminate the polymorphic nucleotide that was not unique to the FCY2R allele. The hyper-susceptible strain was defined as a clinical isolate that could not produce any 5FC resistant derivative in the E-test inhibition ellipse after 72 h of incubation. Four isolates, YM020367, YM020649, YM060302 and YM060559, were chosen because their inhibition zones were clear. PCR products spanning either 5’UTR or 3’UTR as well as the ORFs of the FCY2 gene were sequenced, and the nucleotide sequences were aligned with those from the FCY2R and FCY2S alleles in YM020291. One polymorphic nucleotide at position 273 (486), resulting in an amino acid change, has been examined in the hyper-susceptible strains previously. All four strains have a 273 (486) G/G genotype, which is also exhibited in the FCY2S allele (Chia-Chen Wu, 2009). The remaining polymorphic sites identified previously were located in the 5’ or 3’UTR [at position -224 (-11), -69 (145) or 1518 (1731)]; thus, the SNPs at these positions were examined in the hyper-susceptible strains. The sequencing results are shown in Figures 2, 3 and 4. Alignment of these sequences revealed that the SNP at position -224 (-11) in both alleles of the FCY2 locus in one strain (YM060559) was thymine, while that in other strains (YM020367, YM020649 and YM060302) was cytosine. In contrast, a -69 (145) G/G genotype and a 1518 (1731) C/C genotype were in all hyper-susceptible strains. These SNPs [at position-69 (145) and 1518 (1731) C/C] were identical to those in the FCY2S allele. As a consequence, the possibility that
the involvement of the SNP at position -224 (-11) in the drug resistance was ruled out because it was found in the 5FC hyper-susceptible strains not only as cytosine but also as thymine (none unique to the FCY2R allele). On the other hand, three polymorphic nucleotides [at position -69 (145), 273(486) and 1518 (1731)] might be involved in the 5FC susceptibility because they exhibited genotypes which were consistent with
those in the FCY2S allele.
3.3 Construction of plasmids carrying a single mutation at the FCY2
locus
To examine whether the potential polymorphic nucleotides at position -69 (145), 273 (486) and 1518 (1731) were involved in the function or expression of PCP linked to 5FC resistance, point mutations were generated at one of the polymorphic sites in
FCY2S or FCY2R allele of the clinical isolate YM020291 by the SAT1 flipping method.
The schematic linear map of the plasmids with the locations of each SNP and the relevant restriction sites is shown in Figure 5. The strategies to construct plasmids carrying single mutations at the FCY2 locus were described in Materials and methods.
For plasmids carrying a single mutation C1518T (C1731T) or T1518C (T1731C) at the downstream of the FCY2 gene, those with the given inserts were first screened by enzyme digestion to eliminate the existence of self-ligation plasmids. The introduction of the point mutation T1518C (T1731C) into LOB320 would create a
HinfI site; on the contrary, the introduction of the point mutation C1518T (C1731T)
into LOB319 would lose a HinfI site. Because the plasmids had too many restriction sites for HinfI to produce a distinguishable enzyme digestion pattern, the PCR products were subjected to digestion with HinfI instead of the whole plasmids. Mutations C1518T (C1731T) and T1518C (T1731C) in the FCY2 gene carried by the plasmids LOB385 and LOB386, respectively, were examined as follows: A 717 bp DNA segment (including the SNP at the 201 nucleotide downstream of the stop codon of the FCY2 gene) of each plasmid was amplified by primer pair HJL2117 and HJL1424. Digestion of the PCR products with HinfI was expected to yield bands of 64, 233 and 420 bps for LOB385 (Figure 6B, bands a, c, and e), and of 64, 176, 233 and 244 bps for LOB386 (Figure 6B, bands a, b, c, and d). The entire nucleotide sequence of the FCY2-A carried by LOB385 or LOB386 was further confirmed by sequencing using primers M13, HJL2124, HJL1208 and HJL2117 to avoid the inclusion of any unexpected mutation. The results of sequence analysis are given in Figure 7.
As to the plasmids LOB381, LOB382, LOB383 and LOB384, the mutations G273T (G486T), T273G (T486G), G-69T (G145T) and T-69G (T145G) were
introduced into either FCY2S (LOB319) or FCY2R (LOB320) allele by fusion PCR. The resulting PCR products were cloned into pGEM-T easy vector and sequenced using primers T7, HJL1208, HJL1210 and SP6 to avoid the inclusion of any unexpected mutation (Figures 8 and 9). The KpnI-XhoI fragments of the plasmids carrying the expected point mutation were then subcloned into LOB319 or LOB320. The introduction of the point mutation T-69G (T145G) into LOB320 would lose an
NsiI site, while the introduction of the point mutation G-69T (G145T) into LOB319
would create an NsiI site. Similarly, the introduction of the point mutation T273G (T486G) into LOB320 would create a BbsI site, while the introduction of the point mutation G273T (G486T) into LOB319 would lose a BbsI site. The constructs of the plasmids LOB381, LOB382, LOB383 and LOB384 were examined as follows: The digestion of plasmids LOB383 and LOB384 with NsiI was expected to yield fragment sizes of 1529, 1985 and 6683 bps (Figure 10B, bands a, b and c), and of 1529 and 8668 bps (Figure 10B, bands a and d), respectively. The results showed that the point mutations G-69T (G145T) and T-69G (T145G) in the FCY2 gene were separately carried by the plasmids LOB383 and LOB384. Likewise, the plasmids LOB381 and LOB382 digested with BbsI were expected to yield fragment sizes of 989, 2115 and 7093 bps (Figure 11B, bands a, c and f), and of 989, 2028, 2115 and 5065 bps (Figure 11B, bands a, b, c and e), respectively. And the results showed the point mutations G273T (G486T) and T273G (T486G) in the FCY2 gene were separately carried by the plasmids LOB381 and LOB382.
3.4 Construction of G-69T (G145T), T-69G (T145G), G273T (G486T),
T273G (T486G), C1518T (C1731T) or T1518C (T1731C) single
mutation strain
Each plasmid was digested with KpnI and SacI, and the resulting 2258 bp linear DNA fragment was used to transform strain YM020291 to introduce the single mutation in the selected FCY2 allele. The integration of the KpnI-SacI fragments of each plasmid occurred at the FCY2 locus was screened by colony PCR with the primer pair HJL814 and HJL1477, which were located on the SAT1 cassette and at the downstream of the FCY2-B, respectively (Figure 12). Since C. tropicalis is a diploid organism, the KpnI-SacI fragments substitute one of the FCY2 alleles at random.
Therefore, to determine whether the integration was taken place at the specific allele resulting in the identical polymorphic nucleotides present at the same position in both alleles, the single mutation strains were examined as following. To generate distinguishable enzyme-digested products, a DNA fragment containing the point mutation was amplified from the genomic DNA of the transformants. For the constructs YLO454, YLO455, YLO456 and YLO457, a 1846 bp DNA segment [containing the SNP at position 273 (486)] derived from their genomic DNA was amplified by primer pair HJL1207 and HJL1424. After BbsI digestion, the products yielded bands of 1846 bp for YLO454 and YLO455, and of 360 and 1486 bps for YLO456 and YLO457 (Figure 13); for the constructs of YLO466, YLO467, YLO468 and YLO469, a 1106 bp DNA segment [containing the SNP at position -69 (145)] derived from their genomic DNA was amplified by primer pair HJL2104 and HJL1208. Digestion of the PCR products with NsiI was expected to yield bands of 1106 bp for YLO468 and YLO469, and of 388 and 719 bps for YLO466 and YLO467 (Figure 13); for the constructs of YLO470, YLO471, YLO472 and YLO473, a 717 bp DNA segment [including the SNP at position 1518 (1731)] derived from their genomic DNA was amplified by primer pair HJL2117 and HJL1424. Digestion of the PCR products with HinfI was expected to yield bands of 64, 233 and 420 bp for YLO470 and YLO471, and of 64, 176, 233 and 244 bp for YLO472 and YLO473 (Figure 13). Also, nucleotide sequences of each PCR product were examined using primers HJL1207, HJL2104 and HJL2117, corresponding to SNP at 273 (486), -69 (145) and 1518 (1731), respectively (Figure 14).
3.5 Phenotypic analysis of the single mutation strains
The 5FC susceptibilities of the single mutation strains each carrying a point mutation G273T (G486T), T273G (T486G), G-69T (G145T), T-69G (T145G), C1518T (C1731T) or T1518C (T1731C) at the FCY2 locus were determined by broth microdilution method. The 5FC MICs of the clinical isolate YM020291, its homozygous resistant mutants (FCY2R/ FCY2R) and homozygous sensitive mutants
(FCY2S/FCY2S) were also measured as a control to examine the consistency of their susceptibilities comparing to previous results. The 5FC was dissolved in DMSO in the first three experiments, but then the drug was dissolved in sterile distilled water in the
last four experiments; thus, the 5FC susceptibility testing results of each experiment under different conditions were separately given in Tables 4 and 5. The MICs of each strain including clinical isolate YM020291, its homozygous mutants and its single mutation strains were determined after 48 h of incubation at 35°C. According to CLSI guidelines, the MIC was defined as the lowest drug concentration that inhibited growth by 50% compared to the drug-free growth control. The 5FC susceptibility testing was conducted at least three times in 11 strains (i.e., YM020291, YLO417, YLO418, YLO415, YLO454, YLO456, YLO466, YLO467, YLO468, YLO470 and YLO472); thus, the MIC values for these strains from each experiment are summarized in Table 6. The MIC values were listed as follows: (1) For the clinical isolate YM020291 (FCY2R/FCY2S), its homozygous sensitive mutant YLO415 (FCY2S/FCY2S), as well as its single mutation strains YLO468 [T-69G (T145G)] and YLO472 [T1518C (T1731C)], the MICs were less or equal to 0.5 µg/ml; (2) For the single mutation strain YLO456 [T273G (T486G)], the MICs were less or equal to 1 µg/ml; (3) For the single mutation strains YLO454 [G273T (G486T)] and YLO470 [C1518T (C1731T)], the MICs were less or equal to 2 µg/ml; (4) For the homozygous resistant mutants YLO417 and YLO418 (FCY2R/FCY2R), the MICs were higher or
equal to 32 µg/ml; (5) For the single mutation strains YLO466 and YLO467 [G-69T (G145T)], the MICs were higher or equal to 64 µg/ml. Susceptibility testing of one reference strain and two quality control strains were used in parallel. All MIC results were within the range given by CLSI except in strain ATCC22019, which gave an increased MIC to 5FC. Based on the criteria of CLSI (1997), yeast cells with MIC ≤ 4 µg/ml were considered susceptible, while those with MIC ≥ 32 µg/ml were considered resistant. Accordingly, the FCY2R/FCY2S heterozygous strains and the FCY2S/FCY2S homozygous mutants as well as the G273T (G486T), T273G (T486G), T-69G (T145G), C1518T (C1731T) and T1518C (T1731C) single mutation strains were susceptible to 5FC; on the contrary, the FCY2R/FCY2R homozygous mutants and the G-69T (G145T) single mutation strains were resistant to 5FC.
The susceptibility of the clinical isolate YM020291 and its mutant strains to 5FC was also assessed with E-test assay (Figure 15). The MICs were determined after 48 h of exposure to 5FC E-test strip and the values were read at the point where the ellipse intersects the strip. The MIC for homozygous sensitive mutant YLO415 (FCY2S/FCY2S) was 0.008 µg/ml; for parental strain YM020291 (FCY2R/FCY2S) and
the G273T (G486T) single mutation strain YLO454 was 0.064 µg/ml; for single mutation strains YLO456 [T273G (T486G)], YLO468 [T-69G (T145G)], YLO470 [C1518T (C1731T)] and YLO472 [T1518C (T1731C)] was 0.023 µg/ml. In contrast, the MIC for homozygous resistant mutants YLO417 and YLO418 (FCY2R/FCY2R), the G-69T (G145T) single mutation strains YLO466 and YLO467 was higher than 32 µg/ml. Based on the criteria of CLSI (1997), yeast cells with MIC ≤ 4 µg/ml were considered susceptible, while those with MIC ≥ 32 µg/ml were considered resistant. As a result, the FCY2R/FCY2S heterozygous strains and FCY2S/FCY2S homozygous mutants as well as the G273T (G486T), T273G (T486G), T-69G (T145G), C1518T (C1731T) and T1518C (T1731C) single mutation strains were susceptible to 5FC, whereas the FCY2R/FCY2R homozygous mutants and the G-69T (G145T) single mutation strains were resistant to 5FC. Among the 5FC susceptible strains, the MICs for YLO415, YLO456, YLO468, YLO470 and YLO472 were less than that for the parental strain YM020291.
The results of MICs from broth microdilution and E-test indicated that a guanine to thymine substitution at the nucleotide -69 (145) in the FCY2S genes has contributed to the 5FC resistance in C. tropicalis.
3.6 Contribution of the polymorphic nucleotide in the promoter
region of the FCY2 gene
To evaluate whether 5FC resistance observed in the FCY2R/FCY2R homozygous strains and the G-69T (G145T) single mutation strains was caused by the differential mRNA levels of FCY2, the mRNA levels of this gene were examined in the clinical isolate YM020291, its single mutation strains YLO466 [G-69T (G145T)] and YLO468 [T-69G (T145G)], and its homozygous mutants YLO415 (FCY2S/FCY2S) and YLO417 (FCY2R/FCY2R) by real-time quantitative PCR. The effect of the drug on the mRNA levels of FCY2 gene was also examined. All strains were treated under two conditions (the absence or presence of 0.5 µg/ml of 5FC) at 30°C for an hour. The
FCY2 mRNA levels of the clinical isolate YM020291, its homozygous mutants and its
single mutation strains conducted in two independent experiments are shown in Figure 16. For the clinical isolate YM020291, the homozygous resistant strain YLO417, homozygous susceptible strain YLO415, the G-69T (G145T) single