生態調查法規和調查人員背景對生態環境影響評估報告品質之影響
7
0
0
全文
(2) September, 2014. Lee et al.: Quality of Biodiversity Survey. that the evaluation of EIA reports is instrumental in measuring the effectiveness of the EIA process (Wood, 2003b, 2008; Ramjeawon and Beedassy, 2004; Demidova and Cherp, 2005; Hartley and Wood, 2005; Pinho et al., 2007; Geneletti, 2008). The checklist was developed using the Delphi expert system with the help from 17 experts that had extensive experiences in performing and/or reviewing EIA (see below). While developing the checklist, we also asked the experts to rank several important factors that could influence the quality of ecological surveys. The experts consistently placed the credential of surveyors the topmost factors affecting EIA quality (Lee, 2009). In this study, we used the checklist to evaluate the quality of EIA reports bulletined between 1988 and 2006 by the Taiwanese government. With an aim to provide recommendations for improvements in EIA performance, we addressed two questions. First, because the government institutes or amends environmental impact assessment laws over time, we asked: Has the installment of laws and guidelines improved EIA performance? Second, because the experts consistently consider the credential of surveyor paramount important, we asked: Does surveyor background affect the performance of EIA? The EIA reports of development projects in Taiwan during 1988–2006 were our study subjects.. MATERIALS AND METHODS EIA reports Between 1988 and 2006, 1067 Environmental Impact Assessment reports were bulletined by the Environmental Protection Administration of the Taiwanese government. We divided all reports into three chronological groups: 1988~1994, 1995~2003, 2004~2006 (Group I, II, and III, respectively) based on two major legislative events: the installation of the Environmental Impact Evaluation Act in 1994 and the release of the Animal Ecology Assessment Technique Guidelines and Plant Ecology Assessment Technique Guidelines by the government in 2003. We randomly sampled approximately one half of the reports, 524 reports overall with 150, 253, and 121 reports from chronological group I, II, and III, respectively. The ecological impact assessment sections of those reports were evaluated with a comprehensive checklist (available upon request, Lee, 2009). The checklist was established by the Delphi expert system (Hwang, 2000; Yasamis, 2006). The experts who participated in producing the checklist were 17 established Taiwanese ecologists with various taxonomic expertise and experience in performing and/or reviewing EIA (Lee, 2009).. In Taiwan, depending on the type of development project, ecological assessment for terrestrial ecosystems, aquatic ecosystems, or both is required. Hence, we further classified the 524 EIA reports into three categories: Land, Water, and Land-Water, respectively. Sample sizes of the three categories in the three chronological groups were 62, 16, 73 in group I, 94, 6, 153 in group II, and 52, 1, 68 in group III. Finally, we divided the EIA reports into 5 clusters according to the surveyors’ academic background (Table 1): (A) background not specified; (B) the surveyors had a BS or higher degree in civil engineering, environmental engineering, or similar field; (C) a BS or higher degree in leisure study, landscape architecture, or similar field; (D) a BS or higher degree in oceanography, horticulture, animal science, or similar field; (E) a BS or higher degree in biology, life science, zoology, botany, or ecology (Table 1). The clustering criteria were based on the number of ecology-related courses needed to fulfill the requirements for a degree in that professional field. Evaluation system and process The EIA evaluation checklist we used contained five sections: description of ecological environment (area, topography, etc.), schedule of survey (month, intensity, etc.), survey technique (sampling tools used, etc.), presentation of results (statistical presentation, etc.), and presentation of suggestions (discussing relevant results, etc.). The details of the checklist are available upon request (Lee, 2009). The five sections were scored against 7, 9, 56–127, 29–87, and 1–3 scoring items, respectively, depending on the types of ecosystems assessed. In Taiwan, the EIA for terrestrial ecosystems is required to provide information on plants, mammals, birds, reptiles, amphibians, and butterflies; while EIA for aquatic ecosystems is required to provide information on fish, aquatic insects, and planktons. Thus, the actual number of scoring items differed among the three ecosystem categories. The scoring checklist was a series of binary yes or no questions. Each scoring item was given 1 or 0 for yes or no, respectively. For example, if a map indicated the survey site was given in the report, we considered it to have fulfilled the scoring item “survey area description”, and the item would be scored 1. We did not differentiate the degree of detail given within each scoring item. Hence, reports receiving high scores indicate a high degree of fulfillment of survey items deemed important as suggested by the 17 experts. In all, the highest possible scores for Land, Water, and Land-Water reports were 177, 102, and 244, respectively. A detailed description of scoring technique was given in Lee (2009). We considered reports that fulfilled 60% of the required 241.
(3) Taiwania. Table 1. The number of EIA reports sampled from three ecosystem categories and five surveyor clusters: (A) surveyors’ backgrounds not specified; (B) surveyors had a BS or higher degree in civil engineering, environmental engineering, or similar field; (C) surveyors had a BS or higher degree in leisure study, landscape architecture, or similar field; (D) surveyors had a BS or higher degree in oceanography, horticulture, animal science, or similar field; (E) surveyors had a BS or higher degree in biology, life science, zoology, botany, or ecology.. Ecosystem Surveyor. Land. Water. Land-Water. Total. A. 85. 19. 82. 186. B. 30. 2. 32. 64. C. 27. 0. 43. 69. D. 13. 0. 32. 45. E. 52. 2. 105. 160. Total. 207. 23. 294. 524. Note: Three ecosystem categories: Land—EIA was required for terrestrial ecosystems only, Water—EIA was required for aquatic ecosystems only, Land-Water—EIA was required for both ecosystems.. items good reports, and the rest poor. We took several measures to reduce biases. First, one person (YHL) performed all the scoring. Second, the scorer practiced scoring with the checklist on 200 randomly selected reports before formal scoring started. Third, the scoring was performed in a random order regarding chronological groups, ecosystem categories, and surveyor clusters. Finally, the identities of the surveyors were blocked from the scorer. Statistical analyses We used Lilliefors’ tests (a one-sample test that compares a sample with a normal distribution) to test for normality of the data set sorted in different ways: chronological groups, ecosystem categories, and surveyor clusters. For data sets that passed the normality tests, we used Tukey’s honestly significant difference tests, (a parametric multiple comparison procedure that compares all possible pairs of means) to compare between treatments, and used Scheffe’s tests (a parametric test that compare pairs of samples) for post hoc comparisons. For data sets that failed the normality tests, we used Kruskal-Wallis one-way ANOVAs (a nonparametric equivalent of ANOVA), followed by Kolmogorov-Smirnov tests (a nonparametric test that compare pairs of samples) for post hoc comparisons. We adjusted significance levels in all post hoc tests to account for multiple comparisons. Because sample size was too small in the Water reports (n=23) for meaningful analysis, we did 242. Vol. 59, No. 3. not look for the effect of surveyor background on them.. RESULTS The highest possible scores for Land, Water, and Land-Water reports were 177, 102, and 244, respectively. The scores received by Land reports ranged from 0 to 153 and averaged 64.0±3.3 (mean±1se). Twenty six percent of the reports received >60% of the possible score. The scores received by Water reports ranged from 17 to 98 and averaged 55.4±4.9. Forty three percent of the reports received >60% of the possible score. The scores received by Land-Water reports ranged from 0 to 214 and averaged 113.6±3.3. Thirty two percent of the reports received >60% of the possible score. The performance of reports in terms of the percent of the maximum score received differed significantly among the three ecosystem categories (Kruskal-Wallis test, Hc=12.8 > χ20.05, 2=6.0, P < 0.002). The Land reports performed significantly worse than the Water and Land-Water reports. Overall, approximately 1/3 of EIA reports received >60% of the maximum possible score over the past 30 years (Fig. 1). The EIA reports performed well in description of ecological environment (section 1) and presentation of suggestions (section 5), with 80% of the reports scoring satisfactorily (fulfilling > 60% of the survey items in that category) in those areas. The EIA reports did poorly in the other three areas (schedule of survey, survey technique, and presentation of results), with barely 40% of the reports scoring satisfactorily in those areas. In general, the qualities of reports improved over time. The mean scores of both Land and Land-Water reports increased significantly from chronological group I to III (Kruskal-Wallis tests, Hc=33.5 > χ20.05,2=6.0, P < 0.0001 for Land reports; Hc=177.4 > χ20.05,2=6.0, P < 0.005, for Land-Water reports; Table 2). The sample size of Water reports (n=23) was too small to perform meaningful statistical tests. The background of surveyors had a significant effect on the quality of reports. Generally, surveyors in cluster A or cluster B performed worse than surveyors in the other clusters (Kruskal-Wallis tests, Hc=85.3 > χ20.05,4=9.5, P < 0.0001 for Land reports; Hc=66.0 > χ20.05,4=9.5, P < 0.0001, for Land-Water reports; Table 3). Among the Land reports, 58% of the C, D and E clusters received > 60% of the maximum possible score; among the Land-Water reports, 53% of the C, D and E clusters received > 60% of the maximum possible score (Fig. 1).. DISCUSSION The EIA component of Environmental Impact.
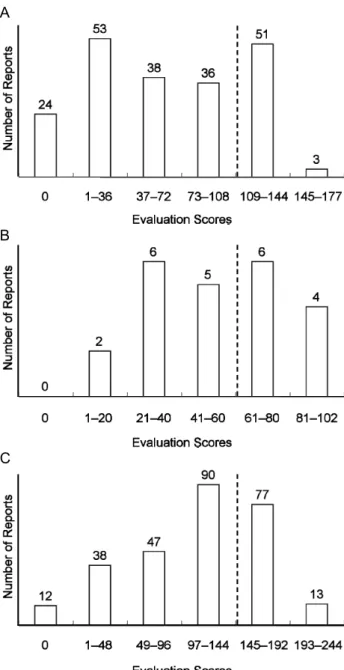
(4) September, 2014. Lee et al.: Quality of Biodiversity Survey. A. Table 2. The mean (±1se) scores received by Land and Land-Water reports during the three time periods, I (1988~1994), II (1995~2003), & III (2004~2006). Numbers in parentheses give sample sizes. Different lower case letters in each column denote a significant difference between time periods within an ecosystem category based on post hoc comparisons using Kolmogorov-Smirnov two-sample tests. The highest possible scores for Land and Land-Water reports were 177, and 244, respectively.. Period Ⅰ Ⅱ Ⅲ. Land 42.4±3.69 (61) b 73.1±4.78 (95) c 91.2±5.48 (52) a. Land-Water 95.6±6.29 (73) b 113.8±16.46 (151) b 129.2±5.58 (68) a. Note: see Table 1 for the explanation of ecosystem categories.. B. C. Fig. 1. The evaluation scores (qualities) of EIA reports for the three ecosystem categories: (A) Land— EIA was required for terrestrial ecosystems only, (B) Water— EIA was required for aquatic ecosystems only, and (C) Land-Water— EIA was required for both ecosystems. The numbers above the bars give sample sizes. The dashed lines indicate the cut-off of receiving > 60% of possible highest scores. The highest possible scores for Land, Water, and Land-Water reports were 177, 102, and 244, respectively.. Assessment is crucial in preventing ill-planned development projects from degrading ecosystems and decreasing biodiversity. It is a critically important process in developing nations, including Taiwan, where economic growth is accompanied by swift changes in land use patterns. However, our results indicate that the EIAs in Taiwan fall short in achieving their goal as. judged from the quality of the EIA reports. Only 1/3 of EIA reports received >60% of the maximum possible score during 1988‒2006 (Fig. 1). Although this result is both frustrating and alarming, we were glad to find that the scores of EIA reports have improved significantly over the three time periods. The trend of improvement concurred with conclusions from similar studies (Vanderhaegen and Muro, 2005; Pinho et al., 2007), and strongly suggested the positive effects of legislation on the quality of EIA reports. We hope this result would lead to more innovative new laws that will guide EIA toward even better performance in the future. However, legislative efforts alone are not enough. The Taiwanese government released both the Animal Ecology Assessment Technique Guidelines and the Plant Ecology Assessment Technique Guidelines in 2003, requiring surveyors to follow the guidelines during EIA. We still found a large percentage of EIA reports perform poorly after 2003. This indicates an urgent need for a mechanism to ensure the quality of EIA reports in Taiwan. The Environmental Protection Administration and other related governmental agencies ought to confer on a way to monitor the quality of EIA. We believe an evaluation process similar to the one used in this study provides a mean to safe-guard EIA performance. The evaluation also revealed directions for improvement. For example, we found that the majority of EIA reports did poorly in the presentation of schedule of survey, survey technique, and survey results. One may argue that poor presentation does not necessarily mean lousy assessment process. However, EIA reports ought to provide sound scientific data, and probably the only such data, to public administrators that could be consulted to make decisions regarding development policies. It is critical the presentation is rigorous, faithfully reflecting both the assessment process and the condition of ecosystem being assessed. Schedule of survey, survey technique, and presentation of results provide important information for independent assessment of potential impacts, thus, should be carefully documented in the EIA reports. 243.
(5) Taiwania. The checklist we produced was established by consulting the guidelines as well as 17 established Taiwanese ecologists using the Delphi expert system. Hence, the checklist was composed of survey items deemed important as suggested by experts (Lee, 2009). It is worth noting that the tool we used in the evaluation process was only a checklist. We did not differentiate the degree of detail given for each scoring item on the checklist. There was a wide range of detail which was not considered by the checklist (Lee, 2009). For example, the EIA reports tended to focus on protected species, and confined themselves to on-site changes, and lacked assessment at the ecosystem level and at the spatial and temporal scales of ecological processes. These are critical problems that we are unable to detect with our checklist. Thus, we should not be satisfied with the checklist as it is. We found the background of surveyors had a significant effect on the quality of EIA (Table 3). Such an effect should be interpreted with care. Knowing the details of many EIAs, we do not think our results indicate the background of surveyors affect the competency of performing biodiversity survey. Alternatively, it is possible that surveyor background does not have a direct effect, but is correlated with some other factors that directly affect EIA report quality. For example, we found that in some cases, the responsible personnel surveying a taxonomic group (e.g., birds) were the same persons surveying some other taxonomic group (e.g., plants). Sometimes, the responsible personnel surveying biodiversity (e.g., birds) were the same persons performing some other assessments (e.g., geology). That is, some projects failed to recruit appropriate man-power for biodiversity survey, and could result in poor EIA reports. The lack of appropriate man-power may be a direct consequence of poor funding. Other than man-power and limited funding, many other factors such as tight deadlines and inadequate report review could also affect EIA report quality. Unfortunately, we were unable to analyze how these factors just mentioned affect EIA report quality because the information is lacking or incomplete in most reports. They are not within the scope of this study. Future researches looking into the effects of these and other factors related to EIA are badly needed. Lee (2009) touched on some of the issues in three case studies. Nevertheless, the 17 experts we consulted consistently named the credential of surveyors as one of the chief factor affecting EIA quality (Lee, 2009). In light of our finding of surveyor background effect, we agree that it is necessary to install a certification process for all personnel who plan to perform biodiversity survey for EIA. A certain level of training in ecology can ensure better quality in EIA. In the past few years, 244. Vol. 59, No. 3. Table 3. The mean (±1se) scores of Land and Land-Water reports prepared by surveyors with different background. Numbers in parentheses give sample sizes. Different lower case letters in each column denote a significant difference between surveyor clusters within an ecosystem category based on post hoc comparisons using Kolmogorov-Smirnov two-sample tests. The highest possible scores for Land, and Land-Water reports were 177, and 244, respectively.. Surveyor Cluster A B C D E. Land a. 34.14±4.23 (85) 46.94±6.40 (30) c 82.1±7.33 (27) c 105±9.21 (13) c 102.8±5.05 (52). b. Land-Water a. 80.85±11.55 (82) 76.92±5.49 (32) b 119.71±6.36 (43) bc 126.9±6.66 (32) c 144.37±3.95 (105) a. Note: see Table 1 for the explanation of ecosystem categories; see Table 2 for the explanation of surveyor clusters.. we have seen progress on this front. For example, the use of volunteers in biodiversity (e.g., floral or faunal) surveys has becoming popular in recent years, yet a number of studies (e.g., Rinvall et al., 2000; Lovell et al., 2009; Sewell et al., 2010) showed that volunteer-based biodiversity surveys could produce data significantly different from that traditionally collected by professionals. These studies also suggested ways, such as using two volunteers to replace one professional, to reduce these differences. These studies emphasized the importance of not only suitable methodology, but also the training of personnel involved in biodiversity surveys. Finally, we hope this study would provide an anchor for pushing for meaningful legislation and training programs that would support significant improvements in EIAs.. ACKNOWLEDGEMENTS We thank graduate students and research assistants in PFL and YKL’s research groups for their assistance during the various stages of this study. We appreciate the constructive comments from Dr. Hai-Yin Wu, Tsung-Yung Liu, and two anonymous reviewers on an earlier version of this manuscript. Financial support for YHL during this project was provided by a grant from the National Science Council of Taiwan awarded to Y.K. Lin (NSC 95-2621-B-002-013-MY3).. LITERATURE CITED Chadwick, A., J. Glasson and R. Therivel. 2005. Introduction to Environmental Impact Assessment, 3rd ed. Routledge, New York, USA, 448 pp. Chen, C.-H., R.-S. Wu, W.-L. Liu, W.-R. Su and Y.-M. Chang. 2009. Development of a methodology for strategic environmental assessment: Application to the assessment of golf course installation policy in Taiwan. Environ. Manage. 43: 166‒188. doi: 10.1007/s00267-008-9222-3.
(6) September, 2014. Lee et al.: Quality of Biodiversity Survey. Chen, T.-C. 2002. Democratic participation and administrative professionalism: The case of Hsiang-Shan tidal flat project in Hsin-Chu City. Master thesis. National Chung-Cheng University. Chia-Yi, Taiwan, 166 pp. Chen, Y.-F. 2000. The structural and strategic analysis of the environmental politics in Taiwan: The case of nuclear 4th plant and Bayer Project. Master thesis. National Chen-Chi University. Taipei, Taiwan, 208 pp. de Chazal, J. and M. D. A. Rounsevell. 2009. Land-use and climate change within assessments of biodiversity change: A review. Glob. Environ. Change. 19: 306‒315. doi: 10.1016/j.gloenvcha.2008.09.007 Demidova, O. and A. Cherp. 2005. Risk assessment for improved treatment of health considerations in EIA. Environ. Impact Assess. Rev. 25: 411‒429. doi: 10.1016/j.eiar.2004.09.008 Downs, T. J. 2008. Transforming impact assessment for sustainable development and poverty eradication. Proc. Inst. Civ. Eng. - Eng. Sustain. 161: 39‒53. doi: 10.1680/ensu.2008.161.1.39 Gasparatos, A., El-Haram, M. and M. Homer. 2008. Critical review of reductionist approaches for assessing the progress towards sustainability. Environ. Impact Assess. Rev. 28: 286‒311. doi: 10.1016/j.eiar.2007.09.002 Geneletti, D. 2008. Incorporating biodiversity assets in spatial planning: Methodological proposal and development of a planning support system. Landsc. Urban Plan. 84: 252‒265. doi: 10.1016/j.landurbplan.2007.08.005 Hacking, T. and P. Guthrie. 2008. A framework for clarifying the meaning of Triple Bottom-Line, Integrated, and Sustainability assessment. Environ. Impact Assess. Rev. 28: 73‒89. doi: 10.1016/j.eiar.2007.03.002 Hartley, N. and C. Wood. 2005. Public participation in environmental impact assessment - implementing the Aarhus Convention. Environ. Impact Assess. Rev. 25: 319‒340. doi: 10.1016/j.eiar.2004.12.002 Hwang, Y.-J. 2000. The analysis of the reliability and validity of the elementary school students' self-report questionnaire in educational research. Proc. Natl. Sci. Counc. ROC (C). 10: 403‒415. Lee, Y.-H. 2009. An evaluation on ecological survey in environmental impact assessment in Taiwan. Master thesis. National Taiwan University. Taipei, Taiwan, 87 pp. Lindenmayer, D. B. 2009. Forest wildlife management and conservation. Ann. NY Acad. Sci. 1162: 284‒310. doi: 10.1111/j.1749-6632.2009.04148.x Liou, M.-L. and Y.-H. Yu. 2004. Development and implementation of strategic environmental assessment in Taiwan. Environ. Impact Assess. Rev. 24: 337‒350. doi: 10.1016/j.eiar.2003.10.018 Lovell, S., M. Hamer, R. Slotow and D. Herbert. 2009. An assessment of the use of volunteers for terrestrial invertebrate biodiversity surveys. Biodivers. Conserv. 18: 3295–3307. doi: 10.1007/s10531-009-9642-2 Mandelik, Y., T. Dayan and E. Feitelson. 2005. Planning for biodiversity: The role of ecological impact assessment. Conserv. Biol. 19: 1254‒1261. doi: 10.1111/j.1523-1739.2005.00079.x Morris, P. and R. Therivel. 2009. Method of Environmental Impact Assessment, 3rd ed. Routledge, New York, USA, 579 pp.. Pinho, P., R. Maia and A. Monterroso. 2007. The quality of Portuguese environmental impact studies: the case of small hydropower projects. Environ. Impact Assess. Rev. 27: 189‒205. doi: 10.1016/j.eiar.2006.10.005 Ramjeawon. T and R. Beedassy. 2004. Evaluation of the EIA system on the Island of Mauritius and development of an environmental monitoring plan framework. Environ. Impact Assess. Rev. 24: 537‒549. doi: 10.1016/j.eiar.2004.01.001 Ringvall, A., G. P. Patil and C. Taillie. 2000. A field test of surveyors' influence on estimates in line transect sampling. For. Ecol. Manage. 137: 103‒111. doi: 10.1016/S0378-1127(99)00319-9 Samarakoon, M. and J. S. Rowan. 2008. A critical review of environmental impact statements in Sri Lanka with particular reference to ecological impact assessment. Environ. Manage. 41: 441‒460. doi: 10.1007/s00267-007-9039-5 Sewell, D., T. J. C. Beebee and R. A. Griffiths. 2010. Optimizing biodiversity assessments by volunteers: The application of occupancy modeling to large-scale amphibian surveys. Biodivers. Conserv. 143: 2102–2110. doi: 10.1016/j.biocon.2010.05.019 Slootwega, R. and A. Kolhoff. 2003. A generic approach to integrate biodiversity considerations in screening and scoping for EIA. Environ. Impact Assess. Rev. 23: 657‒681. doi: 10.1016/S0195-9255(03)00114-8 Soderman, T. A. 2006. Treatment of biodiversity issues in impact assessment of electricity power transmission lines: A Finnish case review. Environ. Impact Assess. Rev. 26: 319‒338. doi: 10.1016/j.eiar.2005.10.002 Song, Y. I. and J. Glasson. 2009. A new paradigm for Environmental Assessment (EA) in Korea. Environ. Impact Assess. Rev. 30: 90‒99. doi: 10.1016/j.eiar.2009.05.008 Swift, T. L. and S. J. Hannon. 2010. Critical thresholds associated with habitat loss: a review of the concepts, evidence, and applications. Biol. Rev. 85: 35‒53. doi: 10.1111/j.1469-185X.2009.00093.x Thompson, G. G. 2007. Terrestrial vertebrate fauna surveys for the preparation of environmental impact assessments; how can we do it better? A Western Australian example. Environ. Impact Assess. Rev. 27: 41‒61. doi: 10.1016/j.eiar.2006.08.001 Thompson, G. G., S. A. Thompson, P. C. Withers and J. Fraser. 2007. Determining adequate trapping effort and species richness using species accumulation curves for environmental impact assessments. Austral. Ecol. 32: 570‒580. doi: 10.1111/j.1442-9993.2007.01729.x Treweek, J. 1996. Ecology and environmental impact assessment. J. Appl. Ecol. 33: 191‒199. doi: 10.2307/2404742 Vanderhaegen, M. and E. Muro. 2005. Contribution of a European spatial data infrastructure to the effectiveness of EIA and SEA studies. Environ. Impact Assess. Rev. 25: 123‒142. doi: 10.1016/j.eiar.2004.06.011 Wood, C. 2003a. Environmental Impact Assessment: A Comparative Review, 2nd ed. Prentice Hall, New Jersey, USA, 432 pp. Wood, C. 2003b. Environmental impact assessment in developing countries. Int. Dev. Plan. Rev. 25: 301‒321. 245.
(7) Taiwania. Vol. 59, No. 3. doi: 10.3828/idpr.25.3.5 Wood, G. 2008. Thresholds and criteria for evaluating and communicating impact significance in environmental statements: 'See no evil, hear no evil, speak no evil'? Environ. Impact Assess. Rev. 28: 22‒38. doi: 10.1016/j.eiar.2007.03.003 Yasamis, F. D. 2006. Assessing the institutional effectiveness of state environmental agencies in Turkey. Environ. Manage. 38: 823‒836. doi: 10.1007/s00267-004-2330-9. 生態調查法規和調查人員背景對生態環境影響評估報告品質之影響 李育欣(1)、李培芬(1)、林雨德(1,2*) 1. 國立台灣大學生態學與演化生物學研究所,台北,台灣。 2. 國立台灣大學生命科學系,台北,台灣。 * 通信作者。Email: kirklin@ntu.edu.tw (收稿日期:2013年09月05日;接受日期:2014年04月28日). 摘要:生態影響評估(Ecological Impact Assessment)是環境影響評估制度的一部分,它主 要涉及對各生物類群和其棲息地的實地調查,是預防不周詳的土地開發計畫戕害生物多樣 性的主要把關工具。但生態影響評估的品質究竟如何,有什麼因素影響其表現?我們所知 甚少。本研究審視台灣生態影響評估的執行狀況。我們使用德爾非專家系統所開發的評審 系統,審評台灣1988‒2006年間的生態影響評估報告品質。同時,我們也檢視以下兩個因子 對評估報告品質的影響:1)台灣所制定的環境影響評估制度相關法律和準則;2)生態調 查人員背景。研究結果顯示,大多數的生態影響評估報告表現不佳,但制定法律對報告之 品質有正面影響。依此,我們建議未來必須積極訂立完整的法規引導並檢核生態影響評估。 研究結果也顯示,調查人員專業背景對報告品質有顯著影響。然此一結果可能是由生態影 響評估的經費與時間限制等關聯因子造成,未來對生態影響評估的其他面向做深入研究可 以釐清之。我們建議調查人員的專業程度仍應該建立認證制度。 關鍵詞:生物多樣性、生態調查、效益、環境影響評估、環境影響評估報告、評審系統。. 246.
(8)
數據

相關文件
容易移動 中等 中等 固定 隨容器.
[r]
Before the frame start specified in PMC_RSP, the MS shall transmit PMC_REQ in response to receipt of an PMC_RSP from the BS directing a change to uplink power
三、經甄選錄取報到人員,需俟辦理商調及報派手續完成後,始生進用效力。報名人員所檢附之證件影
IRB 編號 SE20156A-1 計畫主持人 許佳茵 計畫名稱 思覺失調症病患疾病觀感對其遵囑服藥及精神症狀之影響 審查意見
顏秘書:目前 單次服務每小時約 250-300 元、包月制 ( 以每週定期 1 次為標準 ) 每月約 4,000 元、年終大掃除每次 (4 小時 ) 約 1,600 元,每日洗衣、打 掃、煮飯「三合一」每月約
4.促進部分工時勞工受到公平對待:日本在 2008 年共有 1407 萬人從事部分 工時,約占全體勞工的 26.1%。而這些部分工時勞工不僅是補充角色,更承擔職 務責任,其付出卻未被等量對待。因此,2008
(1996), “Transformational leader behaviors and substitutes for leadership as determinants of employees satisfaction, commitment, trust, and organizational citizenship
