行政院國家科學委員會補助專題研究計畫 █成果報告
□ 期 中 報 告
既有建築筏基雨水貯集之可行性與支援都市抗旱操作模式之研究
計畫類別:□ 個別型計畫 □ 整合型計畫 計畫編號:NSC 96-2211-E-011-152-
執行期間: 96 年 8 月 1 日至 97 年 7 月 31 日
計畫主持人:鄭政利 教授 共同主持人:
計畫參與人員:何昆錡、廖婉茹、林佳莉、李芊穎
成果報告類型(依經費核定清單規定繳交):■精簡報告 □完整報告
本成果報告包括以下應繳交之附件:
□赴國外出差或研習心得報告一份
□赴大陸地區出差或研習心得報告一份
□出席國際學術會議心得報告及發表之論文各一份
□國際合作研究計畫國外研究報告書一份
處理方式:除產學合作研究計畫、提升產業技術及人才培育研究計畫、
列管計畫及下列情形者外,得立即公開查詢
□涉及專利或其他智慧財產權,□一年□二年後公開查詢
執行單位:國立台灣科技大學建築系
中 華 民 國 97 年 7 月 25 日
中文摘要
台灣地區自1996 年的賀伯颱風、1998 年的瑞伯颱風、芭比絲颱風、2000 年的象神颱 風及距離最近的2001 年的納莉颱風,這些接連而來的颱風所帶來的降雨量,其頻率均超越 水利工程防洪設計的一百年一次頻率。這對高度發展的都市而言,其都市防洪工程與都市 排水功效都遭受到極大的考驗。台北市都會區的防洪設施大部分是利用抽水站來降低尖峰 流量,以防止都會區水災的發生。然而當抽水站的排水能力不足或人為操作不良等問題發 生時,前者只能再增設抽水站作為防洪措施,後者的問題較為複雜,甚而渉及業務疏失等 刑法層面,但其所造成之結果都是都會區人力、財力、物力無法計量的損失,例如根據中 央災害應變中心統計,納莉颱風至少造成全台 82 人死亡、20 人失蹤和 208 人受傷,地下 室淹水多達 6 千多棟,全台 37 萬多戶停電、91 萬戶停水。本研究擬針對台北都會區洪災 解決對策提出以既有建築之筏式基礎閒置空間作為貯留尖峰流量之滯洪池概念,建立既有 建築物筏式基礎防洪評估模式,分析都市筏式基礎空間所能緩和的洪災效能,期能減少都 市發生洪災的機率,且對於未來政府相關單位於擬定防洪課題時之參考依據。
關鍵詞:既有建築物、笩式基礎、防洪效益
Abstract
The main purpose of this paper is to develop a practical operation model for water conservation, in particular, to propose a solution for an urban drought period. According to a initial investigation, a huge capacity raft foundation space approximately 10 millions cubic meters was found in the existing urban buildings in Taipei city. The capacity of these idle raft foundations is almost equal to a mid-scale reservoir. In this research, an urban drought prevention model with allocation to prevent-drought (APD) utilizing raft foundations of existing buildings and the reservoir, implemented by Linear Programming, is developed to provide sufficient water for residential water utilization during a period of urban drought. According to the results of this research, the proposed model has been proven to be a practicable and feasible urban drought prevention solution.
Keywords: raft foundation, reservoir, allocate, drought, linear programming..
List of symbols
APD allocation prevention of drought model C.O.R.F capacity of raft foundation CSW coefficient of supply water LP Linear Programming
ORC operation rules curves of reservoir
ow
ta ten-day amount of overflow from the raft foundation of the specimen building (m
3)
POD period of drought
POND period of non-drought
pw
ta ten-day supply of tap water to flush the specimen building toilet (m
3)
pw
t(d)a ten-day tap water supply to flush the specimen building toilet, in drought conditions (m
3)
pw
t(n)a ten-day tap water supply to flush the specimen building toilet, in non-drought conditions (m
3)
pw
t(o)the original ten-day tap water supply to flush the specimen building toilet (m
3)
rw
ta ten-day accumulation of rainwater from the roof of the specimen building (m
3)
sw
ta ten-day quantity of water stored in the raft foundation of the specimen building (m
3)
sw
t(d)a ten-day quantity of water stored in raft foundation of the specimen building , in drought conditions (m
3)
tw
ta ten-day consume of toilet flush water for the specimen building (m
3) tw
t(o)the original ten-day consume of toilet flush water for the specimen building (m
3)
tw
t(n)a ten-day consume of toilet flush water for the specimen building, in non-drought conditions (m
3)
tw
t(d)a ten-day consume of toilet flush water for the specimen building, in drought conditions (m
3)
W.F.E.U water for emergency use
WLOM warning-line showing critical water lever α Supply coefficient of tap water
β toilet-water-saving rate
1. Introduction
Taiwan is located in the Asian monsoon area and has an abundant supply of rainwater with annual precipitation that averages around 2 500 mm. However, water shortages are still a critical problem during the dry season. Water conservation is an inherent pre-requisite for sustainable utility service provision in building design today. Growing pressures from fresh water shortages and pollution are becoming one of the most critical global problems.
Many metropolitan areas in Taiwan have experienced water shortages in recent years, due partly to droughts, economic development and rapid urbanization. These water shortages have resulted in an anxious public consciousness of in adequate existing water supplies and created an economic barrier to development. It has caused great damage in metropolitan areas. Consequently, it is clear that a practicable solution must be conducted to alleviate the water shortage problem in urban areas.
Recently, a general investigation of raft foundation space in existing urban buildings was executed.
According to the initial results of this fundamental survey in Taipei city, a huge capacity raft foundation space, approximately 10 million cubic meters, was found in existing urban buildings in Taipei. The capacity of these idle raft foundations is almost equal to a mid-scale reservoir.
This paper introduces a simplified model for preventing urban drought by allocation to prevent-drought (APD) using the raft foundations of an existing building and the reservoir implemented by Linear Programming. This model is developed to provide sufficient water for residential water utilization during a period of urban drought. Meanwhile, a twelve story residential building in Taipei was chosen as a study case to be implemented by Linear Programming. Eventually, based on the results of the optimization, solutions are made which verify that the target building can be sure of enough water to flush toilets in the building during a period of drought. The importance of utility performance will be stressed and a method that allows reliable verification for general building categories will be presented
.
2. Literature Review and relevant issues
2.1 Literature Review
In the field of utilization of rainwater collected from roofs, the authors A Fewkes, A.Dixon, and D. Butler [1]. [2]. [3]. [4] etc, have made use of the analytic models to study the efficiency of the usage of rainfall collected from roofs and the size of storage needed to preserve the rainfall collected in the area of England during 1996 through 2000. “Rainwater Use System in Building Design---A Case Study of Calculation and Efficiency Assessment System” by Cheng, C. L. [5] , also studied how to evaluate the efficiency of utilization of rainwater in the year of 2004. According to historical research information, Ripple (1883) obtained the design reservation capacity of a reservoir based on mass diagram analysis and he initialized the concept of simulation models.
There are two basic simulation models: (1) Simulation; The model utilizes mathematical
methods to describe the characteristics of a system and the method of trial and error for comparison
and analysis to obtain a better solution to the problem considered. The solutions have been used to
establish the policies most commonly used in water resource. (2) Optimization; The optimal solution is obtained by inputting system data based on a mathematical model. There are optimization models which are based on theories of Linear Programming, L.P, Dynamic Programming, D.P, Nonlinear Programming, N.L.P, Genetic Algorithms, G.A, Neural Networks, and Fuzzy theories. The problems analyzed include optimal capacity, operational rule lines, allocation by linking multiple reservoirs, and the optimization of draining a reservoir in response to flooding. The subjects of optimal operations and the operation rule curves of reservoirs have also been studied by Chang F. J [12]. [13]. [14]. [15]
and Tung, C. P [16]. [17] etc, based on the theories of Neural Networks, Fuzzy theories, and Genetic Algorithms during 1999~2005.
2.2 Annual Rainfall of Taipei and Feitsui Reservoir
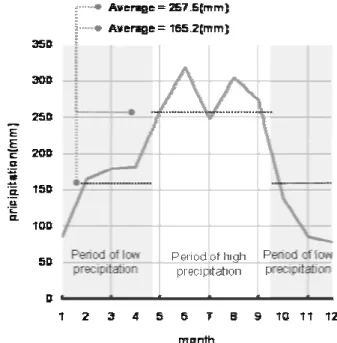
A statistical analysis of rainfall intensity of Taipei, from the literature (from 1984 to 2005) is shown in Fig. (1), It shows an annual averaged precipitation of about 2425 mm. The annual precipitation of 4404 mm in 1998 was the highest; and the 1192mm in 2003 was the lowest. In order to study the operational mechanism of drought prevention, the samples of the annual averaged precipitation in the years of 1993, 1994, 1995, 1999, 2002, 2003 were selected for the research samples, because they were lower than ordinary. The annual averaged precipitation of the samples is about 1326mm being about the half of the annual average precipitation in the area of Taipei, The month-averaged precipitation of a year in Taipei displays two peaks with concentration in the summer season mostly. The total amount of rainfall is concentrated from May to October and usually averages 1544.9mm in Taipei. It is 66.4% of the total amount of the annual averaged rainfall. For the low precipitation season (from January to April and November, December), the total amount of rainfall is 780.3mm, which is 33.6% of the total amount of the annual averaged rainfall. as shown in Fig. (2).
0 1000 2000 3000 4000 5000
1980 1985 1990 1995 2000 2005 2010 year
precipitaion (mm)
Scope of research
•Average=2425(mm)
•Average=1418.5(mm)
0 1000 2000 3000 4000 5000
1980 1985 1990 1995 2000 2005 2010 year
precipitaion (mm)
0 1000 2000 3000 4000 5000
1980 1985 1990 1995 2000 2005 2010 year
precipitaion (mm)
Scope of research Scope of research
•Average=2425(mm)
•Average=1418.5(mm)
•Average=2425(mm)
•Average=1418.5(mm)
Fig ( 1 ). Average precipitation of Taipei
Fig ( 2 ). Monthly Average precipitation of Taipei
The Feitsui Reservoir lies on the Northeastern side of Taipei as shown in Fig. (3). Its water holding capacity is about 300 million cubic meters. The full water level elevation of the Reservoir is 170 meters and the empty water level is 110 meters. The main purpose of the Feitsui Reservoir is to supply the water for public use in the area of Taipei and the generation of electricity is a subsidiary function. In accordance with the Feitsui Reservoir operation and utilization rule, the reservoir operation rule curves (denoted as “ORC”) can be classified as ORC.1, ORC.2, ORC.3 and ORC.4 etc.
as indicated in Fig.(4). However, in accordance with the rules, when the water level of Feitsui Reservoir is above ORC.2, the amount of reservation water should be sufficient to meet the water requirements of the plan (namely to supply water and generate electricity). When the water level is below ORC.2, no generating of electricity is allowed. If the water level drops below ORC.3,limitation of use of water must be executed. ORC.4 is a warning line for the drought situation of reservoir.
Fig( 3 ). Location of researched building and Feitsui reservoir
Fig ( 4 ). Data and operation rules of Feitsui reservoir
3. Methodologies and Generation of APD Model
3.1 Linear Programming (LP)
The algorithm of linear programming is always used to solve the optimize of problem considered.
The objective function and constrains are two major elements of using the algorithm of Linear Programming (LP). Simply speaking, there are four main steps which should be taken in order to generate an optimal value of a model considered. (1) Selecting appropriate decision variables to define a problem considered. (2) Generation of an objective function and deciding on maximization or minimization. (3) Creation of linear inequality expressions. (4) Deciding whether the non-negativity decision variables should be with constraints or without constraints. The optimal value of the objective function of the LP can be found by restraining the decision variables by the linear inequality constraints.
) 2 (
) 1 (
0 x ,..., x , x
b x a ...
x a x a
...
...
...
...
...
b x a ...
x a x a
b x a ...
x a x a constrain
x
c ...
x c x c Z Max(Min)
fucntion objective
n 2
1
m n mn 2
n2 1 m1
2 n 2n 2
22 1 21
1 n 1n 2
12 1 11
n n 2
2 1 1
≥
≤ +
+ +
≤ +
+ +
≤ +
+ +
+ +
+
=
The quantities of the decision variables in a model of allocation to prevent drought include the
amount of tap water supply, water to flush toilets, water collected from roof and water reserved in raft
foundation. The objective function of the model is to prevent drought with a sufficient amount of
water to flush toilets of the building during the period of drought by allocating water between the
reservoir and raft foundation. Therefore, the objective function implies the allocation of water
between the period of drought and non-drought in the reservoir and raft foundation. It is good when
disparities in the amounts of water allocated are the large. The functions constrain the limitations and
conditions for the decision variables during periods of drought and non-drought.
3.2 Concept of APD
In order to prevent drought by allocating water between raft foundations of buildings and the reservoir, during the period of non-drought (denoted as “POND”), the extra amount of water from the reservoir and the water collected from roofs of buildings can be reserved in raft foundations. Hence, it can be used to alleviate the drought when the period of drought (denoted as “POD”) happens as the conception diagram shown in Fig. (5).
Fig ( 5 ). Concept of allocation prevent-drought model (APD)
Generally, the guideline for distinguishing”POND” from “POD” is based on the operational rule lines of the reservoir. The operational rule lines in the water management of the reservoir are a set of curves containing the relationship of the numerical values of water level of the reservoir with ten-days and 36 ten-days constitute a year. Fig. (6) illustrates the decision variables and APD model concept.
3.3 The scope of decision variables during POND/POD
The decision variable of tap water supplied from the reservoir to flush toilets (pwt) during POND is higher than the normal tap water supply criterion in order for the water to be stored in raft foundation ready to prevent drought. On the other hand, the decisional variables of tap water supplied from the reservoir to flush toilets during POD are lower than the normal tap water supply.
The consume water of buildings flush toilets (twt) is same as original during POND but it needs
to use sparingly during POD. The amount of water collected from roof (rwt) is known as constant
and it does not need to be identified as during POND or POD. Furthermore, the decision variable for
water stored (swt) in raft foundation is “fill as full as possible before the POD come”. During POD,
the water reserved in the raft foundation is used to flush toilets, then the upper bound of the decision
variable is defined as the effective volume capacity of the raft foundation and the lower bound of the
decision variable is defined as the amount of water spared for emergency use by the building (such as
earthquake, fire etc). Another variable concerning the water stored (swt) in the raft foundation is how
to handle the worst and the best conditions which can occur.
(1) For the worst condition: The raft foundation is full during POND. The reservoir is in a status of water shortage in the early stages of POD (10th ten-day) and the water is supplied continuously from the raft foundation until an unsafe level of reservation water in raft foundation is reached.
Namely, there is an insufficient amount of water reserved in raft foundation in late stage of POD.
(2) For the best condition: The shortage of water in the reservoir does not occur and the water in the raft foundation is going to be filled fully and continuously and it is consumed until an unsafe level is reached late in POD. By the same token, there is a sufficient amount of water in the raft foundation to resist drought during POD.
Therefore, under the worst and best conditions the amounts of water reserved in the raft foundation form parallelogram shapes with top and bottom boundary lines. All the variations of the reservation of water in the raft foundation will lie within the range of the parallelogram as shown in Fig. (6).
Fig ( 6 ). illustration of decision variables in the APD model
3.4. Surveys of Current Raft Foundation Capacity
The structure system of the building consists of floors, girders and columns. The weight of the
building through the structure system is carried by the soil directly. If the weight of the building is
greater than the bearing capacity of the soil, uneven sinking of the building occurs. However,
depending on the scale of the building and the soil bearing capacity, there are two types of foundations,
i.e., a shallow foundation (independent foundation, flat plate foundation, strap foundation) and a deep
foundation (raft foundation, pile foundation) as shown in Fig. (7). Generally in the area of Taipei, shallow foundations are used for buildings with five stories and under, and deep foundations are used for more than five stories. The configuration of a raft foundation consists of four foundation girders with top basement slab and bottom foundation slab. There always is an empty space between the foundation girders and slabs used for the equipment and facilities of the building, such as lifting equipment pits, sewage disposal equipment, etc., which are often set up in the raft foundation.
Fig ( 7 ). Classification of building foundations
This study collected data from building licensees issued by the Government of Taipei during 1981- 2004: a total 17 958, including the Taipei 101 building as shown in Fig. (8). The sample analysis, based upon the different number of stories, shows most buildings are 3 stories to 14 stories. The number of buildings of 5 stories is 7 225, the buildings of 7 stories are 3 094 and the buildings of 6 stories are 1 434. There are 11 753 buildings altogether. These account for 65% out of the total data considered. By the classification of the use of buildings, there are 3 796 commercial buildings (21.7%), 12 051 residential buildings (68.7%), 481 industrial buildings (2.7%), 529 public buildings, (3.0%) and 675 other purpose buildings (3.9%). Based on the different number of stories and the use of buildings and its percentages out of the total data, the survey samples 128 buildings data altogether used in the research. The sample surveys show that buildings above 8 stories all are set up with raft foundations as shown in figure (9).
Fig ( 8 ). The quantity of building by yearly and utilization in Taipei
Fig ( 9 ). The installed ratio of raft foundation by building floor
Based on the samples and architectural drawings of buildings, the depths of raft foundations of buildings in Taipei are about 2.0 to 1.0 meters. In this study, the average of 1.5 meters in depth is used and the total empty space in the raft foundation is obtained by multiplying the area of the basement slab by 1.5 meters. The total allowable reservation capacity of the raft foundation is defined as the total empty space in the raft foundation subtracting the unusable space. The unusable space is mostly space for lifting equipment, sewage disposal facilities, hydrant facilities etc. The equipment will be described as follows and as shown in Fig. (10).
Fig ( 10 ). Analysis of the volume of raft foundations
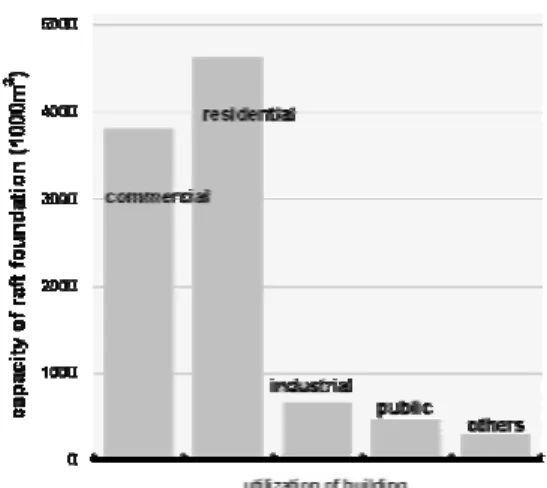
The results of estimation in this research indicate that there are 9,876 thousand cubic meters of
total reservation capacity in raft foundations in existing buildings in Taipei. The results show that the
total reservation capacity of residential buildings is 4 628.3 thousand cubic meters (46.9%) which is
the highest proportion. Commercial buildings take second place and 3 809 thousand cubic meters
(38.6%). There are 669.9 thousand cubic meters (6.8%) in industrial buildings, 474 thousand cubic
meters (4.8%) in public buildings and 294.5 thousand cubic meters (3.0%) in other purpose buildings
as shown in Fig. (11).
Fig ( 11 ). The summation capacity of raft foundations by building utilization
4. Operation and Verification
4.1 Object building
In order to prove the APD model is practicable, this research used a case-study to verify the process of proposed operation. The study object, which is located in Taipei city, was chosen to be considered as a simulation. Meanwhile, the relevant information about the researched building, such as the precipitation in the Taipei area, variations of water level and operational rules of the Feitsui Reservoir in historically, and the amounts of water used to flush toilets and collected from roofs are stated in this section. The object building of this research is a 12 story building with 2 story basement and a total of 82 apartment units, as shown in Fig. (3). The object building is about 18 kilometers from the Feitsui Reservoir. The outline of the study building is given in Table 1 as follows.
Table 1. The outline of the research object building
Basement:1, 2 floor Each 893 (m
2)
12 stories Each 721 (m
2)
Area of roof 721 (m
2)
Residents 329 (persons)
Maximum capacity of raft foundation 1200 (m
3)
According to an initial survey, the averaged amount of water used to flush toilets of each ten-day
for every year is 196.6 m3/ ten-day for the researched building. The averaged amount of water used to
flush toilets reaches the highest value about 211.96 M3 in the 25th ten-day and the lowest one about
183.15 m3 in the 10th ten-day. Furthermore, the averaged amount of water collected from roof of
each ten-day for every year is about 42.43 m3/ten-day for the researched building and it reaches the
highest value about 92.18 m3 in the 24th ten-day. Therefore, the averaged amount of water collected
from the roof for each ten-day equal 21.1% of the averaged amount of water used to flush toilets for
each ten-day. as shown in Fig. (12) and given in table 2.
Fig ( 12 ). Average toilet flush water and roof rain-water of researched building Table 2. Average toilet flush water and roof rain-water of researched building Ten-day Quantity of
Toilet Flush Water
(m
3)
Quantity of Rainwater From
Roof (m
3)
Ten-day Quantity of Toilet Flush
Water (m
3)
Quantity of Rainwater From Roof
(m
3)
1 195.0 12.2 19 196.7 53.4
2 193.7 18.0 20 198.0 50.6
3 192.4 21.1 21 199.3 53.4
4 191.1 26.2 22 200.7 55.2
5 191.8 38.9 23 204.4 69.3
6 192.5 52.7 24 208.2 92.2
7 193.1 29.6 25 212.0 60.0
8 189.8 41.8 26 210.0 76.7
9 186.5 38.6 27 208.0 78.0
10 183.1 38.7 28 206.1 33.1
11 184.7 39.7 29 205.8 27.1
12 186.2 42.1 30 205.6 33.6
13 187.7 45.9 31 205.4 13.1
14 188.3 58.7 32 203.0 14.6
15 189.0 54.1 33 200.7 17.3
16 189.7 71.5 34 198.3 6.8
17 192.0 69.3 35 197.5 19.8
18 194.4 58.2 36 196.8 16.1
4.2 Operation of the Model of APD
The main framework of linear programming includes establishment of objective function,
constraints and decision variables etc. Before setting up the model of APD, it is necessary to study
and discuss the hypothetical conditions of the model. Then the standard formulation of linear
programming can be implemented step by step. According to The Feitsui Reservoir’s Operation and
Utilization Rule, the water supply warning-line in Model (denoted as “WLOM”) should adopt the
ORC2 with a higher water level for safe use in the summer season. During the spring and winter, the
adoption of the ORC3 with lower water level is an attempt to adjust the water supply smoothly.
Therefore, the simulated water supply WLOM combines ORC2 and ORC3 of the Reservoir as shown in Fig. (13).
Fig ( 13 ). Illustration of the water supply warning-line in model (WLOM)
The time of the bottom of WLOM, which is from the 10th ten-day to the 29th ten-day, will be set as the period of drought (POD). Other periods, which are from the 1st ten-day to the 9th ten-day and the 30th ten-day to the 36th ten-day, will be defined as the period of non-drought (POND).
The formula for coefficient of supply water is as given in Fig. (14).The numerator of the formula is defined as the value of the t-th ten-day water level and subtracts the value of the t-th ten-day from the reservoir ORC.4 water level. The denominator is defined as the value of the t-th ten-day WLOM water level minus the value of the t-th ten-day reservoir ORC.4 water level.
Fig ( 14 ). Illustration of the supply coefficient of tap water
4.3 Formula of Water-Balance
It is the formula for water-balance of the building raft foundation in the t-th ten-day, namely, the
summation of supplied quantity of t-th ten-day tap water (pwt), the quantity of the t-th ten-day
rainwater (rwt ) being collected form the roof and the quantity of the preceding t-th ten-day stored
water (swt-1) in the raft foundation equal to that of the quantity demanded for the t-th ten-day toilet
water (twt), the quantity of the t-th ten-day overflowing water (owt) from raft foundation and the
residual quantity of the t-th ten-day stored water (swt) in raft foundation as shown in Fig. (15).
(3)
ow sw
tw rw pw sw
t−1 + t + t = t + t + t
Fig ( 15 ). Equation of water balance for raft foundation
For 36 ten-days in one year, it is required to expand the formulation of water balance one by one for 36 ten-days. It will come out an integrated water balance formula of the raft foundation for the whole year. Each time-dependant decision variable such as pwt . twt . swt . owt . rwt etc incorporating with the POD and POND, mentioned above, constitutes the most important frame of the L.P of the APD model. In the next step, the research will discuss the scope of each decision variable in POD and POND
The domain of tap water and toilet flush water is shown in Fig. (16).The water levels of the reservoir were above WLOM all the time during 1999, therefore the upper and lower bounds of the variable pwt are restricted only by the concept of APD. During 2002, there was a serious drought.
The water level of the reservoir went below the WLOM and it dropped down to the bottom of the reservoir. For these reasons the upper and lower bounds of the variable pwt are restricted by both of the purpose of APD and the water level of the reservoir. During 2003, the water level of the reservoir was sometimes above and sometimes below the WLOM, therefore, the upper bound of the variable pwt was restricted by both of them, and the lower bound of the variable pwt was only restricted by the APD model.
Basically, during POD the quantity of twt shall be less than the that of twt in POND, thus the
upper bound of the quantity of twt is set to be equal to the original quantity of twt during the whole
year and the lower bound of the quantity of twt is also set to be the original quantity of twt multiplied
by β, where the β is toilet-water-saving rate; during POND β= 0.9; during POD β= 0.8, as shown in
Fig. (16)。
Fig ( 16 ). Illustration of the domain of tap water and toilet flush water
4.4 LP Formula of APD Model
Depending on the discussions mentioned above, the standard formula of the APD model of linear programming could be set up as follows. The objective function and the constraints of the linear programming will be stated in the following.
,
) ,
(4)
0 ow
W.F.E.U sw
, sw C.O.R.F
tw 0.8 tw
tw
tw 0.9 tw
tw
pw
0.3 , pw (α min pw
) pw , pw (α min
pw pw
(α min pw
pw 1.3 pw
(α min
rw ow tw pw sw
sw
: constrain
sw pw
pw : Max
: function objective
t
1 t t
(o) t (d)
t (o) t
(o) t (n)
t (o) t
)) o ( t (o)
t )
d ( t (o)
t (o) t
(o) ) t (o) t )
n ( t (o)
t (o)
t
t t t 1 t
t t
) d ( t )
d ( t )
n ( t
=
− ≥
−
≥
×
≥
≥
×
≥
≥
×
×
≥
≥
×
×
≥
≥
×
×
= + +
−
−
+ ∑
∑ ∑
(5)
-
To obtain the optimal values of allocation between water in the reservoir and in the raft
foundation, the objective function shall be well defined. If the difference between the total of the tap
water supply from the reservoir during POND (∑pwt(n)) and that of the reservoir during POD
(∑pwt(d)) is the largest, it means that the effect of allocation is the best as shown in Fig. (17). At
this moment, because the difference is the maximum and the total quantity of the tap water supply of
the reservoir in POD is the minimum, it means the effect of drought prevention is the best.
Fig ( 17 ). Illustration of the objective function of APD model
Additionally, the quantity of max ∑swt(d) is to evaluate the maximum amount of reservation water stored in raft foundation each ten-day. Its physical meaning is that the amount of reservation water stored in the raft foundation is kept at the maximum at any time during POD in order to reach the goal of drought prevention.
4.5 Results and Discussions
The data of precipitation rwt, and the scope of tap water pwt and toilet use water twt during 1993, 1994, 1995, 1999, 2002, 2003 etc, are considered in the linear programming APD model.
Finally, the data of the reservoir water level, the collected rainfall from roof, optimal results of the tap water supply, the toilet use water and the storage water in the raft foundation etc., by linear programming calculations are presented in Fig. (18) and Fig. (19).
Fig ( 18 ). Optimization result of the APD model in 1993,1994,1995
Fig ( 19 ). Optimization result of the APD model in 1999,2002,2003
Especially, in 2002, the drought of the reservoir took place relatively early. So it resulted in an early start to drought resistance measures. Fortunately, a torrential typhoon rain made the water level of the reservoir go up rapidly and the raft foundation also was furnished with water immediately, and the drought resistance continued operating until the end of POD. The water level of the reservoir was always above WLOM even though there was a torrential rain during the POD in 1999.
Finally, the results of this research through mathematical calculation yield the average value of raft foundation storage swt obtained and plotted in Fig. (20). These plots show the operation trend during POD. The quantity of swt is filled completely starting from the 9th ten-day to the 12th ten-day continuously and it begins to operate. The quantity of swt decreases relatively slowly from the 12th ten-day to the 19th ten-day, It drops by a large amount after the 19th ten-day and it comes to the end of POD until the 29th ten-day. It begins to hold water continuously at the 29th ten-day.
Fig ( 20 ). Total average of result in each decision variable ( PW,TW,SW )
Table 3. The recommended quantity of PW allocation and the saving ratio of TW
Ten-day Quantity of
Piped Water Allocation (m
3)
Saving Ratio of Toilet Flush Water
(%)
1~9 239.51 99.8%
10~15 109.33 80.8%
16 109.33 85.9%
17~20 77.12 85.9%
21 77.12 88.6%
22 77.12 91.3%
23 77.12 93.9%
24 77.12 96.6%
25~29 77.12 100.0%
30~36 247.80 100.0%
5. Conclusions
The main purpose of this paper is to develop a practical operation model for water conservation, in particular, to propose a solution for an urban drought period. The proposed model involves LP methodology to operate an allocation procedure for prevention of urban drought. The conclusions are as follows:
1. According to an initial survey and statistical analysis, this research estimated a total idle capacity of existing building raft foundations in Taipei city is approximately 9 800 000 cubic meters. As we know, this capacity would be the 15th largest reservoir in Taiwan and it could also provide the household water satisfying 300 000 people living in the city. Accordingly, this capacity could offer a possibility to solve the problem of urban drought by allocating water resources between the city and the reservoir.
2. Based upon the operation of the APD model in this research, the result provides the recommended quantity of tap water allocation and efficient amount of toilet water to the object building during the period of urban drought. Verification by the historical data reveals that an urban drought prevention model with allocation to prevent-drought (APD) between the raft foundation of an existing building and the reservoir implemented by Linear Programming is sufficient to provide water for the building water utilization during a period of urban drought.
Meanwhile, the proposed model was proved to be practicable and good for urban drought prevention. The APD model can be used not only to allocate water resources to prevent drought. Due to the raft foundations of buildings being capable of holding rainwater, raft foundation can also ameliorate flooding due to downpours. Consequently, further relevant research on this subject should be conducted to advance water conservation.
References
[1]. A, Dixon.; D, Butler.; Fewkes. A.(1999) Water saving potential of domestic water reuse systems using greywater and rainwater in combination, Wat.Sci.Tech.Vol.39,NO.5,pp.25-32,1999.
[2]. Fewkes, A.(1988) The use of rainwater for WC flushing the field testing of a collection system, Building And Environment 34(1999) 765-772.
[3]. Fewkes, A.(2002) Modelling the performance of rainwater collection systems: towards a generalised
approach, Urban Water 1(1999) 323-333.
[4]. Villarreala, E. L.; Dixonb, A.(2004) Analysis of a rainwater collection system for domestic water supply in Ringdansen, Norrko¨ping, Sweden, Building And Environment 40(2005) 1174-1184.
[5]. Cheng, C. L.;(2000) Rainwater Use System in Building Design---A Case Study of Calculation and Efficiency Assessment System, CIB-W62 International Symposium, Rio de Janeiro, Brazil.
(NSC89-2211-E-011-034)
[6]. Cheng, C. L.; Hong, Y. T.(2004) Evaluating Water Utilization in Primary Schools, Building and Environment, UK. Vol 39 Iss 7, pp837-845 (2004)
[7]. Chilton,J.C.; Maidment, G.G.; Marriott, D.; Francis, A.; Tobias, G.(2000) Case study of a rainwater recovery system in a commercial building with a large roof, Urban Water 1 (1999) 345-354.
[8]. Herrmann, T.; Schmida, U.(2000) Rainwater utilisation in Germany: efficiency, dimensioning, hydraulic and environmental aspects, Urban Water 1 (1999) 307-316.
[9]. Vaes, G.; Berlamont, J.(2002) The effect of rainwater storage tanks on design storms, Urban Water 3 (2001) 303-307.
[10]. Zaizen, M.; Urakawa, T.; Matsumoto, Y.; Takai, H.(2000) The collection of rainwater from dome stadiums in Japan, Urban Water 1 (1999) 355-359.
[11]. Appan, A.(2000) A dual-mode system for harnessing roofwater for non-potable uses, Urban Water 1 (1999) 317-321.
[12]. Wung, T. C.; Lin, S. H.; Huang, S. M.(2005) Rainwater reuse supply and demand response in urban elementary school of different districts in Taipei. Resource Conservation & Recycling, 46(2006) 149-167.
[13]. Chang Y. T.; Chang L. C.; Chang F. J.(2005) Intelligent control for modeling of real time reservoir operation: Part II ANN with operating curves, Hydrological Processes.
[14]. Chang F. J.; Chen. L.; Chang. L. C.(2005) Optimizing the reservoir operation rule curves by genetic algorithms, Hydrological Processes.
[15]. Chang F. J.; Lai J. S.; Kao L. S.(2003) Optimization of operation rule curves and flushing schedule in a reservoir, Hydrological Processes.
[16]. Chang F. J.; Hui S. C.; Chen Y. C.(2002) Reservoir operation using grey fuzzy stochastic dynamic programming, Hydrological Processes.
[17]. Tung, C. P. (2001) The Impacts of Climate Change on Tsengwen Creek Water Resources in Taiwan, Journal of American Water Resources Association. 37(1): 1-10. SCI.
[18]. Tung, C. P.; Haith, D. A. (1998) Climate Change, Irrigation, And Crop Response, Journal of American Water Resources Association. 34(5): 1071-1085.
計畫成果自評:
本研究計畫之內容已經於計畫期限內執行完畢,研究成果也已經發表於
CIBW62 建築國際研討會,研究之部分成果並彙整投稿於 SCI 國際學術期刊,目前正受 理審查中。自評計畫執行順利圓滿,研究成果良好,對國內建築專業學術領域及建築實 務有具體之貢獻。