EMBA 高階經營碩士在職專班碩士論文
指導教授:賈凱傑 博士
Application of Analytic Hierarchy Process in Supplier Selection Process – A Case Study of
Company A’s Server Division
研究生:陳麒文 撰
中華民國 103 年 5 月
ABSTRACT
Supplier selection is one of the most critical activities of purchasing department in supply chain management. It is also a complex problem involving qualitative and quantitative factors in decision making process. In this research paper, an AHP-based supplier selection model is formulated and then applied to a real case study for a multinational information technology company. The use of the model indicates that it can be applied to improve and assist decision making in choosing the optimal suppliers. Additionally the AHP method provides decision makers the weightage for logical consistency. The work represents the systematic identification of the important criteria for supplier selection process. The results also exhibit the application of development of a multi-criteria decision model for evaluation and selection of suppliers with the AHP model, which by scoring the performance of
suppliers is able to select a vendor efficiently.
Keywords: Supplier Selection, Supply Chain Management, Analytic Hierarchy Process, AHP
2
TABLE OF CONTENTS
1. Research Background 5
2. Research Motivation 6
3. Research Objective 7
4. Research Subject/Target 8
5. Literature Review
a. Supplier Selection in Supply Chain 10
b. Supplier Selection Criteria 13
c. Supplier Selection Methods 22
d. Multiple Criteria Decision Making - AHP Method 24 6. Research Method
a. AHP Method 27
b. The Saaty Rating Scale 30
c. AHP Application for Supplier Selection: 32 Pairwise Comparison, Eigenvalue & Eigenvector,
Consistence, the Expert Choice Software 7. Overall Framework and Model Development
a. Problem Definition 39
b. Selection Criteria Formulation 40
c. Supplier Evaluation 41
d. AHP Method for Supplier Selection 42
8. Application Analysis
a. Case Study 47
b. Solution 47
c. Results and Discussion 49
9. Conclusion and Recommendation
a. Conclusion and Implication 53
b. Future Research Directions/Topics 54
10. References
TABLE CONTENTS
Table 5.1 Definition of Supply Chain Management 11 Table 5.2 Dickson’s 23 evaluation index on supplier selection 13 Table 5.3 Watts Supplier Evaluation Method 14 Table 5.4 Ellram’s Supplier Selection Indicators 15 Table 5.5 Choi and Hartley’s supplier selection indicators 15 Table 5.6 Choi and Hartley’s factor analysis of supplier selection indicators 16 Table 5.7 The Main Evaluation Index Survey 16 Table 5.8 Business indicators for supplier selection 17
Table 5.9 Supplier selection criteria 18
Table 5.10 Suppliers Selection Indicators 19
Table 5.11 Model in determining supplier selection 20 Table 5.12 Performance Parameters for decision making 21
Table 6.1 Saaty Scale 30
Table 6.2 The Reference Values of RI for Different Numbers of N 37 Table 7.1 Questionnaire respondent and job title 48
Table 7.2 Questionnaire results 50
Table 7.3 Supplier comparison 51
4
FIGURE CONTENTS
Figure 4.1 Research Process 8
Figure 6.1 Levels in AHP Hierarchy 28
Figure 6.2 AHP Hierarchy 29
Figure 6.3 Framework of the study 30
Figure 7.1 Hierarchy chart 46
RESEARCH BACKGROUND
When facing increasingly competition in global world markets, companies are under intense pressure to find ways to cut production and material costs to survive and sustain their competitive position. In today’s globalized environment, supplier selection has becoming one of the most important phase of the procurement processes.
Choosing the right supplier involves much more than scanning a series of price lists. The choice will depend on a wide range of factors such as value for money, quality, reliability and service. How to weigh up the importance of these different factors will be based on a business' priorities and strategies.
The objective is to find an overall optimal supplier, although not necessarily the supplier who offered the lowest price or the best technical service. Buyers must consider different criteria in order to distinguish between items offered by the suppliers. Not only a qualified supplier is a key element for buyers in supplier selection process, but evaluation of the potential suppliers has also become an important component for supply chain management.
6
RESEARCH MOTIVATION
In today’s highly competitive business environment, Supply Chain Management plays a critical role in the success of any given enterprise. Company operation is characterized by a number of risk components, factors, sources, and drivers (Borghesi & Gaudenzi, 2006). To stay competitive, a company must select and maintain core suppliers. “In most industries, the cost of raw materials and component parts constitutes the main cost of a product, such that in some cases it could account for up to 70% (Tahriri et al., 2008).” Therefore, supplier selection and evaluation has become one of the most significant roles of purchasing and supply management functions (Chen & Huang, 2006) Weber et al. (1991).
However, companies focus on reducing inventories within the supply chain in order to lower costs and reduced the risk of write-offs when the demand for products and services have been falling at an alarming rate. In addition, many companies are reducing the number of suppliers whom they do business with, so they can consolidate purchases power with the remaining suppliers to gain additional volume discounts and further reduce costs. Apart from the above strategic reasoning, one of the biggest risks a company’s supply chain trying to prevent is from its unhealthy suppliers.
In current environment, the numbers of supplier face the possibility of bankruptcies are on the rise due to the fact that the suppliers are booking lower revenues and credit to finance their working capital even harder to secure. In order to ensure that they are able to consistently evaluate and manage supplier risk, procurement executives need very clear visibility into their spend with each of suppliers at various levels of details, e.g. the money spent with each supplier, what commodities or components bought from which supplier, what is the split of a commodity or component purchase across its suppliers, what region shipped from, what is the trend line of various operational, financial and legal risk metrics for each supplier, who are their suppliers, how are the various suppliers linked at different tiers, how is the quality of products from each supplier, is the supplier providing good services, which component is critical to supply chain in order to prioritize which supplier needs to focus on, etc (Hingorani 2009). Spend analysis provides procurement executives clear visibility into answers to such questions. By analyzing data, procurement executives are able to create a list of suppliers that need to be closely monitored and make appropriate selection.
RESEARCH OBJECTIVE
For business to continuously grow in today’s turbulence and uncertainty, suppliers play an important role in achieving the objectives of any giving supply chain organization. Therefore, selecting the right suppliers could lead to significant cost reduction and improve overall supply chain efficiency. Supplier selection is a complicated process and needs evaluation of multiple criteria and various constraints associated with them. After analyzing of the results, supplier reliability, product quality and supplier experience are the top three supplier selection problems for information technology companies needs to be taken up on priority for effective supplier selection.
Understanding the factors that determine the appropriate suppliers is crucial. Proactive involvement in establishing the relationship, from selection choices, is essential to effective supply chain management and the success of any given projects. Hence, this research will target the original design manufacturer (ODM) and contract manufacturer (CM) at company A’s server division, whether to consolidate to a smaller group of suppliers, or which one to keep or terminate from current suppliers relationship.
The supplier selection problem has gained great attention in business management literatures.
The first objective of this study is to determine the required variables in selecting the best suppliers and to develop a supplier selection model based on these selected variables. The second objective is to explain how an integrated AHP model can be used in supplier selection decisions while minimizing suppliers’ defects rate, rate of late order delivery, purchasing costs, and maximizing suppliers’ scores and after-sales service levels. Most supplier selection models consider the buyer’s viewpoint and maximize only the buyer’s profit. This does not necessarily lead to an optimal situation for all the members of a supply chain.
This paper provides a brief review of the literature regarding AHP technique and its relevancy to its application in supplier selection process. The analytic hierarchy process (AHP) model developed by Saaty (1980) has been an important technique used widely with success in supplier selection and evaluation. It also supports managers in the areas of prioritizing the supply chain objectives, identifying risk indicators and assessing the potential impact of negative events and the cause-effects relationships along the supply chain (Borghesi &
Gaudenzi, 2006).
8
RESEARCH SUBJECT/TARGET
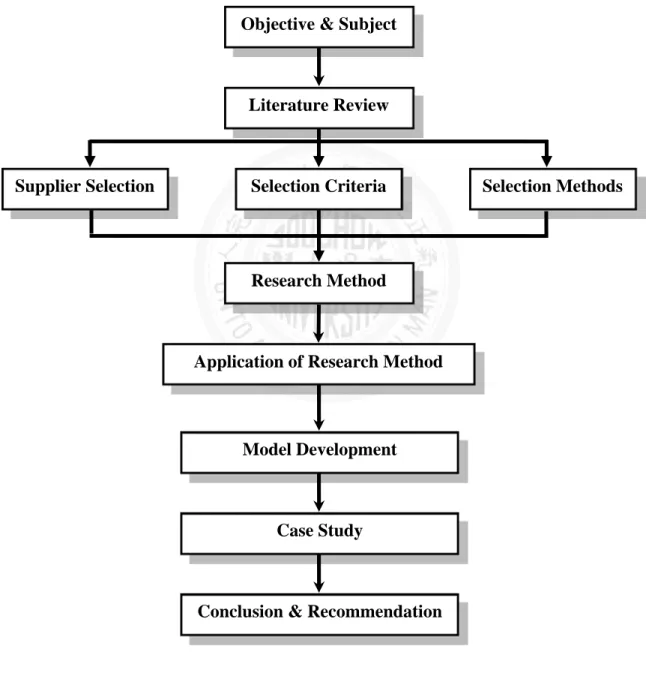
Choosing the right supplier is a complex decision due to its characteristics and the nature of the problems. AHP can not only help to analyze and evaluate the decision making, but is also to clarify the research and systematic lists of the assessment and evaluation elements under each dimension; the goals of the assessment elements and attributes are organized in a hierarchical manner. The below chart is the outline of research procedure and will be executive in target group.
Figure 4.1 Research Process
Literature Review
Supplier Selection Selection Criteria Selection Methods
Research Method
Application of Research Method Objective & Subject
Model Development
Case Study
Conclusion & Recommendation
This research information and the priority weights of elements will be obtained from decision- maker within the company for evaluation and proposal of suppliers, as well as to assess the relative importance of the various elements of the decision makers. Research methods used in this study will be based on AHP and questionnaire method.
The questionnaire method is to formulate and summarize the supplier selection based on the experts’ advices, and further confirmation as well as assessment in regards to what factors to be considered. The interviewee group will consist of ODM/CM Partner Manager, Engineering Manager and Procurement Manager, with at least ten years of working experience in their respective fields.
10
LITERATURE REVIEW
Competing in today’s global market has becoming more fierce than before, the introduction of products with shorter life cycles and the heightened expectations of customers have forced business enterprises to invest in, and focus attention on, their supply chains. With continuing advances in communications and transportation technologies, this has motivated the continuous evolution of the supply chain and the techniques to manage it effectively. In a typical supply chain, raw materials are procured and items are produced at one or more factories, shipped to warehouses for intermediate storage, and then shipped to retailers or customers.
Consequently, in order to reduce cost and improve service levels, effective supply chain strategies must take into account the interactions at the various levels in the supply chain. The supply chain, which is also referred to as the logistics network, consists of suppliers, manufacturing centers, warehouses, distribution centers, and retail outlets, as well as raw materials, work-in-process inventory and finished products that flow between the facilities.
Supply chain risk is recognized in today’s economy as a major threat to business continuity. A break in the supply chain can reduce a company’s revenue, decrease its market share, inflate costs, or threaten production and distribution. Supply Chain Management (SCM) is the oversight of materials, information, and finances as they move in a process from supplier to manufacturer to wholesaler to retailer to consumer. The SCM involves coordinating and integrating these flows both within and among companies.
A. Supplier Selection in Supply Chain
A supply chain or supply network is a coordinated system of organizations, people, activities and resources involved in moving a product or service in physical or virtual manner from suppliers to customers. This is a process of planning, implementing and controlling the operations of the supply as efficiently as possible.
The Supply Chain Management (SCM) considers all movement and storage of raw material and finished goods from point to point of consumption. The Supply Chain Consultant Michael Herman defined Supply Chain Management during his interview with Management magazine, said, “SCM directs and coordinates logistics activities across independent organizations that together make up a complete market channel for a range of product or service. For the supply
chain manager, the challenge is to effectively manage formal and contractual relationships across suppliers, providers and customers” (Bland 2003). The table 5.1 as below provides the definitions of Supply Chain Management by different scholars.
Table 5.1: Definition of Supply Chain Management
Scholars Year Content
Houlihan, J. 1984
Supply chain management is an important development in the field of logistics enterprises, early in its development, it is used in the industrial dynamics concepts and techniques to deal with issues related to the distribution and transportation operations and other entities.。
Steven, B. 1989
Supply chain management is transmitted through the feedback information flows and logistics, from material suppliers, production facilities, distribution services and customers linked together management philosophy.
Ellram, L.M. 1991
Supply chain management is handled from a supplier of materials to the final consumer integrated approach to planning and control of, and to the composition of the interests of all members of the pathway in mind, consistency among its members through co-management and planning, to meet the customer service channel under the standard, so that existing resources can be utilized to the fullest, in fact, make the process of material flow network structure often appears.
Christopher, M. 1992
Supply chain management range is a series by the supplier and finally to the end consumer in the process flow of goods through the manufacturing process and distribution channels.
Cooper, M.C. 1994
Supply chain management connotation in the supply of raw materials to the management of all goods and distribution channel members, but is not limited to a single enterprise. All members of the logistics pathway also regarded as an entity, and to other production, distribution and marketing activities operating decision-making levels.
Institute for Supply Management
Supply chain management as "the design and management of seamless, value added processes across organizational boundaries to meet the real needs of the end customer. The development and integration of people and technological resources are critical to successful supply chain integration.
Supply-Chain
Council 1995
Supply chain management is among the supplier’s suppliers to the customer’s customers, everything related to the production and finished the job with rationing. Includes plan to find suppliers, manufacturing and delivery.
The Council of Logistics Management
1986
To suit the customer’s requirements and to plan for the purpose of raw materials, work in progress, finished goods and their associated information, from the industrial sites to circulate and keep spending between locations, for the sake of efficiency and
12
the relative effectiveness of the biggest costs, execution, control, was also known as supply chain logistics.
Michael Porter 1985
The value chain describes the activities within and around the company that create the final product or service. The cost and value of these activities, will determine whether or not best value products or services are being made that will satisfy the customer.
The value chain is grouped into two main groups of activities:
primary activities and support activities. Primary activities are directly concerned with the production or delivery of certain products or services. Support activities help to support the efficiency and effectiveness of primary activities.
Primary Activities
A. Inbound logistics
B. Operations
C. Outbound logistics
D. Marketing and sales
E. Service Support activities
Procurement
Technology development
Human resource management
Firm infrastructure
Lambert et al. 1998
Supply chain management refers to the upstream supplier to the end consumer of this process, information delivery will occur, and the products or services provided from future integration method, finally providing value to customers through the supply chain management to or other stakeholders.
Scannell et al. 2000
The basic form of supply chain management is the management of raw materials from suppliers between customers forward to the final material flow, service flow and reverse flow of information.
Source: Hung, Hsiao-Chen (2007) arrangement
Based on the above scholar’s perspective, SCM combined the customers, the enterprises, the suppliers and integrated into one single concept. It is the active management of supply chain activities to maximize customer value and achieve a sustainable competitive advantage. It also represents a conscious effort by the supply chain firms to develop and run supply chains in the
most effective & efficient ways possible. The concept of partnership has been the main topic of SCM.
The organizations that make up the supply chain are linked together through physical flows and information flows. Physical flows involve the transformation, movement, and storage of goods and materials. They are the most visible piece of the supply chain. But just as important as the information flows, information flows allow the various supply chain partners to coordinate their long-term plans, and to control the day-to-day flow of goods and material up and down the supply chain.
B. Supplier Selection Criteria
In today’s competitive market, enterprises have moved away from the traditional roles of using strictly local or regional suppliers and in turn given their orders to suppliers that have the ability to meet global demand. This also means that many companies will face more complex decision than ever while selecting the right suppliers. Based on such factors, supplier evaluation index design also become more diversify. In a study that is related to supplier selection indicators, it has mentioned how to design an indicator that has the ability to analyze the selection process.
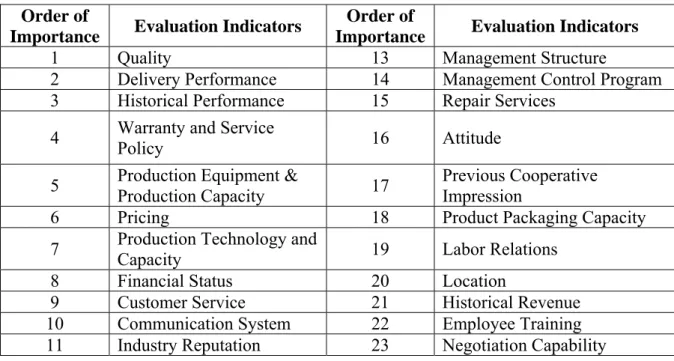
Dickson (1966) proposed twenty-three indicators to assess supplier selection per the table below.
Table 5.2: Dickson’s 23 evaluation index on supplier selection
Order of
Importance Evaluation Indicators Order of
Importance Evaluation Indicators
1 Quality 13 Management Structure
2 Delivery Performance 14 Management Control Program 3 Historical Performance 15 Repair Services
4 Warranty and Service
Policy 16 Attitude
5 Production Equipment &
Production Capacity 17 Previous Cooperative Impression
6 Pricing 18 Product Packaging Capacity
7 Production Technology and
Capacity 19 Labor Relations
8 Financial Status 20 Location
9 Customer Service 21 Historical Revenue
10 Communication System 22 Employee Training
11 Industry Reputation 23 Negotiation Capability
14
12 Relationship with Industry Source: Dickson, G. W. (1996).
Weber et al. (1991) used Dickson’s 23 supplier selection as the bases for his analysis; he then came up with 74 analyses relevant to the supplier selection. Weber found timely production has become an increasingly popular trend in the manufacturing strategy, he summarized 13 relevant studies discussed JIT supply selection, special attention had been pay toward quality and delivery, while the importance of geographical location has increased dramatically as well.
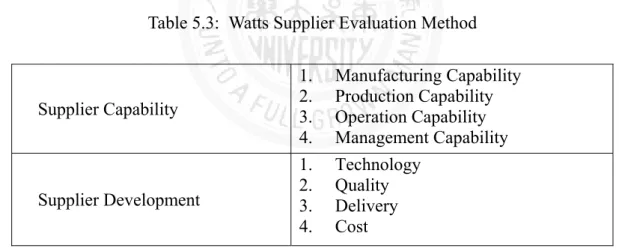
Watts et al. (1992) think the buyers of manufacturers with the vendors or suppliers should establish a good relationship, according to the survey, the cost of raw materials in manufacturing accounted for the proportion of the total cost of about 55%, and direct labor costs are only 15% of the total cost. In assessing the supplier companies, from both the supplier capability and development of suppliers to measure, evaluation indicators of process capability, product capabilities, operational capacity, management capacity, technology, qualify delivery, and cost. The following Table 5.3 shows Watts supplier evaluation method.
Table 5.3: Watts Supplier Evaluation Method
Supplier Capability
1. Manufacturing Capability 2. Production Capability 3. Operation Capability 4. Management Capability
Supplier Development
1. Technology 2. Quality 3. Delivery 4. Cost Source: Watts et al. (1992).
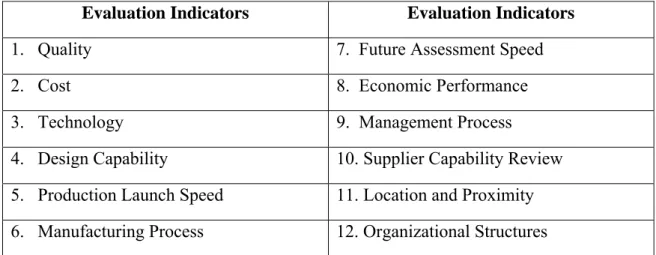
Ellram (1990) through her case studies had developed a supplier selection criteria partnership, namely from the financial, the organizational cultural, technology and other related topics.
Table 5.4: Ellram’s Supplier Selection Indicators
Evaluation Indicators Evaluation Indicators
1. Quality 7. Future Assessment Speed
2. Cost 8. Economic Performance
3. Technology 9. Management Process
4. Design Capability 10. Supplier Capability Review 5. Production Launch Speed 11. Location and Proximity 6. Manufacturing Process 12. Organizational Structures
Source: Ellram, L. M. (1990).
Ellram wrote that supplier selection and supplier evaluation are closely related activities. The first aims to select a supplier for the right reasons, the latter to maintain a relationship as partners in business over time and to help the supplier identify opportunities for improvement.
Moreover, Choi (1996) conducted research based on the US. Auto industry supplier’s selection and analyze the different criteria at different levels of the supply chain. Choi used Dickson (1966) and Weber (1991) research and other not consider previously, as shown in Table 5.5, which summarized 26 assessment criteria when selecting suppliers.
Table 5.5: Choi and Hartley’s supplier selection indicators
1 Ability to quickly change the capacity 14 Probably for longer term relationship 2 Ability to construct new product in
short period of time
15 Provide lowest possible cost
3 Service 16 Supplier performance ward
4 Ability to continue to improve 17 Product appearance
5 Historical relationship 18 Product reliability
6 Open communication 19 Supplier profitability 7 Reputation in term of integration and
reputation
20 Rapid response to demand 8 Constant specification 21 Quality policy
9 Consistency of delivery 22 Shorter delivery time
16
10 Ability to reduce costs 23 Supplier’s ability 11 Design capability 24 Technical capacity
12 Financial position 25 Willingness to resolve conflicts
13 Location 26 Willingness to show financial records
Source: Choi, T.Y. and J.L. Hartley (1996).
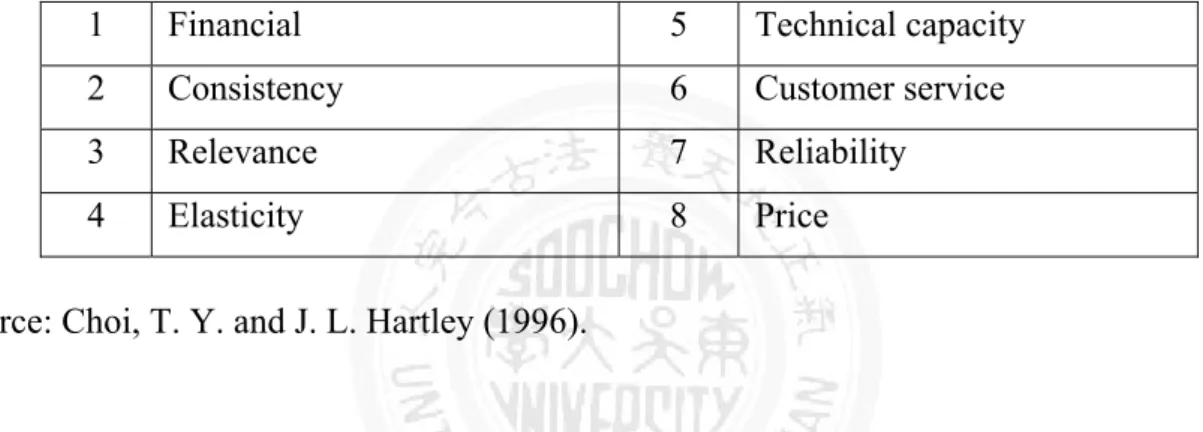
Through analyzing the factor analysis, Choi grouped these 26 variables into eight main factors.
Table 5.6: Choi and Hartley’s factor analysis of supplier selection indicators
1 Financial 5 Technical capacity
2 Consistency 6 Customer service
3 Relevance 7 Reliability
4 Elasticity 8 Price
Source: Choi, T. Y. and J. L. Hartley (1996).
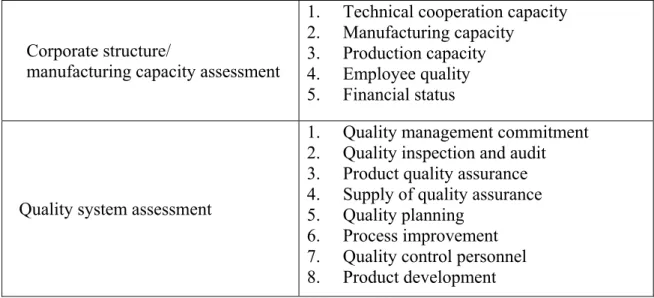
Barbarosoglu and Yazgac (1997) used automobile manufacturers industry as an example, developed a new supplier selection indicators and found out that price is the least important factor. In response to the global competitive market, companies must bridge the gap with suppliers and focus on the value of the supply chain. The corporate supplier selection factors are: performance evaluation, corporate structure/manufacturing assessment, quality system evaluation.
Table 5.7: The Main Evaluation Index Survey
Supplier Selection Factors Main Evaluation Criteria Performance evaluation
1. Quality 2. Delivery 3. Cost analysis
Corporate structure/
manufacturing capacity assessment
1. Technical cooperation capacity 2. Manufacturing capacity
3. Production capacity 4. Employee quality 5. Financial status
Quality system assessment
1. Quality management commitment 2. Quality inspection and audit 3. Product quality assurance 4. Supply of quality assurance 5. Quality planning
6. Process improvement 7. Quality control personnel 8. Product development Source: Barbarosoglu, G. & T. Yazgac (1997).
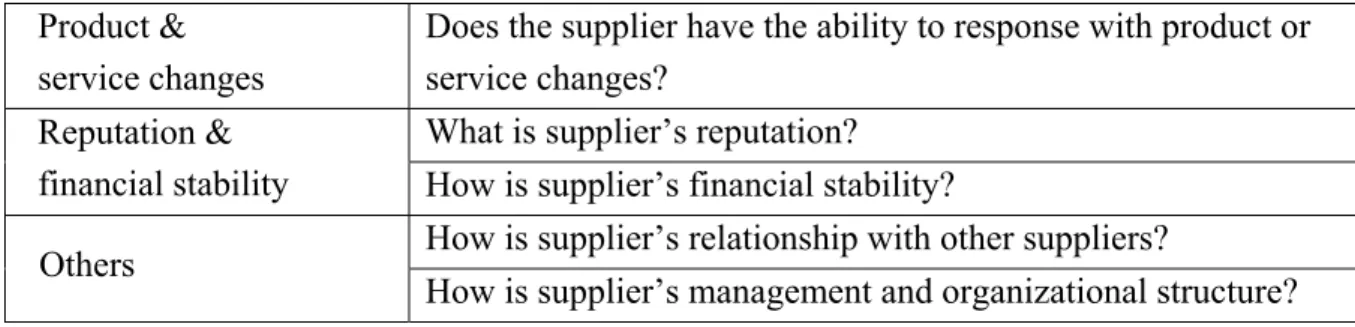
Stevenson (1999) in Production/Operations Management book had divided the supplier selection indicators into eight factors, including: production time and delivery standards, quality and quality assurance, flexibility, location, price, product and service changes, reputation and financial stability and others.
Table 5.8: Business indicators for supplier selection
Evaluation Indicators Content Description
Production time &
delivery standards
How much time does the supplier need for production?
Will the supplier be able to ensure timely delivery for the goods?
Does supplier have program to make sure delivery on time?
Quality &
quality assurance
Does the supplier have procedures to ensure quality control and quality assurance?
Does the supplier have corrective measure for quality assurance?
Does the supplier have incoming material procedures in place?
Elasticity Is the supplier flexible in dealing with quality and delivery changes?
Location Is the supplier location beneficial for our business?
Price
Is supplier’s price reasonable?
Is supplier willing to negotiate price?
Is supplier willing to work together to lower cost?
18
Product &
service changes
Does the supplier have the ability to response with product or service changes?
Reputation &
financial stability
What is supplier’s reputation?
How is supplier’s financial stability?
Others How is supplier’s relationship with other suppliers?
How is supplier’s management and organizational structure?
Source: Stevenson, W. J. (1999).
Dowlatshahi (2000) has indicated that the interaction between enterprise and supplier has been transformed from an antagonistic opposition relationship into a cooperative relationship. It can be summarized into four vendor evaluation factors: (1) A full-service supplier quality evaluation factor; (2) comply with and immediately response to consumer needs assessment factor; (3) supplier delivery performance evaluation factor; (4) the relationship between the price evaluation factors, and proposed 14 supplier selection criteria.
Table 5.9: Supplier selection criteria
Supplier selection criteria Supplier selection criteria
1. Long-term strategic alliance 8. Supplier training and conference 2. Supplier’s R&D investment &
financial strategies
9. Purchase and acceptance policy 3. Relationship of trust 10. Support for high-level managers
4. Reducing the number of suppliers 11. Establish procurement function interfaces with other organizations
5. Information sharing… 12. Fair competition in professional procurement activities
6. Inspect supplier plant 13. Procurement activities need to value- oriented corporate strategy
7. Supplier selection & determination 14. Effective supplier relationship management
Source: Dowlatshahi, S. (2000)
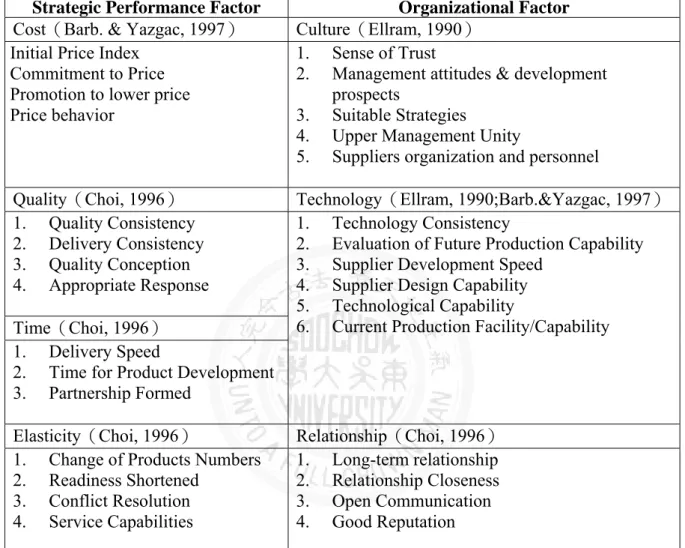
Sarkis and Talluri (2002) divided the supplier selection indicators into two categories:
organizational factors and strategic performance factors. In the long term, supplier selection should be carried out depending on the product type and end-user usage characteristics, to the overall performance, resource allocation and decision-making environment to determine the suitable suppliers. Sarkis and Talluri attempted to establish a model of the consolidation of the
supplier indicators, and to help manufacturers select its present and long-term suppliers in comprehensive and modular approach.
Table 5.10: Suppliers Selection Indicators
Strategic Performance Factor Organizational Factor Cost(Barb. & Yazgac, 1997) Culture(Ellram, 1990)
Initial Price Index Commitment to Price Promotion to lower price Price behavior
1. Sense of Trust
2. Management attitudes & development prospects
3. Suitable Strategies
4. Upper Management Unity
5. Suppliers organization and personnel
Quality(Choi, 1996) Technology(Ellram, 1990;Barb.&Yazgac, 1997)
1. Quality Consistency 2. Delivery Consistency 3. Quality Conception 4. Appropriate Response
1. Technology Consistency
2. Evaluation of Future Production Capability 3. Supplier Development Speed
4. Supplier Design Capability 5. Technological Capability
6. Current Production Facility/Capability Time(Choi, 1996)
1. Delivery Speed
2. Time for Product Development 3. Partnership Formed
Elasticity(Choi, 1996) Relationship(Choi, 1996)
1. Change of Products Numbers 2. Readiness Shortened
3. Conflict Resolution 4. Service Capabilities
1. Long-term relationship 2. Relationship Closeness 3. Open Communication 4. Good Reputation
Source: Sarkis, J. and S. Talluri (2002).
For supplier selection process and evaluation, manufacturing firms have primarily considered criteria such as: quality, service, cost, flexibility, reputation, and financial stability (e.g. Sarkis
& Talluri, 2002; Verma & Pullman, 1998; Hirakubo & Kublin, 1998). However, other authors such as Kirytopolos et al (2008), the research considered quality, cost, service, risk, and supplier profile to evaluate each of the four suppliers in addition to the integration of regulatory compliance and green purchasing.
20
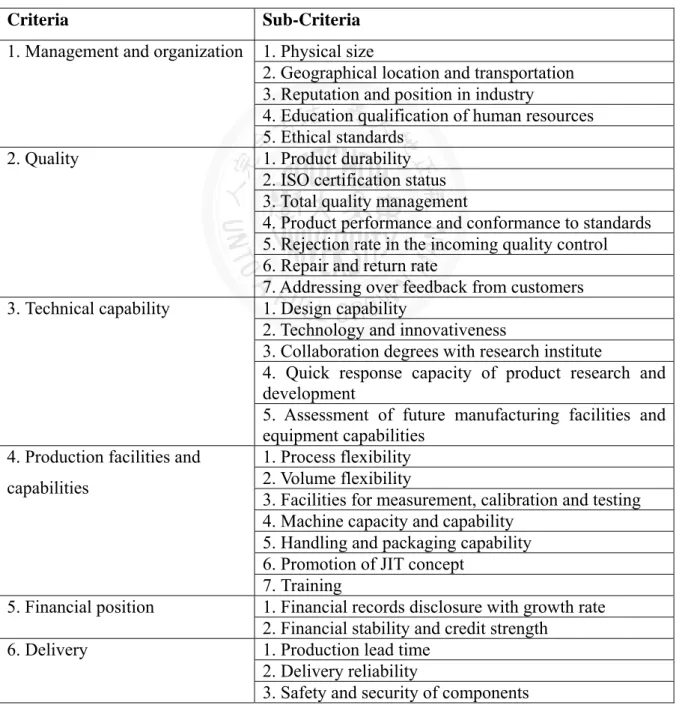
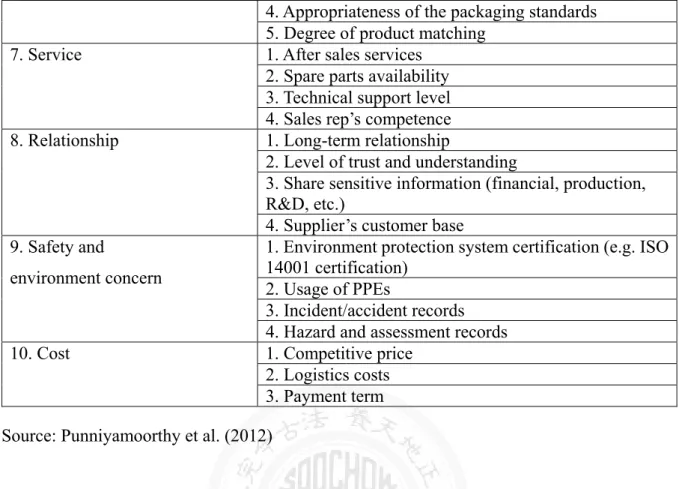
Punniyamoorthy et al. (2012) developed a model for determining supplier selection, which included multidimensional tangible and intangible attributes. The model proposed that management and organization, quality, technical capability, production facilities and capacities, financial position, delivery, service, relationship, safety and environment concern and cost have an influencing power on the supplier selection. Based on the output from this model, the cluster analysis has been able to carry out the strengths and weakness of each supplier with influencing factors. “Based on these findings, the supplier can improve on factors where they lag and can maintain the factors where they excel” (Punniyamoorthy 2012).
Table 5.11: Model in determining supplier selection Criteria Sub-Criteria 1. Management and organization 1. Physical size
2. Geographical location and transportation 3. Reputation and position in industry
4. Education qualification of human resources 5. Ethical standards
2. Quality 1. Product durability
2. ISO certification status 3. Total quality management
4. Product performance and conformance to standards 5. Rejection rate in the incoming quality control 6. Repair and return rate
7. Addressing over feedback from customers 3. Technical capability 1. Design capability
2. Technology and innovativeness
3. Collaboration degrees with research institute
4. Quick response capacity of product research and development
5. Assessment of future manufacturing facilities and equipment capabilities
4. Production facilities and capabilities
1. Process flexibility 2. Volume flexibility
3. Facilities for measurement, calibration and testing 4. Machine capacity and capability
5. Handling and packaging capability 6. Promotion of JIT concept
7. Training
5. Financial position 1. Financial records disclosure with growth rate 2. Financial stability and credit strength
6. Delivery 1. Production lead time 2. Delivery reliability
3. Safety and security of components
4. Appropriateness of the packaging standards 5. Degree of product matching
7. Service 1. After sales services 2. Spare parts availability 3. Technical support level 4. Sales rep’s competence 8. Relationship 1. Long-term relationship
2. Level of trust and understanding
3. Share sensitive information (financial, production, R&D, etc.)
4. Supplier’s customer base 9. Safety and
environment concern
1. Environment protection system certification (e.g. ISO 14001 certification)
2. Usage of PPEs
3. Incident/accident records 4. Hazard and assessment records
10. Cost 1. Competitive price
2. Logistics costs 3. Payment term Source: Punniyamoorthy et al. (2012)
Yuzgec (2013) stated that recent changes in manufacturing systems, such as producing in smaller lot sizes with varieties, and increased global competition, had forced enterprises to disintegrate their units. The vertical disintegration comprise of several companies producing different components of products. The vertical disintegration helps companies to become leaner, share risks among the companies and be able to produce more varieties. However, there exists a main problem, which is to determine reliable suppliers that they can collaborate for a long period of time. In his paper, Yuzgec used analytical hierarchy process and fuzzy logic to create a decision making model assisting to choose the right suppliers. Yuzgec used the delivery performance, financial stability, service support and quality, and many other performance parameters considered as decision variables. As a result, a suitable supplier is determined and sensitivity analysis is conducted.
Table 5.12: Performance Parameters for decision making Cost Logistic
Performance
Quality Culture Risk
*Net purchase
cost (price) *On-time
delivery *Defect rate *Labor relations
record *Size
*Transportation
cost *Lead time *Repair Services *Partnership and
integrability *Distance
22
*Delivery performance
*Warranties and
claim policies
*Cultural match *Net-worth
*Training aids *Adjustable
capacity Source: Yuzgec (2013)
Gholipour et al (2014) discussed that contractor selection is one of the most important problems in supply chain and its strongly effect on a firm`s performance. He used the approach of AHP to select the best construction contractor for Tehran University technical office. The main criteria had been chosen in respect to construction context and experience of the experts in the respective fields. Each chosen factor affecting the performance of the contractor had been analyzed and discussed. In his finding, Gholipour mentioned that on managerial criterion there is a wide attention to the financial criterion and even in some cases it is the only selection factor, it does not have a significant effect on supporting the goals of selection. The author suggested that this could be main because this is related to university funding project.
According to the above literature review, supplier selection evaluation factors no longer just focus on price and cost, but other factors such as selection flexibility, customer service or technical capability has gradually been valued by enterprises. In addition, the development of the internet and information systems enable enterprises, suppliers and customers to work closely through information links. Therefore, it is suggested that the ability of information link should be considered into supplier selection indicators.
C. Supplier Selection Methods
Carr and Smeltzer (1999) noted that “the purpose of strategic purchasing and supply management is to direct all purchasing activities toward opportunities consistent with the firm’s capabilities to achieve its long-term goals.” Indeed, purchasing and supply management can play a prominent role in a firm’s strategic planning, supply chain management, and profitability.
Supplier selection is one of the key decisions to be made in the strategic planning of supply chains that has far-reaching implications in the subsequent stages of planning and implementation of the supply chain strategies. In traditional/forward supply chain, the problem of supplier selection is not new. First publications on supplier selection in traditional forward supply chains back to the early 1960s (Wang, G., Huang, S. H. and Dismukes, 2004), in supply chain literature, the supplier selection problem was treated as an optimization problem that
required formulating a single objective function. However, not all supplier selection criteria can be quantified, because of which, only a few quantitative criteria are included in the problem formulation.
Mohanty and Deshmukh (1993) considered supplier evaluation was an unstructured policy decision. The reasons are addressed below:
1. The nature and structure of the supply management process is complex.
2. The lack of complete information is higher in an uncertain business environment.
3. There is broader for decision makers due to the increasing competition in the market.
4. The supply process does not contain quantitative data.
5. Internal organizational behavior is dynamic, evaluation and decision making at the time will be generated uncertainty.
6. Assessment factors may be conflicted or complemented. These factors are toward qualitative considerations and difficult to be described, evaluated and controlled.
Ghodsypour and O’Brien (1988) noted that supplier selection models could be broken down into single source and multiple source models. In single source models, one supplier is able to respond to a buyer’s demand. In multiple source models, the allocation problem is considered to be the same as the selection problem. Ranking techniques are usually applied to single source models, but in multiple source models mathematical programming models are developed (Degraeve and Roodhooft, 1999). Further developed a multi-period, multi-item, multi-vendor mixed-integer programming model based on the TCO, to determine an optimal ordering and inventory policy and jointly to decide on the best combination of suppliers their model covers the total cost. Incurred, including the purchasing cost, the ordering cost, the transportation costs and so forth. Ghodsypour and O’Brien (1988) developed a decision support system that combined the analytical hierarchy process with linear programming. They first presented a single objective mixed integer nonlinear programming model to minimize total cost. In that model, they considered quality as a constraint, and then developed a multi- objective model with one of its objectives to maximize the orders quality.
Hong et al. (2005) developed a mixed integer programming model to select right suppliers and maximized revenue while satisfying the customer needs. They considered changes in suppliers’
capabilities and customer requirements over the horizon of the problem. In their model, the suppliers which satisfied many parts of the ideal procurement condition were selected more
24
often than other suppliers.
Basnet and Leung (2005) developed a model to combine lot-sizing with supplier selection problem. They considered a multi-period inventory lot-sizing scenario where multiple products could be sourced from a set of selected suppliers in each cycle. The objective function consisted of purchasing price, inventory holding cost and transaction cost for minimization and an enumerative search algorithm was proposed to solve the problem.
Kirytopolos et al (2008) utilized analytic network process approach for the selection and evaluation of suppliers. The supplier selection criteria considered in their study included cost, service, supplier’s profile, quality, risk, and other. This paper contributes to the existing stream of research by integrating regulatory compliance into supplier's selection process in a production industrial firm supply chain. Supplier selection literature is endowed with various kinds of methodology, including multi-criteria decision-making techniques or decision support systems such as AHP, conceptual papers, empirical research, and simulation
techniques, among many others (Shahroodi 2012). Stream of research that have applied AHP methodology in supplier selection include (Barbarosoglu and Yazgac 1997; Bhutta and Huq 2002; Chan 2003; Onesime et.al. 2004.
D. Multiple Criteria Decision Making - AHP Method
Analytic Hierarchy Process (AHP) has been a popular approach for supplier selection and has been applied by a number of researchers and practitioners (Barbarosoglu and Yazgac 1997;
Nydick and Hill 1992). It is a robust technique that allows managers to determine preferences of criteria for selection purpose, quantify those preferences and then aggregate them across diverse criteria. It is a relatively easy approach to understand and apply. Even so, it has certain difficulties that arise when developing an appropriate framework that is acceptable and useful for management.
When making decisions, several criteria are often involved. These criteria include tangibles, which can be measured by costs and profits, as well as intangibles, such as safety and customer service, which cannot be directly measured by costs and profits. Even though there may be readily definable objectives for making the decision, the attributes or criteria of the decision are not always clearly defined. Therefore, the goal of the analyst involved in multi-attribute decision-making should be to use reasonable methods to evaluate both the objectives and the
criteria involved in concluding that a particular course of action is likely to attain those objectives.
At first, AHP only considers one-way hierarchical relationships among factors. This simplistic assumption does not consider many possible relationships among the groups of factors or those within them. For example, for selection of a project, a decision maker may categorize factors into cost, quality, and flexibility. A project may be rated on each of these factors separately and aggregated to arrive at an overall score, which is essentially what AHP does. Beside, AHP does not explicitly consider the interactions among various factors; cost and quality may impact flexibility.
The main advantage of AHP is that it illustrates how possible changes in priority at upper levels and have an effect on the priority of criteria at lower levels. The method is able to rank criteria according to the needs of the buyer which also leads to more precise decisions concerning supplier selection. In other words, it provides the buyer with an overview of criteria, the functions at the lower levels and goals as at the higher levels.
Another advantage of AHP is its stability and flexibility regarding changes within and in addition to the hierarchy. The buyer is able to get a good picture of the supplier’s performance by using the hierarchy of the criteria and evaluating the suppliers (Omkarprasad and Sushil, 2006). Additionally, AHP is uniquely positioned to help model situations of uncertainty and risk since it is capable of deriving scales where measures ordinarily do not exist (Millet &
Wedley 2002). The method also has the distinct advantage that it decomposes a decision problem into its constituent parts and builds hierarchies of criteria (Macharis et al. 2004).
Despite the popularity of the AHP, the complexity of this method which makes it implementation quite inconvenient. Moreover, if more than one person is working on this method, different opinions about the weight of each criterion can complicate matters. AHP also requires data based on experience, knowledge and judgment which are subjective for each decision-maker. A further disadvantage of this method is that it does not consider risks and uncertainties regarding the supplier’s performances (Yusuff et al., 2001).
The AHP can be considered as a complete aggregation method of the additive type. The problem with such aggregation is that compensation between good scores on some criteria and bad scores on other criteria can occur. Detailed, and often important, information can be lost
26
by such aggregation.
AHP makes the selection process very transparent. It also reveals the relative merits of alternative solutions for a Multi Criteria Decision Making (MCDM) problem (Drake, P.R., 1998). AHP approach is a subjective methodology (Cheng and Li, 2001); information and the priority weights of elements may be obtained from a decision-maker of the company using direct questioning or a questionnaire method. It is generally agreed in the literature that the following makes the supplier selection decision process difficult and/or complicated (Muralidharan et.al. 2001). Supplier selection process represents a complex problem and thus a multi-attribute decision making (MADM) problem involved qualitative data.
In short, the AHP model is an important technique that has been used successfully in supplier selection and evaluation. The strength of this method lies in its ability to structure complex, multi-person, multi-attribute, and multi-period problems hierarchically and it is simple to use and to understand. It necessitates the construction of a hierarchy of attributes, sub-attributes, alternatives and so on, which facilitates communication of the problem and the recommended solutions. Moreover, the AHP method provides a unique means of quantifying judgmental consistency.
RESEARCH METHOD
The Analytic Hierarchy Process (AHP), introduced by Saaty (1977), is a theory of measurement that provides the ability to incorporate both qualitative and quantitative factors in the decision making process. Showing on a hierarchical structure of the AHP provides to examine the interactions of goals, criteria, sub-criteria and alternatives on the entire system.
For this purpose, absolute and relative measurement approaches are used in the application of AHP. Absolute comparisons are generally used when desired to rank independent alternatives according to standards developed by the experience of experts Saaty, 1990). However, relative comparisons require priorities to be established with respect to hierarchical goals by making sets of pairwise comparisons in a systematic manner (Gass, 1986).
A. AHP Method
The foundation of the Analytic Hierarchy Process (AHP) is a set of axioms that carefully delimits the scope of the problem environment (Saaty 1986). It is based on the well- defined mathematical structure of consistent matrices and the associated eigenvector’s ability to generate true or approximate weights (Saaty 1980, 1994). The AHP is a highly flexible decision method that can be applied in a wide variety of situations. This method allows decision makers to structure complex problems in the form of hierarchical manner or a set of integrated levels (Nydick and Hill, 1992).
The AHP method was developed by T. Saaty in the 1970s and is widely used in a variety of areas, including transportation planning and corporate planning. The AHP is a method that structures a complex, multiperson, multiattribute, and multiperiod problem hierarchically (Canada, Sullivan, and White, 1996). The AHP method decomposes a problem and performs pair-wise comparison of all the elements. Saaty (1980, 1990, and 2000) recommended the following steps for applying AHP method in decision making.
Clearly define the decision problem and determine its goal.
Structure the hierarchy from top through the intermediate levels to the lowest level.
The first stage of the AHP is to break down the decision problem into a hierarchy of decision elements. The objective is the top level, followed by the attributes considered important, is to select the best overall supplier. Further dividing the attributes into sub-attributes creates the
28
remaining levels; the criteria that must be satisfied to fulfill the overall goal. The lowest level of the hierarchy comprised of the decision alternatives. Numerical priorities are derived for each of the decision alternatives. It is then a simple matter to pick the best alternative, or to rank them in order of relative preference.
AHP Hierarchy
Level I:
Focus
Level II:
Attributes
Level III:
Sub-attributes
Level k:
Alternatives
Figure 6.1 Levels in AHP Hierarchy Source: Maurino and Luxhoj (2002)
After the hierarchy is established, weights must be assigned to each set of elements at the various levels. Pairwise comparisons of the attributes are made using various types of scales, indicating strength. The evaluations determine which element dominates the others with respect to the higher-level elements and all results are weighted and placed in a matrix.
However, performance data can also be used to prioritize the alternatives with respect to attributes. The main advantage of this approach is its objectivity. Since the performance measure method assumes that a linear relationship exists between a performance value and its relative weight, the pairwise comparison method should be used when this linear relationship cannot be assumed for a given attribute. When using the pairwise comparison method, the relative nine-point scale is appropriate.
Figure 6.2 AHP Hierarchy Source: Percin Selcuk (2006)
In addition to hierarchical structure of levels, the AHP methodology compares criteria, or alternatives with respect to a criterion, in a natural, pairwise mode. To do so, the AHP uses a fundamental scale of absolute numbers that has been proven in practice and validated by physical and decision problem experiments it converts individual preferences into ratio. Scale weights that can be combined into a linear additive weight for each alternative. The resultant can be used to compare and rank the alternatives and, hence, assist the decision maker in making a choice. It is a powerful operational research methodology useful in structuring complex multi-criterion problems or decisions in many fields such as logistics and supply chain management, marketing engineering, education, and economics.
Problem of supplier selection has been dealt with by using questionnaire based study. A structured questionnaire was framed and all the criteria are rated by the professional of various fields. The framework adopted for this study is as shown in the following figure.
30
Figure 6.3 Framework of the study Source: Shahroodi (2012)
B. The Saaty Rating Scale
The mathematics of the AHP and the calculation techniques are to construct a matrix expressing the relative values of a set of attributes. For example, what is the relative importance to the management of this firm of the cost of equipment as opposed to its ease of operation? They are asked to choose whether cost is very much more important, rather more important, important, and so on down to very much less important, than operability. Each of these judgments is assigned a number on a scale. One common scale adapted from Saaty is listed as below.
Table 6.1: Saaty Scale Intensity of
Importance
Definition Explanation 1 Equal importance Two factors contribute equally to the
objective.
3 Somewhat more important Experience and judgment slightly favor one over the other.
5 Much more important Experience and judgment strongly favor one over the other.
7 Very much more important
Experience and judgment very strongly favor one over the other. Its importance is demonstrated in practice.
9 Absolutely more important The evidence favoring one over the other is of the highest possible validity.
2, 4, 6, 8 Intermediate values When compromise is needed Source: Selcuk (2006)
Selection of criteria from literature &
experts
Rating of criteria by
using questionaire
filed by experts from
industry &
academia
Development of Hierarchy
Synthesis of priorities
Measurement of consistency
Final decision making i.e.
selection of vendor
A basic, but very reasonable, assumption is that if attribute A is absolutely more important than attribute B and is rated at 9, then B must be absolutely less important than A and is valued at 1/9. These pairwise comparisons are carried out for all factors to be considered, usually not more than 7, and the matrix is completed. The matrix is of a very particular form which neatly supports the calculations which then ensue.
The next step is the calculation of a list of the relative weights, importance, or value, of the factors, such as cost and operability, which are relevant to the problem in question (technically, this list is called an eigenvector). If perhaps, cost is very much more important than operability, then, on a simple interpretation, the cheap equipment is called for though, as we shall see, matters are not so straightforward. The final stage is to calculate a Consistency Ratio (CR) to measure how consistent the judgments have been relative to large samples of purely random judgments. If the CR is much in excess of 0.1 the judgments are untrustworthy because they are too close for comfort to randomness and the exercise is valueless or must be repeated. It is easy to make a minimum number of judgments after which the rest can be calculated to enforce a perhaps unrealistically perfect consistency.
The AHP procedure begins with the development of a hierarchical structure of a supplier selection problem. Once the hierarchy has been constructed, the decision makers evaluate the elements by making pairwise comparisons. In AHP, pairwise comparison matrices, based on comparing the relative importance or preferences of two elements with respect to element in the level above, are generated by verbal judgments such as high, medium and low or by stating a single number taken from the 1-9 comparison scale. In this study, the values in each pairwise comparison matrix are defined 1 to 9 numbers and they represent decision-team’s judgments of a factor at one level on the factor at the next level. Although there are many scales that can be used for quantifying managerial judgments, the scale given in Table II is commonly used for pairwise comparisons (Saaty, 1990).
However, the AHP is sometimes sadly misused and the analysis stops with the calculation of the eigenvector from the pairwise comparisons of relative importance (sometimes without even computing the CR), but the AHP’s true subtlety lies in the fact that it is, as its name says, a Hierarchy process. The first eigenvector has given the relative importance attached to requirements, such as cost and reliability, but different machines contribute to differing extents
32
to the satisfaction of those requirements. Thus, subsequent matrices can be developed to show how X, Y and Z respectively satisfy the needs of the firm. (The matrices from this lower level in the hierarchy will each have their own eigenvectors and CRs.) The final step is to use standard matrix calculations to produce an overall vector giving the answer we seek, namely the relative merits of X, Y and Z vis-à-vis the firm’s requirements.
C. AHP Application for Supplier Selection
Supplier selection process encompasses four parts including problem definition, formulation of attributes, qualification of potential suppliers, and the ultimate selection of best suppliers (De Boer et al., 2001). Saaty (1980) outlined the types and scopes of AHP problems as follows:
Set priorities
Generate a set of alternatives
Choose a best policy alternative
Determine requirements
Allocate resource
Predict outcomes
Measure performance
Design system
Ensure system stability
Optimization
Planning
Resolve conflict
Risk assessment
The AHP is often difficult to conceptualize all the different elements of a problem, or there is not enough cognitive energy to prioritize those elements. It is formulated to counter those situations and mathematically-based theory. Moreover, it employs two key aspects including date from the various variables that make up the decision and judgments about those variables.
In order to execute AHP, the following steps are required.
Structuring the decision into a hierarchical model
Pairwise comparison of all objects and alternative solutions
The form of the model has four elements, allowing decision maker to examine every part of a complex problem.
Goal - the desired outcome
Criteria – elements that comprise the goal
Sub criteria – elements inside the criteria
Alternatives – solutions or choices available a. Pairwise Comparison
The pairwise comparison method was introduced by Fechner in 1860 and developed by Thurstone in 1927. Based on pairwise comparison, Saaty proposes the analytic hierarchy process (AHP) as a method for multi-criteria decision-making. It provides a way of breaking down the general method into a hierarchy of sub-problems, which are easier to evaluate.
In the pairwise comparison method, criteria and alternatives are presented in pairs of one or more referees (e.g. experts or decision makers). It is necessary to evaluate individual alternatives, deriving weights for the criteria, constructing the overall rating of the alternatives and identifying the best one. Referred from Alonso, Jose Antonio., Lamata, M. Teresa (2006), the alternatives are denoted by { } 1 2 , ,..., n A A A (n is the number of compared alternatives), their current weights by { } 1 2 , ,..., n w w w , and the matrix of the ratios of all weights by:
The matrix of pairwise comparisons A = [a ij ] represents the intensities of the expert’s preference between individual pairs of alternatives (A i versus A j , for all i,j=1,2,..,n). They are usually chosen from a given scale (1/9,1/8,…,8,9). Given n alternatives { }, a decision maker compares pairs of alternatives for all the possible pairs, and a comparison matrix A is obtained, where the element shows the preference weight of obtained by comparison with .
34
The elements estimate the ratios where w is the vector of current weights of the alternative (which is our goal).
Multiple pairwise comparisons are based on a standardized comparison scale of nine levels.
Let C= {Cj|j=1, 2... n} be the set of criteria. The result of the evaluation matrix in which every element aij (i, j=1, 2... n) is the quotient of weights of the criteria, as shown:
During pairwise comparisons evaluation, the general process is to bring experts together for group evaluation. The best approach is to obtain the same point of view and provide comments for next appraisal after numerous discussions if it allows the co-existence of different perspectives. Therefore, the judgment of the integrated AHP method is very important portion.
b. Eigenvalue & Eigenvector
According to last section and above formula, if a matrix A is absolutely consistent, we notice that A=W and in the ideal case of total consistency, the principal eigenvalue ( ) is equal to n, i.e “ = n”, the relations between the weights and the judgments will be given by
= for i,j = 1,2,…n. The weights , i =1,2,...,n, were obtained using the eigenvector method, they are positive and normalized, and satisfy the reciprocity property.
Let A = [ ] for all i,j=1,2,…,n denote a square pairwise comparison matrix, where gives the relative importance of the elements i and j. Each entry in the matrix A is positive ( > 0) and reciprocal ( ). Our goal is to compute a vector of weights { } associated with A. According to the Perron-Frobenius Theorem, if A is an nxn, non-negative, primitive matrix, then one of its eigenvalues is positive and greater than or equal to (in absolute value) all other eigenvalues, and there is a positive eigenvector w corresponding to that eigenvalue, and that eigenvalue is a simple root (matrix Frobenius root) of the characteristic equation:
In the eigenvector method, w is the weight vector that is our goal.
c. Consistence
The consistency test is one of the critical components in AHP. Currently, the consistency ratio (CR) proposed by Saaty (1990) is popularly used to test the consistencies of the pairwise comparison matrices. However, when the number of comparison matrices increases, the consistency test of comparison matrices in the AHP becomes complicated.
In an attempt to simplify the consistency test, Ergu et al. (2011a) proposed a maximum eigenvalue threshold as the new consistency index for the data in the AHP, which is mathematically equivalent to the CR method.
The traditional eigenvector method for estimating weights in the analytic hierarchy process
36
yields a way of measuring the consistency of the referee’s preferences arranged in the comparison matrix. If a square pairwise comparison matrix is not absolutely consistent, two different situations may be considered. The first one is a contradictory matrix; we can find some cycles in the associated graph of this matrix6 i.e. for n=3 if > 0, > 0 and < 0, or the opposite (and essentially similar) situation < 0, < 0 and > 0. The other situation appears when the matrix is neither totally consistent nor contradictory. In this case, Saaty defined the consistency index (CI) as follows:
It is also known that small changes in imply small changes in with the difference between this and n being a good measure of consistency. Saaty has shown that if the referee is completely consistent then,
= n and
CI = 0.1
In above case, the two different matrices of judgment (A) and weights (W) are equal. However, it would be unrealistic to require these relations to hold in the general case. For instance, it is known that the number of totally consistent different matrices by the Saaty scale, for n=3 is 13 or only 4 depending on whether the indifference in the relation of preference is accepted or not, for n=4 these values are 13 and 1, respectively, for n=5 is 14 and none, and so on. Otherwise, the level of inconsistency will be measured if the referee is not absolutely consistent then
> n. For this purpose, Saaty defined the consistency ratio (CR) as:
where RI is the average value of CI for random matrices using the Saaty scale obtained by Forman and Saaty only accept a matrix as a consistent one if CR < 0.1.
The consistency index (CI) gives information about logical consistency among pairwise comparison judgments in a perfect pairwise comparison case. When CI=0.0, there is no logical
inconsistency among the pairwise comparison judgments, or the judgment is considered 100%
consistent. As the value of CI grows, the degree of logical inconsistency among the pairwise comparison judgments is also considered to grow. There have been discussions about what threshold value should be chosen for the value of CI beyond which the judgment is considered unacceptable.
If (and only if) the decision-makers generate "perfect” judgments (absolutely consistent judgments) for arbitrary i, j and k, the comparison matrix determinant is null, the matrix Frobenius root ( ) is always equal to n, and the remaining eigenvalues are all 0 for any . Thus, the eigenvector corresponding to the Frobenius root is always non-negative, and each element of the eigenvector standardized by normalization can be interpreted as the degree of importance of each alternative. In this situation, the comparison matrix obviously satisfies the transitivity property for all pairwise comparisons.
Conversely, when it is inconsistent, the principal eigenvalue is greater than n and its difference will serve as a measure of CI. Therefore, to ascertain that the priority of elements is consistent, the maximum eigenvector or relative weights/λmax can be determined. Where n is the matrix size or the number of items that are being compared in the matrix. Based on this situation, the consistency ratio (CR) can be determined as:
Where RI represents average consistency index over a number of random entries of same order reciprocal matrices shown in Table 1. CR is acceptable, if it is not greater than 0.10. If it is greater than 0.10, the judgment matrix will be considered inconsistent. To rectify the judgment matrix that is inconsistent, decision-makers’ judgments should be reviewed and improved.
However, Byun (2001) suggested that .20 might still be acceptable.
Table 6.2: The Reference Values of RI for Different Numbers of N
N 2 3 4 5 6 7 8 9 10
RI 0 0.58 0.90 1.12 1.24 1.32 1.41 1.45 1.49
Source: Shahroodi (2012); developed by Saaty
38
The AHP does not impose on the manufacturing firms to be perfectly consistent, rather a consistency test is performed to examine the extent of consistency as well as each judgment once the priorities are determined. Saaty recommended using consistency index (CI) and consistency ratio (CR) to check for the consistency associated with the comparison matrix.
d. The Expert Choice Software
Expert Choice (EC) is one of the software packages available that incorporates the ideas and methodology of the AHP. It is “designed for the analysis, synthesis, and justification of complex decisions and evaluations” and can be used in either individual or group situations (Quick Start Guide and Tutorials, 2001, p.6). All necessary steps involved in the AHP are captured in the Expert Choice software. In short, the Expert Choice software provides a structured approach and proven process for prioritization and decision-making based on the Analytic Hierarchy Process (AHP). The Expert Choice not only helps decision-makers arrive at the best decision, but also provides a clear rationale for that decision.
The Expert Choice is intuitive, graphically based and structured in a user-friendly fashion so as to be valuable for conceptual and analytical thinkers, novices and category experts. Because the criteria are presented in a hierarchical structure, decision makers are able to drill down to their level of expertise, and apply judgments to the objectives deemed important to achieving their goals. At the end of the process, decision makers are fully cognizant of how and why the decision was made, with results that are meaningful, easy to communicate, and actionable.
Team Expert Choice, which allows decisions to be generated in a group setting, is another feature of the software. A group model allows individual judgments or expert opinions to be combined and evaluated, producing a group decision in the end. Team Expert Choice includes the same steps and features as Expert Choice.