以病毒-宿主-環境交互動態模式結合成本效益分析評估疫苗使 用影響延續計畫
報 告 類 別 : 成果報告 計 畫 類 別 : 個別型計畫
計 畫 編 號 : MOST 108-2313-B-040-001- 執 行 期 間 : 108年08月01日至109年07月31日 執 行 單 位 : 中山醫學大學公共衛生學系(所)
計 畫 主 持 人 : 陳詩潔
計畫參與人員: 大專生-兼任助理:李為誼 大專生-兼任助理:黃翊涵 大專生-兼任助理:高薇栩 大專生-兼任助理:李佳蓁
本研究具有政策應用參考價值:□否 ■是,建議提供機關衛生福利部
(勾選「是」者,請列舉建議可提供施政參考之業務主管機關)
本研究具影響公共利益之重大發現:■否 □是
中 華 民 國 109 年 10 月 29 日
登革熱的分佈,特別是針對台灣南部登革熱高流行區域(高雄市和台 南市)。本計畫亦嘗試了解流行期和非流行期的變化特徵。同時,以 疾病負擔觀點討論2007-2015 年間直接與間接成本,並模擬若台灣 施行登革熱疫苗施打,基於假設的疫苗成效下,不同的疫苗覆蓋率 是否具有成本效益。
研究結果顯示,不論為非流行期間和流行期間,降雨對登革熱發生 率的影響可能大於其他因素。從2007年到2017年的平均每週降雨量 和平均每週發生率的擬合顯示了台南和高雄的顯著延遲效應。在台 南地區溫度延遲3-4個月並解釋登革熱發生率變異性的54-56%(非流 行期間)和22%-29%(流行期間)。而高雄地區,溫度(r = 0.54 – 0.64)和降雨(r = 0.53 – 0.55)的5個月滯後中發現了較高的顯著 趨勢。值得注意的是,降雨的1個月滯後(台南)和3個月滯後(高雄 )對登革熱發病率的變異性也有一定貢獻(r = 0.46和0.55)。
另外,本研究利用登革熱病例數、死亡數、失能權重、失能期間等 數據與參數計算台灣因登革熱損失的失能校正人年(Disability- adjusted life year, DALY),並評估登革熱之直接成本(包含門診
、住院、急診、藥物之成本)與間接成本(包含因住院造成的生產力 損失、因死亡造成的生產力損失及看護照顧成本)。在登革熱疫苗控 制策略,本研究設計不同施打方案並評估其疫苗成本,再進行 DALYs估算及直接成本、間接成本之預測,最後進行增量成本效益比 (Incremental cost-effectiveness ratio, ICER)之估算。本研究 以2014及2015年之感染高風險族群之佔比做為模擬對象,包含台南
、高雄60 歲以上之登革熱病例數在全台所有病例所佔之比例,並且 假設登革熱疫苗之效力為56.5%。
研究顯示, 2007-2015年登革熱之直接成本平均為
US$1,565,089,住院費用佔最高比例;登革熱間接成本平均則為 US$7,778,933,其中死亡造成的生產力損失比例最高。若台灣於臺 南、高雄實施登革熱疫苗策略,我們將各ICER 值與2007-2015 年台 灣GDP之平均值US$19,748 進行比較,結果顯示不論是哪一種覆蓋率 及疫苗總價之組合,ICER 值均超過台灣GDP 的三倍
(US$59,243),表示在這些情形下,登革熱疫苗之策略是不具有成本 效益的。並且,覆蓋率與疫苗總價中,覆蓋率的改變並不會影響 ICER 之值,疫苗總價才是能改變成本效益的變因。
中 文 關 鍵 詞 : 傳染病, 登革熱,天氣因子,溫度,成本效益分析, 疫苗接種, 失 能校正人年
英 文 摘 要 : The objective of this study was to link climatic factors to dengue fever incidence to investigate the dengue fever distribution, especially on the highest epidemic regions as Kaohsiung and Tainan city of southern Taiwan during the periods of 2007–2017. We also try to character the
patterns in dengue-epidemic and non-epidemic periods. This study aims also to understand the disease and economic
and to investigate a possible strategy for and the cost- effectiveness of implementing dengue vaccination in Taiwan.
Overall, these results indicated that rainfall could play a key role on dengue incidence rates than the other factors when compare with non-epidemic and epidemic years. The mapping of the average weekly rainfall and average weekly incidence rates from 2007 to 2017 exhibited the significant time lag effects in Tainan and Kaohsiung. In Tainan region, the results show that 3 – 4 months lag in temperatures explained 54 – 56% and 22% – 29% of the variability in dengue incidences in two time periods. However, in
Kaohsiung region, higher significant trends were found 5 month lag in the temperature (r = 0.54 – 0.64) and rainfall (r = 0.53 – 0.55), yet there is lower positive trends were revealed in the RH in both regions and time periods. It is noted that 1-month lag (Tainan) and 3-month lag (Kaohsiung) of rainfall also had certain contribution on dengue incidence variability (r = 0.46 and 0.55).
Rainfall at a lag of 2-month had a positive effect on dengue incidence in Tainan (β = 0.0101, p < 0.0001) and Kaohsiung (β = 0.0101, p < 0.0001), respectively.
The vaccination costs were the estimated costs of dengue vaccination for the high-risk population groups in Tainan and Kaohsiung for a range of coverage rates and vaccine prices. We based our evaluation on four possible total coverage rates for all three doses of dengue vaccine: 25%, 50%, 60%, and 75%. We presumed that the primary
immunization subjects would be the high-risk groups (people aged 60 and over) in Tainan and Kaohsiung. We compared the ICER values and the average per capita GDP (USD 19,748) in Taiwan for 2007–2015 and found that the ICER consistently exceeded three times the per capita GDP in Taiwan,
irrespective of the combination of coverage rate and total vaccine price. This suggests that none of these dengue vaccination strategies would be cost-effective. It is worth noting that changes in coverage rate did not affect the ICER; only the total vaccine price affected cost-
effectiveness.
英 文 關 鍵 詞 : Infectious diseases, dengue fever, climate factor, temperature, cost-effectiveness analysis, vaccination, disability-adjusted life year
科技部補助專題研究計畫成果報告
(□期中進度報告/■期末報告)
(計畫名稱)
計畫類別:■個別型計畫 □整合型計畫 計畫編號:MOST 108-2313-B-040-001-
執行期間:2019 年 08 月 01 日至 2020 年 07 月 31 日 執行機構及系所:中山醫學大學公共衛生學系
計畫主持人:陳詩潔教授 共同主持人:無
計畫參與人員:黃翊涵、高薇栩、李為誼
本計畫除繳交成果報告外,另含下列出國報告,共 ___ 份:
□執行國際合作與移地研究心得報告
□出席國際學術會議心得報告
□出國參訪及考察心得報告
本研究 具有政策應用參考價值: □否 □是,建議提供機關_______
(勾選「是」者,請列舉建議可提供施政參考之業務主管機關) 本研究具影響公共利益之重大發現:□否 □是
中 華 民 國 109 年 10 月 29 日
1. Introduction
Dengue is a mosquito-borne virus infection that is found in tropical and sub-tropical regions of the world, mostly in urban and semi-urban settings. Day-biting Aedes mosquitos spread disease. It is the fastest spreading vector-borne viral disease and is now endemic in over 100 countries, resulting in 40% of the world’s population living in an area at risk for dengue (WHO, 2020).
The epidemic behaviors of dengue are known to be related to the fluctuations in temperature, precipitation, humidity and socioeconomic factors like urbanization and human movement (Xiao et al., 2018; Guzman and Harris, 2015; Li et al., 2014; Morin et al., 2013; Johansson et al., 2009; Halstead, 2008). Warmer temperatures can increase or reduce survival rate, depending on the vector, its behavior, ecology, and may other factors. A 2℃ increase in temperature would simultaneously lengthen the lifespan of the mosquito and shorten the extrinsic incubation period (EIP) of dengue virus, resulting in more infected mosquitoes for a longer period of time (Focks and Barrera, 2007). Recent studies showed that diurnal temperature ranges have been found to be more important than average temperature when examining the development and transmission of dengue and malaria parasites (Zhao et al., 2014;
Lambrechts et al., 2011; Paaijmans et al., 2009). Servadio et al. (2018) also showed that outbreak risk in South and Southeast Asia peaks near 33.5℃ as the highest monthly average temperature and the trend for temperature, which was significant.
The trend for precipitation was observed showing risk peaking when the highest monthly average precipitation is 650 mm, though not significant.
Gloria-Soria et al. (2017) assessed the effects of mosquito and virus genotype on DENV infection in the context of temperature by challenging Ae. aegypti from two locations in Vietnam, which differ in temperature regimes, with two isolates of DENV-2 collected from the same two localities, followed by incubation at 25, 27 or 32°C for 10 days. Extrinsic incubation temperature (EIT) and DENV-2 genotype had a direct effect on the infection rate, consistent with previous studies. However, these results show that the EIT impacts the infection rate differently in each mosquito population, indicating a genotype by environment interaction. These results suggest that the magnitude of DENV epidemics may not only depend on the virus and mosquito genotypes present, but also on how they interact with local temperature.
The association of dengue epidemics with rainfall could be explained by increases
in adult survival and feeding activity of the vector mosquito. The rainfall effect can also differ based on the duration of time lag, for example, the long-term (monthly or seasonally) or short-term impacts (daily or weekly) on dengue transmission (Chen et al., 2018a). For long-term effects, rainfall events might influences human resident water storage practices (Pontes et al., 2000), moreover, studies both reported this long-term rainfall effect prior to the outbreak of the epidemic in Taiwan (Wang et al., 2016a; Chen et al., 2010). For short-term effects, rainfall events direct influences on dengue outbreaks. However, some researches gave contradicting evidence on the relationship of climatic factors to dengue incidence (Kanchanapairoj et al., 2000).
Taiwan is located in both subtropical and tropical regions with relatively high temperature and relative humidity year-round, forming an ideal condition for the growth of the vector of dengue fever-mosquito. Epidemics of dengue disease in Taiwan have been documented since 1902 with an island wide-outbreak occurring in 1942–1943 (King, 2000; Bureau of Communicable Disease Control, 1987). Dengue is a notifiable communicable disease in Taiwan and a national web-based notifiable diseases surveillance system has been established since 1997. All confirmation laboratory tests are performed at the Centers for Disease Control (CDC), Ministry of Health and Welfare, Taiwan (TNIDSS, 2020). Over the last decade, Taiwan has experienced two of the largest dengue outbreaks, the first in 2014 (Wang et al., 2016b) and the second even larger outbreak in 2015 (Wang et al., 2016b). More researchers are paying attention to the clinical, epidemiological survey and epidemiology patterns for the dengue fever disaster in Taiwan (Wang et al., 2019; Tsai et al., 2018; Chen, 2018b; Hsieh, 2018).
We agreed that rainfall events can occur in dengue-epidemic or non-epidemic periods (Chen et al., 2018a), as well as the high temperature can occur in two periods in specific region. So, what is the critical difference between epidemic periods and non-epidemic periods especially focus on climate factors? Hence, the objective of this study was to link climatic factors to dengue fever dynamics to investigate the dengue fever distribution, especially on the highest epidemic regions as Kaohsiung and Tainan city of southern Taiwan during the periods of 2007–2017. We also try to character the patterns in dengue-epidemic and non-epidemic periods. To improve dengue prevention and surveillance, public-health officials need to know much more about the patterns of dengue virus transmission and about the factors that underlie these patterns. Early warning systems and disease prevention programme, therefore,
will require models that incorporate climatic factors.
The development of safe and effective vaccines against all four serotypes has resulted in great progress in the control of the disease. The first dengue vaccine to be approved in the world was CYD-TDV, developed by Sanofi Pasteur. It gained regulatory approval and entered the market in Mexico in December 2015 (WHO, 2019). This and other more recently developed vaccines have been an important tool in achieving the WHO’s aim of reducing the incidence of dengue by at least 25% and the mortality rate by at least 50% by 2020 (WHO, 2019).
However, the cost-effectiveness of dengue vaccines has also become an issue that has attracted much attention. Since it is located in the subtropics, Taiwan falls in the high-risk zone for dengue epidemics. Therefore, this study aims to understand the disease and economic burden caused by dengue fever in Taiwan from 2007 to 2015 and to investigate a possible strategy for and the cost-effectiveness of implementing dengue vaccination in Taiwan.
2. Materials and methods 2.1. Surveillance data
This study was conducted in Tainan and Kaohsiung because of the major dengue epidemic that occurred in southern Taiwan and the latest clustered epidemic area appeared in Tainan. The largest epidemic occurred in 2014 and 2015 in that there were 15496 and 43419 indigenous confirmed dengue cases in epidemic years. All weekly confirmed dengue cases were provided by Taiwan Center of Disease Control (Taiwan CDC) from January 2007 to December 2017. Monthly dengue incidence rates per 100,000 population were estimated from monthly confirmed dengue cases over the specific year-end population size.
2.2. Meteorological data
All weekly meteorological data for the period of 2007–2017 in Tainan and Kaohsiung were adopted from the observations of 4 (Xinying, Shanhua, Annan, and Tainan station) and 11 monitor stations (Qiaotou, Nanzi, Renwu, Zuoying, Qianjin, Qianzhen, Fuxing, Fongshan, Xiangang, Linyuan, and Dalia station) of Taiwan Environmental Protection Agency (Taiwan EPA) and Central Weather Bureau (Taiwan CWB). The monitor stations in Tainan and Kaohsiung were chosen because of the highest dengue incidence rate for the previous epidemiological record. The
weekly maximum, mean, and minimum temperatures, rainfall intensity, and RH were used as the study data. Here the weekly maximum temperature is defined as the weekly average of the daily maximum temperature.
2.3 Statistics analysis
We began by investigating the overall correlation between dengue incidence rates and meteorological data (minimum, mean, and maximum temperatures, relative humidity) and amount of rainfall. According to epidemiological surveillance, 2014-2015 years were defined as the dengue epidemic years and others were defined as the dengue non-epidemic years during the periods of 2007–2017.
We used cross-correlation to assess the trend between individual climatic variables and the incidence of dengue fevers. We also carried out a lagged cross-correlation analysis to investigate the lagged effects of the climatic variables on dengue incidence in Taipei and Kaohsiung from 2007 – 2017. The lagged-time Poisson regression analysis was performed. A basic multivariate Poisson regression model can be written as,
, (1)
where Yt is the incidence of dengue confirmed cases at time t, β0 is the intercept, β1 through β6 represent coefficients, Tmax, Tmin and Tmean are the weekly maximum, minimum, and mean temperatures, respectively (°C), Rain is the rainfall intensity (mm), RH is the relative humidity (%), and t-n in the subscript represents the n-month lag time. The most parsimonious model was selected based on the quasi-likelihood based information criterion (QICu). The lagged-time Poisson regression analyses were performed by using SAS Version 9.1.3 for Windows (SAS Institute Inc., Cary, North Carolina, USA).
2.4 DALYs assessment
Before the 2010 Global Burden of Disease (GBD) study, the calculation of DALYs generally involved age weighting and discounting. GBD 2010 changed DALYs calculation by removing age weighting and discounting (Murray et al., 2012).
The formula for calculating DALYs in GBD 2010 is as follows:
𝐷𝐴𝐿Y𝑠 = 𝑌𝐿𝐿 (𝑌𝑒𝑎𝑟𝑠 𝑜𝑓 𝐿𝑖𝑓𝑒 𝐿𝑜𝑠𝑡) + 𝑌𝐿𝐷 (𝑌𝑒𝑎𝑟𝑠 𝐿𝑜𝑠𝑡 𝑑𝑢𝑒 𝑡𝑜 𝐷𝑖𝑠𝑎𝑏𝑖𝑙𝑖𝑡𝑦) 𝑌𝐿𝐿 = 𝑁 × 𝐿
𝑌𝐿𝐷 = 𝐼 × 𝐷𝑊 × 𝐿
In the formula for YLL, N is the number of deaths and L is life expectancy at the age of death. In the formula for YLD, I is the number of incident cases, DW is the disability weight, and L is the average duration of a case until remission or death. We used this formula to assess the loss of DALYs in Taiwan due to dengue fever.
2.5 Cost evaluation
Our cost evaluation included direct, indirect, and vaccination costs. The direct costs included the costs of medications and outpatient, inpatient, and emergency hospital visits. We estimated these by multiplying the number of outpatient visits, inpatient visits, emergency visits, and medications by the payment made for each (Table 1).
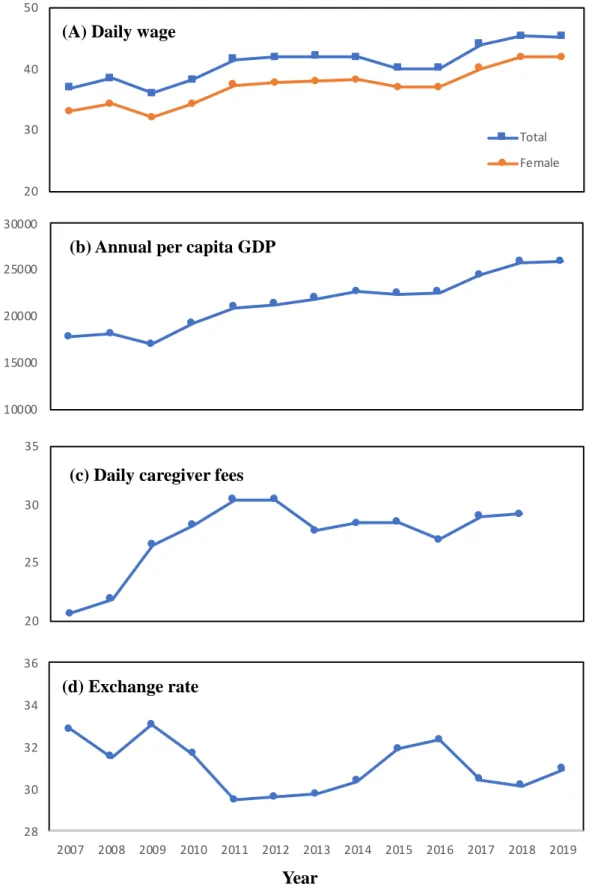
The indirect costs included costs resulting from loss of productivity and caregiver expenses related to disability, hospitalization, and premature mortality resulting from the disease. Table 2 lists in detail the items and formulae used to estimate the indirect costs. We assumed that in employed adults, all three diseases (DF, DHF, and DSS) would cause productivity loss, while in children they would cause productivity loss to working mothers because the children would rely on care from their mothers. Productivity loss due to death was instead reflected in DALYs, the annual gross domestic product (GDP), and the number of deaths. To calculate lost healthy life years, we applied the parameters of the Abridged Life Table for a Single Age over Years from the Department of Statistics of the Ministry of Interior of the Republic of China. Table 3 lists the parameters used to estimate the indirect costs, of which four (daily wage, mother’s daily wage, GDP, and daily caregiver expense) changed over the years of the study period (Figure 1).
The vaccination costs were the estimated costs of dengue vaccination for the high-risk population groups in Tainan and Kaohsiung for a range of coverage rates and vaccine prices. We based our evaluation on four possible total coverage rates for all three doses of dengue vaccine: 25%, 50%, 60%, and 75%. Based on the data in Tables 4 and 5, we presumed that the primary immunization subjects would be the
high-risk groups, in another words, people aged 60 and over in Tainan and Kaohsiung.
2.6 ICER evaluation
We consulted Shepard et al. (2018) when evaluating the ICER for Taiwan for implementing dengue vaccination in Tainan and Kaohsiung. If the value is less than the per capita GDP of Taiwan, then dengue vaccination has a very high cost-effectiveness. An ICER of 1–3 times the per capita GDP signifies moderate cost-effectiveness. However, when the ICER is > 3 times the per capita GDP, there is zero cost-effectiveness for dengue vaccination. The formula for calculating the ICER is as follows:
𝐼𝐶𝐸𝑅 = (cost of vaccinating − cost of not vaccinating) / (DALYs under vaccination − DALYs under no vaccination)
We predicted DALYs and direct and indirect costs under vaccination by considering the proportion of cases comprised by the high-risk group in 2014 and 2015, when the outbreaks occurred. This s the percentage of dengue cases aged ≥ 60 years in Tainan and Kaohsiung out of all dengue cases in Taiwan. We also consulted Guy et al. (2015) and assumed the effectiveness of the dengue vaccine to be 56.5%.
3. Results and discussion 3.1. Data description
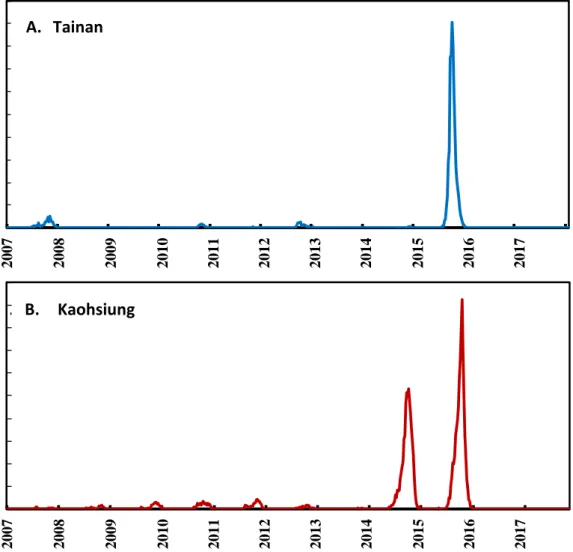
In Tainan, the mean and maximum weekly incidence rates were 2.41 and 181.54 per 100,000 people, whereas nearly 2.45 and 92.52 per 100,000 people in Kaohsiung, respectively. The largest scales of dengue fever epidemics in these two places were both found in 2015. There are 19,769 and 15,013 reported dengue cases among the population size of 2,778,276 and 2,777,873 in 2015 in Kaohsiung and Tainan, respectively (Fig. 2). Thus, it suggests that a higher alarming should focus on Kaohsiung than that on Tainan when the dengue seasons are coming.
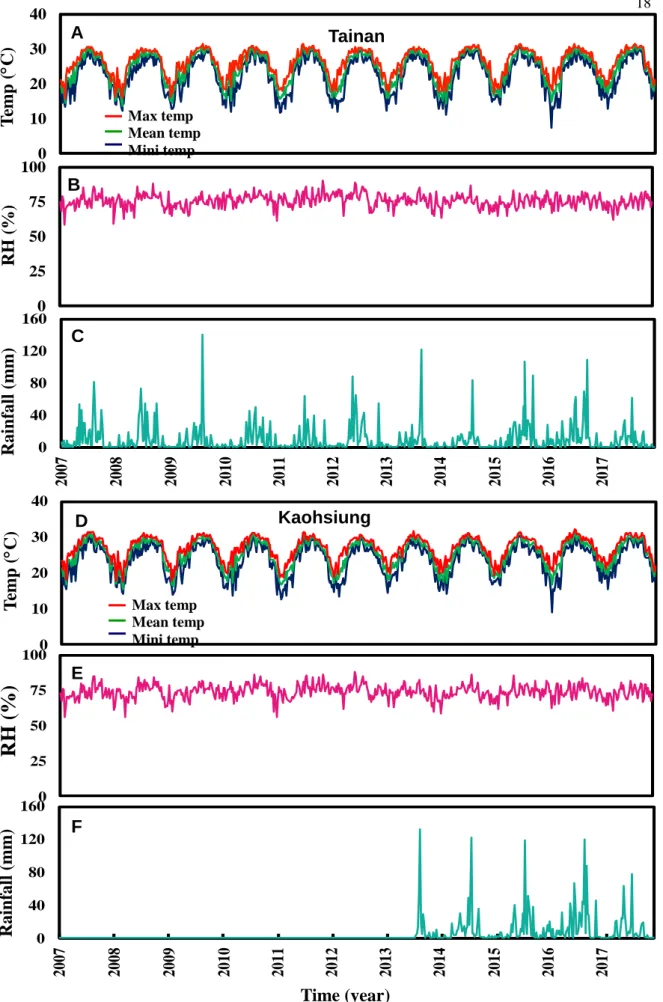
Fig. 3 shows the meteorological data in two regions during 2007–2017. Results show a typical tropical climate in Tainan with a mean annual temperature of 24.62℃
(n = 576), the highest temperature of 32.95C at summer (August), the lowest
temperature of 7.43C at winter (January), a mean yearly RH of nearly 75.75% (n = 576), and a mean weekly rainfall of 10.64 mm. However, in Kaohsiung, the results indicate a tropical climate with a mean yearly temperature of 25.47C (n = 576), the highest temperature of 33.01C at summer, the lowest temperature of 7.25C at winter, a mean yearly RH of 74.09%, and a mean weekly rainfall of 11.41 mm. Statistical description for each meteorological data during 2007 to 2017 were also presented. We listed the average, SD, minimum, Q1, Q2, Q3, and maximum for each environmental monitor station and the meteorological data including min temp. average temp., max temp, RH, and rainfall (Appendix Table 1).
3.2. Trend analysis
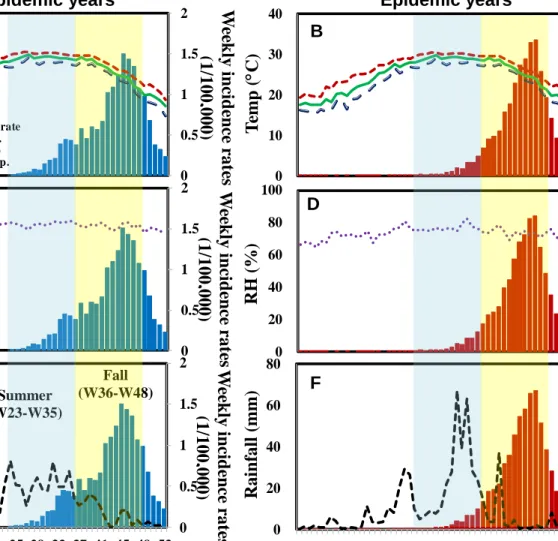
In our study, we present the meteorological data into epidemic and non-epidemic years in Tainan and Kaohsiung. Figs. 4 and 5 revealed the trend analysis in the weekly mean, maximum, and minimum temperatures, RH, and rainfall in Tainan and Kaohsiung over the 2007 – 2017 time periods. Overall, these results indicated that rainfall could play a key role on dengue incidence rates than the other factors when compare with non-epidemic and epidemic years. The mapping of the average weekly rainfall and average weekly incidence rates from 2007 to 2017 exhibited the significant time lag effects in Tainan and Kaohsiung (Fig. 4F and Fig.
5F). The rainfall shows the same trends in two areas. There is multiple rainfall pecks occurred before the sharply incidence growth of dengue cases and the rainfall strength (Maximum recorded weekly rainfall to 60 mm) in Kaohsiung.
Spearman’s rank correlation coefficient fitted to data revealed the monthly time-lag effects in the mean, maximum, and minimum temperatures, rainfall, and RH in two study areas over the non-epidemic years (2007–2013 and 2016–2017) and epidemic years (2014–2015) time periods (Table 6). In Tainan region, the results show that 3 – 4 months lag in temperatures explained 54 – 56% and 22% – 29% of the variability in dengue incidences in two time periods. However, in Kaohsiung region, higher significant trends were found 5 month lag in the temperature (r= 0.54 – 0.64) and rainfall (r= 0.53 – 0.55), yet there is lower positive trends were revealed in the RH in both regions and time periods. It is noted that 1-month lag (Tainan) and 3-month lag (Kaohsiung) of rainfall also had certain contribution on dengue incidence variability (r = 0.46 and 0.55) (Table 6).
3.3. Lagged-time Poisson regression analysis
The time lag effects were then incorporated into Poisson GLM model to estimate the dengue incidence attributable to climatic factors. Table 7 lists the best-fitting models with the smallest AICu values to characterize the relationships between weekly dengue fever cases (2007–2017) and meteorological factors in Tainan (AICu = 16562) and Kaohsiung (AICu = 31604), respectively. Rainfall at a lag of 2-month had a positive effect on dengue incidence in Tainan (β = 0.0101, p <
0.0001) and Kaohsiung (β = 0.0101, p < 0.0001), respectively.
3.4 No-vaccination scenario 3.4.1 DALYs
Figure 6 shows the DALYs for dengue fever in Taiwan for 2007–2015, with a mean of 528.1 DALYs. For the years with outbreaks (2014 and 2015) and for those without, the means were 2108.6 and 76.5 DALYs/million, respectively; the mean for the outbreak years was 28 times that for non-outbreak years. This represented a considerable disease burden in Taiwan. The YLL for 2007–2015 accounted for 94.5%
of overall DALYs, suggesting that deaths due to dengue fever were the primary cause of this disease burden.
3.4.2 Costs
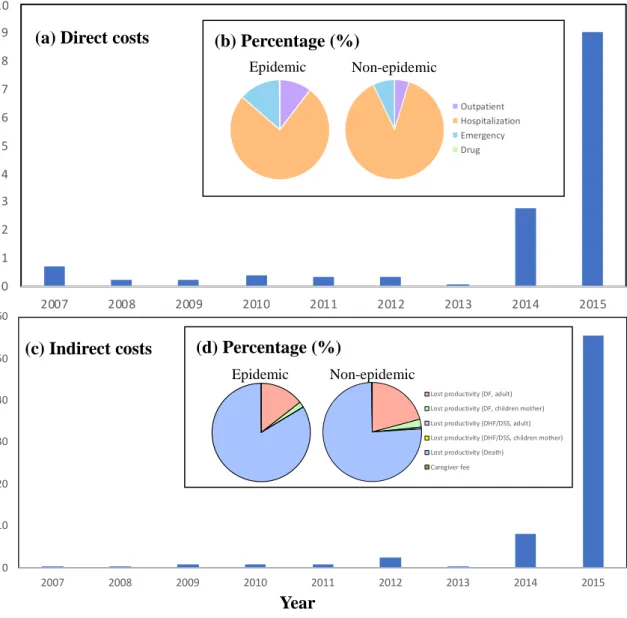
Figure 7A shows the direct costs of dengue fever for 2007–2015, with a mean of USD 1,565,089. For the outbreak years, the mean was USD 5,903,558, which was 18 times that for the non-outbreak years (USD 325,526). Hospitalization costs accounted for the majority of the direct costs in both outbreak and non-outbreak years, representing 76% and 88%, respectively, of the total. Emergency and outpatient hospital visits accounted for the second- and third-largest proportions of the direct costs, respectively (Figure 7B). Figure 7C shows the indirect costs of dengue fever for 2007–2015, with a mean of USD 7,778,933. For outbreak years, the mean was USD 31,968,608, which was 37 times that for non-outbreak years (USD 867,598). Productivity loss due to death accounted for the majority of the indirect costs in both outbreak and non-outbreak years, representing 84% and 76%, respectively, of the total. Productivity loss due to adult DF cases and productivity loss due to mothers having to care for children with DF accounted for the second-
and third-largest proportions of the indirect costs, respectively (Figure 7C).
3.5 Vaccination scenario 3.5.1 DALYs
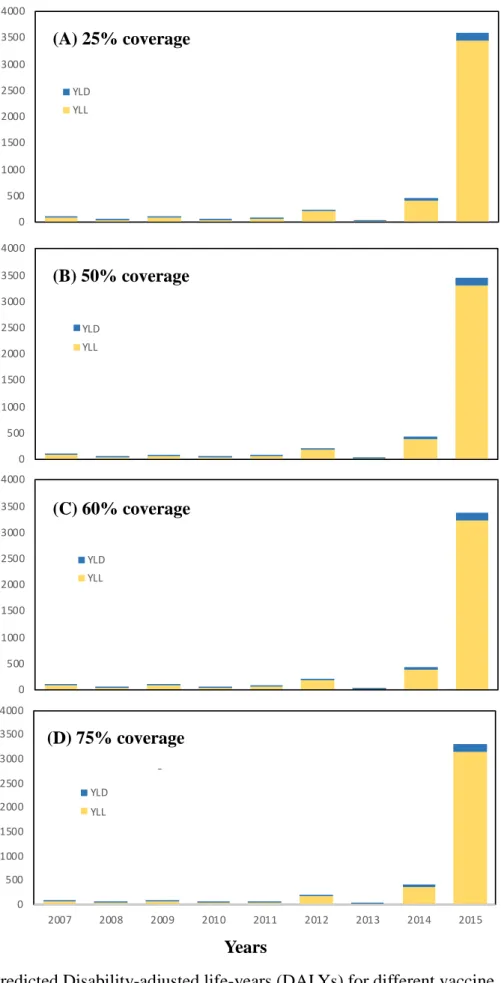
Figure 8 shows the predicted DALYs under the implementation of various dengue vaccination strategies in Tainan and Kaohsiung. With a coverage rate of 25%, the predicted mean DALY was 507.2 DALYs, and the means for outbreak and non-outbreak years were 2025 and 3.5 DALYs, respectively. There would thus be an overall saving of 188.6 DALYs, or 21 DALYs per year, on average if dengue vaccination were implemented with 25% coverage in Tainan and Kaohsiung. With a coverage rate of 50%, the mean was 486.2 DALYs, and the means for outbreak and non-outbreak years were 1941.3 and 70.5 DALYs, respectively. This represents an overall saving of 377.2 DALYs, or 41.9 DALYs per year, on average. With a coverage rate of 60%, the mean was 477.8 DALYs, and the means for outbreak and non-outbreak years were 1907.8 and 69.2 DALYs, respectively. This represents an overall saving of 452.6 DALYs, or 50.3 DALYs per year, on average. With a coverage rate of 75%, the mean was 465.2 DALYs, and the means for outbreak and non-outbreak years were 1857.6 and 67.4 DALYs, respectively, representing an overall saving of 565.8 DALYs, or 62.9 DALYs per year, on average.
3.5.2 Costs
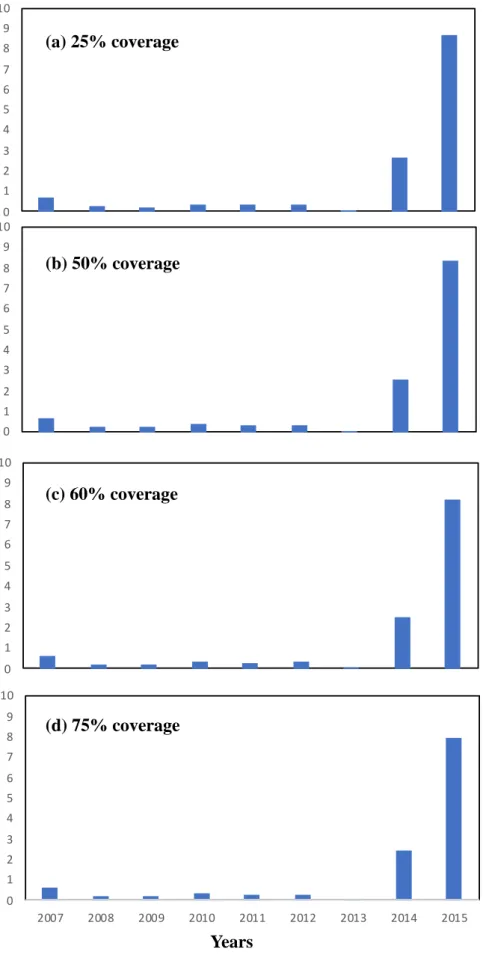
Figure 9A shows the direct costs predicted under the implementation of various dengue vaccine strategies in Tainan and Kaohsiung. With a coverage rate of 25%, the mean was USD 1,502,988, and for outbreak and non-outbreak years it was USD 5,669,313 and USD 312,610, respectively. This represents an overall saving of USD 558,908, or USD 62,101 per year, on average, if dengue vaccination were implemented with a coverage of 25% in Tainan and Kaohsiung. With a coverage rate of 50%, the mean was USD 1,440,887, and for outbreak and non-outbreak years it was USD 5,435,066 and USD 299,693, respectively, representing an overall saving of USD 1,117,815, or USD 124,202 per year, on average. With a coverage rate of 60%, the mean was USD 1,416,047, and for outbreak and non-outbreak years it was USD 5,341,368 and USD 286,777, respectively. This represents an overall saving of USD 1,341,378, or USD 149,042 per year, on average. With a coverage rate of 75%, the mean was USD 1,378,787, and for outbreak and non-outbreak years it was USD
5,200,820 and USD 286,777, respectively, representing an overall saving of USD 1,676,723, or USD 186,303 per year, on average.
Table 8 shows the estimated vaccination costs. The combination of a coverage rate of 25% and a total vaccine price of USD 10 provided the lowest vaccination cost—USD 1,870,845—while the combination of a coverage rate of 75% and a total vaccine price of USD 300 yielded the highest vaccination cost: USD 168,376,050.
3.6 Cost-effectiveness analysis
Table 9 shows the results of the cost-effectiveness analysis. We compared the ICER values and the average per capita GDP (USD 19,748) in Taiwan for 2007–2015 and found that the ICER consistently exceeded three times the per capita GDP in Taiwan, irrespective of the combination of coverage rate and total vaccine price. This suggests that none of these dengue vaccination strategies would be cost-effective. It is worth noting that changes in coverage rate did not affect the ICER; only the total vaccine price affected cost-effectiveness.
3.7 Discussion
According to our findings, dengue fever caused large disease and economic burdens in Taiwan during the outbreak years. Productivity loss due to death contributed greatly to the economic burden, with the YLL component representing 94.5% of DALYs for 2007–2015. This suggests that for both disease and economic burden, death was the primary cause of the heavy burden. In addition, the contribution to direct costs comprised by hospitalization costs greatly exceeded the contributions of the other expenses considered, suggesting that if dengue vaccination could reduce hospitalization and death rates, then the economic burden caused by dengue fever would be greatly reduced.
When selecting high-risk population groups, we were not able to select them more precisely, because the age categories used in the available data were relatively broad. This resulted in much higher predicted vaccination costs. If more information could be obtained on the ages, gender, and areas of the groups with higher risk, we might be able to effectively reduce dengue fever infections and at the same time reduce vaccination costs, thus saving on both direct and indirect costs and increasing the cost-effectiveness of dengue vaccination.
In the vaccination scenario, our results suggest that dengue vaccination would reduce the disease and economic burdens caused by dengue fever in Taiwan.
However, according to the results shown in Table 10, none of the dengue vaccination strategies were cost-effective, and the vaccine price had by far the greatest impact on the cost-effectiveness. When the vaccine price was held constant, changes in the coverage rate did not affect the ICER. This suggests that critical to enhancing the cost-effectiveness of vaccination is to precisely identify the high-risk groups in order to minimize the number of vaccination subjects, and at the same time reduce dengue vaccine prices.
4. Conclusions
This study evaluated the disease and economic burdens of dengue fever in Taiwan from 2007 to 2015 and predicted the costs of implementing dengue vaccination strategies and the changes in the disease and economic burdens following immunization. We also evaluated the cost-effectiveness of dengue vaccination and discussed the feasibility of an immunization policy. Dengue fever caused an enormous disease and economic burden during the outbreaks in Taiwan, but currently there are several dengue vaccines under development. Therefore, the findings of this study are important for understanding the disease and economic burdens of dengue fever in Taiwan and the feasibility of an immunization program there.
Reference
Bureau of Communicable Disease Control, 1987. Preliminary investigation report of an outbreak of dengue fever in Kaohsiung and Pingtung, southern Taiwan.
Epidemiol. Bull. 93–95.
Chen, S.C., Liao, C.M., Chio, C.P., Chou, H.H., You, S.H., Cheng, Y.H., 2010.
Lagged temperature effect with mosquito transmission potential explains dengue variability in southern Taiwan: Insights from a statistical analysis. Sci. Total Environ. 408 (19), 4069–4075.
Chen, T.H.K., Chen, W.Y.J., Wen, T.H., 2018a. Revisiting the role of rainfall variability and its interactive effects with the built environment in urban dengue outbreaks. Appl. Geogr. 101, 14–22.
Chen, W.J., 2018b. Dengue outbreaks and the geographic distribution of dengue vectors in Taiwan: A 20-year epidemiological analysis. Biomed. J. 283–289.
Focks, D.A., Barrera, R., 2007. Dengue transmission dynamics: assessment and implications for control. Scientific Working Group, Report on Dengue, 1-5 October 2006, Geneva, Switzerland, Copyright World Health Organization on behalf of the Special Programme for Research and Training in Tropical Diseases.
Gloria-Soria, A., Armstrong, P.M., Powell, J.R., Turner PE., 2017. Infection rate of Aedes aegypti mosquitoes with dengue virus depends on the interaction between temperature and mosquito genotype. In. Proc. R. Soc. B. 284, 20171506.
Guy, B., Briand, O., Lang, J., Saville, M., Jackson, N., 2015. Development of the Sanofi Pasteur tetravalent dengue vaccine: One more step forward. Vaccine, 33, 7100–7111.
Guzman, M.G., Harris, E., 2015. Dengue. Lancet 385, 453–465.
Halstead, S.B., 2008. Dengue virus-mosquito interaction. Annu. Rev. Entomol. 53, 273–291.
Hsieh, Y.H., 2018. Dengue outbreak in Taiwan, 1998-2017: importation, serotype and temporal pattern. Asian Pac. J. Trop. Med. 11(8), 460–466.
Johansson, M.A., Dominici, F., Glass, G.E., 2009. Local and global effects of climate on dengue transmission in Puerto Rico. PLoS Neglect. Trop. Dis. 3(2), e382.
Kanchanapairoj, K., McNeil, D., Thammapalo, S., 2000. Climatic factors influencing the incidence of dengue haemorrhagic fever in southern Thailand. Songkhla Med.
18(2), 77–83.
King, C.C., Wu, Y.C., Chao, D.Y., Lin, T.H., Chow, L., Wang, H.T., et al. 2000.
Major epidemics of dengue in Taiwan in 1981-2000: related to intensive virus activities in Asia. Dengue Bull. 24, 1–10.
Lambrechts, L., Paaijmans, K.P., Fansiri, T., Carrington, L.B., Kramer, L.D., Thomas, M.B., Scott, T.W., 2011. Impact of daily temperature fluctuations on dengue virus transmission by Aedes aegypti. Proc. Natl. Acad. Sci. USA 108, 7460–7465.
Li, Y., Kamara, F., Zhou, G., Puthiyakunnon, S., Li, C., Liu, Y., Zhou, Y., Yao, L., Yan, G., Chen, X.G.., 2014. Urbanization increases Aedes albopictus larval habitats and accelerates mosquito development and survivorship. PLoS Negl. Trop. Dis. 8, e3301.
Luz, P.M., Vanni, T., Medlock, J., Paltiel, A.D., Galvani, A.P., 2011. Dengue vector control stratagies in an urban setting: an economic modeling assessment. Lancet, 37, 1673–1680.
Morin, C.W., Comrie, A.C., Brnst, K., 2013. Climate and dengue transmission:
evidence and implications. Environ. Health Perspect. 121, 1264–1272.
Murray, C.J.L., Ezzati, M., Flaxman, A.D., et al. 2012. GBD 2010: design, definitions, and metrics. Lancet, 380, 2063–2066.
Paaijmans, K.P., Read, A.F., Thomas, M.B., 2009. Understanding the link between malaria risk and climate. Proc. Natl. Acad. Sci. USA 106, 13844–13849.
Pontes, R., Freeman, J., Oliveira-Lima, J.W., Hodgson, J.C., Spielman, A., 2000.
Vector densities that potentiate dengue outbreaks in a Brazilian city. Am. J. Trop.
Med. Hyg. 62(3), 378–383.
Servadio, J.L., Rosenthal, S.R., Carlson, L., Bauer, C., 2018. Climate patterns and mosquito-borne disease outbreaks in South and Southeast Asia. J. Infect. Public Health 11, 566–571.
Shepard, D.S., Zeng, W., Halasa-Rappel, Y.A., et al. 2018. Cost-effectiveness of dengue vaccination in ten endemic countries. Vaccine, 36, 413–420.
Suaya, J.A., Shepard, D.S., Siqueira, J.B., Martelli, C.T., Lum, L.C., Tan, L.H., Kongsin, S., Jiamton, S., Garrido, F., Montoya, R., Armien, B., Huy, R., Castillo, L., Caram, M., Sah, B.K., Sughayyar, R., Tyo, K.R., Halstead, S.B., 2009. Cost of dengue cases in eight countries in the Americas and Asia: a prospective study.
Am J Trop Med Hyg, 80, 846–855.
Taiwan National Infectious Disease Statistics System. (Available at https://nidss.cdc.gov.tw/en/Default.aspx?op=4).
Tsai, J.J., Liu, C.K., Tsai, W.Y., Liu, L.T., Tyson, J., Tsai, C.Y., Lin, P.C., Wang, W.K., 2018. Seroprevalence of dengue virus in two districts of Kaohsuing City after the largest dengue outbreak in Taiwan since World War II. PLoS Negl. Trop. Dis.
12(10), e0006879.
Undurraga, E.A., Betancourt-Cravioto, M., Ramos-Castaneda, J., Martinez-Vega, R., Mendez-Galvan, J., Gubler, D.J., Guzman, M.G., Halstead, S.B., Harris, E., Kuri-Morales, P., Tapia-Conyer, R., Shepard, D.S., 2015. Economic and disease burden of dengue in Mexico. PLoS Negl Trop Dis, 9, e0003547.
Wang, S.F., Chang, K., Loh, E.W., Wang, W.H., Tseng, S.P., Lu, P.L., Chen, Y.H., Chen, Y.A., 2016a. Consecutive large dengue outbreaks in Taiwan in 2014-2015.
Emerg. Microbes Infect. 5(12), e123.
Wang, S.F., Wang, W.H., Chang, K., Chen, Y.H., Tseng, S.P., Yen, C.H., Wu, D.C., Chen, Y.M., 2016b. Severe dengue fever outbreak in Taiwan. Am. J. Trop. Med.
Hyg. 94(1), 193–197.
Wang, W.H., Lin, C.Y., Chang, K., Urbina, A.N., Assavalapsakul, W., Thitithanyanont A., Lu, P.L., Chen, Y.H., Wang, S.F., 2019. A clinical and epidemiological survey of the largest dengue outbreak in southern Taiwan in 2015. Int. J. Infect. Dis. 88, 88–99.
WHO (https://www.who.int/)
World Health Organization. Dengue and severe dengue. Available at https://www.who.int/health-topics/dengue-and-severe-dengue#tab=tab_1.
Xiao, J., Liu, T., Lin, H., Zhu, G., Zeng, W., Li, X., Zhang, B., Song, T., Deng, A., Zhang, M., Zhong, H., Lin, S., Rutherford, S., Meng, X., Zhang, Y., Ma, W., 2018.
Weather variables and the El Nino Southern Oscillation may drive the epidemics of dengue in Guangdong Province, China. Sci. Total Environ. 624, 926–934.
Zhao, X., Chen, F., Feng, X., Li, X., Xhou, XH., 2014. Characterizing the effect of temperature fluctuation on the incidence of malaria: an epidemiological study in south-west China using the varying coefficient distributed lag non-linear model.
Malar. J. 13, 192.
台灣內政部統計處 (https://www.ris.gov.tw/app/portal) 台灣勞動部 (https://www.mol.gov.tw/#)
台灣疾管署 (https://www.cdc.gov.tw)
台灣行政院主計處 (https://www.dgbas.gov.tw/mp.asp?mp=1)
Fig. 1. The time-dependent parameters (a) daily wage, (b) annual per capita GDP, (c) daily caregiver fees, and (d) Ratio of US dollars (USD)/NT dollars (NTD) for the years 2007-2019. Daily caregiver fees of 2019 will be published in May 2020.
20 30 40 50
Total Female
28 30 32 34 36
2007 2008 2009 2010 2011 2012 2013 2014 2015 2016 2017 2018 2019 10000
15000 20000 25000 30000
20 25 30 35
dollars
(b) Annual per capita GDP (A) Daily wage
(c) Daily caregiver fees
(d) Exchange rate
Year US dollars US dollarsUS US dollars
Fig. 2. Weekly-based incidence rate in (A) Tainan and (B) Kaohsiung from 2007 to 2017.
A. Tainan
Weekly-based incidence rate (1/100,000)
B. B. Kaohsiung
Year
0 20 40 60 80 100 120 140 160 180 200
2007 2008 2009 2010 2011 2012 2013 2014 2015 2016 2017
0 10 20 30 40 50 60 70 80 90 100
2007 2008 2009 2010 2011 2012 2013 2014 2015 2016 2017
Weekly-based incidence rate (1/100,000)
Fig. 3. (A, D) Weekly maximum, mean, and minimum temperatures, (B, E) relative humidity and (C, F) rainfall in Tainan and Kaohsiung from 2007 – 2017, respectively.
RH (%)
B
0 25 50 75 100
C
Rainfall (mm)
0 40 80 120 160
2007 2008 2009 2010 2011 2012 2013 2014 2015 2016 2017
Temp (C)
A Tainan
0 10 20 30
Max temp Mean temp Mini temp
R H (%)
E
0 25 50 75 100
Kaohsiung
Temp (C)
D
0 10 20 30 40
Max temp Mean temp Mini temp
Time (year)
0 40 80 120 160
2007 2008 2009 2010 2011 2012 2013 2014 2015 2016 2017
Rainfall (mm) F
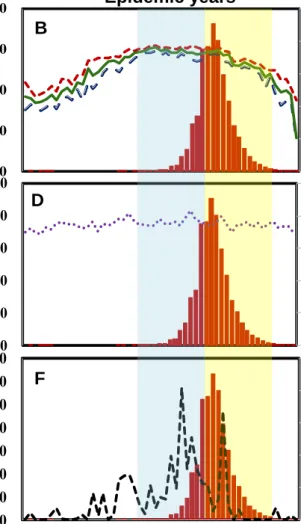
Fig. 4. The overall trend analysis between dengue weekly incidence rates and climate variables of weekly (A, B) mean temperature, maximum temperature and minimum temperature, (C, D) relative humidity as well as (E, F) rainfall intensity during non-epidemic years and epidemic years, respectively, in Tainan.
Time (week)
Weekly incidence rates (1/100,000)
Epidemic years
Temp (C)
0 0.5 1 1.5 2
0 10 20 30 40
Incidence rate Min temp.
Max temp Mean temp.
0 20 40 60 80 100
0 10 20 30
(1/100,000) Weekly incidence rates 40
Temp (C)
0 0.5 1 1.5 2
0 20 40 60 80 100
RH (%) RH (%)
Weekly incidence rates (1/100,000)
0 20 40 60 80 100
0 20 40 60 80
100 (1/100,000) Weekly incidence rates
0 0.5 1 1.5 2
0 10 20 30 40 50 60 70
1 5 9 13 17 21 25 29 33 37 41 45 49 53
Rainfall (mm) Weekly incidence rates (1/100,000)
0 20 40 60 80 100
0 10 20 30 40 50 60 70
1 5 9 13 17 21 25 29 33 37 41 45 49 53
Rainfall (mm) Weekly incidence rates (1/100,000)
Time (week) Non-epidemic years A
C
B
D
E Summer (W36-W48) Fall F
(W23-W35)
Weekly incidence rates (1/100,000) Epidemic years
Temp (C)
0 20 40 60 80
0 10 20 30 40
B
Weekly incidence rates (1/100,000)
Temp (C)
Non-epidemic years
0 0.5 1 1.5 2
0 10 20 30 40
Incidence rate Min temp.
Max temp Mean temp.
A
RH (%) Weekly incidence rates (1/100,000)
0 0.5 1 1.5 2
0 20 40 60 80 100
C
RH (%) Weekly incidence rates (1/100,000)
0 20 40 60 80
0 20 40 60 80 100 D
Rainfall (mm) Weekly incidence rates (1/100,000)
Time (week)
0 0.5 1 1.5 2
0 20 40 60 80
1 5 9 13 17 21 25 29 33 37 41 45 49 53
E
Time (week)
Rainfall (mm) Weekly incidence rates (1/100,000)
0 20 40 60 80
0 20 40 60 80
1 5 9 13 17 21 25 29 33 37 41 45 49 53 Fall F
(W36-W48) Summer
(W23-W35)
Fig. 5. The overall trend analysis between dengue weekly incidence rates and climate variables of weekly (A, B) mean temperature, maximum temperature and minimum temperature, (C, D) relative humidity as well as (E, F) rainfall intensity during non-epidemic years and epidemic years, respectively, in Kaohsiung.
Fig. 7. Economic burden of dengue from 2007 to 2015. Cost assessment includes (a)direct and (c)indirect costs. We estimated the direct and indirect costs during epidemic and non-epidemic years, and analysed the proportional contributions of (b) direct and (d) indirect costs.
US dollars (million)
0 1 2 3 4 5 6 7 8 9 10
2007 2008 2009 2010 2011 2012 2013 2014 2015
(b) Percentage (%) (a) Direct costs
Outpatient Hospitalization Emergency Drug
Epidemic Non-epidemic
0 10 20 30 40 50 60
2007 2008 2009 2010 2011 2012 2013 2014 2015
(c) Indirect costs (d) Percentage (%)
Lost productivity (DF, adult) Lost productivity (DF, children mother) Lost productivity (DHF/DSS, adult) Lost productivity (DHF/DSS, children mother) Lost productivity (Death)
Caregiver fee
Epidemic Non-epidemic
US dollars (million)
Year
Fig. 8. Predicted Disability-adjusted life-years (DALYs) for different vaccine coverage rate
0 500 1000 1500 2000 2500 3000 3500
YLD YLL
0 500 1000 1500 2000 2500 3000 3500 4000
YLD YLL
0 500 1000 1500 2000 2500 3000 3500 4000
YLD YLL
0 500 1000 1500 2000 2500 3000 3500 4000
2007 2008 2009 2010 2011 2012 2013 2014 2015
YLD YLL
(a) 25% coverage
(b) 50% coverage
(c) 60% coverage
(d) 75% coverage
DALYsDALYsDALYsDALYs
(A) 25% coverage
(B) 50% coverage
(C) 60% coverage
(D) 75% coverage
Years
23
Fig. 9. Prediction of direct costs for the dengue vaccination.
0 1 2 3 4 5 6 7 8 9 10
2007 2008 2009 2010 2011 2012 2013 2014 2015 0
1 2 3 4 5 6 7 8 9 10
0 1 2 3 4 5 6 7 8 9 10
0 1 2 3 4 5 6 7 8 9 10
A. Direct cost
US dollars (milli
(a) 25% coverage
(d) 75% coverage (c) 60% coverage (b) 50% coverage
US dollars (per million) US dollars (per million) US dollars (per million) US dollars (per million)
(a) 25% coverage
Years
Table 1
Points value of outpatient, hospitalization, emergency, and drug services, and average point-value fees.
Years Point values of different services
Floating point-value fee
Average point-value fee
Point values
Medical point-value (A)
Outpatient
(B)
Hospitalizati on
(C)
Emergency
(D) Drug
2007 1,070,830 22,507,061 833,191 0.9135 0.9479 ND 1.0000 2008 226,313 7,656,313 450,906 0.9033 0.9428 ND 1.0000 2009 315,803 7,368,949 733,257 0.9021 0.9419 ND 1.0000 2010 610,526 11,366,690 938,844 0.9079 0.9445 ND 1.0000 2011 483,981 8,662,283 939,323 0.8746 0.9252 5724 1.0000 2012 584,781 9,138,195 991,353 0.8844 0.9303 10095 1.0000 2013 289,015 723,740 434,725 0.8870 0.9343 5673 1.0000 2014 6,053,830 77,213,001 6,669,694 0.8802 0.9298 47,592 1.0000 2015 35,296,579 224,788,230 47,055,903 0.8958 0.9385 485,808 1.0000
ND: no data.
Table 2
Indirect costs assessment and calculation equations.
Items Population Estimating equations Lost productivity
value (Reported DF cases)
Adult (Reported DF cases) × (Fraction of cases among adults) × (Fraction of adults who are employed) × (Daily wage) × (No. of
workdays lost due to DF) Femalesa (for
caring of children)
(Reported DF cases) × (Fraction of cases among children) × (Fraction of employed females who have children) × (Daily wage of mother) × (No. of workdays lost due to DF)
Lost productivity value (Reported DHF, DSS cases)
Adult (Reported DHF/DSS cases) × (Fraction of cases among adults) × (Fraction of adults who are employed) × (Daily wage) × (No.
of workdays lost due to DHF/DSS) Femalesa (for
caring of children)
(Reported DHF/DSS cases) × (Fraction of cases among children) × (Fraction of employed females who have children) × (Daily wage of mother) × (No. of workdays lost due to DHF/DSS)
Lost productivity value due to death
(Death cases due to dengue) × (Life years lost) × (Annual per capita GDP)/(1.03life
years lost
)
Caregiver fees (Reported DHF/DSS/death casesb) × (Daily caregiver fee) × (No. of days of
hospitalization per reported DHF/DSS/death case)
a In the case of females’ lost productivity value, we assumed that children are taken care of by their mothers.
b We assumed that the patients of DHF/DSS/death need to be looked after by caregiver.
Table 3
Parameters used to estimate indirect costs.
Parameters Value References
No. of workdays lost due to DF Adult 5.4 Suaya et al., 2009 Chidren
(mother)
2.2 Suaya et al., 2009
No. of workdays lost due to DHF, DSS
Adult 9.8 Suaya et al., 2009 Chidren
(mother)
3.7 Suaya et al., 2009
No. of days of hospitalizations per DHF case
3.5 Undurraga et al., 2015
Fraction of cases among adults 0.75 Luz et al., 2011
Fraction of adults who are employed 0.9 National Statistics, R.O.C (Taiwan)
Daily wage See figure. 3 Directorate-General of Budget,
Accounting and Statistics, Executive Yuan, R.O.C (Taiwan)
Fraction of cases among children 0.25 Luz et al., 2011 Fraction of employed females who
have children
0.5 National Statistics, R.O.C (Taiwan)
Daily wage of mother See figure. 3 Directorate-General of Budget, Accounting and Statistics, Executive Yuan, R.O.C (Taiwan)
Annual per capita GDP See figure. 3 Directorate-General of Budget, Accounting and Statistics, Executive Yuan, R.O.C (Taiwan)
Caregiver fees See figure. 3 Ministry of Labor, R.O.C (Taiwan)
Table 4
2014 Tainan, Kaohsiung dengue incidence (per million population per year).
Age group Tainan Kaohsiung
Population Dengue cases Incidence Population Dengue cases Incidence
0-4 74,881 1 13.3547 107,291 148 1381.331
5-9 77,904 2 25.67 114,443 424 3718.7
10-14 96,867 6 61.94 144,634 671 4660.9
15-19 119,036 8 67.21 177,674 838 4738.9
20-24 128,151 13 101.5 187,375 971 5209.1
25-29 133,632 13 97.29 190,120 920 4862.6
30-34 161,324 18 111.6 235,233 1,095 4676.7
35-39 155,784 15 96.3 239,040 1,189 4998.9
40-44 139,714 15 107.4 221,223 1,108 5033.7
45-49 149,331 7 46.88 222,429 1,213 5483.3
50-54 156,488 14 89.47 222,420 1,372 6206.8
55-59 141,801 17 119.9 209,962 1,439 6900.9
60-64 114,338 8 69.97 180,914 1,371 7636.1
65-69 66,843 6 89.77 106,526 977 9256.4
70+ 166,852 13 77.92 217,956 1,263 5828.5
Table 5
2015 Tainan, Kaohsiung dengue incidence (per million population per year).
Age group
Tainan Kaohsiung
Population Dengue cases Incidence Population Dengue cases Incidence
0-4 77,672 324 4188.86 110,195 301 2739
5-9 75,441 530 7075.06 109,998 532 4859.96
10-14 91,028 926 10277.24 135,258 843 6271.62
15-19 115,857 1,248 10889.2 173,626 1,109 6428.35
20-24 127,094 1,629 12983.7 186,945 1,157 6227.53
25-29 129,812 1,408 10965.39 185,565 1,123 6088.63
30-34 157,291 1,561 10023.76 226,531 1,289 5722.73
35-39 160,873 1,567 9836.42 243,107 1,449 5996.08
40-44 138,365 1,324 9661.34 219,746 1,298 5941.92
45-49 147,630 1,464 10016.01 222,261 1,256 5683.13
50-54 156,424 1,785 11543.01 222,632 1,542 6974.54
55-59 144,104 2,160 15217.27 210,509 1,815 8696.94
60-64 121,498 2,066 17298.55 190,831 1,905 10083.31
65-69 73,535 1,457 20214.21 117,939 1,431 12282.42
70+ 168,453 3,311 20049.41 223,133 2,673 12124.65
Table 6
Results of Spearman's coefficient of rank correlation for time-lag effects. Boldface denotes the largest value of correlation coefficient.
Non-Epidemic years Epidemic years
Time-lag (months)
Mean temp.
(°C)
Max.
temp.
(°C)
Mini temp.
(°C)
Rainfall (mm)
RH (%)
Time-lag (months)
Mean temp.
(°C)
Max.
temp.
(°C)
Mini temp.
(°C)
Rainfall (mm)
RH (%)
Tainan
0 0.07 0.05 0.05 4E-05 0.08 0.16 0.16 0.17 0.08 0.09 1 0.30 0.26 0.28 0.15 0.23 1 0.21 0.22 0.20 0.46 0.19 2 0.49 0.44 0.49 0.48 0.41 2 0.24 0.22 0.25 0.21 0.07 3 0.55 0.52 0.56 0.56 0.34 3 0.25 0.22 0.29 0.005 0.02 4 0.56 0.54 0.56 0.41 0.17 4 0.16 0.15 0.16 0.02 0.17
5 0.44 0.45 0.44 0.20 5 0.05 0.07 0.03
6 0.21 0.24 0.21 6 0.01 0.0002 0.04
Kaohsiung
0 0.0027 0.01 1E-05 0.04 0.04 0.0016 0.0002 0.004 0.04 0.0002 1 0.14 0.11 0.17 0.01 0.12 1 0.06 0.04 0.07 0.001 0.02 2 0.39 0.34 0.41 0.20 0.30 2 0.20 0.19 0.20 0.14 0.16 3 0.53 0.48 0.54 0.51 0.47 3 0.31 0.30 0.31 0.55 0.35 4 0.63 0.59 0.64 0.53 0.28 4 0.48 0.44 0.49 0.28 0.30
5 0.64 0.62 0.64 0.40 5 0.58 0.54 0.61
6 0.51 0.53 0.49 6 0.42 0.42 0.40
a Bold face denotes the largest value of correlation coefficient obtained from the cross-correlation analyses.
Table 7
Statistics of best Poisson GLM models of the weekly dengue incidence rate (2007–2017) on the meteorological factors in Tainan and Kaohsiung during epidemic and non-epidemic periods.
Tainan
Non-epidemic years
Tainan
Epidemic years
β p β p
Mean temp. (Lag 1) 0.0123 <.0001 Max temp. (Lag 2) 0.0351 <.0001 Mean temp. (Lag 4) 0.0137 <.0001 Rainfall (Lag 1) 0.0103 <.0001 Rainfall (Lag 2) 0.0101 <.0001 Rainfall (Lag 3) 0.0960 <.0001 RH (Lag 1) 0.0112 <.0001
AIC 352.86 AIC 16562
Kaohsiung Non-epidemic years
Kaohsiung Epidemic years
β p β p
Mini temp. (Lag 5) 0.0125 <.0001 Rainfall (Lag 2) 0.0101 <.0001 Mean temp. (Lag 2) 0.0135 <.0001 RH (Lag 3) 0.0125 <.0001 RH (Lag 4) 0.0124 <.0001
AIC 300.72 AIC 31604
Table 8
Vaccination costs by coverage and vaccine price (million US$).
Vaccine price (US$/3 doses)
Coverage
25% 50% 60% 75%
10 1.87 3.74 4.49 5.61
60 11.23 22.45 26.94 33.68
100 18.71 37.42 44.90 56.13
150 28.06 56.13 67.35 84.19
200 37.42 74.83 89.80 112.25
250 46.77 93.54 112.25 140.31
300 56.13 112.25 134.70 168.38
Table 9
Incremental cost-effectiveness ratios by coverage and vaccine price (US$/DALYs).
Vaccine price (US$/3 doses)
Coverage
25% 50% 60% 75%
10 71,587 71,587 71,587 71,587
60 517,988 517,988 517,988 517,988
100 875,109 875,109 875,109 875,109
150 1,321,510 1,321,510 1,321,510 1,321,510
200 1,767,911 1,767,911 1,767,911 1,767,911
250 2,214,312 2,214,312 2,214,312 2,214,312
300 2,660,714 2,660,714 2,660,714 2,660,714
Appendix Table 1. Statistical description for each meteorological data during 2007 to 2017 in Tainan’s Environmental Monitor Station (EMS).
Variables Tainan Tainan
Average Tainan Annan Shanhua Xinying
Min temperature
AVG 22.77 22.85 22.66 22.52 22.70
SD 5.32 5.36 5.02 5.28 5.24
Min 6.48 7.40 9.22 6.60 7.43
Q1 18.04 17.97 18.26 17.85 18.03
Q2 24.26 24.48 24.28 23.68 24.17
Q3 27.24 27.38 26.85 27.06 27.13
Max 31.10 31.76 30.08 30.69 30.91
Average temperature
AVG 24.70 24.84 24.49 24.45 24.62
SD 4.51 4.66 4.33 4.55 4.51
Min 13.11 14.07 13.46 13.43 13.52
Q1 20.75 20.67 20.78 20.40 20.65
Q2 25.82 26.02 25.77 25.44 25.76
Q3 28.59 28.94 28.26 28.43 28.56
Max 31.42 31.96 30.86 31.18 31.35
Max temperature
AVG 26.39 26.58 26.11 26.18 26.31
SD 3.89 4.10 3.79 3.98 3.94
Min 15.35 15.51 15.60 15.51 15.49
Q1 23.44 23.46 23.40 23.19 23.37
Q2 27.24 27.52 27.26 27.05 27.27
Q3 29.63 30.15 29.35 29.57 29.68
Max 35.16 32.78 32.00 31.84 32.95
RH
AVG 74.60 74.40 78.19 75.83 75.75
SD 5.97 4.97 5.37 5.34 5.41
Min 53.71 55.51 59.36 57.07 56.41
Q1 70.88 71.37 75.00 72.45 72.43
Q2 74.83 74.50 78.55 75.96 75.96
Q3 78.55 77.75 81.83 79.21 79.33
Max 91.99 87.92 93.28 92.45 91.41
Rainfall
AVG 9.45 8.78 11.68 12.65 10.64
SD 18.68 16.75 24.61 21.98 20.51
Min 0.00 0.00 0.00 0.00 0.00
Q1 0.00 0.00 0.00 0.00 0.00
Q2 1.50 1.50 2.50 4.00 2.38
Q3 11.00 11.21 11.50 14.63 12.08
Max 131.63 121.10 204.50 152.50 152.43
計畫主持人:陳詩潔 計畫編號:108-2313-B-040-001-
計畫名稱:以病毒-宿主-環境交互動態模式結合成本效益分析評估疫苗使用影響延續計畫
成果項目 量化 單位
質化
(說明:各成果項目請附佐證資料或細 項說明,如期刊名稱、年份、卷期、起 訖頁數、證號...等)
國
內 學術性論文
期刊論文 0
研討會論文 4 篇
1.李佳蓁、陳詩潔*。氣候因素對臺灣食 源性疾病發生率的影響。2020台灣公共 衛生學會聯合年會。台北(國立臺灣師範 大學)。中華民國一零九年十月十七-十 八日。
2.黃翊涵、李佳蓁、陳詩潔*、林煒宸、
張琇慈。台南地區登革熱流行年與非流 行年發生率與天氣因子相關性。2020風 險分析研討會。台中(中國醫藥大學)。
中華民國一零九年七月三十一日。
3.黃翊涵、陳詩潔*。高雄地區登革熱流 行年與非流行年發生率與天氣因子相關 性。2019台灣公共衛生學會。台北(台灣 大學)。中華民國一零八年九月二十八日
。
4.高薇栩、賴柏儒、陳詩潔*。以實驗性 人類感染資料驗證登革熱原發性與繼發 性病毒動態模型。2019台灣公共衛生學 會。台北(台灣大學)。中華民國一零八 年九月二十八日。
專書 0 本
專書論文 0 章
技術報告 0 篇
其他 0 篇
國
外 學術性論文
期刊論文 0
研討會論文 0 篇
專書 0 本
專書論文 0 章
技術報告 0 篇
其他 0 篇
參 與 計 畫 人 力
本國籍
大專生 4
人次
李為誼 黃翊涵 高薇栩 李佳蓁
碩士生 0
博士生 0
博士級研究人員 0
專任人員 0
非本國籍 大專生 0
博士生 0
博士級研究人員 0
專任人員 0
其他成果
(無法以量化表達之成果如辦理學術活動
、獲得獎項、重要國際合作、研究成果國 際影響力及其他協助產業技術發展之具體 效益事項等,請以文字敘述填列。)