Department of Business Administration
I-Shou University
Master Thesis
The Impact of Service Quality and Customer
Satisfaction on Customer Loyalty - The Case of
Eximbank
Advisor:
Dr. Wan Ching Chang
Co-Advisor:
Dr. Nguyen Dang Huy
Graduate Student:
DO VAN LINH
Acknowledgements
First, I would like to express my gratitude to Dr. Wanching Chang and Dr. Nguyen Dang Huy, my advisors for giving me the valuable knowledge backgrounds, feedbacks and comments before and during the time of writing this Thesis.
I also would like to thank my family for their care and kindness that go beyond the Thesis as always. Thanks my colleagues in Eximbank and partners for giving me good conditions, supports and comments for the thesis completion that would be a wonderful experience of my life. All of the mistakes in this thesis are solely my responsibility.
Abstract
In Vietnam, the financial section plays an important role in economy. The large amount of money invests in and a large profit the customers and the banks receive makes this industry more and more developed. There are many banks in Vietnam, the Vietnamese have had many opportunities for choosing the best bank to invest. The objectives of this study are to investigate the impact of service quality and customer satisfaction on customer loyalty, using the case of Eximbank. 220 questionnaires have been collected and analysis. The results show that customer satisfaction and customer loyalty were affected by service quality. The result also found that the customer satisfaction has a strong positive impact on customer loyalty, meaning H1, H2, H3 of this study was accepted. Regarding to the result of multiple regression, two variables are not the predict factors of customer satisfaction including H1a and H1b statements of “Reliability factor has a significant impact on customer satisfaction” and “Responsiveness factor has a significant impact on customer satisfaction”. The hypothesis H4 was tested for the differences between demographic variable of customer on customer loyalty for banking service of Eximbank. The result shows that there are no differences between demographic (gender, age, education and incomes) variable of customer on customer loyalty for banking service of Eximbank.
Keywords: Service quality, customer satisfaction, customer loyalty, Vietnam banking industry, Eximbank
Table of contents
Acknowledgements ...i Abstract ... ii List of Tables ... v List of Figures ... vi Chapter I Introduction ... 1 1.1 Background ... 11.2 Overview Vietnamese banking sector and EximBank ... 2
1.2.1 Vietnamese banking sector ... 2
1.2.2 EximBank ... 3
1.3 The objectives of the study ... 4
1.4 The research questions ... 4
1.5 The contributions of research ... 5
1.6 Research outline ... 5
Chapter 2 Literature review ... 6
2.1 The theory of services and its characteristic ... 6
2.1.2 Service theory ... 6
2.1.2 Service characteristic ... 6
2.2 Service quality and service quality model ... 7
2.2.1 Service quality ... 7
2.2.2 SERQUAL model ... 10
2.3 Customer satisfaction ... 11
2.4 Model of customer satisfaction ... 12
2.5 Customer satisfaction and customer’s loyalty in banking industry ... 13
2.6 Relationship between service quality, customer satisfaction and customer loyalty... 14
2.7 Demographic factor and its effect on customer loyalty ... 16
2.8 Research frame work and hypothesis ... 17
3.1 Introduction ... 19 3.2 Sample designed ... 19 3.3 Questionnaire designed ... 19 3.4 Analysis ... 21 3.4.1 Reliability analysis... 21 3.4.2 Regression analysis ... 22 3.4.3 T - Test, ANOVA ... 23 Chapter 4 Results... 24 4.1 Demographic information ... 24 4.2 Reliability analysis ... 25 4.3 Regression analysis ... 28
4.3.2 The impact of customer satisfaction and customer’s loyalty ... 30
4.3.3 The impact of service quality and customer’s loyalty ... 30
4.4 T-test and ANOVA ... 31
4.4.1. The different customer loyalty level among male and female ... 31
4.4.2 The different customer loyalty level between age group. ... 32
4.4.3 The different customer loyalty level between education groups ... 32
4.4.4 The different customer loyalty level between income groups ... 33
4.5 Discussion ... 33
Chapter 5 Conclusion and Recommendation ... 36
5.1 Research Summary ... 36
5.2 Research contribution ... 36
5.4 Recommendation ... 39
5.5 Research limitation ... 40
References ... 41
Appendix A: Questionnaire (English Version) ... 44
List of Tables
Table 3.1 Variables and its items ... 20
Table 4.1 Respondent profile ... 24
Table 4.2 Items scale descriptive ... 26
Table 4.3 Cronbach’s alpha ... 27
Table 4.4. Multiple regression of 5 sub-factor of service quality and customer satisfaction ... 28
Table 4.5 Regression of service quality and customer satisfaction... 29
Table 4.6 The impact of customer satisfaction and customer’s loyalty ... 30
Table 4.7 The impact of service quality and customer’s loyalty ... 31
Table 4.8 The different customer loyalty level among male and female ... 32
Table 4.9 the different customer loyalty level between age group. ... 32
Table 4.10 The different customer loyalty level between education group... 33
Table 4.11 The different customer loyalty level between income groups ... 33
List of Figures
Figure 2.1: The Integrated Gaps Model of Service Quality ... 9
Figure 2.2 American Customer Satisfaction Index – ACSI ... 13
Chapter I Introduction
1.1 Background
International integration has opened up many opportunities, but also poses many challenges for organizations providing banking services to compete fiercely with foreign banks not only strong financial strength but also has extensive experience in the development of modern in banking services (Bessis, 2015). Under pressure to provide competitive banking services and the rapid development of information technology, 2015 is considered the year "boom" of retail banking services, enhanced access to customer groups’ individuals, small and medium enterprises.
As reports of General Statistics Office of Vietnam (2014), Vietnam's population is estimated to rise to 90 million by 2015 (GSOV, 20141). With the increasing income of the people, there is increasing potential market of the commercial banks, the goal of non-cash payments attention. Thus, the strategic development of the retail bank Eximbank will focus specifically on individual customers with retail products rich, professionally, in accordance with the needs and capabilities of each object, each division different customer segment with the goal of building a system of retail banking services with quality, safety and economic efficiency on the basis of strengthening international economic integration, expanding the banking services market retail commitments under bilateral and multilateral, bank technology application and development of advanced rational distribution network to supply adequate, timely and convenient products and convenient banking service for all customers (Leung, 2009). With consumer trends changing needs of life, this requires a strategy and Eximbank have new solutions towards multifunctional retail bank. To meet the demand for services increasing bank customers, as well as race to a fierce competition among banks, Eximbank is trying to expand its network, diversified product retail, enhanced retail service quality, improve service style "god", aiming to soon realize the goal of becoming the financial conglomerate versatile leading retailers, striving to develop care systems retail banking services on par with other countries in the region in variety, quality and competitiveness, gradually enhance the reputation and brand of Eximbank on international financial markets
1
General Statistics Office of Vietnam (2014) population report, retrieved from
http://www.statistics.gov.rw/about-us/news/general-statistics-office-gso-vietnam-(Lee, 2009). From this reality, the revaluation of real quality of banking service commercial bank of Vietnam Export Import bank as well as solutions to improve quality of retail services in the near future in order increasing levels of customer satisfaction, the authors were interested and choose to study the topic. This study was done for no purpose and the author hopes to get more feedback to issue more complete study.
Banks safeguard money and valuables and provide loans, credit, and payment services, such as checking accounts, money orders, and cashier's checks. Banks also may offer investment and insurance products, which they were once prohibited from selling. As a variety of models for cooperation and integration among finance industries have emerged, some of the traditional distinctions between banks, insurance companies, and securities firms have diminished. Even though all these changes have occurred, banks continue to maintain and perform their primary role which is accepting deposits and lending funds from these deposits (Dinh & Pickler, 2012).
1.2 Overview Vietnamese banking sector and EximBank
1.2.1 Vietnamese banking sector
There are several types of banks which differ in the number of services they provide and the clients that they serve. Although some of the differences between these types of banks have lessened as they begin to expand the range of products and services they offer, there are still key distinguishing traits. Commercial banks dominate the industry and they offer a full range of services for individuals, businesses, and governments. These banks come in a wide range of sizes from large global banks to regional and community banks. Global banks are involved in international lending and foreign currency trading in addition to the more typical banking services (Thi Minh Hue, 2015). Regional banks have numerous branches and automated teller machine (ATM) locations throughout a multi-state area that provide banking services to individuals. Banks have become more oriented toward marketing and sales. As a result, employees need to know about all types of products and services offered by banks. Community banks are based locally and offer more personal attention, which many individuals and small businesses prefer. In recent years, online banks have started which provide all services entirely over the Internet and have entered the market with some success. Many traditional banks have also expanded to offer online banking, and some formerly
As mentioned by Thi Minh Hue (2015), the year of 2014 is considered a difficult year for most businesses, but the situation does not apply to the banking industry. The banking section is still having a bright future profit before tax of nine banks (parent) reached more than 29,200 billion, up 35% in 2010. Accordingly, profit before tax of 9 commercial banks in 2011 totaled 29,202 billion, up 35% over the previous year in which the CTG and the EIB are the two banks may increase profit before tax (PBT) with the largest ratio of 77% and 72%, CTG is also the largest bank with 7782 PBT billion. There are two profitable banks in 2011 is down from HBB (down 27%) and NVB (down 2%).
All of these transferring affect the analysis of consumer behavior which requires the consideration of various processes internal and external to the individual. To understand behavior, it is necessary to examine the complex interaction of many influencing elements, such as the determinants of consumer culture: social class, household influences, personality, lifestyle, values, and social influences.
There are many factors that affect the customer’s behaviors which is included both external and internal. This project give a general look of the Vietnamese banking section so that we can examine what are the influencing factor to loyalty of customers
1.2.2 EximBank
Established in 1989, Eximbank (EIB) stands for the name of Vietnam Export Import Bank, and being one of the first joint-stock commercial banks of Vietnam, EIB now has a charter capital estimated about VND 2,800 billion. The EIB has a nation-wide network, with 27 in branches and 36 transaction officers; the number of total employees is approximately 2,360. Also, EIB has established correspondent banking relationship with over 640 banks in 65 countries worldwide.
Like other Vietnamese domestic commercial banks, EIB eximbank has all kinds of banking services. Moreover, EIB provides full range of services as an international bank. EIB also has many advantages of the International Settlement because of the experiences and well training senior staff. Furthermore, the Foreign Currencies and Gold Trading of EIB provide good service products with Spot, Forward, Gold Option and Gold Trading products to customers. EIB is the first domestic commercial bank that gives the forecasting news of
the motto: “All for the success of customers” and a message from the chairman of the Board of Director: “continue to improve the leadership, management method and cost management of the bank for the profits goals”, EIB, in years of 2011, would expand its total transaction network to 60 ones in the upcoming years. The EIB’s target is building a good quality of banking system that gets IT infrastructure to meet the need of hi-tech banking services’ development, as well as enhancing the quality of products and services to optimally serve its diversified customer needs.
Today, the author is the senior staff in EIB’ services, therefore, the author wants to assess the strategy of EIB at present based on the external and internal resources. By the findings of this study, the author provides some recommendations on EIB’s strategy and gives some advices to the implementation of the strategic planning.
1.3 The objectives of the study
The objectives of this study are to:
1. Provide an overview of literature about service quality and the impacts on the banking service.
2. Study the impacts of service quality and customer satisfaction on customer loyalty. 3. Test whether there is any difference between demographic factors and customer
loyalty.
1.4 The research questions
To achieve the research objectives, this study is going to answer following questions:
RQ 1: Do the service quality impact on the customer satisfaction that used EIB service?
RQ 2: Do the customer satisfaction impact on customer‘s loyalty in EIB service?
RQ 3: Is the any difference from customer demographic (Gender, Age, Education and Income) on customer’s loyalty?
1.5 The contributions of research
This thesis has synthesized the theory of services quality, quality assessment models in general services and banking services in particular, the impact of service quality on customer satisfaction and customer loyalty, service quality and standard of customer loyalty; pointing out the similarities and differences as well as assessing the quality trends in general services and in particular retail services in the world.
1.6 Research outline
The research will include 4 parts: introduction, literature review, methodology, result and conclusion.
Chapter 1 aims to show a general look about the Vietnamese banking section as well as the Eximbank. The objective of research, research question and research contributes were introduced in this chapter.
Chapter 2 contains the literature review that is used in the research. There is almost the theory of customers behaviors and the how to make the customers satisfaction
Chapter 3 is methodology. quantitative method is used in this studyto collect the data
Chapter 4 analyze the data from chapter 3 and the finding is given.
The last chapter is conclusion; the researcher shows some conclusions from the study and giving the recommendation for banking sector, for Eximbank in particular.
Chapter 2 Literature review
2.1 The theory of services and its characteristic
2.1.2 Service theory
There are many perspectives and different definitions for the concept of service. According Zeithaml (2000), the service is the act, process, how to perform a particular job in order to create value for customers to satisfy the needs and expectations of customers. According to Kotler & Armstrong (2007), services are what businesses can offer to customers to establish, strengthen and expand these relationships and long-term cooperation with customers.
In today's life we have known so many exchanges are referred to as service and reverse service includes many of the types of activities and professional exchanges in the fields and at different levels. There have been many concepts, definitions of services but to have this service envisioned in scientific research, we refer to a concept of basic services. The dictionary of Vietnamese stated that service work is direct service to certain needs of the majority, it has organized and paid (dictionary Vietnamese, 2004, p. 256).
In summary, there are many service concepts are stated under different angles. However, this study uses the service concept as: Service operation is intentionally in order to meet certain needs of customers. Features of the service are non-existent in specific product types (tangible) as goods directly but it serves certain needs of society.
2.1.2 Service characteristic
Services have distinctive characteristics compared to other products, such as intangible, heterogeneous, inseparable, perishable, non-refundable, demand uncertainty ( Zeithaml, 2000, Thongsamak, 2001):
Invisible: this is the basic characteristic of the service. This feature indicates the service
is invisible, non-existent as an object. Due to nonexistence of services, it creates difficulties for manufacturing operations management service provider, marketing more difficult for service and more difficult for service identification.
Heterogeneous: products and services are not standardized. Firstly because of the
provision, the staff provided cannot create the same services in the different working time. Furthermore customer is the consumer who decides the quality of service based on their feelings in different times, the feeling is different, different customers have different perception. Products and services worth while satisfying individual needs of our customers. Therefore the service provider typically implement personalization, escape from the regulation, that has added to different degrees. Services at the output invisible and cannot be measured and regulations.
Inseparable: products and services associated with the provision of services. These
products and services can be heterogeneous systemic, both from the structure of basic services develop. Production processes associated with service consumers. Consumers are also involved in producing their service providers. Thus the production of services to be vigilant, to customers, there is demand, the manufacturing process can be conducted.
Ease broken: Service cannot inventory, not stored and cannot be transported from this
area to other areas. Thus the service consumer is limited by time.
Also from this characteristic that makes imbalanced supply-demand balance of local relations between different times in the same time.
Do not be refunded: if customers are not satisfied, they can be reimbursed but could
not complete the service.
Demand uncertainty: uncertainty demand higher service more tangible products.
2.2 Service quality and service quality model
2.2.1 Service quality
In recent decades, the quality of services has been identified as a factor in strategic competition. Quality of service is a very broad category and complex, reflecting the general economic content, technology and society. Given the complexity that this is therefore a lot of different concepts of quality, can be seen, depending on the approach that the concept of quality is understood in different ways, each interpretation are scientific basis learn to tackle
objectives, certain tasks in practice. Some experts have defined quality of service quality as follows:
According to ISO 8402, the quality of service is "Gather the characteristics of an object, giving the audience the ability to satisfy the requirements outlined or potential". Can understand the service quality is customer satisfaction as measured by the difference between quality expectations and quality achieved. If lower quality expectations of quality achieved, service quality is superb, if quality is greater than the quality expectations to achieve the service quality is not guaranteed, if the quality expectations of quality achieved the quality of service guarantees.
According to Lenat, & Feigenbaum (1991, p.185)., "Quality is the customer's decision is based on practical experience with the product or service, measured based on customer requirements, these requirements can be or not yet, be conscious or simply feel, totally subjective or professional nature and always represent the real target in a competitive market”.
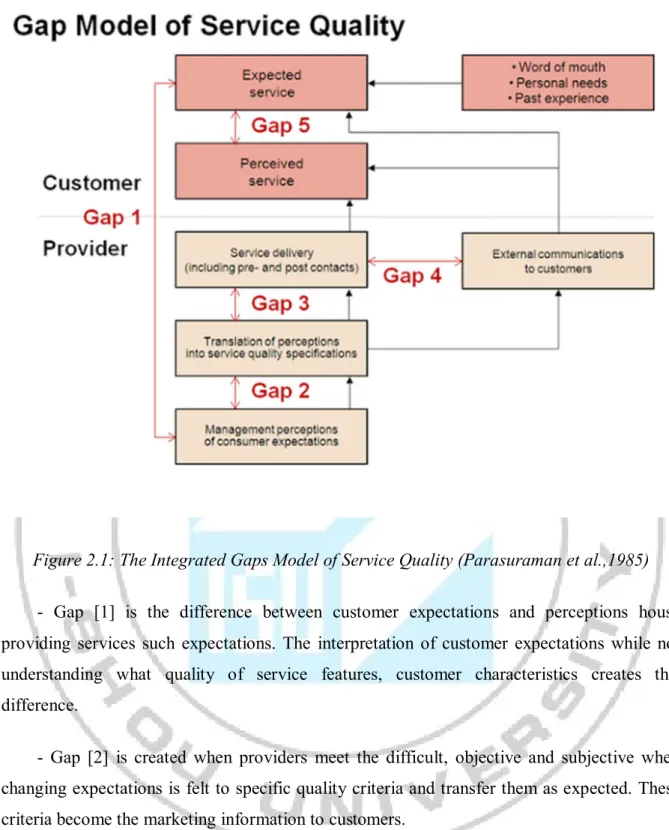
Quality of service is a service level that meets the needs and expectations of customers (Christopher, Ballantyne & Pelton,1995).) Each client often feel differently about quality, so customer involvement in the development and assess the quality of service is very important. In the service sector, quality is a function of customer awareness. In other words, the quality of service is determined based on perceptions, or feelings of customer related to their individual needs. Parasuraman et al (1985: 1988,), quality of service is the gap between customer expectations customers and their perception when used across services. He is considered to be among the first research service quality in a specific and detailed in the marketing field with making model 5 gap in service quality (Figure 2.1).
Figure 2.1: The Integrated Gaps Model of Service Quality (Parasuraman et al.,1985) - Gap [1] is the difference between customer expectations and perceptions house providing services such expectations. The interpretation of customer expectations while not understanding what quality of service features, customer characteristics creates this difference.
- Gap [2] is created when providers meet the difficult, objective and subjective when changing expectations is felt to specific quality criteria and transfer them as expected. These criteria become the marketing information to customers.
- The gap [3] formed when staff transferred to the customer service incorrect multi criteria. Role direct teller very important in creating quality services.
- The gap [4] is the difference between services delivered and customer information receive. This information can raise expectations but may reduce the quality of service when the customer feels not realize exactly what was promised.
- The gap [5] formed from the difference between perceived quality and quality when customers expect quality service consumption. Parasuraman et al. (1985) states that quality service is the distance. This distance depends on 4 distances before. Food quality assurance and service quality improvement is to reduce and eliminate the gap in service quality model (Figure 2.1) By the definition above, it may have noticed problems accessing quality concept. The level of service is to meet the needs, the desires of the customer's experts quality in the current period. Service quality has the following characteristics:
- Quality is the satisfaction of customer needs, if a service product that does not reflect the needs of customers, it is considered to be of poor quality.
- Because quality is measured by the satisfaction level of demand, it should fluctuate over time, space and conditions of use.
- The needs of the customer can be clearly disclosed in the form of regulations and standards but also the demands that customers feel during and after the end of the process used.
2.2.2 SERQUAL model
Based on service quality model Parasuraman et al. (1985), there are 10 components: (1) Tangible Media; (2) Trust; (3) Meeting; (4) Capability to serve; (5) Access; (6) An necessary; (7) Information; (8) Trust; (9) Security; (10) Understanding. This scale covers almost every aspect of the service, however, the scale showed the complexity of the measure, not worth distinguishing in several instances. Therefore, the researchers launched servqual 5 components with 20 observed variables, in particular the following components:
1. Tangibles: external expression of physical facilities, equipment, personnel and materials, information tool.
2. Reliability: the ability to perform appropriate service and accurate with the what has the commitment, promise.
3. Responsiveness desired level and ready to serve customers in a timely manner.
4. Assurance: knowledge, professional and elegant style of service staff; ability to make customers trust.
5. Empathy: express kindness, personal attention to every customer.
In fact, the measure SERVQUAL three segments. The first two segments, each segment was 22 observed variables measuring the quality of service that customers expect and real economic sense. After much study and application expertise, recognized SERVQUAL as a valuable scale theory as well as practical. However, there is still much debate, critique, questioning streak hang this measure, especially in terms of generality and quality measurement effect. One more thing can see the measurement procedures SERVQUAL quite lengthy. Thus, there appeared a variant of SERVQUAL is SERVPERF.
This scale was introduced by Thongsamak, (2001), determine the quality of service by only measuring perceived service quality (instead measure the perceived quality and expected as SERVQUAL). The two men said that service quality is best reflected by the perceived quality without quality expectations, also, evaluating the weight of the 5 components. Note that due originating from servqual, components and observed variables SERVPERF of this scale holds as SERVQUAL. Measurement model is called model felt (Perception model). Both the non-assertion model and models all have felt further research use. It is noteworthy that the results of these studies show that hard to conclude which model is improper or even more properly.
2.3 Customer satisfaction
According to Oliver (1999), the satisfaction is the reaction of consumers to the desires are met. This definition implies that satisfaction is the satisfaction of consumers in the consumption of products or services it wishes their response, including response levels above and below the desired level the desired level. According Tse and Wilton (1988), satisfaction is the reaction of consumers to the estimated difference between the previous and the desire to express the actual product as acceptance after using it.
Kotler & Armstrong (2001) stated that the satisfaction level is the feeling of a person derived from comparing the results obtained from the product / service with his expectations. The expectation here is considered the wishes or expectations of people. It stems from personal needs, previous experience and external information such as advertising, word of mouth information from friends, family, etc.
Thus, the level of satisfaction is a function of the difference between the results obtained and expected. Customers may feel a degree of satisfaction in the following three: If the performance is lower than expected, customers will not be satisfied. If performance commensurate with expectations, the customer will be satisfied. If actual results exceed expectations, customers are very satisfied and excited.
2.4 Model of customer satisfaction
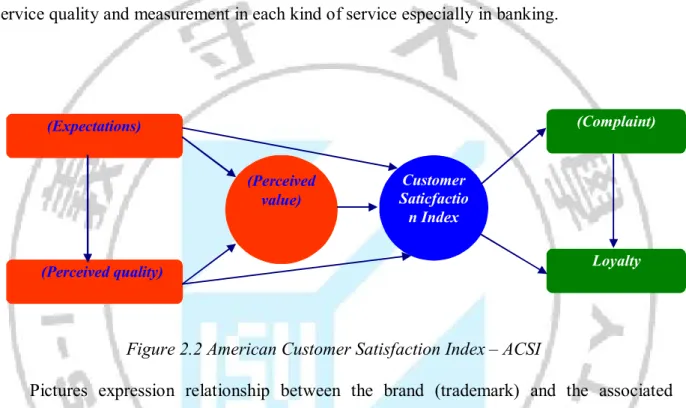
The index of customer satisfaction (Customer Satisfaction Index - CSI) that developed by Fornell (1996) is used to measure customer satisfaction for the industry, businesses in many developed countries in the world.
The customer satisfaction becomes an important indicator for business and organizations to improve service quality, maintain the loyalty, and enhance the competitiveness of enterprises. In 1989, indicators (barometer) measured satisfaction levels were first born in Sweden (Swedish Barometer Customer satisfaction - SCSB) to establish indicators of customer satisfaction for the purchase and consumer products - services domestic service. In subsequent years, this indicator was developed and widely applied in developed countries as US- ACSI, Norway - NCSI, Denmark - DCSI and EU countries - ECSI (1998).
This index can be done on the national level (the enterprise, the industry how will correspond to their customers) or internal angle sector (compare the satisfaction of businesses in within a sector) and comparisons between different times (to notice the change). Since then, businesses can know where so, the appreciation of customers for businesses to plan objectives and business strategy. The index of customer satisfaction include the factors (variables), each element is composed of many specific factors (indicators, items) characteristic of the product or service (Ryzin et al, 2004). Customer satisfaction (customer satisfaction) is defined as a comprehensive review of the use of a service or after-sales activities of the business and this is where the core of the CSI model. Around system variable is causal relationships (cause, and effect) from the initialized variables as expectations f the customers, the image (image) businesses and products, quality perceived quality and perceived value (Perceived quality) of products or services related to the outcome variable of satisfaction as loyalty (customer loyalty) or customer complaints.
2.5 Customer satisfaction and customer’s loyalty in
banking industry
Bank service quality is commonly noted as a critical prerequisite for satisfying and retaining valued customers (Taylor & Baker, 1994). Therefore, Bahia & Nantel (2000) proposed a specific scale, the BSQ (Bank Service Quality) for measuring perceived service quality in retail banking. In Vietnam, basically, there are still very few researched models of service quality and measurement in each kind of serviceespecially in banking.
Figure 2.2 American Customer Satisfaction Index – ACSI
Pictures expression relationship between the brand (trademark) and the associated customer for the attributes of the brand (trademark). This variable is represented by reputation, prestige and trust of the consumer to the brand. The brand as "a name, term, sign, symbol or design or combination of them, which is intended to identify the goods of one seller or group of sellers and to differentiate them from those of competitors" (Kotler, 2004). The new business start, the marketer designs business card, company website, name, logo… to send a clear message of company to their stakeholders and customers that is a merger and equal. According to Lafley (2009) interpreted that "We continue to invest in our core strengths. Firstly, we don't skimp on understanding the customer. Second is innovation. Thirdly is Brand Image… We're delivering more messages to our customers." In order to be successful, images and symbols must relate to, and indeed, exploit, the needs, values and life-styles of consumers in such a way that the meanings involved give added values, and differentiate from this brand to other brands (Broadbent and Cooper, 1987). From this
(Perceived value) Customer Saticfactio n Index (Complaint) (Expectations)
affect with service providers and organizations. The customer loyalty is often viewed as resulting from brand knowledge, followed brand image that PR also raise consumer loyalty trough the above strategies . In addition, the self-congruence theory states that the ways consumers evaluate products to match with their image. Higher congruence between self-image and product self-image would influence consumer attitudes or behavior regarding brand preference, brand attitude, product purchase decisions, customer satisfaction, and repurchase intention (Graeff, et al, 1996).
Loyalty is measured by intention to continue to buy, trust and recommend to other people about products and services they are using. The loyal customers are less likely to switch because of price and they make more purchases than similar non-loyal customers (Reichheld and Sasser, 1990). Loyalty customers will also help to promote and share knowledge with their friends about the service provider. They will provide strong word-of-mouth, create business referrals, provide references and serve on advisory boards. The loyal customers are served as a "fantastic marketing force" by providing recommendations and spreading positive word-of-mouth, those partnership-like activities are the most available advertising that the company can get (Raman, et al., 1999).
2.6 Relationship between service quality, customer
satisfaction and customer loyalty
The degree of quality that customers expect to get, the parameters measuring the expectations associated with the parameters of the image and perceived quality of products and services. As mentioned by Mankaa (2012) the higher expectations as likely to lead to buying decisions, but expect higher banking capabilities that satisfy customers more difficult. Quality of experience (Perceived quality): There are two types of perceived quality: (1) perceived product quality (tangible) is the evaluation of consumer products of recent customers for the product. (2) Perceived quality of service (intangible): is the evaluation of related services such as services during and after the sale, supply conditions, delivery, accounting, warranty of the product itself.
Perceived core service quality is quality products or services which are provided by the company. It offers to exceed the customer expectations. In recent study, service quality is considered from the view point of the customer who is estimated of the service "external
customer" and the efforts have focused on identifying of "external service encounter" factors, the customers will consider in evaluating the quality of service providers. Customer satisfaction is also important element of marketing strategies. Zeithaml et al., (2009) defined that the perceived service quality is measured by customer awareness and the consumers assess of the overall excellent products or services. Zahorik and Rust (1993) found that the modeling of perceived quality directly influences to customer loyalty and provides more diagnostic abilities. Furthermore, the perceived service quality is the best model to impact customer retention and behavior intentions (Hennig and Klee, 1997). The subject of service quality has been studied and debated over the past two decades. The importance of management's ability is understood how service quality and appropriately measurement, the subsequent actions make improvements and increase value to customer expectations. Looking through a financial perspective, the success of activities carried out by sports organizations is closely associated with the quality of services offered to customers and making sure customers get highest level of satisfaction from such services (Kotler, 2004).
The theoretical study showed that customer satisfaction depends on perceived value of goods and services. Traditional way described the service encounter satisfaction as the interaction occurs between customer-contact employees and the customers and it has been frequently discussed in the marketing literature (Ashley et al, 2015). Also, the service encounter is "the dyadic interaction between a customer and service provider”. It has also been modeled to impact long-term customer relationships as well as overall satisfaction. Service Encounter Satisfaction is distinguished from overall satisfaction and it has been defined as dis/satisfaction with a service encounter (Wepener & Boshoff, 2015). Additionally, customer relationships are built and destroyed which based on service encounter in a time and any service providers can be critical to the service outcome. It is the degree of overall pleasure or contentment felt by the customers, the results from ability of the service fulfilled the customer's desires, expectations and customer's needs in relation to the service . Service performance takes place in what has been termed the service encounter; the time frame during which consumers directly interact with service providers (Ashley et al, 2015). All element of an encounter activities such as: the facility, waiting times, and service personnel are considered service encounter
2.7 Demographic factor and its effect on customer loyalty
The personal factors may include age and life cycle, occupation, economic circumstances, lifestyle, personality and self-concept.
• Age and Life cycle Stage where People use other goods and services during their lifetimes. Different views regarding food, clothes, furniture, and recreation are often related to age. The process of Buying is formed according to the stage of the family life cycle.
• Economic situation: -the economic situation may influence the choice of the product.
• Life Style: - Life Style can be a way of living, to recognize the strengths participating in measuring consumer dimensions.
• Personality and Self-concept: The buying behavior is controlled by the person personality that in turn affects the Personality which represents psychological characteristics that lead responses of the customers.
There are many different kinds of customers and different needs in the market. Therefore, the market segmentation is a requirement of satisfying the objectives which is based on geographic, demographic, psychographic and behavioral factors. The process of dividing a market into different groups of buyers with different needs, characteristics, or behavior who might require different products or marketing programs is call market segmentation (Kotler & Armstrong, 2009).
Demographic segmentation divides the market into group based on age, gender, family size, income, occupation, nationality etc. Psychographic segmentation divides buyers into different groups based on social class, lifestyle, and personality characteristics. Behavioral variable divides the buyers into groups based on their knowledge, attitudes, uses or response to a product (Kotler & Armstrong, 2004).
After market segment defining, banks will evaluate the attractiveness, feasibility in order to select which one could be target market. According to Vargas-Hernandez, and Jimenez, (2015), there are 3 factors of market segment evaluation: segment size and growth, attractiveness, and objectives. The bank must analyze current segment that are segment sales, growth rate and expected profitability which might relate to various segments. Then, the bank
will decide to target which and the number of market. Kotler. P and Armstrong. G (2004) said that there are four types of market segment: undifferentiated market segment, differentiated segment, concentrated and micro-market segments ranging from mass marketing to local or individual marketing or somewhere.
2.8 Research frame work and hypothesis
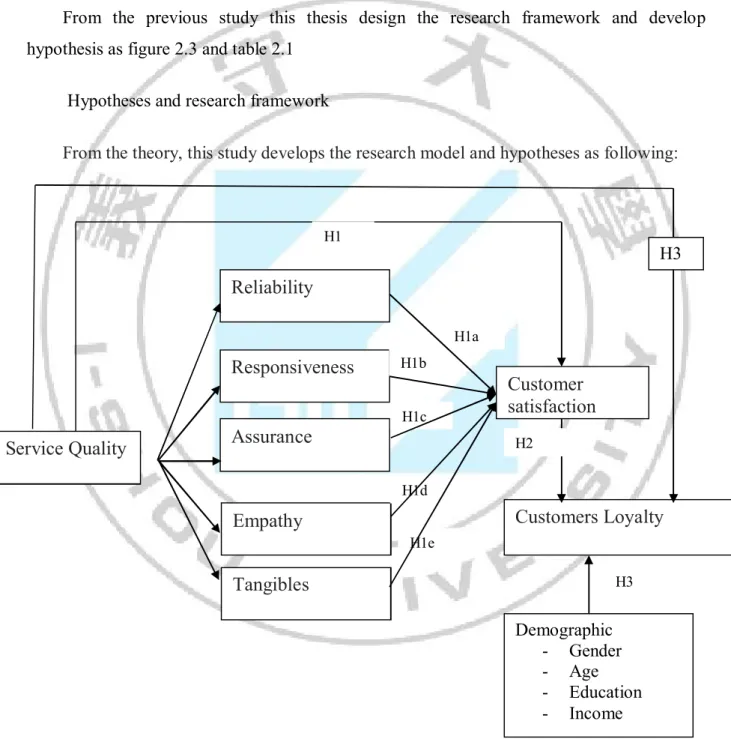
From the previous study this thesis design the research framework and develop hypothesis as figure 2.3 and table 2.1
Hypotheses and research framework
From the theory, this study develops the research model and hypotheses as following:
Figure 2.3 Research framework
Service Quality Reliability Responsiveness Assurance Empathy Tangibles Customer satisfaction Customers Loyalty Demographic - Gender - Age - Education - Income H1a H1b H1c H1d H1e H1 H2 H3 H3
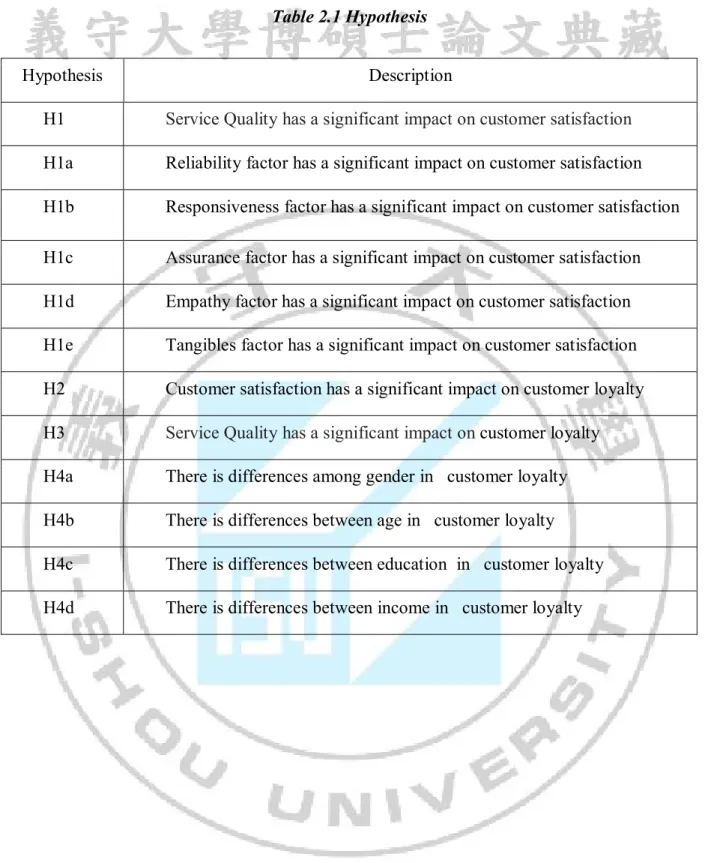
Table 2.1 Hypothesis
Hypothesis Description
H1 Service Qualityhas a significant impact on customer satisfaction
H1a Reliability factor has a significant impact on customer satisfaction
H1b Responsiveness factor has a significant impact on customer satisfaction
H1c Assurance factor has a significant impact on customer satisfaction
H1d Empathy factor has a significant impact on customer satisfaction
H1e Tangibles factor has a significant impact on customer satisfaction
H2 Customer satisfaction has a significant impact on customer loyalty
H3 Service Qualityhas a significant impact on customer loyalty
H4a There is differences among gender in customer loyalty
H4b There is differences between age in customer loyalty
H4c There is differences between education in customer loyalty
Chapter 3 Methodology
3.1 Introduction
The aim of this study is going to overview of literature about service quality and that impact on the banking service. Study the impact of service quality on customer satisfaction and customer loyalty. Testing the different between demographic factors in customer loyalty
To achieve the research objectives, this study is going to answer following questions:
RQ1: Do the service quality impact on the customer satisfaction that used EIB service?
RQ2: Do the customer satisfaction impact on customer‘s loyalty in EIB service?
RQ3: Is the any difference from customer demographic (Gender, Age, Education, Income) in customer’s loyalty?
3.2 Sample designed
The target population is customer who is currently using or used retailing service in Eximbank service. This study is going to conduct the survey with 250 customer who are using the Eximbank service in Hanoi. The survey is conducted on May and June, 2015.
3.3 Questionnaire designed
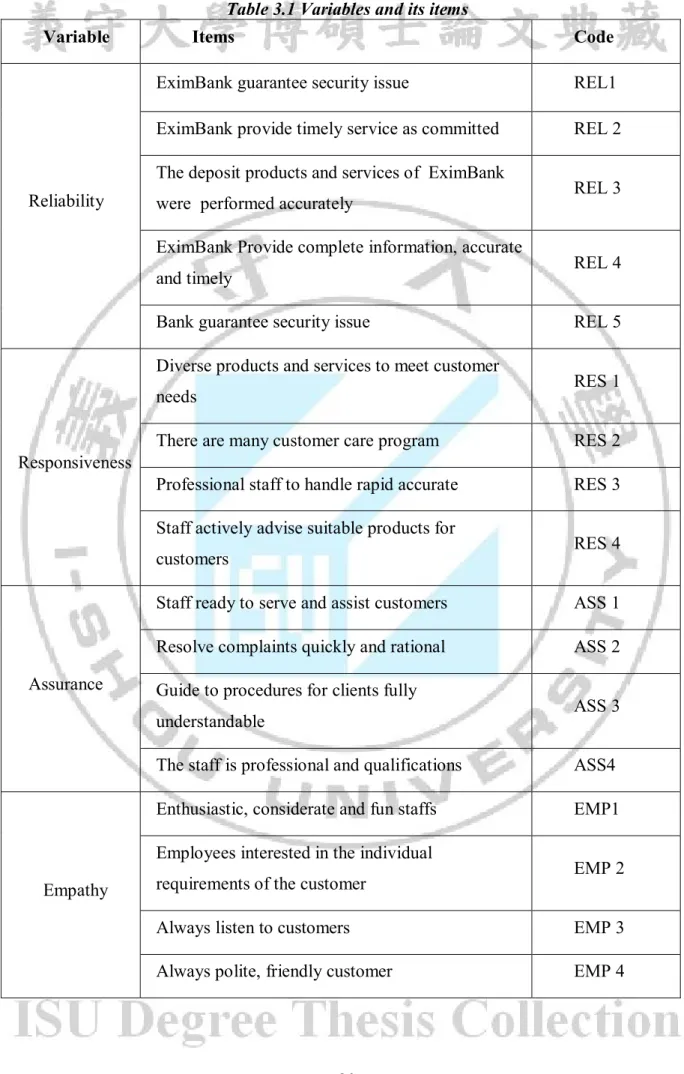
This study uses SERVQUAL model of Parasuraman (1988) to develop the questionnaire. There are 22 items distributing in 5 factors. The customer satisfaction variable these study uses scale of Bachelet (1995). The customers loyalty is based on the Chen and Tsai (200&) scale . all the item was modified to fix the context of Vietnam banking service sector. The table 3.1 shows the variables and its items.
Table 3.1 Variables and its items
Variable Items Code
Reliability
EximBank guarantee security issue REL1
EximBank provide timely service as committed REL 2
The deposit products and services of EximBank
were performed accurately REL 3
EximBank Provide complete information, accurate
and timely REL 4
Bank guarantee security issue REL 5
Responsiveness
Diverse products and services to meet customer
needs RES 1
There are many customer care program RES 2
Professional staff to handle rapid accurate RES 3
Staff actively advise suitable products for
customers RES 4
Assurance
Staff ready to serve and assist customers ASS 1
Resolve complaints quickly and rational ASS 2
Guide to procedures for clients fully
understandable ASS 3
The staff is professional and qualifications ASS4
Empathy
Enthusiastic, considerate and fun staffs EMP1
Employees interested in the individual
requirements of the customer EMP 2
Always listen to customers EMP 3
Tangible
The location of transaction is convenience and in
accordance with customer needs TAN1
Spacious transaction, using modern technology TAN 2
Nice layout of the counter, identifiable for
Customers reasonable TAN 3
The staff dresses polite TAN 4
Paper forms to be used in transactions were
designed easily TAN 5
Customer satisfaction
VietinBank offers more benefits than costs me
money CUS1
VietinBank is the best among competing banks CUS 2
VietinBank is much better than what I expected CUS 3
Customer Loyalty
Ready to become long-term customers of banks CL1
Ready to introduce family and friends CL2
If there are minor issues and comments will
continue to use the services of the bank CL3
3.4 Analysis
3.4.1 Reliability analysis
Cronbach's coefficient alpha only trust that the measure has linked together or not; but did not observe any necessary variables and observed variables left to be retained. Meanwhile, the calculation of the correlation coefficient between variable-general will help sort out the variables do not observe significant contribution to the description of the concept to be measured.
- Type the observed variables have a correlation coefficient small turn-total (less than 0.3); criteria when selecting the scale greater reliability 0.6 Alpha (Alpha larger the internal consistency reliability at higher) (Nunally & Burnstein 1994).
- The level of the Alpha value: greater than 0.8 is a good measurement scales; from 0.7 to 0.8 is used; 0.6 or more can use the case study is a new concept or new in the context of research (Nunally, 1978; Peterson, & Deal, 1998).
- The observed variables are correlated variables-total small (less than 0.4) are considered junk variable will be removed and the scale is accepted as Alpha reliability coefficient satisfactory (greater than 0.7 ).
Based on this information, researchers conducted assessment scales based on the following criteria:
- Type the observed variables with correlation coefficients less than 0.4 turn-general (these variables do not contribute much to the description of the concept to be measured, and many previous studies have used this criterion) .
- Choose a reliable scale greater than 0.6 Alpha (the concepts in this study is relatively new to the subject of research when respondents).
3.4.2 Regression analysis
Regression analysis was to find dependencies of a variable, called the dependent variable in one or more other variables, called the independent variable aims to estimate or predict the expected value of the dependent variable when anticipated value of the independent variable. Some other names of the dependent variable and the following independent variables, Dependent variable: variable is explained, the forecast variables, variable regression, variable response, endogenous variables. Independent variables: explanatory variables, predictor variables, repressor, variable or variable control agents, exogenous.
Although the regression analysis based on the idea of the dependence of one economic variable on other economic variables but technique itself regression analysis does not imply causality. Good examples of the confusion between these concepts conduct regression of burglary in a city with a number of police officers of the city. Y is called the burglary in a
year and X is the number of police officers. When we Regression Y on X, if we find a positive relationship of Y and X variables have statistically significant, the regression analysis to conclude: "Increase the number of police officers will increase the number burglary ". Clearly, this analysis identified mistakes in a causal relationship. Increased police numbers is due to the strengthening of the police force in the context of increased burglary. So we have to correct the regression of police according Y. burglary or X according to regression analysis before we have correctly identified a causal relationship.
3.4.3 T - Test, ANOVA
The contents of this section in order to test the differences between qualitative variables with quantitative variables, for example the difference in satisfaction with banking services A customer objects (such as gender, age, income ...) or not. To achieve this we conducted analysis of variance ANOVA and independent-sample T - test. The difference was statistically significant with a 95% confidence level (or levels of meaning Sig. <0.05).
There are two procedures for the analysis of variance: ANOVA factor ANOVA and multiple factors. Custom research conducted analysis of variance one element or two elements, particularly for undergraduate thesis or Master of Science in net toward applied research, sample surveys are not too complicated, this type of study user testing variance factor will be done because we just test the qualitative variables to classify observations into different groups. Inspection includes inspection ANOVA between variance homogeneity of the group has a significant factor sig. > 0.05.
The two selected variables (e.g. gender only two shown is Status of Men and Women), therefore we will use the test of Independent-sample T - test (test the hypothesis of two overall average possible) to find differences with quantitative variables.
Chapter 4 Results
This part helps us know clearly with all the data the researcher collect from the survey. First we should look through some data about the demographic profile of respondents.
4.1 Demographic information
Total 250 questionnaires sent to customer of Eximbank in Hanoi on May and June, 2015, there are 220 questionnaires returned and valid to analysis count for 88% of return rate in this study. Table 4.1 shows the respondent profile of this study.
For customers: based on 220 questionnaires’ answers collected from bank customers, As regards the gender of customers, 35.9 were males and 64.1 % were female. Related to age, age range from 20 – 35 (19.5 percent), 36 -45 (29.5percent) 46 – 55 (31.4 percent) and over 55 (19.5 percent). Most of the respondents’ education levels were Bachelor degree (58.2 percent %) while Master’s degree or higher count for 23.2 percent, respondents have under bachelor degree iis 14.5 percent and the last one is high school degree education count for 4.1 percent.
In the aspect of income per month, 12.3 percent had an income under 5 mil. VND, 27.7 percent had from 6 – 10 mil., 11 -20 mil. per month count for 33.2 percent and respondents who had above 20 mil. VND per month count for 26.8 percent in this study indicate high income respondent in this study.
Table 4.1 Respondent profile
Characteristic Frequency Percent
Gender
Male 79 35.9
Female 141 64.1
Total 220 100.0
20-35 43 19.5 36-45 65 29.5 46-55 69 31.4 over 55 43 19.5 Total 220 100.0 Education High School 9 4.1 Under Bachelor 32 14.5 Bachelor degree 128 58.2 Master’s degree or higher 51 23.2 Total 220 100.0 Income (VND) under 5 mil. 27 12.3 6-10 mil. 61 27.7 11-20 mil. 73 33.2 over 20mil. 59 26.8 Total 220 100.0
4.2 Reliability analysis
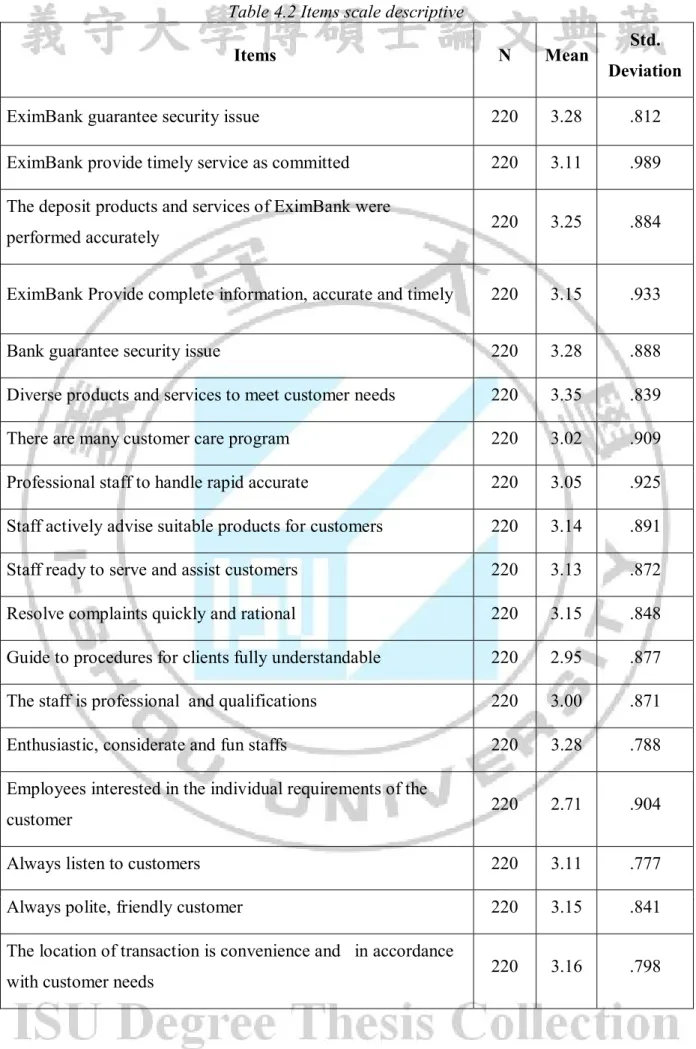
This study firstly use scale analysis for each items of the questionnaire to test the level of respondent degree in this questionnaire design.
Table 4.2 Items scale descriptive
Items N Mean Std.
Deviation
EximBank guarantee security issue 220 3.28 .812
EximBank provide timely service as committed 220 3.11 .989
The deposit products and services of EximBank were
performed accurately 220 3.25 .884
EximBank Provide complete information, accurate and timely 220 3.15 .933
Bank guarantee security issue 220 3.28 .888
Diverse products and services to meet customer needs 220 3.35 .839
There are many customer care program 220 3.02 .909
Professional staff to handle rapid accurate 220 3.05 .925
Staff actively advise suitable products for customers 220 3.14 .891
Staff ready to serve and assist customers 220 3.13 .872
Resolve complaints quickly and rational 220 3.15 .848
Guide to procedures for clients fully understandable 220 2.95 .877
The staff is professional and qualifications 220 3.00 .871
Enthusiastic, considerate and fun staffs 220 3.28 .788
Employees interested in the individual requirements of the
customer 220 2.71 .904
Always listen to customers 220 3.11 .777
Always polite, friendly customer 220 3.15 .841
The location of transaction is convenience and in accordance
Spacious transaction, using modern technology 219 2.99 .965
Nice layout of the counter, identifiable for Customers
reasonable 220 3.10 .960
The staff dresses polite 220 3.56 .994
Paper forms to be used in transactions were designed easily
220 2.95 .959
VietinBank offers more benefits than costs me money 220 3.10 .914
VietinBank is the best among competing banks 220 2.75 1.071
VietinBank is much better than what I expected 219 3.49 .837
Ready to become long-term customers of banks 220 3.13 .924
Ready to introduce family and friends 220 3.04 .940
If there are minor issues and comments will continue to use the
services of the bank 220 3.24 .887
From the table 4.2 the results indicate that most of items have mean value above 3.00 indicate well for further analysis
For further testing the reliability, this study use Cronbach’s alpha , the table 4.3 shows the result of Cronbach’s alpha
Table 4.3 Cronbach’s alpha
Variable Number of item Cronbach’s alpha
Reliability 5 .829 Responsiveness 4 .895 Assurance 4 .874 Empathy 4 .759 Tangible 5 .845 Service quality 5 .904 Customer satisfaction 3 .708 Customer Loyalty 3 .875
From the result the Cronbach’s α were ranged from .708 to .907. Therefore, it demonstrates that all factors were accepted and reliable as recommended by Nunnally (1978).
4.3 Regression analysis
For testing hypothesis H1, H2, and H3 this study use single regression to test the impact of service quality on customer satisfaction and the impact of customer satisfaction on customer loyalty in Eximbank.
4.3.1 Hypothesis (H1a, H1b, H1c, H1d and H1e)
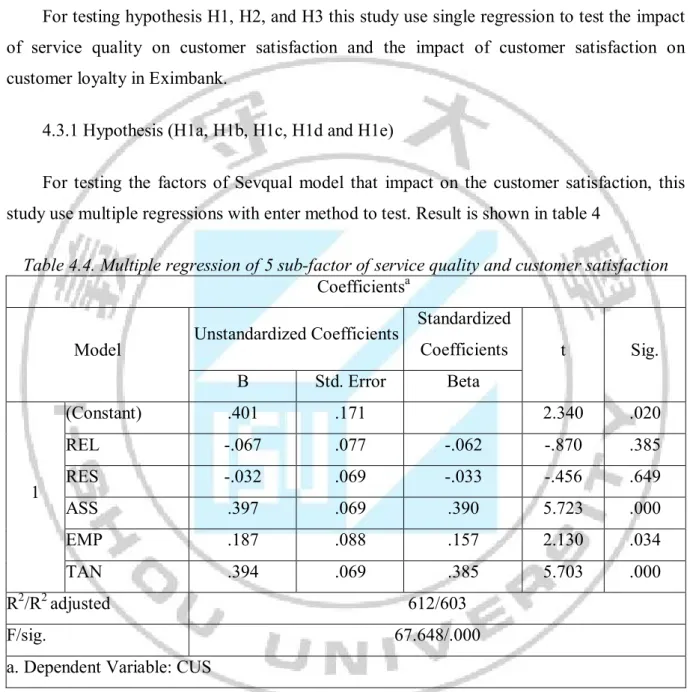
For testing the factors of Sevqual model that impact on the customer satisfaction, this study use multiple regressions with enter method to test. Result is shown in table 4
Table 4.4. Multiple regression of 5 sub-factor of service quality and customer satisfaction Coefficientsa
Model Unstandardized Coefficients
Standardized Coefficients t Sig. B Std. Error Beta 1 (Constant) .401 .171 2.340 .020 REL -.067 .077 -.062 -.870 .385 RES -.032 .069 -.033 -.456 .649 ASS .397 .069 .390 5.723 .000 EMP .187 .088 .157 2.130 .034 TAN .394 .069 .385 5.703 .000 R2/R2 adjusted 612/603 F/sig. 67.648/.000
a. Dependent Variable: CUS
Regression results in Table 4.6 show that R2 correction coefficient (Adjusted RS quare) by 0.612 means linear regression models was built multiples are consistent with the data and 61.2%.
The results of ANOVA with F = 67.648significance level at = 0000 <0.05 so multiple regression model just built is consistent with the overall study and can be used. All the
elements are exaggerated VIF ratio <2, thereby multicollinearity problem did not significantly influence the regression results.
The regression equation showing the relationship expressed satisfaction with the elements is written as follows:
Y = .401 -.067X1 -.032X2 + .397X3 + .187X4+ .394X5
From the model shows that H1a and H1b is not acceptable (Beta = -.067, p>0.05 and Beta = -.032, p>0.05). Others while H1c, H1d and H1e is acceptable (Beta = 397 p<0.05; Beta = 187 p<0.05 and Beta = 394 p<0.05)
For testing the impact of service quality on customer satisfaction this study use single regression and the table 4.5 shows the results
Table 4.5 Regression of service quality and customer satisfaction Coefficientsa
Model Unstandardized Coefficients
Standardized Coefficients t Sig. B Std. Error Beta 1 (Constant) .364 .186 1.954 .052 serqual .879 .058 .714 15.045 .000 R2/R2 adjusted .509/.507 F/sig. 226.362/0.00
a. Dependent Variable: CUS
As the result, the F statistic of 226.362 (p<0.05), revealing that the model helps to explain some of the variation in customer satisfaction. Besides, the adjusted coefficient of determination (Adjusted R2) revealed that 50.7% of the variance in customer satisfaction is explained by the regression model. The standardized coefficient beta (β) for Service quality is .714 (p <0.05) indicated significant. It can be concluded that the hypothesis H1 is strong supported that “Service quality has a significant impact on customer satisfaction” in Eximbank.
4.3.2 The impact of customer satisfaction and customer’s
loyalty
For testing the impact of customer satisfaction on customer’s loyalty this study use single regression and the table 4.6 shows the results
Table 4.6 The impact of customer satisfaction and customer’s loyalty Coefficientsa
Model Unstandardized Coefficients
Standardized Coefficients t Sig. B Std. Error Beta 1 (Constant) .387 .139 2.777 .006 CUS .884 .044 .809 20.307 .000 R2/R2 adjusted .654/.653 F/sig. 412.363/0.00 a. Dependent Variable: CL
As the result, the F statistic of 412.363 (p<0.05),\ revealing that the model helps to explain some of the variation in customer loyalty. Besides, the adjusted coefficient of determination (Adjusted R2) revealed that 65.3% of the variance in customer loyalty is explained by the regression model. The standardized coefficient beta (β) for customer loyalty factor is .909 (p <0.05) indicated strong significant. It can be concluded that the hypothesis H2 is very strong supported that “customer satisfaction has a very significant impact on customer loyalty” in Eximbank.
4.3.3 The impact of service quality and customer’s loyalty
For testing the impact of service quality on customer’s loyalty this study use single regression and the table 4.7 shows the results.
Table 4.7 The impact of service quality and customer’s loyalty Coefficientsa Model Unstandardized Coefficients Standardized Coefficients t Sig. B Std. Error Beta 1 (Constant) .283 .213 1.328 .186 serqual .913 .067 .678 13.629 .000 R2/R2 adjusted 460/458 F/sig. 185.743 a. Dependent Variable: CL
As the result, the F statistic of 185.743 (p<0.05), revealing that the model helps to explain some of the variation in customer loyalty. Besides, the adjusted coefficient of determination (Adjusted R2) revealed that 45.8% of the variance in customer loyalty is explained by the regression model. The standardized coefficient beta (β) for customer loyalty factor is .678 (p <0.05) indicated strong significant. It can be concluded that the hypothesis H3 is very strong supported that “service quality has a very significant impact on customer loyalty” in Eximbank.
4.4 T-test and ANOVA
For testing the characteristic of respondent relate to customer loyalty with Eximbank. This study firstly uses the T-test method for testing the different customer loyalty level between male and female. ANOVA method was used to test the different customer loyalty level between age, income and education of customer who use the retailing service of VietinBank
4.4.1. The different customer loyalty level among male and
female
A t-test was used to determine whether there was a significant difference between male and female in customer loyalty level with Eximbank service. Using an alpha of .05, the independent t-test indicated the average customer loyalty mean for male group (M= 3.0928, SD =.74524) is not different than the average customer loyalty for female group (M = 3.1608,
SD = .86153); t (1) = -.588, p >05). This result indicated that there is not different customer loyalty mean score between male and female (see table 4.7)
Table 4.8 The different customer loyalty level among male and female Group Statistics
sex N Mean Std. Deviation Std. Error Mean t Sig.
CL Male 79 3.0928 .74524 .08385 -.588 .557
Female 141 3.1608 .86153 .07255 -.613 .541
4.4.2 The different customer loyalty level between age group.
An alpha of .05 was used for each analysis for each one-way ANOVA. Tukey’s HSD procedure was used to conduct pairwise comparisons following the ANOVA tests ( Table 412). The age group includes: 20-35; 36-45; 46-55 and over 55. The result indicated that people of different age don’t have different level of customer loyalty towards the services in Eximbank. (F (12, 207) = 1.044, p >0.05 )
Table 4.9 the different customer loyalty level between age group. ANOVA
age Sum of
Squares
df Mean Square F Sig.
Between Groups 12.953 12 1.079 1.044 .410
Within Groups 214.029 207 1.034
Total 226.982 219
4.4.3 The different customer loyalty level between education
groups
An alpha of .05 was used for each analysis for each one-way ANOVA. Tukey’s HSD procedure was used to conduct pairwise comparisons following the ANOVA tests ( Table 412). The age group includes: .High School, Under Bachelor, Bachelor degree and Master’s degree or higher. The result indicated that people of different education don’t have different level of customer loyalty towards the services in Eximbank. (F (3, 216) = .184, p >0.05 )
Table 4.10 The different customer loyalty level between education group ANOVA
CL Sum of
Squares
df Mean Square F Sig.
Between Groups .375 3 .125 .184 .907
Within Groups 147.090 216 .681
Total 147.465 219
4.4.4 The different customer loyalty level between income
groups
An alpha of .05 was used for each analysis for each one-way ANOVA. Tukey’s HSD procedure was used to conduct pairwise comparisons following the ANOVA tests (Table 412). The income group includes: less than 5 mil., 6-10 mil., 11-20 mil., over 20mil.The result indicated that there are not different level of customer loyalty towards the services in Eximbank of different income per month of respondents. (F (3, 216) = 1.263, p >0.05 ).
Table 4.11 The different customer loyalty level between income groups ANOVA
Income Sum of Squares
df Mean Square F Sig.
Between Groups 2.542 3 .847 1.263 .288
Within Groups 144.923 216 .671
Total 147.465 219
4.5 Discussion
From the result finding it can be concluded that the customer satisfaction and customer loyalty were impacted by service quality and the result also found that the customer satisfaction has a strong positive impact on customer loyalty. It means H1, H2, H3 was accepted. However in the result of multiple regression, this study have two variable is not the predict factor of customer satisfaction include: H1a and H1b with statement that “Reliability factor has a significant impact on customer satisfaction” and “Responsiveness factor has a significant impact on customer satisfaction”.
The hypothesis H4 was tested for the differences between demographic variable of customer in customer loyalty for banking service of Eximbank. The result shows that there are not differences between demographic (gender, age, education and incomes) variable of customer in customer loyalty for banking service of Eximbank (table 4.11 show the hypothesis results).
Table 4.12: Hypothesis result
Hypothesis Description Hypothesis result
H1 Service Qualityhas a significant impact on customer
satisfaction
accepted
H1a Reliability factor has a significant impact on customer satisfaction
Unaccepted
H1b Responsiveness factor has a significant impact on customer satisfaction
Unaccepted
H1c Assurance factor has a significant impact on customer satisfaction
accepted
H1d Empathy factor has a significant impact on customer satisfaction
accepted
H1e Tangibles factor has a significant impact on customer satisfaction
accepted
H2 Customer satisfaction has a significant impact on customer loyalty
accepted
H3 Service Qualityhas a significant impact on customer
loyalty
accepted
H4a There is differences among gender in customer loyalty accepted H4b There is differences between age in customer loyalty accepted H4c There is differences between education in customer
loyalty
accepted
H4d There is differences between income in customer loyalty
Reject
Service encounter satisfaction is a key measuring factor for customer loyalty which may be a useful measuring method to predict customer concept of products and services in every industry. It was also supported by Brown's (1996) who concluded that the service encounter
satisfaction has also been modeled to impact long-term customer relationship as well as overall satisfaction. Jason (2005) also found the relationship between customer satisfaction and loyalty. Meanwhile, the result of hypothesis testing for hypothesis three also showed that the correlation between those two variables is positive. The perceived quality is very important to customer satisfaction. In this study, the research also indicated that perceived quality directly impacts on customer loyalty (Phillip, 2002). Satisfaction of the customer leads to the customer to re-use the bank service in the future. Consequently, after repeated use of more than 3 times, the loyalty of customer is well established in customers mind. On banking service or other service, satisfaction is considered as the main litmus test to improve customer loyalty.