國立臺灣大學工學院醫學工程研究所 博士論文
Institute of Biomedical Engineering College of Medicine and College of Engineering
National Taiwan University Doctoral Dissertation
社區腦中風病人之跌倒預防策略:
跌倒預測因子之研究
Fall Prevention Strategies
in Community-Dwelling Stroke Patients:
An Investigation of Fall Predictors
魏大森 Ta-Sen Wei
指導教授:章良渭 博士 Advisor: Liang-Wey Chang, Ph.D.
中華民國 106 年 6 月
June, 2017
中文摘要
腦中風為老年人好發疾病之一,為國人十大死因之第四位。隨著我國人口 快速老年化、醫療照護進步,死亡率明顯下降,腦中風病患逐年增加。腦中風 患者發病後常見併發症有肢體痙攣、肢體控制不良、平衡與步態能力障礙、內 翻馬蹄足、憂鬱等;這些因素都會導致患者於日常活動中發生跌倒意外,如行 走或移位時(坐到站/站到坐),嚴重者可能造成骨折甚至死亡,衍生之家庭負 擔與社會問題不容小覷。因此,如何於腦中風發病住院期間篩檢出跌倒高風險 因子、提供安全的起身坐站訓練並完整的治療介入策略,實為目前臨床醫護人 員迫切亟待解決的議題。
近年來,腦中風病患者的治療介入模式,已由傳統只單純改善個案的生理 狀況,轉變成全人的照護模式,如何兼顧個案生理與心理與社會參與,將是擬 定腦中風預防跌倒策略的重要面向,也是有效降低個案跌倒或跌倒發生機會之 重要因素。
本論文以多面向與客觀化的評估,探討社區腦中風患者跌倒的預測因子,
並分析腦中風個案坐到站、站到坐時,不同手與腳擺位姿勢之運動學及動力學 表現,來做為日後臨床醫護人員訓練、治療和跌倒預防、介入之重要參考。
研究結果發現兩個預測腦中風出院後發生跌倒之多變項回歸模型,分別為 模型一: 步態不對稱性[調整勝算比, adjusted odds ratio, aOR = 2.2, 95% 信賴區 間 (1.2–3.8)]、小腿腓腸肌痙攣程度[aOR = 3.2 (1.4–7.3)] 與憂鬱[aOR = 1.4 (1.2–
1.8)],模型準確度 (Area under curve, AUC)為 0.856;模型二: 功能獨立評估量
表分數低 [aOR = 0.9 (0.9–1.0)]、步態不對稱性 [aOR = 3.6(1.4–9.2)]與內外側重 心晃動程度[aOR = 1.7 (1.0–2.7)],模型準確度為 0.815。
不同手與腳擺位姿勢之動力學結果發現,偏癱腳在後且手成交握狀時,腦 中風患者由坐姿起身到站立之預備時間最短,過程中雙腳承重對稱性佳,因此 證實臨床治療師訓練患者坐到站時,透過手與腳的姿勢變換,可改善雙腳承重 對稱性外,亦可做為訓練偏癱側下肢承重的訓練方法。
而腦中風由站到坐時,腳的擺位顯著影響腳承重策略及坐下時的衝擊力,
但手的姿勢並無影響。個案若因前腳(健側)無法代償後腳(偏癱腳)的控制 時,將在站到坐過程中產生較大的衝擊力,故為了訓練目的,可將健側腳放置 於前方來誘發偏癱腳的肌肉用力與控制能力。
結論:本論文藉由分析腦中風出院前收集之病患臨床資料與功能性評估結 果,歸納出兩個跌倒預測模型,並透過坐到站與站到坐的動力學實驗,分析個 案對不同姿勢下,肢體動作的調變機制,研究結果提供臨床人員擬訂腦中風個 別化防跌介入與治療之重要參考依據。
關鍵字:腦中風、跌倒、步態不對稱性、憂鬱、痙攣、姿勢晃動、
功能獨立評估
Abstract
Cerebrovascular disease is one of common chronic disease in the elderly and is the 4th leading cause of death in Taiwan. The numbers of stroke are gradually
increasing annually due to rapid aging of population and excellent healthcare system which decreases the incidence of mortality. The common complications after stroke are limb spasticity, poor coordination, balance & gait impairment, equinus-varus foot, depression and etc. It often results in accidental falls during activity of daily living, such as sit to stand or stand to sit and may cause fractures or even death. It is of no doubt that family and society are also having great impact and challenges. Therefore, it is crucial to predict the risk factors of fall, provide sit-to-stand training and
comprehensive interventions for stroke patients during hospitalization.
Recently, the mode of care and intervention is moving from improving the physical functioning toward building a holistic health care in stroke patients. A comprehensive fall prevention strategy, including physical, psychological and biosocial dimensions is essential to meet the unmet needs in clinical practice and reduces the incidence of accidental falls in the stroke patients.
In this dissertation, it will discover the predictors of fall by using objective assessments in the community-dwelling stroke patients. It also analyzes the strategies
of leg load discrepancy on bilateral legs during sit to stand and stand to sit tasks according to different postural configuration of foot and hand.
The key findings of this dissertation are as followings:
(1) Two predictive models of fall in the community-dwelling stroke patients are found. Model one: asymmetrical gait pattern [adjusted odds ratio, aOR = 2.2, 95% CI (1.2–3.8)], spasticity of gastrocnemius [aOR = 3.2 (1.4–7.3)], and depression [aOR = 1.4 (1.2–1.8)]; the accuracy of model is 0.856; Model two: low score of functional independent measure [aOR = 0.9 (0.9–1.0)], asymmetrical gait pattern [aOR = 3.6 (1.4–9.2)] and postural sway in mediolateral direction [aOR = 1.7 (1.0–2.7)], the accuracy of model is 0.815.
(2) The paretic foot backward and hand clasped (FabHc) position leads to shorter movement durations before rising up and increased leg load symmetry during SitTS. Using the FabHc position for rising up and releasing clasped hands for more stability after standing is a useful strategy for stroke patients performing the SitTS task. Using this strategy, to train stroke patients according to the purpose of training, clinicians can provide more effective therapeutic interventions for specific underlying impairments.
(3) Altering arm placements does not significantly influence the leg load sharing strategy and sitting impact forces. The leg load sharing strategies are ruled by the
preferred use of the non-paretic side and the favored leg position for the
biomechanical load. The paretic leg is incapable of modulating the sitting-down process, placing the paretic leg posterior induces notably greater sitting impact forces compared with the counter leg placement. From the strength-training point of view, however, placing the paretic leg posterior would facilitate exertions of the paretic leg.
Conclusions: Patient falls are a major health concern in the care of patients with stroke. Two predictive model of fall risks are defined and the loading strategies during sit to stand and stand to sit are analyzed. The findings of this dissertation may provide an important information for making individualized fall prevention strategies in the stroke patients.
Keywords: stroke, fall, gait asymmetry, depression, spasticity, postural sway
functional independence measure
Table of Contents
口試委員審定書………...i
中文摘要………....ii
Abstract………iv
Falls and Fall-related injuries in the Elderly and Stroke ... 1
Introduction ... 1
1.1.1 Risks of fall and fall related injury in the stroke patients ... 4
References ... 8
Gait Asymmetry, Ankle Spasticity, and Depression as Independent Predictors of Falls in Community-Dwelling Ambulatory Stroke Patients 11 Introduction ... 11
Materials and Methods ... 14
2.2.1 Participants ... 14
2.2.2 Baseline Measurements ... 15
2.2.3 Assessment of Falls... 19
2.2.4 Statistics ... 19
Results ... 21
Discussion ... 33
2.4.1 Assessment of Falls... 34
2.4.2 Balance and Gait Performance ... 34
2.4.3 Spasticity Related to Falls ... 35
2.4.4 Effects of Functional Performance ... 37
2.4.5 Effects of Depression in Stroke Patients ... 37
2.4.6 Fall Prediction Model ... 38
2.4.7 Study Limitations ... 40
Conclusions ... 43
References ... 44
Postural influence on Stand-to-Sit leg load sharing strategies and sitting impact forces in stroke patients ... 48
Introduction ... 48
Methods... 51
3.2.1 Subjects ... 51
3.2.2 Experiment protocol ... 52
3.2.3 Data analysis ... 57
3.2.4 Statistical analysis ... 57
3.3.1 Normality check ... 58
3.3.2 Two-way ANOVA with post hoc comparisons ... 58
3.3.3 Leg load sharing strategy ... 61
Discussion ... 63
References ... 69
Postural Configuration on Phase Duration and Vertical Force Asymmetry during Sit-to-Stand Tasks in Patients with Stroke ... 72
Introduction ... 72
Methods... 74
4.2.1 Participants ... 74
4.2.2 Ethics... 74
4.2.3 Experimental settings ... 74
Procedures ... 80
4.3.1 Data processing ... 80
4.3.2 Statistical analysis ... 84
Results ... 85
Discussion ... 94
4.5.1 Durations in response to hand and foot placement ... 94
4.5.2 The effect of foot position on the asymmetry of weight bearing . 95 4.5.3 The effect of hand position on the asymmetry of weight bearing 96 4.5.4 The effect of foot and hand positions on leg load discrepancy .... 98
Limitations ... 99
Conclusions ... 99
References ... 101
Multidisciplinary interventions for fall prevention related to the stroke 104 Fall prevention and management related to the stroke ... 105
Treatments of spasticity improves gait asymmetry ... 107
ICF model for fall prevention ... 111
References ... 116
List of Figures
Figure 2-1 Ultraflex Computerized Dynography data logger, Infotronic, Netherland. 18
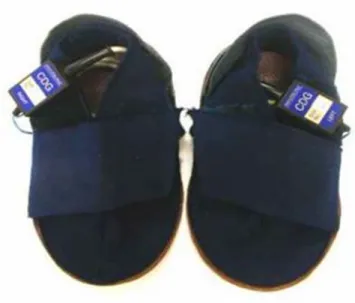
Figure 2-2 Shoes with force sensors to measure ground reaction force. ... 18
Figure 2-3 The ROC curves for predicting the occurrence of falls in stroke patients using models I and II. AUCs were 0.856 and 0.815, respectively. Arrowheads indicate the identified optimal cutoffs (Youden Index) for these prediction models (0.69 in model I and 0.53 in model II). ... 32
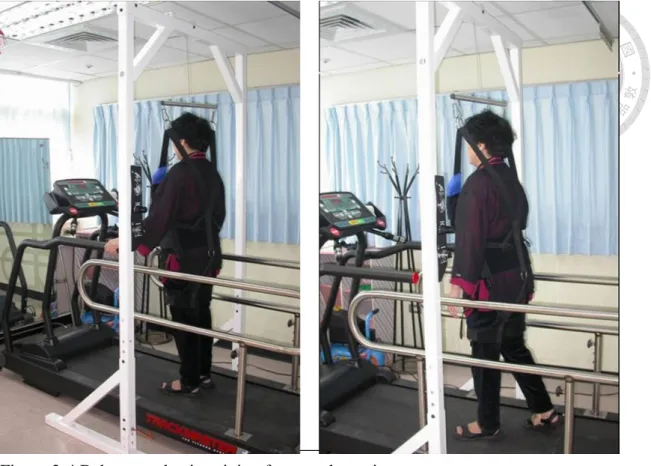
Figure 2-4 Balance and gait training for a stroke patient. ... 41
Figure 2-5 Dynamic balance testing and training. ... 41
Figure 2-6 A protable gait analysis instruments. ... 42
Figure 2-7 Results of balance and gait Analysis. ... 42
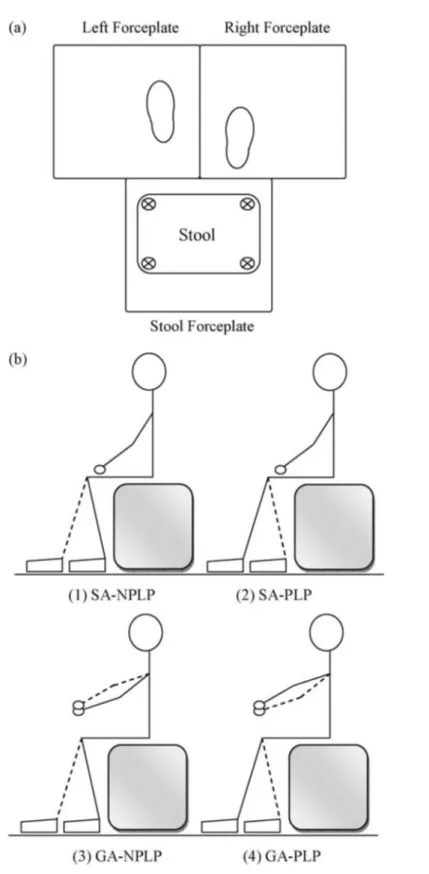
Figure 3-1 Experiment setup ... 53
Figure 3-2 Typical normalized stool reaction forces. y indicates the first transient peak, i.e. sitting impact force. ... 55
Figure 3-3 Typical normalized dynamic leg load responded to two leg placements and (a) SA arm placement and (b) GA arm placement during descending period. .... 56
Figure 3-4 Illustrations of leg load strategies of two leg placements corresponding to (a) SA arm placement and (b) GA arm placement. * represents that there is a significant difference between two bars. ... 62
Figure 4-1 Experimental setting: Marker placement and foot position. ... 76
Figure 4-2 Arm positions and Knee flexion angle. ... 77
Figure 4-3 Example of hand grasp during the task of sit to stand. ... 77
Figure 4-4 The kinematic and kinetic data collected by optotrak motion system. ... 79
Figure 4-5 Events of sit to stand task. ... 83
Figure 4-6 Bilateral leg load in FspHk and FabHc position. ... 83
Figure 4-7 Asymmetrical leg load compared to FspHk and FabHc. ... 83
Figure 4-8 The durations of sit to stand by phase: (A) preparation phase. (B) ascending phase. (C) stabilization phase. (D) total sit to stand. The values were plot by mean with standard deviation. ... 87
Figure 4-9 The asymmetry Index of events according to Foot and Hand Positions: ... 90
Figure 4-10 Leg Load Discrepancy of sit to stand by phase: (A) preparation phase. (B) ascending phase. (C) stabilization phase. (D) total sit to stand. All values are represented as mean (standard deviation). ... 92
Figure 5-1 Management of spasticity algorithm. ... 108
Figure 5-2 Muscle co-contraction pattern on upper and lower limbs. ... 109
Figure 5-3 Ultrasound guided Botox injection for spasticity reduction. ... 110
Figure 5-5 ICF core set of risk factors for falls in acute rehabilitation settings. ... 112
List of Tables
Table 1-1 Risk factors for the elderly falls by multivariate analysis. ... 4 Table 1-2 Risk of fall-related injury by multivariate analysis in the elder. ... 5 Table 1-3 Risks of fall related injury in stroke patients. ... 6 Table 1-4 Interventions for preventing falls in elder people living in the community. .. 7 Table 2-1 Baseline measurements of the study subjects. ... 23 Table 2-2 Comparison of balance and gait parameters in study subjects. ... 25 Table 2-3 Correlation coefficients of balance and gait parameters (n = 112). ... 26 Table 2-4. Correlation between predictors of risk of falls in stroke subjects (n = 112).
... 28 Table 2-5. Multivariate logistic regression for predictors of accidental falls. ... 31 Table 3-1 Group means and statistical results of descending period, leg load kinetics,
and sitting impact force corresponding to each postural configuration (N= 18). 60 Table 4-1 Leg load discrepancy by phase. ... 93 Table 5-1 Publications and conferences related to fall prevention for the stroke. ... 105 Table 5-2 ICF categories included in the ICF core set for falls in acute rehabilitation
settings. ... 113 Table 5-3 Evaluation of a stroke patient by ICF model. ... 115
Appendix 1 Eighty-eight fall-related parameters and their linked 66 ICF categories and 5 personal factors. ... 121
Falls and Fall-related injuries in the Elderly and Stroke
Introduction
The most common fractures related to osteoporosis are distal radial fracture vertebral fracture, and hip fracture [1]. Hip fractures result in higher mortality and morbidity in the elderly. This devastating condition also causes economic and
psychological stress to the patients’ families and results in large amounts of insurance payments. The number of hip fractures is estimated to triple from the year 1999 to 2030 [2]; globally, the total figures could rise from 1.7 million in 1990 to around 6.3 million by 2050 [3]. Hip fracture will be the major public health issue of the elderly in the twenty-first century. The common risk factors of fall and fall related injuries were summarized in Table 1-1~1-5.
Cmmings and Nevitt [4] hypothesized that four important factors may determine whether a fall will cause a hip fracture: (1) fall orientation, (2) protective responses, (3) local shock absorbers and (4) bone strength at the hip. Studies have shown that hip fracture in the elderly is closely associated with low bone mineral density (BMD) of the proximal femur [5] and accidental falls are the predisposing factor [6], [7].
Greenspan et al. proved that a sideways fall was an independent risk factor for hip fracture either in the ambulatory community elderly [8] or in frail nursing home
elderly [9]. Hayes et al.’s study showed that impact near the hip dominated fractures in elderly nursing home residents who fell[10]. Researchers have also reported that low body weight [11], [12] or reduced physical activity[13], [14] increases the risk of hip fractures.
For effective prevention, high-risk groups need to be identified see the Table 1-4.
Though many researchers have investigated the risk factors of hip fracture, most of them determined the risk factors by bivariate analysis. Few researchers have approached the risk factors from different aspects, especially as regards the fall characteristics, functional mobility and BMD. We investigated these risk factors concurrently to determine in what circumstances an accidental fall may cause a hip fracture in the elderly and to provide an appropriate strategy for prevention. The results showed that there were 6 independent risk factors of hip fracture when the elderly fall, including (1) body mass index (kg/m2), OR=1.8 (1.1~2.8) ; (2) functional mobility, OR=2.0 (1.1~3.5) ; (3) previous stroke, OR=2.9 (1.3~6.3) ; (4) sideways falls, OR=2.5 (1.6~3.9) ; (5) direct hip impact, OR=4.9 (2.7~8.8) ; (6) femoral neck bone density (g/cm2), OR= 1.7 (1.0~2.8)。
From the results of these studies, the prevention strategy for hip fracture in the elderly can be summarized into three categories: (1) increase or maintain BMD of the proximal femur; (2) modify the risk factors and characteristics of a fall; (3) decrease the local impact force on the hip after a fall. The preventive strategy for hip fracture should be focused on easier-to-modify factors. In addition to the maintenance of BMD, it may be crucial to keep a physically active lifestyle (to modify fall severity) and to maintain an appropriate body weight (to decrease local impact on the hip).
Owing to the complex interaction of the independent risk factors, the practical effect of intervention to reduce hip fracture needs to be further investigated. Therefore, the next aim of fall prevention is to evaluate the predictors of fall in stroke patients who are in high volume and high risk for hip fracture.
1.1.1 Risks of fall and fall related injury in the stroke patients
Table 1-1 Risk factors for the elderly falls by multivariate analysis.
Author Tsai, Y.J.[15] Lin, M.R.[16] Huang, S.C.[17] Tinetti, M.E.[18] Cesari, M.[19] Rekeneire, N.[20]
Title The prevalence and risk factor assessment of the fall of the community
Risk factors for elderly falls in a rural
community of central Taiwan
Cumulative incident rate and associated factors of falls among the elderly in Shih-Pai, Taiwan
Risk factors for falls among elderly persons living in the community
Prevalence and risk factors for falls in an older community-dwelling population
Correlates of falling in healthy older persons
Journal (Year)
Project Report, D.O.H (1997)
Taiwan J Public Health (2002)
Taiwan J Public Health (2005)
New Engl J Med (1988) J Gerontol A Biol Sci Med Sci (2002)
J Am Geriatr Soc (2003)
Age Sample size
above 70 years old n=1092
above 65 years old n=368
above 65 years old n=2045
at least 75 years old n=336
65 years and older n=5570
aged 70 to 79 n=3075 Methods cross-sectional prospective cross-sectional prospective observational cross-sectional
Risk factor 1
Female 2.1 (1.3~3.4)
Previous fall history 1.8 (1.1~2.9)
Female 1.7 (1.2~2.2)
Sedative use 28.3
Wandered 2.4 (1.8~3.1)
White race 1.4 (1.2~1.6) Risk factor
2
Self concern common health condition 2.0 (1.1~3.8)
Impaired number of instrumental activity of daily living 1.2 (1.1~1.4)
Gout 1.7 (1.2~2.4)
Cognitive impairment 5.0
Gait problems 2.1 (1.8~2.5)
Slower 6-meter walk speed
1.1(1.0~1.3) Risk factor
3
Self concern poor health condition 2.5 (1.2~5.4)
Longer duration of timed UP & Go
2.0 (1.0~4.0)
Depression 1.5 (1.1~2.3)
Disability of the lower extremities
3.8
Depression 1.5(1.4~1.7)
Poor standing balance 1.2 (1.0~1.4)
Risk factor 4
Balance impairment 2.3 (1.3~3.8)
Othostatic hypotension
1.4 (1.0~1.9)
Palmomental reflex 3.0
Lived in an unsafe place 1.5 (1.3~1.7)
Inability to do 5 chair stands1.7(1.3~1.9) Risk factor
5
Abnormalities of balance
and gait 1.9
Urinary incontinence
1.5(1.1~2.0)
Risk factor 6
Foot problems
1.8
Mid-quintile of leg muscle
strength 0.6(0.4~0.9)
Table 1-2 Risk of fall-related injury by multivariate analysis in the elder.
Author Grisso JA[6] Herndon JG[21] Colon-Emeric CS[22] Wei T-S[23] Liu W-L[24]
Title Risk factors for falls as a cause of hip fracture
in women.
Risk of fall injury events at home in older
adults
Predict Fractures in Older Adults
Risk Factors of Hip Fracture in the Elderly
Serious Fall-Related Injury in an Eldery (III)
Year 1991 1997 2002 2001 1999
Age Subjects
Average 80 174
Above 65 1185
Above 65 7654
65-84 314
Above 65 806
Journal New Engl J Med J Am Griatr Soc Osteoporosis Int Osteoporosis Int Department of Health, Executive Yuan Method Case-control Case-control Cohort study Case-control 1st year: cross sectioal
2nd year: prospective Factor1
OR(95%CI)
lower-limb dysfunction 1.7(1.1~2.8)
stroke 1.7(1.0~3.0)
Female 1.9~2.3
direct hip impact 4.9 (2.7~8.8)
Age over 80 1.6 (0.9~2.8)
Factor2 OR(95%CI)
previous stroke 2.0(1.0~4.0)
anemia 1.5(1.0~2.2)
Low BMI 1.3
previous stroke 2.9 (1.3~6.3)
Previous fall 2.0 (1.3~3.2) Factor3
OR(95%CI)
Parkinson 9.4(1.2~76.1)
Caucasian 2.1~2.8
sideways fall 2.5 (1.6~3.9)
Diabetes 2.0 (1.2~3.2) Factor4
OR(95%CI)
Rosow–Breslau impairments
1.8~2.1
functional mobility 2.0 (1.1~3.5)
ADL 2.5 (1.3~4.6)
Factor5 OR(95%CI)
age over 75 years 2.1
BMI 1.8 (1.1~2.8)
Balance impairment 2.3 (1.0~5.4) Factor6
OR(95%CI)
history of stroke 1.9
femoral neck BMD 1.7 (1.0~2.8)
Gait impairment 1.5 (1.0~2.3)
Table 1-3 Risks of fall related injury in stroke patients.
Author Melton LJ[25] Sze KH[26] Yates JS[27] Lamb SE[28] Tong P-F[29] Ta-Sen Wei[30]
Title Fracture risk
following ischemic stroke
Falls among Chinese stroke patients during rehabilitation
Falls in community- dwelling stroke
Risk factors for falling in stroke
women
Balance recovery and training on fall prevention in
stroke
Gait asymmetry, ankle spasticity, and
depression as independent predictors
of falls in ambulatory stroke patients
Year 2001 2001 2002 2003 2003 2017
Age Subjects
28-96 387
≦65 vs. ≥65 677
Age ≥ 18 280
Over 65 124
35~83 25
65~80 112 Journal Osteoporosis Int Arch phys med
rehabil
J Rehabil Res Dev
Stroke NHRI PLOS One
Method Retro-cohort Cohort Cohort Prospective 1 y Cohort Prospective
Factor 1 OR(95%CI)
increased with age 1.6(1.4~2.0)
Barthal Index admission 2.6(1.3~5.5)
motor impairment 2.2(1.0~4.7)
balance problems while dressing
7.0
Use quadricane the asymmetry ratio of single support 2.2(1.2±3.8) Factor 2
OR(95%CI)
moderate functional impairment 1.6(1.0~2.5)
dysphasia 1.81(1.0~3.2)
motor + sensory impairments 3.1(1.5~6.8)
esidual balance, dizziness, or
spinning 5.2
the level of spasticity in the gastrocnemius
3.2 (1.4±7.3) Factor 3
OR(95%CI)
hospitalization at onset of stroke
2.0(1.3~3.2)
depression 1.4 (1.2±1.8)
Table 1-4 Interventions for preventing falls in elder people living in the community.
Rate ratio (RaR)*
(95% CI)
Risk ratio (RR)*
(95% CI)
Single Interventions
Exercises
Multiple-component group exercise 0.71 (0.63~0.82) 0.85 (0.76~ 0.96)
Tai Chi 0.72 (0.52~1.00) 0.71 (0.57~ 0.87)
Multiple-component home-based exercise 0.68 (0.58~0.80) 0.78 (0.64 ~ 0.94)
Balance training 0.72 (0.55~0.94) 0.81 (0.62~1.07)
Strength/ Resistance training 3.6 (1.5~8.0)
Medication
Vitamin D 1.00 (0.90~1.11) 0.96 (0.89~1.03)
Withdrawal of psychotropic medication 0.34 (0.16~0.73) 0.61 (0.32~1.17) Prescribing modification programme for
primary care physicians 0.61 (0.41~0.91)
Surgery
Pacemakers 0.73 (0.57~0.93) 0.78 (0.18~3.39)
First eye cataract surgery 0.66 (0.45~0.95) 0.95 (0.68~1.33) Oral nutritional supplementation 0.95 (0.83~1.08) Cognitive behavioural interventions 1.00 (0.37~2.72) 1.11 (0.80~1.54)
Environment/assistive technology
Home safety assessment and modification 0.81 (0.68~0.97) 0.88 (0.80~0.96)
Anti-slip shoe device 0.42 (0.22~0.78)
Multifactorial Interventions 0.76 (0.67~0.86) 0.93 (0.86~1.02)
*Rate ratio (RaR): to compare the rate of falls between intervention and control groups.
Risk ratio (RR): the number of people falling (fallers) in each group to assess the risk of falling.
References
[1] P. Lips, “Epidemiology and predictors of fractures associated with osteoporosis,”
Am. J. Med., vol. 103, no. 2, pp. S3–S11, 1997.
[2] “Hip fractures to treble by the year 2030.,” Bull. World Health Organ., vol. 77, no. 5, p. 449, 1999.
[3] W. H. Organization and others, “The World Health Report 1998: Life in the 21st century a vision for all,” in The world health report 1998: life in the 21st century A vision for all, World Health Organization, 1998.
[4] S. R. Cummings and M. C. Nevitt, “A hypothesis: the causes of hip fractures,” J.
Gerontol., vol. 44, no. 5, pp. M107–M111, 1989.
[5] H. Burger, C. De Laet, A. Weel, A. Hofman, and H. A. P. Pols, “Added value of bone mineral density in hip fracture risk scores,” Bone, vol. 25, no. 3, pp. 369–
374, 1999.
[6] J. A. Grisso et al., “Risk factors for falls as a cause of hip fracture in women,” N.
Engl. J. Med., vol. 324, no. 19, pp. 1326–1331, 1991.
[7] P. Dargent-Molina et al., “Fall-related factors and risk of hip fracture: the
EPIDOS prospective study,” The Lancet, vol. 348, no. 9021, pp. 145–149, 1996.
[8] S. L. Greenspan, E. R. Myers, L. A. Maitland, N. M. Resnick, and W. C. Hayes,
“Fall severity and bone mineral density as risk factors for hip fracture in ambulatory elderly,” Jama, vol. 271, no. 2, pp. 128–133, 1994.
[9] S. L. Greenspan, E. R. Myers, D. P. Kiel, R. A. Parker, W. C. Hayes, and N. M.
Resnick, “Fall direction, bone mineral density, and function: risk factors for hip fracture in frail nursing home elderly,” Am. J. Med., vol. 104, no. 6, pp. 539–545, 1998.
[10] W. C. Hayes, E. R. Myers, J. N. Morris, T. N. Gerhart, H. S. Yett, and L. A.
Lipsitz, “Impact near the hip dominates fracture risk in elderly nursing home residents who fall,” Calcif. Tissue Int., vol. 52, no. 3, pp. 192–198, 1993.
[11] H. E. Meyer, A. Tverdal, and J. A. Falch, “Changes in body weight and incidence of hip fracture among middle aged Norwegians.,” BMJ, vol. 311, no. 6997, p. 91, 1995.
[12] J. Bernstein, J. A. Grisso, and F. S. Kaplan, “Body mass and fracture risk: a study of 330 patients.,” Clin. Orthop., vol. 364, pp. 227–230, 1999.
[13] E. W. Gregg, J. A. Cauley, D. G. Seeley, K. E. Ensrud, and D. C. Bauer,
“Physical activity and osteoporotic fracture risk in older women,” Ann. Intern.
Med., vol. 129, no. 2, pp. 81–88, 1998.
[14] S. B. Jaglal, N. Kreiger, and G. Darlington, “Past and recent physical activity and risk of hip fracture,” Am. J. Epidemiol., vol. 138, no. 2, pp. 107–118, 1993.
community,” Proj. Rep. DOH, 1997.
[16] M.-R. Lin, S. L. Tsai, S. Y. Chen, and S. J. Tzeng, “Risk factors for elderly falls in a rural community of central Taiwan,” Taiwan J. Public Health, vol. 21, no. 1, pp. 73–82, 2002.
[17] S. C. Huang, T. J. Chen, and P. Chou, “Cumulative incident rate and associated factors of falls among the elderly in Shih-Pai, Taiwan,” Taiwan J Public Health, vol. 24, no. 136, p. e145, 2005.
[18] M. E. Tinetti, M. Speechley, and S. F. Ginter, “Risk factors for falls among elderly persons living in the community,” N. Engl. J. Med., vol. 319, no. 26, pp.
1701–1707, 1988.
[19] M. Cesari, F. Landi, S. Torre, G. Onder, F. Lattanzio, and R. Bernabei,
“Prevalence and risk factors for falls in an older community-dwelling
population,” J. Gerontol. A. Biol. Sci. Med. Sci., vol. 57, no. 11, pp. M722–M726, 2002.
[20] N. De Rekeneire et al., “Is a fall just a fall: correlates of falling in healthy older persons. The Health, Aging and Body Composition Study,” J. Am. Geriatr. Soc., vol. 51, no. 6, pp. 841–846, 2003.
[21] J. G. Herndon, C. G. Helmick, R. W. Sattin, J. A. Stevens, C. DeVito, and P. A.
Wingo, “Chronic medical conditions and risk of fall injury events at home in older adults,” J. Am. Geriatr. Soc., vol. 45, no. 6, pp. 739–743, 1997.
[22] C. S. Colon-Emeric, C. S. Colon-Emeric, C. F. Pieper, C. F. Pieper, C. F. Pieper, and M. B. Artz, “Can historical and functional risk factors be used to predict fractures in community-dwelling older adults? Development and validation of a clinical tool,” Osteoporos. Int., vol. 13, no. 12, pp. 955–961, 2002.
[23] T. S. Wei, C. H. Hu, S. H. Wang, and K. L. H. D. Of, “Fall Characterictics, Functional Mobility and Bone Mineral Density as Risk Factors of Hip Fracture in the Community-Dwelling Ambulatory Elderly,” Osteoporos. Int., vol. 12, no. 12, pp. 1050–1055, Dec. 2001.
[24] W.-L. Liu, “Serious Fall-Related Injury in an Eldery (III),” Dep. Health Exec.
Yuan, 1999.
[25] L. J. Melton Iii, R. D. Brown Jr, S. J. Achenbach, W. M. O’Fallon, J. P.
Whisnant, and J. P. Whisnant, “Long-term fracture risk following ischemic stroke:
a population-based study,” Osteoporos. Int., vol. 12, no. 11, pp. 980–986, 2001.
[26] K. Sze, E. Wong, H. Y. Leung, and J. Woo, “Falls among Chinese stroke patients during rehabilitation,” Arch. Phys. Med. Rehabil., vol. 82, no. 9, pp. 1219–1225, 2001.
[27] J. S. Yates, S. M. Lai, P. W. Duncan, and S. Studenski, “Falls in community- dwelling stroke survivors: an accumulated impairments model,” J. Rehabil. Res.
Dev., vol. 39, no. 3, p. 385, 2002.
[28] S. E. Lamb, L. Ferrucci, S. Volapto, L. P. Fried, J. M. Guralnik, and others, “Risk factors for falling in home-dwelling older women with stroke,” Stroke, vol. 34, no. 2, pp. 494–501, 2003.
[29] P.-F. Tong, “Balance Recovery and Training on Fall Prevention in Stroke,”
NHRI, 2003.
[30] Ta-Sen Wei, Peng-Ta Liu, Liang-Wey Chang, and Sen-Yung Liu, “Gait
asymmetry, ankle spasticity, and depression as independent predictors of falls in ambulatory stroke patients,” PLOS One, vol. 23;12(5), May 2017.
Gait Asymmetry, Ankle Spasticity, and Depression as Independent Predictors of Falls in Community-Dwelling
Ambulatory Stroke Patients
Introduction
A fall is the common injury in stroke patients. Fall occurrence in stroke survivors is 25–37% within 6 months and 23–50% 6 months post-stroke [1–6]. Accidental falls
and fall-related injuries, such as hip fracture, often lead to serious disability and affect the patient’s overall health. Many studies have attempted to identify fall risk factors as
predictors and established a sensitive prediction model for stroke patients. Therefore, early interventions for preventing falls may be beneficial to stroke patients.
The causes of fall are complicated, and several factors may result in falls, including impaired balance and gait, declining cognition, muscle weakness, and presence of neurological diseases. Previous studies have demonstrated that balance, walking ability, and physical performance assessments are useful predictors of fall occurrence in stroke patients post-discharge from rehabilitation units [7–9]. These studies have demonstrated that physical performance assessments, including asymmetrical gait pattern, Berg Balance Score (score≦29 at admission), Fall Efficacy Scale (score ≥ 33), and spasticity, predicted the risk of fall in stroke patients to a certain accuracy
[10–13].
These findings also suggest that existing predictors of falls exhibit some
limitations, especially gait and balance assessments. For example, clinical measures typically assign numerical values to determine the level of performance on tests (e.g., Berg Balance Scale, Performance-Oriented Mobility Assessment, and Dynamic Gait Index). These measurements depend on expert ratings and subjective judgments, and the tests are mostly skill orientated without direct connection to the physiological mechanisms of temporal and spatial characteristics. Therefore, quantified assessments have been developed, and these measurements are more objective than the
measurements mentioned above.
A previous study associated impaired balance and gait to increased risk of falls in stroke survivors using quantified measurements [14]. However, the models used for this study did not provide high sensitivity or specificity. Another study also
demonstrated that gait and postural variability predicted accidental falls in nursing home residents [10]. The Interactive Balance System correlated with physiological mechanisms of fall, but the predictive ability in this study was limited [10].
Psychological factors may also play an important role in fall occurrence in stroke
patients. This concept was supported by results that impaired balance and gait
negatively affected psychological distress in stroke survivors [15]. Another study also demonstrated that 30% of stroke patients suffered depression in the early- or late- stage post-stroke [16]. Depression was also a risk related to falls in stroke patients in a previous study [17].
No comprehensive analyses integrate the identified fall risk factors. Quantified gait and balance measurements are more objective and should be used for clinical
evaluations. Psychological factors may also be important risk factors for predicting falls in stroke patients. However, studies of fall prediction using objective, quantified gait and balance assessments and psychological evaluations after stroke are limited.
Therefore, a prediction model for falls in stroke patients should be developed using a multidimensional assessment to increase prediction accuracy. The present study used physical assessments, including objective computerized gait and balance
measurements, and psychological evaluation to identify risk factors related to falls in stroke patients after discharge from hospital and develop a fall prediction model with high sensitivity and specificity.
Materials and Methods
The Institutional Review Board of a tertiary medical center, Changhua Christian
Hospital, approved this prospective cohort study, which was performed in a rehabilitation ward and patients’ homes.
2.2.1 Participants
A total of 140 hospitalized patients who suffered their first stroke were enrolled according to the following criteria: (1) stroke confirmed on MRI or CT; (2) ability to walk independently (with/without assistive device) at least 10 meters; (3) no fall history within 1 year before stroke onset; and (4) written informed consent. Only patients who met the above entry criteria were included to specifically identify the fall risk factors related to stroke.
A ten-meter walk test was included because it is a valid, reliable assessment for
predicting falls in subjects with stroke [12,18]. This test collected dynamic gait parameters as predictors of fall. Therefore, subjects who walked with a person’s
assistance had an external supportive force that may interfere with the assessment of gait, and these patients were not included in the present study. No fall history within 1
exhibit subsequent factors while walking independently, including fear of a fall, decreased mobility, and changes in gait pattern. Subjects with a history of falling previously may also have their movements closely monitored by their family
members or caregivers [12]. These conditions may confound the relationship between variables and fall risk assessment.
Subjects dropped out during the follow-up for the following reasons: nursing home residency (11 subjects), unstable internal disease (8 subjects), unable to complete the interview due to dementia or severe cognitive impairment (4 subjects), loss of contact due to residence address changes (3 subjects), and epilepsy (2 subjects). Therefore, 112 subjects completed the study, and these subjects were further divided into two groups, faller or non-faller, depending on whether a fall occurred during the study period.
2.2.2 Baseline Measurements
Initial assessments were performed at baseline including demographic data and a standardized recording of history and clinical examinations. Baseline physiological and psychological assessments were performed before subjects were discharged from the hospital (approximately 1 month after stroke). These baseline measurements of
physical and psychological parameters were used as fall risk factors to develop the fall risk prediction model.
Physical assessments included the Modified Ashworth Scale (MAS), which was
used to assess muscle tone in the elbow flexor, knee extensor, and ankle plantar flexor [19]. The level of a patient’s disability was assessed according to the Functional
Independence Measure (FIM) [20]. Performance of activities in daily life was assessed during hospitalization according to eighteen items, including bathing, dressing, toileting, transferring, urinary continence, cognitive comprehension and social interaction. This assessment is widely used to measure and predict outcome [21].
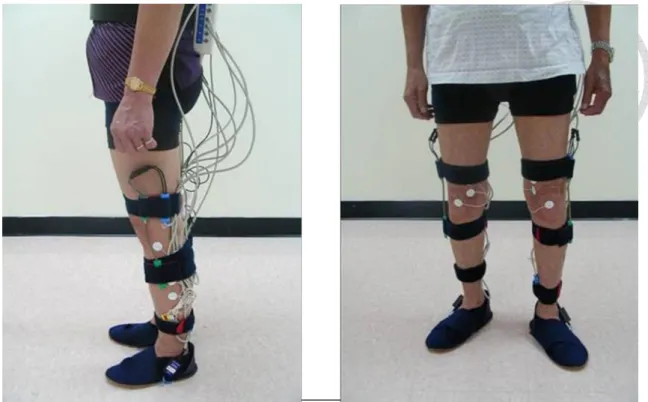
The objective measurements of gait were completed using computerized systems with wearable inertial sensors. Subjects wore customized shoes (Ultraflex, Infotronic, the Netherlands) with eight load sensors (Figure 2-1 & Figure 2-2 ) in each shoe to measure the forces under the foot and detect temporal events in the gait cycle prior to the gait measurements. Data were sampled at the rate of 100 Hz and stored in a portable (Walkman size), lightweight data logger that was carried on the lower back of each subject. Several practice tests were performed before actual data were
collected. Subjects walked at a self-selected speed over a 10-m hallway. The mean values of the two tests were used. Gait parameters were normalized to the subject’s body height to account for possible effects of anthropometrics [22,23]. The temporal asymmetry ratios (ASY) for single support time (ASY_ss), double support time (ASY_ds), single swing time (ASY_swing), stance time (ASY_stance), and step time
(ASY_step) were quantified using the following equation [24]:
𝐴𝑠𝑦𝑚𝑚𝑒𝑡𝑟𝑦 𝑟𝑎𝑡𝑖𝑜 = |1 − 𝑎𝑓𝑓𝑒𝑐𝑡𝑒𝑑 𝑠𝑖𝑑𝑒 𝑢𝑛𝑎𝑓𝑓𝑒𝑐𝑡𝑒𝑑 𝑠𝑖𝑑𝑒|
A greater value of this ratio indicates higher asymmetry between the two sides.
The objective computerized measurements of balance were completed while the subjects stood on a Stabilo-platform (Ultralfex, Infotronic, the Netherlands) in a comfortable position without footwear or ankle foot orthoses. Subjects kept their eyes open and arms at their sides and were instructed to maintain their balance for 20 seconds [25,26]. Three tests were performed with a 30-second rest between tests. The mean value of three tests is presented. Subjects’ performances were recorded as the center of pressure (COP) trajectory paths. Data were sampled at the rate of 100 Hz, and COP stability was calculated as the standard deviation of the anterioposterior (COP_ap) and mediolateral (COP_ml) directions of the points obtained during
measurement. The sway area (COP_area) was calculated as the square root of the sum of squares of the COP_ap and COP_ml.
Figure 2-1 Ultraflex Computerized Dynography data logger, Infotronic, Netherland.
Figure 2-2 Shoes with force sensors to measure ground reaction force.
Psychological evaluations included the Mini-Mental State Examination (MMSE) [27] and Chinese translated version of the Geriatric Depression Scale (GDS) [28], which were used to screen for cognition and depression, respectively. The modified Falls Efficacy Scale (mFES) was used to evaluate the fear of falling in stroke patients [29].
2.2.3 Assessment of Falls
Falls were defined as incidents when the subject came to rest on the floor due to an unexpected loss of balance. All subjects were followed up for 6 months after the first assessment to collect the record of falls. Trained research nurses visited the subjects at home 4, 12 , and 24 weeks after discharge from the hospital or rehabilitation ward.
Phone reports from subjects were also encouraged in this study to prevent errors from retrospective data collection.
2.2.4 Statistics
Descriptive analysis was used for all variables, and results are presented as the means, standard deviations and percentages. Significant differences between fallers and non-fallers were assessed using independent Student’s t-test for continuous variables and χ2 test analysis for categorical variables. The Mann-Whitney U test was
used to detect mean differences between groups when variable distributions were not
normal. Linear correlations between continuous variables were calculated using Pearson’s correlation test. Multivariate logistic regression (MLR) analysis was
performed using a forward stepwise method with an entry criteria of P =0.1 to identify the factors that were independently associated with falls. Two models were developed based on variables with statistical significance from bivariate analysis and clinical interests. Adjusted Odds Ratios (aOR) were acquired from the estimated coefficients and presented with the corresponding 95% confidence interval (CI) of the ratio.
The predictive accuracy of the model in discriminating fallers and non-fallers was assessed using sensitivity and specificity. The optimal cutoff point with the highest sensitivity and specificity for each model was defined as the Youden index [30,31].
A receiver operating characteristics (ROC) curve was plotted to assess the
discrimination of the generated multivariate logistic models. The area under the curve (AUC) of the ROC was also calculated for each model to determine the fitness of individual MLR analysis. An AUC value below 0.5 was considered no discrimination, 0.7≦AUC≦0.8 was considered acceptable discrimination, 0.8≦AUC≦0.9 was considered excellent discrimination, and 0.9≦AUC≦1.0 was considered outstanding discrimination [32]. Commercial statistical software, SPSS version 13.0, was used,
and a two-tailed P <.05 was considered significant.
Results
A total of 140 subjects were enrolled, and 112 subjects (60 men and 52 women) completed the study. The mean age, height, and body weight of the subjects were 69.6
±10.3 years old (range, 45-89 years old), 158.1 ± 6.7 cm (range, 143–175 cm), and 61.2 ± 9.9 kg (range, 41–85 kg), respectively. Approximately half (50.8%) of all the subjects were right hemiplegic patients, and 88.4% of the subjects suffered stroke due to infarction.
Subjects were further divided into non-faller and faller groups depending on whether the subject experienced falls during the follow-up period. A total of 37 patients who experienced falls were classified into the faller group, and 75 subjects were classified into the non-faller group.
No significant differences were found in baseline measurements of age, gender, height, body weight, stroke affected side, stroke type, mental status, ambulation aids, or medications between faller and non-faller groups. However, physical and
psychological assessments revealed that the faller group exhibited higher MAS and GDS and lower FIM and mFES scores compared to the non-faller group (Table 2-1).
These physical and psychological assessments indicated that the faller group exhibited
higher muscle tone, more severe depression, poor overall activity performance of daily life and lower confidence.
Table 2-1 Baseline measurements of the study subjects.
Groups Variables
All subjects (n = 112)
Non-faller (n = 75)
Faller
(n = 37) P value
Age 69.6 ± 10.3 69.9 ± 10.0 68.9 ± 10.8 0.629
Female (%) 52(46.4) 35(46.7) 17(46.0) 0.943
Height (cm) 158.1 ± 6.7 158.7 ± 6.7 157.1 ± 6.7 0.269 Weight (kg) 61.2 ± 9.9 61.5 ± 9.5 60.5 ± 10.7 0.635 Affected Side - right (%) 57(50.8) 38(50.7) 19(51.3) 0.946 Type - Infarction (%) 99(88.4) 67(89.3) 32(86.5) 0.853 MAS
Elbow Flexor 0.7 ± 1.1 0.3 ± 0.8 1.4 ± 1.3 < 0.001 Quadriceps 0.6 ± 0.9 0.3 ± 0.7 1.1 ± 1.1 < 0.001 Gastrocnemius 0.6 ± 1.1 0.3 ± 0.7 1.3 ± 1.3 < 0.001
Soleus 0.6 ± 0.9 0.3 ± 0.7 1.1 ± 1.1 < 0.001
MMSE 21.8 ± 5.1 22.4 ± 4.8 20.5 ± 5.5 0.078
FIM
Motor 79.6 ± 12.9 84.2 ± 10.0 71.1 ± 13.6 < 0.001
Cognition 29.9 ± 4.3 31.0 ± 3.8 28.0 ± 4.6 0.001
Total 109.5 ± 15.4 115.1 ± 12.3 99.1 ± 15.4 < 0.001 mFES 96.7 ± 33.8 108.5 ± 29.0 74.9 ± 31.3 < 0.001
GDS 4.5 ± 3.9 3.2 ± 3.3 7.1 ± 3.7 < 0.001
Ambulation Aids
Independent walk (%) 35(31.3) 22(31.4) 13(31.0)
Quadricane (%) 67(58.2) 42(60.0) 25(59.5) 0.947
Walker (%) 10(8.9) 6(8.6) 4(9.5)
Medications
Laxative (%) 66(0.59) 40(53.3) 26(70.3) 0.087
Benzodiazepines (%) 39(0.35) 23(30.7) 16(43.2) 0.189
Hypoglycemic (%) 12(0.11) 8(10.7) 4(10.8) 0.981
Antihypertensives (%) 45(0.40) 26(34.7) 19(51.4) 0.090 Values are % or mean ± SD.
MAS, Modified Ashworth Scale; MMSE, Mini-Mental State Exam; FIM, Functional Independence Measure; mFES, modified Fall Efficacy Scale; GDS, Geriatric
Depression Scale
We used an unbiased quantification using a computerized system to measure the balance and gait abilities in patients post-stroke to provide objective analyses. These computerized measurements were considered to be more objective tools than the traditional assessments [33].
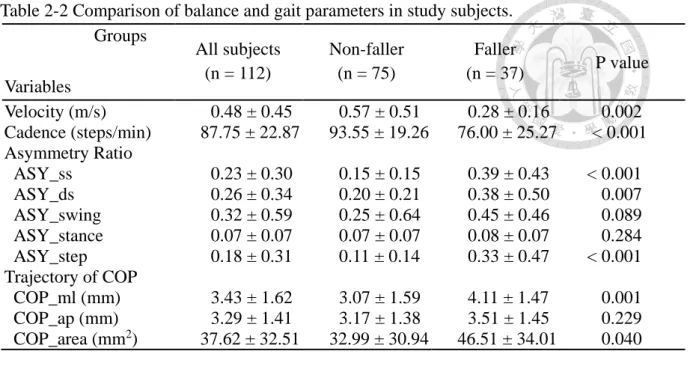
The abilities of balance and gait were different between faller and non-faller groups. Computerized gait assessment revealed that the faller group exhibited slower walking velocity and fewer cadences compared to the non-faller group (P < .001) (Table 2-2). The temporal asymmetry ratios for ASY_ss, ASY_ds, and ASY_step were significantly greater (approximately twofold) in the faller group (P < .05). These results indicated that the faller group exhibited more severe asymmetry gait than the non-faller group.
The faller group exhibited larger COP_area and greater COP_ml in computerized balance assessments (P < .01). These results demonstrated that the faller group exhibited worse postural sway in the mediolateral direction and area compared to the non-faller group. Therefore, the computerized gait and balance assessments may be used to accurately predict fall in the faller group.
Table 2-2 Comparison of balance and gait parameters in study subjects.
Groups Variables
All subjects (n = 112)
Non-faller (n = 75)
Faller
(n = 37) P value Velocity (m/s) 0.48 ± 0.45 0.57 ± 0.51 0.28 ± 0.16 0.002 Cadence (steps/min) 87.75 ± 22.87 93.55 ± 19.26 76.00 ± 25.27 < 0.001 Asymmetry Ratio
ASY_ss 0.23 ± 0.30 0.15 ± 0.15 0.39 ± 0.43 < 0.001
ASY_ds 0.26 ± 0.34 0.20 ± 0.21 0.38 ± 0.50 0.007
ASY_swing 0.32 ± 0.59 0.25 ± 0.64 0.45 ± 0.46 0.089 ASY_stance 0.07 ± 0.07 0.07 ± 0.07 0.08 ± 0.07 0.284 ASY_step 0.18 ± 0.31 0.11 ± 0.14 0.33 ± 0.47 < 0.001 Trajectory of COP
COP_ml (mm) 3.43 ± 1.62 3.07 ± 1.59 4.11 ± 1.47 0.001 COP_ap (mm) 3.29 ± 1.41 3.17 ± 1.38 3.51 ± 1.45 0.229 COP_area (mm2) 37.62 ± 32.51 32.99 ± 30.94 46.51 ± 34.01 0.040 ASY_ss, asymmetry ratio of single support time; ASY_ds, asymmetry ratio of double support time; ASY_swing, asymmetry ratio of single swing time; ASY_stance, asymmetry ratio of stance time; ASY_step, asymmetry ratio of step time; COP, center of pressure; ml: medial-lateral; ap: anterior-posterior.
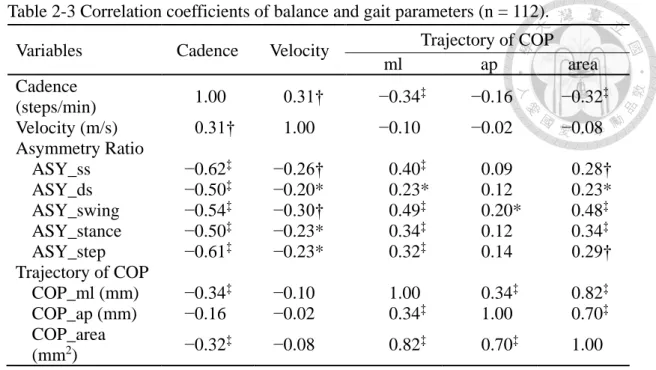
Correlation analysis was also performed based on the results in Table 2-2 to
determine the risk factors for predicting fall occurrence. Correlations between gait and balance variables were evaluated (Table 2-3). All parameters of the temporal
asymmetry ratios negatively correlated with walking velocity and cadence. The COP_ml and COP_area exhibited a low-to-medium positive correlation with all parameters of the temporal asymmetry ratios. Therefore, the computer automatically selected ASY_ss and COP_ml to represent the gait and balance assessments,
respectively, for further analysis.
Table 2-3 Correlation coefficients of balance and gait parameters (n = 112).
Variables Cadence Velocity Trajectory of COP
ml ap area
Cadence
(steps/min) 1.00 0.31† −0.34‡ −0.16 −0.32‡
Velocity (m/s) 0.31† 1.00 −0.10 −0.02 −0.08
Asymmetry Ratio
ASY_ss −0.62‡ −0.26† 0.40‡ 0.09 0.28†
ASY_ds −0.50‡ −0.20* 0.23* 0.12 0.23*
ASY_swing −0.54‡ −0.30† 0.49‡ 0.20* 0.48‡
ASY_stance −0.50‡ −0.23* 0.34‡ 0.12 0.34‡
ASY_step −0.61‡ −0.23* 0.32‡ 0.14 0.29†
Trajectory of COP
COP_ml (mm) −0.34‡ −0.10 1.00 0.34‡ 0.82‡
COP_ap (mm) −0.16 −0.02 0.34‡ 1.00 0.70‡
COP_area
(mm2) −0.32‡ −0.08 0.82‡ 0.70‡ 1.00
ASY_ss, asymmetry ratio of single support time; ASY_ds, asymmetry ratio of double support time; ASY_swing, asymmetry ratio of single swing time; ASY_stance, asymmetry ratio of stance time; ASY_step, asymmetry ratio of step time; COP, center of pressure; ml: Medial-Lateral; ap: Anterior-Posterior
*P < .05; † P < .01; ‡ P < .001
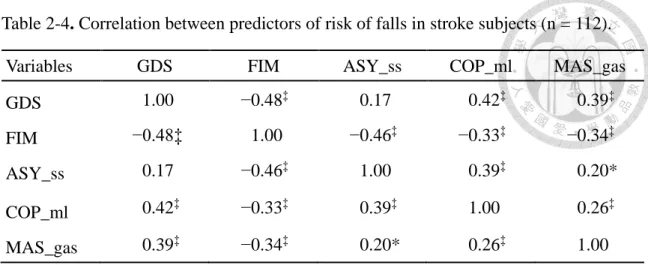
Correlations between computerized gait and balance assessments and other physical or psychological assessments were further analyzed. The MAS of the gastrocnemius exhibited a low-to-medium positive correlation with COP_ml, ASY_ss, and GDS (Table 2-4). FIM also exhibited a medium negative correlation with MAS. This correlation analysis demonstrated that FIM negatively correlated with most of the physical and psychological assessments. The strength of the correlation was low-to-moderate between variables (Table 2-3and Table 2-4), but most correlations revealed significant
differences. These results were used as variables for the subsequent MLR analysis.
Table 2-4. Correlation between predictors of risk of falls in stroke subjects (n = 112).
Variables GDS FIM ASY_ss COP_ml MAS_gas
GDS 1.00 −0.48‡ 0.17 0.42‡ 0.39‡
FIM −0.48‡ 1.00 −0.46‡ −0.33‡ −0.34‡
ASY_ss 0.17 −0.46‡ 1.00 0.39‡ 0.20*
COP_ml 0.42‡ −0.33‡ 0.39‡ 1.00 0.26‡
MAS_gas 0.39‡ −0.34‡ 0.20* 0.26‡ 1.00
GDS, Geriatric Depression Score; FIM, Functional Independence Measure; ASY_ss, asymmetry ratio of single support; COP_ml, center of pressure in mediolateral direction;
MAS_gas, Modified Ashworth Score of the gastrocnemius
* P < .05; ‡ P < .001.
The variables in Table 2-3 and Table 2-4 were used for MLR analyses to determine the risk factors for predicting fall in stroke patients. Two models were subsequently generated. Table 5 shows that the significant predictors of fall occurrence (with P<0.05) in stroke patients were as follows in model I of the MLR analysis: (1) GDS (adjusted OR, 1.4; 95% CI, 1.2–1.8; P = .001); (2) gait asymmetry (ASY_ss) [aOR, 2.2; 95% CI, 1.2–3.8; P =.006]; and (3) spasticity of the gastrocnemius (aOR, 3.2; 95% CI, 1.4–7.3; P
=.006). The sensitivity and specificity of this model were 82.6% and 86.5%,
respectively, with a Youden index of 0.69. The model I analysis suggested that GDS, Gait Asymmetry (Single Support), and Spasticity (Gastrocnemius) were strong
predictors for fall in stroke patients.
Notably, the commonly used measurement for regular functional assessment during stays in the rehabilitation unit, FIM,[34] was not automatically selected as one of the predictors after the MLR analysis in model I. This result may be attributed to the results that GDS exhibited the strongest negative correlation with FIM (-0.48) in the correlation analysis between risk factors in stroke subjects (Table 2-4). Therefore, GDS was
excluded in another round of MLR analysis, and prediction model II was generated.
Table 2-5 shows that the predictors of determining fall occurrence in model II included (1) FIM (aOR, 0.9; 95% CI, 0.9-1.0; P = .002), (2) gait asymmetry (ASY_ss) (aOR, 3.6;
95% CI, 1.4-9.2; P =.009), and (3) postural sway (mediolateral, COP_ml) (aOR, 1.7;
95% CI, 1.0-2.7; P = .033). Model II also exhibited relatively high sensitivity (76.9%) and specificity (75.7%) with a Youden index of 0.53, but the sensitivity and specificity were lower than model I.
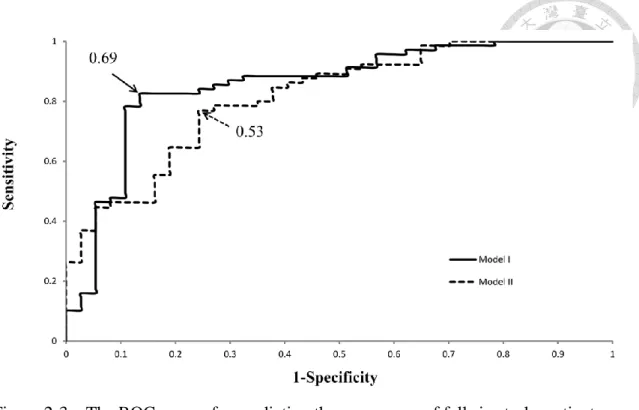
The ROC curves of the two models (Figure 2-3) for predicting falls in stroke patients were plotted to discriminate the two multivariate logistic models presented in Table 2-5.
The ROC analysis revealed that model I (AUC value: 0.856) was better fitted than model II (AUC value 0.815). However, both models exhibited excellent fitness to
predict fall occurrence in stroke patients with high sensitivity and specificity, with AUC values greater than 0.8[32].
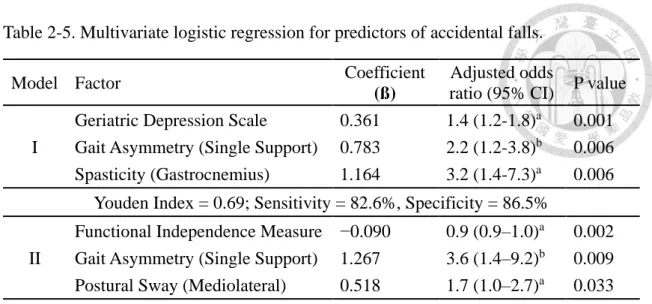
Table 2-5. Multivariate logistic regression for predictors of accidental falls.
Model Factor Coefficient
(ß)
Adjusted odds
ratio (95% CI) P value I
Geriatric Depression Scale 0.361 1.4 (1.2-1.8)a 0.001 Gait Asymmetry (Single Support) 0.783 2.2 (1.2-3.8)b 0.006 Spasticity (Gastrocnemius) 1.164 3.2 (1.4-7.3)a 0.006
Youden Index = 0.69; Sensitivity = 82.6%, Specificity = 86.5%
II
Functional Independence Measure −0.090 0.9 (0.9–1.0)a 0.002 Gait Asymmetry (Single Support) 1.267 3.6 (1.4–9.2)b 0.009 Postural Sway (Mediolateral) 0.518 1.7 (1.0–2.7)a 0.033
Youden Index = 0.53; Sensitivity = 76.9%, Specificity = 75.7%
a: predicted change in odds for a unit increase in corresponding variables
b: predicted change in odds for a standard deviation (SD = 0.3) in corresponding variable
Figure 2-3 The ROC curves for predicting the occurrence of falls in stroke patients using models I and II. AUCs were 0.856 and 0.815, respectively. Arrowheads indicate the identified optimal cutoffs (Youden Index) for these prediction models (0.69 in model I and 0.53 in model II).
Discussion
To our knowledge, this study is the first to include physical and psychological
variables for determining the predictive risk factors of fall in stroke patients. The results underscore the significance of quantitative gait and balance assessments before
discharge from rehabilitation units for predicting fall in stroke subjects by comparing the functional and baseline variables between the faller and non-faller groups of stroke subjects.
The faller group exhibited slower walking speed, asymmetrical gait, unstable balance, and lower functional performance than the non-faller group at baseline. Thirty-seven of the 112 enrolled subjects had at least one falling accident within 6 months after a stroke in this study (33% fall incidence).
Impaired gait symmetry, depression, and higher abnormal muscle tone were found in stroke patients who experienced falls. Prediction models for falls in stroke patients were developed using these physical and psychological parameters. The current findings provide sufficient information for predicting future falls, and early intervention strategies may be implemented to prevent falls in stroke patients.
2.4.1 Assessment of Falls
Previous studies reported that the “gold standard” for collecting information on falls (e.g., prospective collection with calendars or postcards, regular reminders, and follow- up telephone calls) was prone to errors (e.g., memory, forgetting to write diaries and ambiguous definitions of fall)[14]. To minimize these types of errors in this study, falls were recorded regularly by nurses during home visits 4, 12, and 24 weeks post-discharge and by subjects’ self-report. Recordings of fall history, environmental risk exam, and medical consultations were performed during the interviews with each subject. One advantage of the interview was to provide better interaction between subjects and research team workers. Therefore, subjects could fully understand the risk of falls and the ultimate goal of this study to prevent fall occurrence.
2.4.2 Balance and Gait Performance
Poor postural balance was linked to increased fall risk in previous studies[11,35,36].
Mediolateral COP displacement during normal standing may be used as an indicator of accidental falls in the elderly because it was significantly associated with future falls [37].
The results of this study also demonstrated that postural sway in the mediolateral direction and area were greater in fallers compared to non-fallers.
A hemiparetic gait is described as slow and asymmetrical [38, 39]. Walking velocity and cadence were lower in the faller group than the non-faller group in the present study.
Gait speed is generally selected as the outcome measurement in clinical practice and a predictor of fall after a patient has a stroke, but gait speed is often confounded with balance, motor function, and endurance [40]. The current study adopted a quantitative gait analysis to help assess the risk of fall and further describe gait performance adequately.
A previous study reported that temporal gait symmetry measurement appeared to better reflect components related to weight shift, and it was superior to spatial symmetry ratios for identifying the risk of falls in impaired ambulators [38]. An “asymmetry ratio” was used to represent the level of temporal asymmetry (ASY_ss, ASY_ds, and ASY_step) in the present study, which was significantly different between fallers and non-fallers. An increase of one standard deviation in ASY_ss was associated with a 2.2 and 3.6 times higher fall risk in models I and II, respectively.
2.4.3 Spasticity Related to Falls
An asymmetrical gait pattern caused by impaired balance and abnormal muscle tone is commonly seen in stroke patients. The present results demonstrated that the severity of spasticity in the upper and lower extremities was markedly higher in the faller group
compared to the non-faller group. These findings are consistent with another study that also reported spasticity as a risk factor for predicting falls in chronic stroke patients.
Motor control and functional status of stroke patients declined with increasing spasticity [13]. Logistic regression model I in this study also demonstrated that spasticity of the gastrocnemius was a predictor of fall in stroke patients. Another study found that the degree of spasticity of the affected ankle plantar flexors primarily influenced gait asymmetryp[24]. A spastic gait in stroke patients diminished power generation,
decreased hip and knee flexion during the swing phase, and reduced stability during the stance phase due to the affected hip flexors, knee extensors, and ankle plantar
flexors[41]. The present study revealed that the risk of fall increased 3.2 times when the severity of spasticity in the gastrocnemius increased by one grade. The results also support that the combination of gait asymmetry and abnormal muscle tone may increase falls in the stroke population.
Previous studies reported that spasticity reached a peak within 1–3 months after a stroke [41-45]. Thirty-nine percent of patients who suffered a first stroke exhibited sustained spasticity after 12 months [19]. Therefore, the early detection of spasticity and improvement in motor dysfunction using specific interventions, such as stretching, splinting, electrical stimulation, and botulinum toxin injection, may be crucial to reduce
accidental falls[46].
2.4.4 Effects of Functional Performance
The Functional Independence Measure (FIM) is widely used to evaluate the
performance of a patient’s daily activity to determine the level of a patient’s disability.
All functional performance assessment results were significantly higher in non-fallers than fallers in our study. The fall risk decreased by 10% when the FIM score increased by one point. Previous studies also reported the significant correlation between FIM and fall occurrence [47-49]. A previous 10-year retrospective study also demonstrated the same correlation between the FIM score and fall risk [50], which is consistent with present results. However, the FIM score as a single variable may not be sufficient to accurately predict fall risk because falls generally resulted from multiple factors. The finding is also consistent with our MLR model, which enhanced the sensitivity and specificity of fall prediction.
2.4.5 Effects of Depression in Stroke Patients
Depressive symptoms are common in the acute phase after stroke, and symptoms are associated with the persistence of depression and mortality after 12 months [51]. The
current MLR model in this study demonstrated that the risk of fall increased 1.4 times with a one-unit increase in GDS. Moreover, fall risk may cumulatively increase due to a high cognitive load if the patient also had multiple motor impairments and depression combined with gait asymmetry and spasticity.
2.4.6 Fall Prediction Model
A bivariate correlation between risk predictors of accident fall in stroke subjects was performed to determine which variables to include in the MLR analysis. The results of bivariate correlation test revealed that the FIM and GDS exhibited the highest strength of negative correlation (Table 2-4). Therefore, two logistic regression models, including FIM or GDS, were developed in this study to determine the best fit of fall predictive factors. Notably, model I, which included GDS, gait asymmetry, and spasticity, exhibited slightly higher specificity, sensitivity, and Youden index than model II. Gait
asymmetry, spasticity, and depression represented the functional, physical, and
psychological domains of the subject’s impairments in function, respectively. Therefore,
these results suggest that model I provides more comprehensive fall prediction than model II. ROC analysis further verified the discrimination of fitness of model I with a slightly greater AUC value (0.856) than model II (AUC value 0.815).