Peer Effects of Cram Schooling on Academic Achievement
of Junior High Students in Taiwan
Ping-Yin Kuan Associate Professor Department of Sociology, National Chengchi University
Taipei, Taiwan
E-mail: [email protected])
The paper is prepared for the Summer Conference on “Demographic Perspectives on Inequality,” the Research Committee on Social Stratification and Mobility (RC28), International Sociological Association, August 17-19, 2015, The University of Pennsylvania, Philadelphia, PA, USA.
Abstract
The present research attempts to assess the impact of student’s own cram schooling and the prevalence of cram schooling among student’s junior high classmates on student’s learning achievement in 9th grade. Based on the extant literature on peer effects in educational research, the prevalence of cram schooling might have either positive or negative effects on students’ learning achievement. Since both the
behavior of participation in cram schooling and the prevalence of cram schooling are endogenous variables, it is important to use appropriate statistical methods to analyze observational data in order to identify the causal effects of these variables. The present study used multilevel linear model and doubly-robust estimation to assess the causal effects of student’s own cram schooling and the prevalence of cram schooling among student’s classmates. The study used data of junior high panel samples gathered by Taiwan Education Panel Survey (TEPS) in 2001 and 2003 to answer the research question. The analytical sample is limited to those students who were classmates since 7th grade. The research found that based on the average treatment effect (ATE) estimated by the multilevel linear model or by the doubly-robust estimation model, the effect of student’s own 9th grade cram schooling would increase only about 0.4 point in his/her learning achievement. The ATE estimate, however, is not significant in the doubly-robust estimation model. The estimate of the average treatment effect on the treated (ATT) based on the doubly-robust model indicates statistically significant increase for about 1 point for students who
participated in cram schooling in 9th grade. The research also finds that the prevalence of cram schooling among student’s classmates in general has no significant effect of student’s 9th grade learning achievement.
Peer Effects of Cram Schooling on Academic Achievement of Junior High Students in Taiwan
Ping-Yin Kuan
Introduction
Students of Taiwan, along with its neighboring societies such as South Korea, Japan and China, are long reputed for eager engagement in shadow education, the private paid tutoring of various forms after school (Zeng 1999; Park 2013). In recent time, shadow education has found to be expanded other than these regions (Bray 2009). While extra learning of subjects taught at school may have positive impacts on students’ own academic achievement, educators and policy makers are concerned about the possible negative impacts of shadow education. If shadow education is effective in contributing to students’ academic success or achievement, then as a form of paid private supplementary education, it would certainly be an important channel for maintaining or even exacerbating social inequalities between socioeconomic more privileged and less advantaged. The prevalence of the supplementary educational practice may also create problematic situations for formal education system since both teachers and students may reduce their efforts and devotion in regular classes at schools (Bray 2003; Bray and Lykins 2012). One of the persistent reasons for several waves of educational reform since 1990s in Taiwan is to reduce students’ high
pressure in competitive entrance examinations and related long hours of learning and to stem the alarming prevalence of cram schooling (Buxi), as commonly called in Taiwan to describe various forms of paid private tutoring. These successive reforms, however, do not seem to stem the demand for cram schooling. In 2001, according to Taiwan Education Panel Survey (TEPS), 72.9% of 7th graders attended cram schools and in 2003, about 56% of the same group of students attended cram schools in 9th
grade. Surveys conducted by Taiwan Assessment of Student Achievement (TASA) between 2007 and 2013 indicated that about 50% of 8th graders attended crams schools for additional learning in English and mathematics (Lee 2015). Apparently, students and parents may either believe cram schooling can offer an edge in
competing for schools or colleges of better quality (Kuan 2011) or behave
normatively as the prevalence of cram schooling has induced cultural expectation and peer pressure among students and their parents (Lin and Huang 2009).
With the growing trend of shadow education worldwide, it is important to
investigate the supposed positive and negative impacts of shadow education. Research on shadow education, however, is challenged by not only many different formats and delivery mechanisms of private supplementary tutoring, but also limitations in methods for analyzing observational data which may omit certain important information necessary for proper analysis of the effects of shadow education (Bray 2014). Moreover, the possible impacts of the prevalence of shadow education on students’ academic performance, for both students who are engaged or not, is even less studied (see, however, Baker et al. 2001; Kwo and Bray 2014). From the perspective of quantitative research, both the impacts of shadow education of student’s own academic performance and on all the students potentially affected are quite difficult to assess rigorously, however. The act of engaging in shadow education per se involves issues of endogeneity. Oftentimes, researchers do not have all relevant information regarding students’ motivations or choices to engage in shadow education and thus the assessment of the effectiveness of shadow education may be biased. The evaluation of the impacts of the prevalence of shadow education on all students potentially affected is similar to the assessment of the effects of peer effects which also involves the issues of endogeneity. Students both engaged and not engaged in the act of shadow education may interact with each other and affect each other
reciprocally and thus create “the reflection problem” (Manski 1993, 2000) in
identifying the unbiased effects of the prevalence of shadow education. The purpose of this paper, hence, intends to evaluate rigorously the effects of junior high student’s own engagement on shadow education and the prevalence of shadow education among student’s peers with the data gathered by Taiwan Education Panel Survey (TEPS).
Literature Review
The effect of student’s own engagement in shadow education on academic achievement
Extant research on the effectiveness of shadow education on students’ academic achievement, however, has been inconsistent (Bray 2014). The mixed findings on the effectiveness of student’s own engagement of shadow education may be related to operational definitions of shadow education, outcome variables studied, and types of statistical models used (Bray 2014; Byun 2015). For instance, earlier empirical studies in Taiwan using cross-sectional survey data and multiple regression analysis have shown that participation in cram schooling had positive effects on either educational attainment or years of schooling (Sun and Huang 1996; Chen 2001). Recently, Liu (2012) using the first wave data of junior high student sample collected by TEPS found a curvilinear relationship between hours of attending cram schools and general cognitive ability. It seems that only certain amount of cram schooling is beneficial for students’ academic achievement and over cramming may hurt instead of help students’ performance. Conscious of the endogeneity nature of participation in shadow
education, my own study of the impact of cram schooling on junior high students in Taiwan (Kuan 2011) used the method of propensity score matching (PSM) and focused on the effect of participation in math cramming on the outcome of students’
math ability in 9th grade. The study taking advantage of two waves of the panel study was able to control students’ math ability in 7th grade along with other covariates which should effectively limit the selection bias. The analysis showed that overall math cramming had a positive but fairly modest effect. Furthermore, the effects of math cramming were not homogeneous. For students whose 7th grade math ability was in the 3rd or the 5th quintiles, the effects of math cramming were even more modest. The analysis also showed strong impact of self-selection since those whose participation in math cramming were decided by others the effect of math cramming was not significant.
The findings about the effectiveness of shadow education in South Korea were also mixed (Byun 2015). For instance, Park, Byun and Kim (2011) using a panel study of middle school students and multiple regression analysis found that the private tutoring had a greater impact on math achievement than on Korean and English
achievement. Byun (2015) later explored the same data set but with the PSM method found that the effects of shadow education depended on the type of shadow education engaged. With matched samples, shadow education delivered through private tutors, corresponding courses, internet tutoring services or EBS (Education Broadcasting System) offered by the government had no effect on students’ cognitive ability. Only attending cram schools had a positive effect (see also Park 2013).
In the U. S. where shadow education is less prevalent, there were also studies of the effects of coaching on the SAT. Becker (1990) reviewed 23 studies and concluded that coaching helped increase SAT scores but the effects were fairly small. Moreover, she pointed out that most previous studies on the effects of coaching did not address the problem of self-selection. A later study carried out by Domingue and Briggs (2009) used both propensity score matching and linear regression analysis to assess the effect of propensity score matching and linear regression analysis to assess the effect of
coaching on SAT performance. They found that both methodological approaches produce positive but small effects, and that coaching was more effective for those who have taken up challenging coursework and come from high socioeconomic backgrounds. Byun and Park (2012) recently used the data of Educational
Longitudinal Study and found that the effects of coaching on the SAT varied among different racial groups. Overall, the effect of coaching was largest for student of East Asian heritage.
In summary, no matter in societies where shadow education is prevalent not, the effects of shadow education on participating students’ academic achievement are heterogeneous, which may depend on types of shadow education, amount of time committed to shadow education, and types of students in terms of motivation,
socioeconomic background, race or ethnicity, etc. If the studies used statistical models that took into account of possible selection bias, the positive effects found, even any, became even smaller comparing to those found by multiple regression analysis. These findings, however, may still be wanting in several respects. For one thing, most studies used statistical models, either traditional, such as multiple regression, or more sophisticated, such as PSM, all assume that outcomes of participating students of shadow education is not affected by their peers. For instance, the method of PSM along with other methods based on the potential outcomes approach maintain the stable unit treatment value assumption (SUTVA) which basically states that the causal effect of each individual is not affected by whatever treatment exposures other
individuals received (Rubin 1986; see also Morgan and Winship 2015). In other words, the assumption expects the interaction between the effect of a participant of shadow education will not be affected other students who are participants or not. This assumption can, of course, be easily questioned (Huang 2013) since the supposed negative impacts of shadow education on various aspects of formal schooling and
social equality are based on the notion that participating students of shadow education may directly or indirectly affect those are not involved in shadow education. It is also conceivable that a participating student’s academic performance may also be affected by other participating students positively or negatively and directly or indirectly. Furthermore, the research so far focuses mainly on the effects of students engaged in the practice of shadow education. In the parlance of the potential outcomes approach, the research so far focused on treatment effects on the treated. Hence, one important aspect of the investigation of shadow education is the effects of shadow education on non-participating students. My study of junior high students has explored the issue of the effect of math cramming on non-participating students (Kuan 2011). The study showed that math cramming might even have slightly larger effect on
non-participating students had they engaged in math cramming. The exploration, however, is tentative at best. The issue needs to be examined along with the
prevalence of shadow education dealt with both substantively and methodologically since participating and non-participating student would interact with each other and possibly affecting each other.
Peer effects of shadow education
While there may be few studies using large-scale survey data to investigate the prevalence of shadow education on students’ academic achievement, the issue can readily be generalized from the extant literature on studies of various kinds of peer effects on academic achievement in general. The discussion of peer effects in education covers topics such as the effects of class size, ability grouping, class or school compositions of sex, socioeconomic classes, or races, and class climate, etc. There can be three hypotheses regarding the effect of the prevalence of shadow education on students’ academic performance. The first hypothesis is the hypothesis
of no effect which is consistent with the SUTVA assumption. The finding of Baker et al. (2001) that there is no correlation at between mean mathematic scores and
percentage of students taking outside school learning at the country level gives some credence to such a hypothesis. There are, however, two more opposing hypotheses: one postulates a positive effect and the other, a negative effect.
The second hypothesis maintains that if the effect of shadow education on academic achievement is positive, then the prevalence of shadow education may promote overall academic performance for both participants and non-participants of shadow education. The hypothesis can be supported by at least two kinds of research findings. The first kind of studies that may lend support to the second hypothesis is research of ability grouping. Previous studies of ability grouping indicated that students assigned to high-ability groups would perform better than those who were not. Gamoran and Mare (1989), for instance, analyzed data of High School and Beyond and found that after controlling for possible selection bias, students placed in the college track would enhance substantially their growth in mathematics achievement and the probability of high school graduation. Mason et al. (1992) used experimental design to assign randomly 34 average-achieving 8th graders to advanced mathematics classes and found that these students performed better than their average-achieving cohort and no significant detrimental impact on the performance of high-achieving students. The findings of these studies, once again, could offer credence to the hypothesis that the prevalence of shadow education may promote overall academic achievement of students belonged to the same class under the premise that the effect of shadow education on academic achievement is positive.
The second kind of supporting evidences is related to experimental studies of peer effects of dorm mates on college students’ academic performance. Sacerdote (2001) taking the advantage of random assignment of freshman-year roommates and dorm
mates at Dartmouth College, which eliminated the possibility of the selection problem, found that roommates’ GPA would have a positive but modest effect on student’s own freshman-year GPA. The importance of the peer effect from freshman year, however, diminishes over time. Zimmerman (2003) has conducted a similar study at another college and found also that roommates’ verbal SAT before the enrollment would affect student’s own freshman-year GPA. Although this type of study has investigated only the impact of a fairly limited number of roommates on students’ own academic performance, the experimental design of the study could lend support to the
possibility that if students have quite a few classmates engaging in shadow education with positive effects on academic achievement, then students would be benefitted from these classmates.
The third hypothesis, essentially agreed with the critics of the growing trend of shadow education worldwide, argues that the prevalence of shadow education would create problems in formal school system (Bray 1999, 2003). The prevalence of shadow education, regardless the effect of shadow education is positive or not, may induce teachers to either reduce their efforts in regular classes or pay less attention to students who lack supplementary learning after school and perform less well. Students participating in shadow education may also pay less attention in their regular classes at school and in turn may negatively affect the learning climate at class and their fellow students’ academic performance. In short, the prevalence of shadow education may negatively affect particularly those who do not participate in shadow education. Which of the three hypotheses about the effect of the prevalence of shadow education will be supported is of course an empirical question which can be tested. The
following section describes the data and the method used to investigate the question in the context of Taiwan.
Data, Methods and Measures
Data
The present research utilizes two waves of junior high student panel samples collected by TEPS in 2001 and 2003 (Chang 2003) to assess the impact of student’s own cram schooling in 9th grade and the prevalence of cram schooling among his or her classmates on student’s own learning achievement in 9th grade. TEPS surveyed 20,004 7th-grade students in 333 junior high schools in 2001. The follow-up survey was done in 2003 when students were in 9th grade. The follow-up sample size was 18,903. Students were administered an ability test and a student questionnaire in the classroom under standardized conditions. Each surveyed student took home a parental questionnaire to be answered by a parent or guardian; the completed questionnaires were collected by the field staff. For the purpose of understanding the impact of the prevalence of classmates’ participation in cram schooling, the analytical sample is limited to schools without the practice of ability grouping and to those students who were classmates since 7th grade to avoid the possible serious confounding effect of ability grouping.1 The analytical sample is further limited to 9th grade classes with a size of 10 or more students to have sufficient sample cases in the analysis of peer effects at the class level. With the aforementioned consideration, the sample size of the present study is 3,652. The sampled students belong to 257 classes of 67 schools.
Methods
In order to answer the research questions about the effects of student’s own cram schooling and the prevalence of classmates’ participation in shadow education on student’s own academic achievement, I employ two kinds of statistical modeling: the multilevel linear model (MLM) and the model of doubly robust (DR) estimation. The
1 In order to know if students stayed in the same class since 7th grade, the present study uses the
authorized version of TEPS data that can identify classes and schools. My authorization code is TEPS2A002097
MLM is essentially an extension of multiple regression analysis which basically assumes that by properly controlling a set of confounding covariates, students participating cram schooling are comparable to non-participating students and the average treatment effects of cram schooling on academic performance would be the same for both participating and non-participating students. Specifically, the present study specifies a three-level random intercept model. The lowest level of the model is students, the second level is classes, and the third level is schools. The DR estimation is a model combines a regression adjustment model specified for the outcome variable with a model for the treatment variable (i.e., the propensity score model) to estimate the causal effect of the treatment on the outcome (Wooldridge 2010).2 In the present study, the outcome variable of interest is the proxy variable for 9th grade achievement and the treatment variable is the participation in cram schooling in 9th grade. The DR estimation has several advantages over the MLM. First of all, the DR estimation is a model of potential outcomes approach which does not assume the treatment effect of participating students of cram schooling is the same as the non-participating students. Moreover, the DR estimation is doubly robust in the sense that as long as one of the models specified, either the regression adjustment model for the outcome variable or the model for the treatment variable, is correct, then the estimation of the causal effect is unbiased. The DR estimation can also offer estimates for other explanatory
variables of interest. The present study is also interested in the effects of variables related to the prevalence of cram schooling of classmates.
Measures
The outcome variable of the present study is the indicator of students’ academic achievement in 9th grade offered by TEPS as estimated IRT scores of general
2 The present study uses the command of “teffects ipwra” (i.e., treatment effects estimated with
inverse-probability-weighted regression adjustment estimators) offered by Stata 13.1 to perform the DR estimation.
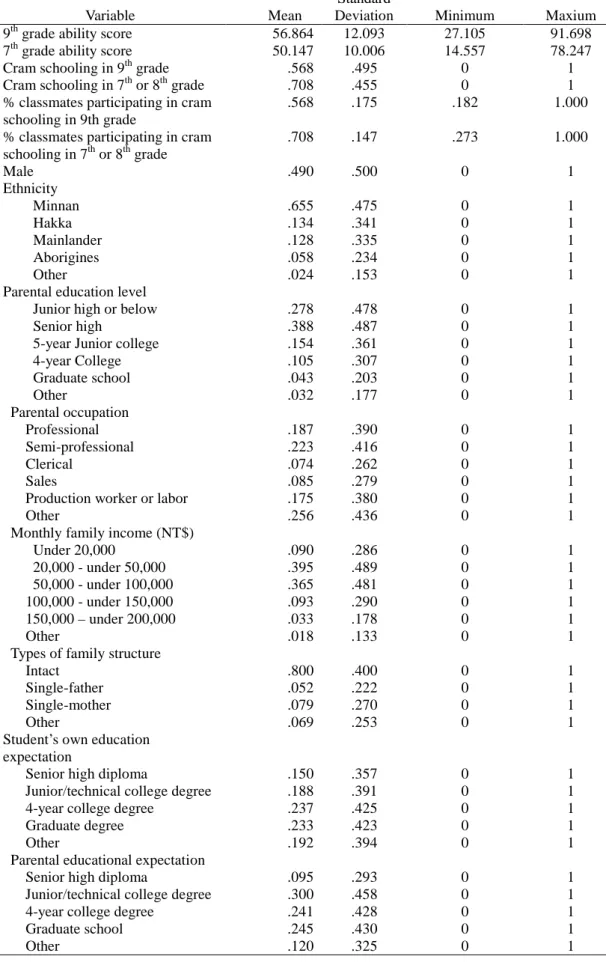
cognitive ability.3 For ease of presentation and understanding, IRT scores of the total sample of 7th grader are transformed into a normalized variable with a mean of 50 and a standard deviation of 10. For the purpose of comparing with the achievement in 7th grade and understanding the growth of later achievement, 9th grade IRT scores are also transformed accordingly. After the transformation and the selection for the analytical sample, the mean achievement score of 7th graders is 50.114 and the standard deviation is 10.017. The range of 7th grade achievement scores is between 14.557 and 78.247. The mean score in 9th grade is 56.846 and the standard deviation is 12.081. The range is between 27.105 and 91.698. The difference of mean scores between 7th and 9th grade indicates the average growth of 6 points in academic achievement. The increase of 2 points in the standard deviation of 9th grade also indicates an increase in the achievement gap among students in the last year of junior high (see Table 1).
[Table 1 about here]
The focal treatment variable of interest is the participation of cram schooling in 9th grade. Other than the treatment variable of interest, three more variables of interest are included in the analysis: whether students participated in cram schooling in 7th or 8th grade, the percentage of classmates participated in cram schooling in 9th grade, and the percentage of classmates participated in cram schooling in 7th or 8th grade. The latter two variables are proxies for the prevalence of classmates’ participation in shadow education experienced by students in junior high. Other covariates included in the analysis can be categorized into two groups:
1. Covariates at individual level: The covariates at student’s individual level are
33
Ideally, the study of the effect of shadow education is better to be subject specific, say, mathematics. Unfortunately, TEPS does not offer detailed information about the prevalence of cram schooling in previous grades. Moreover, since the correlation between math ability and general ability in terms of IRT scores of both waves are fairly high (.949 in 7th grade and .952 in 9th grade), it should be safe to assume that the effects of shadow education and the prevalence of it can be generalized by examining in terms of general IRT scores.
following information gathered by TEPS in 7th grade: 7th grade achievement score, student’s gender, ethnicity, parental highest level of education, parental occupation, family monthly income, types of family structure, student’s own educational expectation, parental educational expectation, and number of hours participated in cram schooling in 7th grade.
2. Covariates at class and school level: With information offered by the authorized version of TEPS data, I can identify if a student stayed with the same group of classmates in both 7th and 9th grade. Other than percentages of classmates
participated in cram schooling in either 7th or 8th grade, I also constructed 7th grade classmates’ average achievement scores, the mean and the standard deviation of 7th grade achievement scores at the school level. These class and school level variables are proxies that should summarize effectively important background variables at class and school level such as learning environment and average socioeconomic status.
Findings
The Prevalence of cram schooling
According to Table 1, about 56.9% of 9th graders included in the analytical sample participated in cram schooling, which is similar to the percentage of 9th graders engaged in shadow education in the whole TEPS sample. The average percentage of 9th graders’ classmates participating in cram schooling is, not surprisingly, also 56.9%. However, percentages of 9th graders’ classmates participating in cram schooling range from 18.2% to 100%. Obviously, not all 9th graders experienced the same degree of peer pressure as far as cram schooling is concerned. A higher percentage, 70.8%, of students and their classmates engaged in shadow education when they were in either 7th or 8th grade. The range of percentages of classmates’ participation in cram
schooling is between 27.3% and 100%.
Effects of student’s own cram schooling on 9th grade achievement
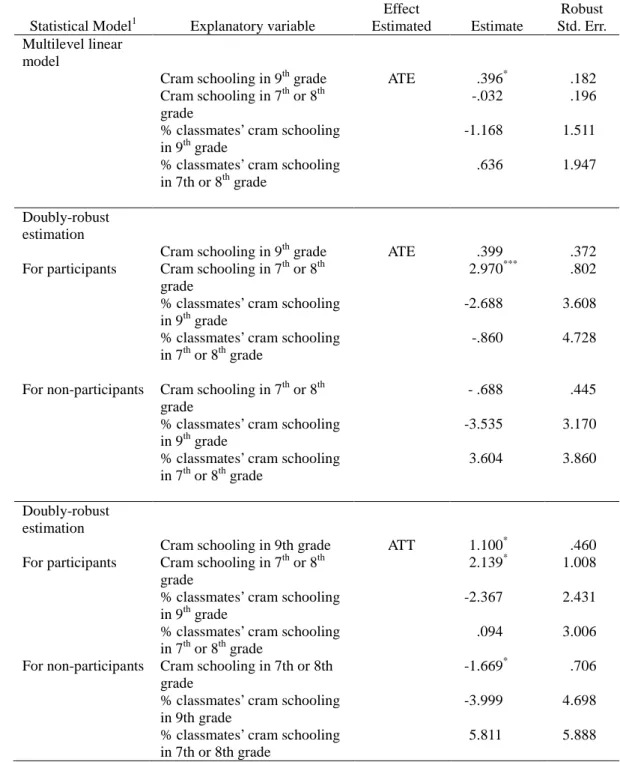
The causal effect of concern is the effect of cram schooling in 9th grade. The present study use two statistical models to estimate two kinds of causal effects: the average treatment effect (ATE) and the average treatment effect on the treated (ATT). Counterfacutally, the ATE estimates the effect of 9th grade cram schooling if all students were participants. The ATT estimates the cram schooling for those who indeed participated in cram schooling in 9th grade. As mentioned earlier, the MLM offers the estimate of the ATE and assumes the causal effect of cram schooling in 9th grade is the same for both students participating and not participating cram schooling. The model of DR offers both the estimate of the ATE and the ATT. In terms of the ATE, Table 2 indicates that both the MLM and the DR estimate the effect of cram schooling in 9th grade would increase on average the 9th grade ability score by about only .4 points and only the MLM estimate is statistically significant at p < .05. The ATT estimated by the DR model indicates that for students who indeed participated in cram schooling in 9th grade, the effect is about 1.1 point.
While the effect of 9th grade cramming estimated by the DR model may not be impressive, Table 2, however, shows that cram schooling in earlier periods is quite beneficial for 9th grade achievement for those who actually participated in cram schooling in 7th or 8th grade. The effects of cram schooling in 7th or 8th grade
estimated by the regression adjustment model for participating students is about 2 to 3 points. Cram schooling in 7th or 8th grade, however, may not help non-participating students’ 9th grade achievement if they were engaged in cram schooling. The effect of cram schooling in 7th or 8th grade may even be negative for these non-participating students as the result indicated by the DR model estimating the ATT. In short, the
results estimated by the DR model show a positive selection bias meaning that the effect of cram schooling is probably only beneficial to students who actually engaged in shadow education.
Effects of the prevalence of cram schooling
Table 2 shows that regardless different modeling strategy, the prevalence of
classmates participating in cram schooling either in 9th grade or in earlier grades has no significant effect on student’s own 9th grade achievement. The analysis also indicates that classmates’ average achievement score has no effect on student’s 9th grade achievement either (results not shown here). In other words, at least in the case of Taiwan, the SUTVA assumption is apparently not violated and hence, the finding supports the first hypothesis.
Conclusion and Discussion
The gradual expansion of shadow education worldwide has worried educators and policy makers. Mimicking formal schooling, paid private supplementary education after school may exacerbate social inequality and harmful to social cohesion (Bray and Lykins 2012). There is also a growing interest among researchers to investigate the effects of shadow education on students’ achievement. Not much research, however, has been done on the impact of the peer effects of shadow education. The present study contributes to this growing research interest in investigating both the effects of student’s and his/her classmates’ cram schooling on student’s own 9th grade academic achievement. The findings of the present study, once again, support the my earlier finding (Kuan 2011) of very modest, if any, effect of 9th grade cram schooling on student’s 9th grade achievement. In particular, the analysis indicates a positive selection bias since cram schooling seems to be beneficial only for students who
indeed participated in cram schooling. Moreover, the prevalence of classmates’ participation in cram schooling either in 9th grade or earlier grades does not affect student’s own 9th grade achievement. In short, we may not need to worry too much about the negative impacts of the prevalence of shadow education as far as increasing the achievement gap between participating and non-participating students is
concerned.
The present study, of course, is limited in several respects. First of all, the study is only a case study of the impacts of cram schooling in Taiwan. Similar studies need to be carried out in other societies. Moreover, the study concerns only academic
achievement. Shadow education may have impacts on participating students’ physical and mental health as well. The research on this particular front is seriously lacking. Methodologically, there are several possible shortcomings. First of all, the present analysis focuses on those who stay at the same classmates during their junior high years to avoid the possible serious confounding effect of ability grouping. Whether or not the finding can be generalized to students who enrolled in schools with the
practice of ability grouping remain to be investigated. The study of this type of students will be even more challenging faced by the present study. Moreover, the modeling strategies used by the present study assume that the possible selection bias can be controlled properly by covariates included in the models. The assumption may not be valid if there is any unobserved variable interfere with the model estimating the outcome variable or the treatment variable. In short, a lot still need to be done in our understanding about the impacts of shadow education.
Table 1 Summary statistics of variables included in the study (N = 3,652)
Variable Mean
Standard
Deviation Minimum Maxium 9th grade ability score 56.864 12.093 27.105 91.698 7th grade ability score 50.147 10.006 14.557 78.247
Cram schooling in 9th grade .568 .495 0 1
Cram schooling in 7th or 8th grade .708 .455 0 1 % classmates participating in cram
schooling in 9th grade
.568 .175 .182 1.000
% classmates participating in cram schooling in 7th or 8th grade .708 .147 .273 1.000 Male .490 .500 0 1 Ethnicity Minnan .655 .475 0 1 Hakka .134 .341 0 1 Mainlander .128 .335 0 1 Aborigines .058 .234 0 1 Other .024 .153 0 1
Parental education level
Junior high or below .278 .478 0 1
Senior high .388 .487 0 1
5-year Junior college .154 .361 0 1
4-year College .105 .307 0 1 Graduate school .043 .203 0 1 Other .032 .177 0 1 Parental occupation Professional .187 .390 0 1 Semi-professional .223 .416 0 1 Clerical .074 .262 0 1 Sales .085 .279 0 1
Production worker or labor .175 .380 0 1
Other .256 .436 0 1
Monthly family income (NT$)
Under 20,000 .090 .286 0 1 20,000 - under 50,000 .395 .489 0 1 50,000 - under 100,000 .365 .481 0 1 100,000 - under 150,000 .093 .290 0 1 150,000 – under 200,000 .033 .178 0 1 Other .018 .133 0 1
Types of family structure
Intact .800 .400 0 1
Single-father .052 .222 0 1
Single-mother .079 .270 0 1
Other .069 .253 0 1
Student’s own education expectation
Senior high diploma .150 .357 0 1
Junior/technical college degree .188 .391 0 1
4-year college degree .237 .425 0 1
Graduate degree .233 .423 0 1
Other .192 .394 0 1
Parental educational expectation
Senior high diploma .095 .293 0 1
Junior/technical college degree .300 .458 0 1
4-year college degree .241 .428 0 1
Graduate school .245 .430 0 1
Other .120 .325 0 1
Table 1 (cont.)
Variable Mean Standard
Deviation Minimum Maximum Hours of cram schooling per
week in 7th grade
None .278 .448 0 1
Under 4 hours .255 .436 0 1
4 hours - under 8 hours .253 .435 0 1
8 hours – under 12hours .119 .324 0 1
Above 12 hours .093 .291 0 1
Average ability score of 7th grade classmates
50.105 5.442 33.132 64.861
School average ability score in 7th grade
50.181 4.756 38.041 59.015
Standard deviation of school ability score in 7th grade
Table 2 Effects of student’s own cram schooling and the prevalence classmates’ cram schooling on student’s 9th grade academic acievement(N=3,652)
Statistical Model1 Explanatory variable
Effect Estimated Estimate Robust Std. Err. Multilevel linear model
Cram schooling in 9th grade ATE .396* .182 Cram schooling in 7th or 8th
grade
-.032 .196 % classmates’ cram schooling
in 9th grade
-1.168 1.511 % classmates’ cram schooling
in 7th or 8th grade
.636 1.947
Doubly-robust estimation
Cram schooling in 9th grade ATE .399 .372 For participants Cram schooling in 7th or 8th
grade
2.970*** .802 % classmates’ cram schooling
in 9th grade
-2.688 3.608 % classmates’ cram schooling
in 7th or 8th grade
-.860 4.728
For non-participants Cram schooling in 7th or 8th grade
- .688 .445 % classmates’ cram schooling
in 9th grade
-3.535 3.170 % classmates’ cram schooling
in 7th or 8th grade
3.604 3.860
Doubly-robust estimation
Cram schooling in 9th grade ATT 1.100* .460 For participants Cram schooling in 7th or 8th
grade
2.139* 1.008 % classmates’ cram schooling
in 9th grade
-2.367 2.431 % classmates’ cram schooling
in 7th or 8th grade
.094 3.006 For non-participants Cram schooling in 7th or 8th
grade
-1.669* .706 % classmates’ cram schooling
in 9th grade
-3.999 4.698 % classmates’ cram schooling
in 7th or 8th grade
5.811 5.888 1. Other than variables presented here, all models include other covariates presented on Table 1.
References
Baker, David P., Motoko Akiba, Gerald K. LeTendre, and Alexander W. Wiseman. 2001. “Worldwide Shadow Education: Outside-School Learning, Institutional Quality of Schooling, and Cross-National Mathematics Achievement.”
Educational Evaluation and Policy Analysis 23 (1): 1-17.
Becker, Betsy J. 1990. “Coaching for the Scholastic Aptitude Test: Further Synthesis and Appraisal.” Review of Educational Research 60 (3): 373-417.
Bray, Mark. 1999. The Shadow Education System: Private Tutoring and its
Implications for Planners. Paris: UNESCO, International Institute for
Educational Planning.
Bray, Mark. 2003. Adverse Effects of Private Supplementary Tutoring: Dimensions,
Implications and Governmental Responses. Paris: UNESCO, International
Institute for Educational Planning.
Bray, Mark. 2009. Confronting the Shadow Education System: What Government
Policies for What Private Tutoring? Paris: UNESCO, International Institute for
Educational Planning.
Bray, Mark and Chad Lykins. 2012. Shadow Education: Private Supplementary
Tutoring and Its Implications for Policy Makes in Asia. Mandaluyong City,
Philippines: Asian Development Bank.
Bray, Mark. 2014. “The Impact of Shadow Education on Student Academic
Achievement: Why the Research is Inconclusive and What Can Be Done about It.” Asia Pacific Education Review 15(3): 381-389.
Byun, Soo-yong. (2014). “Shadow Education and Academic Success in Republic of Korea.” Pp. 39-58 in H. Park & K. Kim (Eds.), Korean Education in Changing
Economic and Demographic Contexts. Singapore: Springer.
Data and Parent Data [public release computer file]. Center for Survey Research,
Academia Sinica [producer, distributor].
Chen, Yi-gean. 2001. “The Division of Senior High School/Vocational School and the Change of the Inequality in Education Opportunities in Taiwan.” [in Chinese]
Bulletin of Educational Research 47: 253-282.
Domingue, Ben, and Derek C. Briggs. 2009. “Using Linear Regression and Propensity Score Matching to Estimate the Effect of Coaching on the SAT.” Multiple Linear Regression Viewpoints 35 (1): 12-29.
Gamoran, Adam, and Robert D. Mare. 1989. “Secondary School Tracking and
Educational Inequality: Compensation, Reinforcement, or Neutrality?” American Journal of Sociology 94: 1146-1183.
Huang, Min-Hsiung. (2013). “After-School Tutoring and the Distribution of Student Performance.” Comparative Education Review 57(4): 689-710.
Kuan, Ping-yin. 2011. "Effects of Cram Schooling on Mathematics Performance: Evidence from Junior High Students in Taiwan." Comparative Education Review 55 (3): 342-368.
Kwo, Ora and Mark Bray. 2014. “Understanding the Nexus between Mainstream Schooling and Private Supplementary Tutoring: Patterns and Voices of Hong Kong Secondary Students.” Asia Pacific Journal of Education 34(4): 403-416. Lee, Jun-ren. 2015. “Jiao Yu Yue Gai Ge, Xue Sheng Bu Xi Yue Pu Pian? (More
Educational Reform, More Cram Schooling?).” [in Chinese] Pulse of Education, Vol. 2. http://pulse.naer.edu.tw/content.aspx?type=G&sid=102.
Lin, Chung-cheng and Tsui-chuan Huang. 2009. “Cram Culture.” [in Chinese]
Journal of Social Sciences and Philosophy 21(4): 587-643.
Manski, Charles F. 1993. “Identification of Endogenous Social Effects: The Reflection Problem.” Review of Economic Studies 60 (3): 531-542.
Manski, Charles, F. 2000. “Economic Analysis of Social Interactions.” Journal of
Economic Perspectives 14 (3): 115-36.
Mason, DeWayne A., Darline D. Schroeter, Ronald K. Combs and Karen Washington. 1992. “Assigning Average-achieving Eighth Graders to Advanced Mathematics Classes in Urban Junior High.” Elementary School Journal 92 (5): 587-599. Morgan, Stephen L., and Christopher Winship. 2015. Counterfactuals and Causal
Analysis: Methods and Principles for Social Research. Cambridge, MA: Harvard University Press.
Park, Hyunjoon. 2013. Re-Evaluating Education in Japan and Korea: Demystifying
Stereotypes. New York, NY: Routledge.
Park, Hyujoon, Soon-yong Byun, and Kyung-keun Kim. 2011. “Parental Involvement and Students’ Cognitive Outcomes in Korea Focusing on Private Tutoring.”
Sociology of Education 84(1): 3-22.
Rubin, Donald B. 1986. “Which Ifs Have Causal Answers (Comment on ‘Statistics and Causal Inference’ by Paul W. Holland).” Journal of the American Statistical
Association 81: 961-2.
Sun, Ching-shan and Yi-chih Huang. 1996. “Shadow Education, Cultural Capital and Educational Attainment.” [In Chinese] Taiwanese Journal of Sociology
19:95-139.
Zeng, Kanming. 1999. Dragon Gate: Competitive Examinations and Their