知覺價值與轉換障礙如何影響再購意願:以
行動電話服務之整合模型與實證研究為例
How Perceived Value and Switching Barriers Affect Repurchase
Intention: An Integrated Model and Empirical Study of Mobile
Phone Services
劉宗哲
1Chung-Tzer Liu 郭 嶷
2Yi Maggie Guo 李沃慶
1Wo-Ching Li
東吳大學企業管理學系 美國密西根大學第爾博恩分校管理系 東吳大學企業管理學系1
Department of Business Administration, Soochow University and
2Department of
Management Studies, University of Michigan - Dearborn
(Received February 12, 2008; Final Version May 4, 2009)
摘要:本研究提出顧客再購意願之一般模型,再購意願的兩項驅動因子為知覺價值與轉換障 礙。知覺價值的前置影響變項包含有知覺價格、顧客期望、知覺服務品質、及替代者的吸引 力。轉換障礙的前置影響變項包含有知覺服務品質、替代者的吸引力、轉換成本、及信心利 益。本研究架構利用台灣行動電話使用者的問卷訪查做驗證,除了替代者的吸引力之外,其他 的構面對再購意願的影響均顯著。為了提高顧客再購意願,企業應該投資於提高顧客知覺價值 與轉換障礙的努力,特別是,企業應該提升服務品質、維持顧客知覺價格合理與期望、謹慎利 用轉換成本、及提供信心利益給顧客。 關鍵詞:再購意願、知覺價值、轉換障礙、行動電話服務
Abstract: This study proposes a general model of customer repurchase intention. The two drivers of
repurchase intention are perceived value and switching barriers. The antecedents of perceived value include price fairness perception, customer expectation, perceived service quality, and attractiveness of alternatives. The antecedents of switching barriers include perceived service quality, attractiveness of
alternatives, switching costs, and confidence benefits. The model is tested using data collected from mobile phone users. Except attractiveness of alternatives, all other antecedents are significant. In order to increase customer repurchase intention, companies should invest in initiatives that both increase customer perceived value and switching barriers. Specifically, businesses should improve service quality, maintain customers’ perception of price fairness and a healthy customer expectation, carefully utilize switching costs, and provide confidence benefits to customers.
Keywords: Repurchase Intention, Perceived Value, Switching Barriers, Mobile Services
1. Introduction
What makes a customer stay with a service provider? Is it the willingness of continued service because of the good service? Is it too hard to switching to other service providers? Or both? Which one is more important? These are the questions this research tries to answer. They are of both theoretical and practical importance. On one hand, repurchase intention is a core concept of loyalty and one of the most common ways to measure customer loyalty (Olsen, 2002). Many studies have concentrated on the critical determinants of consumer repurchase intention. However, few comprehensive structural models of repurchase intention have been empirically tested in marketing literature (Hellier et al., 2003). On the other hand, for highly saturated markets, such as mobile phone services, customer retain is a serious challenge but a crucial and best strategy to the very survival and long-term success of a company (Aydin and Özer, 2005; Jiang and Rosenbloom, 2005; Keaveney, 1995; Kim and Yoon, 2004; Kim et al., 2004). More and more mobile phone service markets become mature with high penetration rate. For example, the cellular mobile subscriber rate in Taiwan has already researched 106.1% and 146.4% in Hong Kong in 2007 by the latest data available (ITU, 2008). Similar trend exists in other regions. The issue of churn in the telecommunication sector provides opportunities to study the relevant aspects of customer retention (Jahanzeb and Jabeen, 2007). The findings can shed light on maturing markets and industries to cope with the same challenge in the future.
In examining the factors affect customers’ repurchase intention, both pull-in force and push-back force are considered and compared. The pull-in force makes customers stay willingly with the service provider while push-back force “traps” customers in a relationship which they would rather leave. In our model, the pull-in force is perceived value and the push-back force is switching barriers. Based on the literature, antecedents of perceived value and switching barriers are identified and integrated into
the research model. The model examines the extent to which customers’ repurchase intention is influenced by these factors. This research provides both theoretical and practical implications that will help managers strategize their practice for low defection and provide researchers a foundation for future systematic investigation.
2. Literature Review and Research Model Development
This research focuses both on what makes customers stay with a service provider (perceived value) and what prevents customers from leaving a service provider (switching barriers). Following sections discuss the model with six identified antecedents of the two drivers of repurchase intention of mobile services.
2.1 Repurchase Intention
True loyalty only exists when repeat patronage is achieved along with a positive attitude (de Ruyter et al., 1998; Dick and Basu, 1994). Loyalty tends to be defined as an observed behavior and/or an attitude. While behavioral loyalty includes repeated purchases of the same brand or from the same service provider, attitudinal loyalty is a degree of dispositional commitment in terms of some unique values associated with the brand or service provider (Chaudhuri and Holbrook, 2001). Customer repurchase intention is one of the most important concepts in marketing (Fornell, 1992). In the past, behavioral intentions were used to predict loyal behavior in many studies (Gremler and Gwinner, 2000; Mathwick et al., 2001; van Riel et al., 2004). Services repurchasing intention is defined as an individual’s future propensity to stay with the same service provider, taking into account a customer’s current situation (Hellier et al., 2003; Ranaweera and Prabhu, 2003). Future repurchase intention is recognized as a positive outcome of customer satisfaction (Aron, 2006; Hellier et al., 2003). Therefore, increasing a customer’s repurchase intention can lead a company to continuous profit, positive word-of-mouth reviews, lower marketing expenditures, and increased business success (McDougall and Levesque, 2000).
2.2 Two Drivers of Repurchase Intention 2.2.1 Perceived Value
Perceived value is a customer’s overall assessment of the product utility (Chen and Dubinsky, 2003; Snoj et al., 2004). It is the perception of what is received and what is given (Zeithaml, 1988). It can also be thought of as a ratio or trade-off between total benefit and total sacrifice (Chen and Dubinsky, 2003; Dodds et al., 1991). Total benefit is a consumer’s perceived service quality (Snoj et
consumption, energy input, and stress experienced. In this regard, perceived value is a richer and more comprehensive measure of a customer’s overall assessment of a service than perceived service quality alone (Bolton and Drew, 1991).
Customer perceived value, including both the benefit and cost to stay with the current service provider, reflects consumers’ net gain obtained from their consumption behavior. It is a force that pulls customers to the services. Consumers may refrain from purchasing a service if the price, a key sacrifice, does not bring quality (Patterson and Spreng, 1997). When the perceived value is low, customers are more likely to switch to competing businesses in the hope of obtaining better perceived value from a new service provider (Anderson and Srinivasan, 2003). Thus, perceived value is a strong driver of retention and likely to be used as a precursor of purchase intention (Varki and Colgate, 2001). Previous studies provide ample evidence for the positive influence of perceived value on consumers’ willingness to buy and repurchase intention (Chen and Dubinsky, 2003; Dodds et al., 1991; Jen and Hu, 2003; Lam et al., 2004; Lin and Wang, 2006; Varki and Colgate, 2001; Zeithaml, 1988). It is found that the perceived value of an ISP’s (Internet Service Provider) service positively affects consumers’ repurchase intentions toward the ISP (Chiou, 2004). In mobile commerce, perceived value also has a strong impact on customer loyalty (Lin and Wang, 2006). Thus, the following hypothesis is proposed:
H1: Perceived value has a positive impact on repurchase intention.
2.2.2 Switching Barriers
Switching barriers are factors making it difficult for a customer to change service providers (Jones
et al., 2000). The positive impact of switching barriers on repurchase intention has been widely
confirmed (Aron, 2006; Colgate and Lang, 2001; Hellier et al., 2003; Jones et al., 2000; Ranaweera and Prabhu, 2003; Rosenbaum et al., 2006; Tsai et al., 2006). If perceived value is a pull-in force that makes customers want to stay, switching barriers are forces to push them back. It can be used as an alternative means to retain customers. There are positive and negative switching barriers (Vazquez-Carrasco and Foxall, 2006). The positive switching barriers reflect the concept of relational benefits, such as confidence, social, and special treatment benefits (Gwinner et al., 1998). The negative switching barrier works from a psychological and/or financial aspect. Psychological factors include uncertainty and a locked-in feeling. Financial factors focus on the negative financial outcomes of switching, such as extra cost. If the switching barriers are high, such as too much trouble to switch or loss of special treatment, it is more likely for customers to stay with the same service provider to avoid potential costs and losses.
It is demonstrated that switching barriers lead to customer retention and customer loyalty in the context of Korean mobile services (Kim and Yoon, 2004; Kim et al., 2004). It would be insightful to see whether the relationship exists in other contexts. Based on the literature, we believe high switching
barriers, such as loss of phone number, make customers think the switching decision seriously, and eventually fewer customers take the step; thus,
H2: Switching barriers have a positive impact on repurchase intention.
2.3 Antecedents of the Two Drivers 2.3.1 Price Fairness Perception
Fairness is a judgment of whether an outcome and/or the process to attain an outcome are reasonable, acceptable, or just (Bolton et al., 2003). Price fairness perception reflects the extent to which the sacrifice and benefit are equivalent to the counterpart involved. Price fairness judgment involves a comparison of a price or procedure with a relevant standard, reference, or norm.
Previous research identified several potential consequences of perceived fairness or unfairness in transaction contexts. If the actual price is below the reference price, customers will perceive more value (Grewal et al., 1998). If the price is too high relative to an internal normative price, too high relative to the value of the service received, or too high relative to competitive prices, the price will be deemed to be unfair. This leads to negative consequences, such as lower perceived value, negative emotions, negative word-of-mouth, action of switching, or other behaviors that damage the seller (Keaveney, 1995; Xia et al., 2004). Herein, price fairness perception plays a positive role in perceived value and a positive driver of purchase probability (Lichtenstein et al., 1993). Thus, the following hypothesis is proposed:
H3: Price fairness perception has a positive impact on perceived value.
2.3.2 Customer Expectation
Customer expectation is a forecast of what the service provider will deliver in the future. Exceeding customer expectation is a key determinant of customer delight, satisfaction, and loyalty (Ofir and Simonson, 2007). Consumption experience with the provider’s offerings in the past, or other information, is likely to provide a basis for forming an expectation about future performance. For this reason, customer expectation is a construct involving both backward and forward looking. Knowing what customers expect is critical for the success of marketing strategies (Ofir and Simonson, 2007).
Current perception of the services is the combining result of customers’ prior expectation and the experience with the most recent service encounter (Boulding et al., 1993). Subsequent outcomes (satisfaction, perceived value) are positively influenced by the expectation (Fornell et al., 1996). Customer expectation has been used to predict consumer intention in the telecommunication industry (Turel and Serenkom, 2006). Thus, the following hypothesis is proposed:
2.3.3 Perceived Service Quality
Perceived service quality is defined as the overall assessment of the excellence or superiority of the service (Snoj et al., 2004; Zeithaml, 1988). Perceived service quality or performance is the mental comparison between quality and price, and based on an evaluation of recent consumption experience (Fornell et al., 1996). Customers’ assessments of service value are positively related to their evaluations of service quality. Prior research found that perceived service quality is a key determinant of perceived value (Bolton and Drew, 1991; Cronin et al., 2000; Turel and Serenkom, 2006). This is true for all services (Fornell et al., 1996). Thus, the following hypothesis is proposed:
H5: Perceived service quality has a positive impact on perceived value.
Customers’ prior experience with service affects their subsequent assessments and intention. It is worthy of noting that intention is strongly related to the actual decision and behavior because customers strive to maintain the status quo (Bolton et al., 2000). From a managerial angle, service quality is a key success factor for service providers because service quality can persuade consumers to adopt new services and reduce price sensitivity (Aydin and Özer, 2005). A conceptual model of the impact of service quality on particular behaviors suggests that when service quality assessment is high, customers’ behavioral intention is favorable, which strengthens their relationship with the service provider (Zeithaml et al., 1996). Therefore, if a business provides high quality service, customers will perceive more switching barriers. Thus, the following hypothesis is proposed:
H6: Perceived service quality has a positive impact on switching barriers.
2.3.4 Attractiveness of Alternatives
Attractiveness of alternatives refers to consumers’ perception of availability and quality of viable alternatives on the market (Colgate and Lang, 2001; Jones et al., 2000). Attractiveness of alternatives is an important factor to customer behaviors because consumer retention can be influenced by competitive alternatives (Jen and Hu, 2003). In this study, we exam its impact via the two drivers: perceived value and switching barriers.
Customers may transfer to new or other services because of perceived higher service quality of the alternatives (Sharma and Patterson, 2000) because they see a value in changing the provider (Oliver, 1997). In other words, customers gain in perceived value in respect to the cost-benefit ratio by switching to a superior service (Jones et al., 2000; Kalyanaram and Little, 1994; Sivakumar and Raj, 1997). From the angle of current service, it is natural for customers to feel the value is diminished when more attractive alternatives become available. With no or few available alternatives, the perceived benefit of defecting should be low (Jones et al., 2000; Vazquez-Carrasco and Foxall, 2006) and customers stay with their current provider (Colgate and Lang, 2001). In this case, repeating purchase is not equivalent to loyalty, but rather a result of lack of choices. If there are comparable
alternatives available, perception of unattractiveness of alternatives suggests that it is not worthwhile to switch to another service provider (Colgate and Lang, 2001; Ping, 1993). Therefore, attractiveness of alternatives is negatively related to perceived value of the original product or service.
H7: Attractiveness of alternative has a negative impact on perceived value.
Unlike the direct relationship with perceived value, which is relatively less studied, the relationship between attractiveness of alternatives and switching barriers has been confirmed in prior research. For example, attractiveness of alternatives is considered one of leading factors of the switching barriers and has negative effects on customer retention (Colgate and Lang, 2001; Vazquez-Carrasco and Foxall, 2006). Hence,
H8: Attractiveness of alternatives has a negative impact on switching barriers.
2.3.5 Switching Costs
Switching costs are another factor of switching barriers. These two constructs are similar and related, but they are different. Switching barriers are defined as “any factor, which makes it more difficult or costly for consumers to change providers” (Jones et al., 2000). In this study, we examine the following antecedents of switching barriers: perceived service quality, attractiveness of alternatives, switching costs, and confidence benefits. Switching costs are consumer perceptions of all the costs associated with changing service providers, including economic and/or psychological costs to constrain customers in service relationships (Jones et al., 2002). Besides monetary cost, time invested, and other efforts, a switching cost can also be a mental, locked-in feeling to a specific service provider even if they can make a judgment among alternatives (Aydin and Özer, 2005). Switching costs are an exit barrier for consumers in a competitive market. It reflects the fact that consumers stay with a service provider because they feel they have to, even if the services do not cater to customer expectations (Fornell, 1992; Sharma and Patterson, 2000). Increasing switching costs is a common strategy in a customer loyalty program (Lam et al., 2004). For example, in the Taiwan mobile phone service industry, if customers try to remove themselves from service contracts prior to the contract end date, they will pay high monetary penalties. In this case, switching costs better explain customer retention than satisfaction although improving customer satisfaction is still important to customer retention.
In order to fully understand the complex decision process of customer repurchase, it is necessary to bring switching costs into consideration (Burnham et al., 2003). Literature shows that switching costs are essential to prevent customers from defecting to another provider (Jones et al., 2002) and, therefore, can be considered an antecedent of switching barriers (Chen and Hitt, 2002; Vazquez-Carrasco and Foxall, 2006). Thus, the following hypothesis is proposed:
2.3.6 Confidence Benefits
Another leading factor of switching barriers is relationship investment, which refers to the strength of personal bonds between customers and the service provider. Effective relationship investment will keep customers from switching to competitors because in order to get the compensation from relational benefits, customers need to remain with the current service provider, even with perceived service attributes under superior level (Gwinner et al., 1998).
Confidence benefits are psychological states related to comfort or a feeling of security, and trust in the service provider (Chang and Chen, 2007; Vazquez-Carrasco and Foxall, 2006). Only after customers develop the relationship with the firm for a long time, can they cultivate the feelings of less anxiety, trust, and confidence. Confidence benefits are the most important type of relational benefit to consumers across all service categories. This research adopts confidence benefits as a representing factor of relational benefits. Relational benefits are an antecedent of switching barriers (Gwinner et al., 1998; Jones et al., 2000; Kim et al., 2004). Prior research supports the positive linkage from confidence benefits to switching barriers in the Taiwan air transportation industry (Chang and Chen, 2007). Thus, the following hypothesis is proposed:
H10: Confidence benefits have a positive impact on switching barriers.
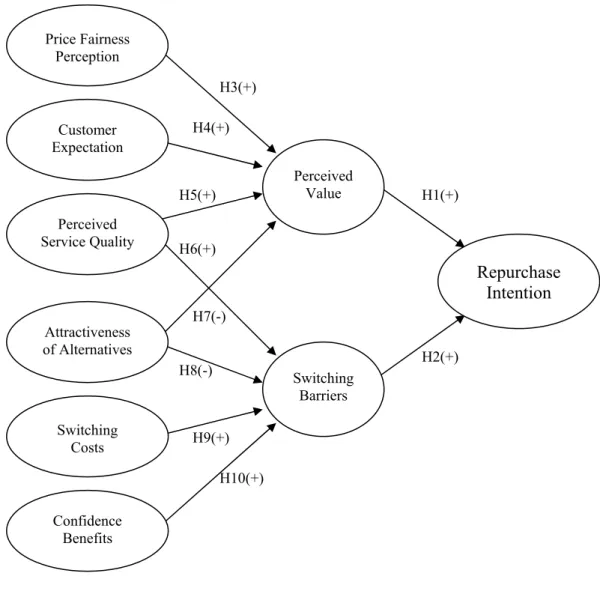
Based on literature review, this study proposes a conceptual framework of key determinants of repurchase intention (Figure 1). Data were collected to empirically test the roles played by the two drivers – perceived value and switching barriers – and six antecedents in predicting the future repurchase intention in the context of mobile phone services in Taiwan. This research is not simply a collection of previously tested relationships, but rather a synthesis of prior research into a comprehensive model for systematic investigation of repurchase intention.
3. Research Method
3.1 Sampling and Respondent Profile
The questionnaires were collected through convenience sampling of mobile phone service users. Paper surveys were distributed to several groups of mobile phone users. First, questionnaires were given on campus to both full-time and evening class students at a major Taiwan university. Second, questionnaires were given to off-campus mobile phone users, such as professionals from financial institutions and workers at coffee shops and fast food restaurants. Third, respondents were asked to distribute questionnaires to their family and friends and encouraged to help out with the data collection effort. Surveys were collected during spring of 2007. No differences were found in responses to key constructs (Repurchase Intention, Switching Barriers, Perceived Value, Confidence Benefits, Switching
Costs, Attractiveness of Alternatives, Perceived Service Quality, Customer Expectation, and Price Fairness Perception) in terms of individual characteristics (gender, age, job, and expenditure), except for switching barriers and price fairness perception based on gender.
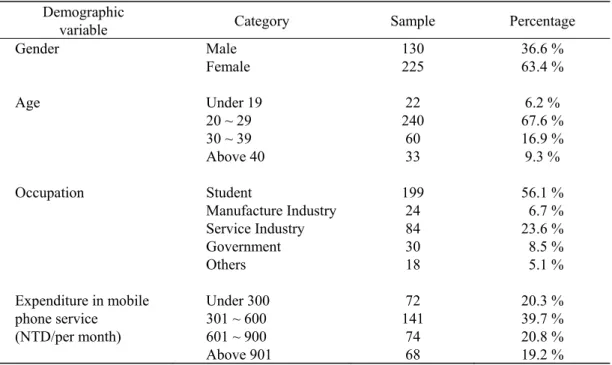
There were 650 questionnaires distributed. Overall, 355 responses were complete, resulting in a response rate of 55%. The respondents’ demographics are displayed in Table 1. In the sample, a typical mobile phone user was a female student between 20 and 29 years old. The highest percentage (39.7%) of users has an average mobile phone service bill of about NT $301 - $600.
H10(+) H9(+) H8(-) H7(-) H6(+) H5(+) H4(+) H3(+) H2(+) H1(+) Customer Expectation Perceived Service Quality Price Fairness Perception Attractiveness of Alternatives Switching Costs Confidence Benefits
Repurchase
Intention
Perceived Value Switching BarriersTable 1 Demographics of Respondents
Demographic
variable Category Sample Percentage
Gender Male Female 130 225 36.6 % 63.4 % Age Under 19 20 ~ 29 30 ~ 39 Above 40 22 240 60 33 6.2 % 67.6 % 16.9 % 9.3 % Occupation Student Manufacture Industry Service Industry Government Others 199 24 84 30 18 56.1 % 6.7 % 23.6 % 8.5 % 5.1 % Expenditure in mobile phone service (NTD/per month) Under 300 301 ~ 600 601 ~ 900 Above 901 72 141 74 68 20.3 % 39.7 % 20.8 % 19.2 % 3.2 Questionnaire Design
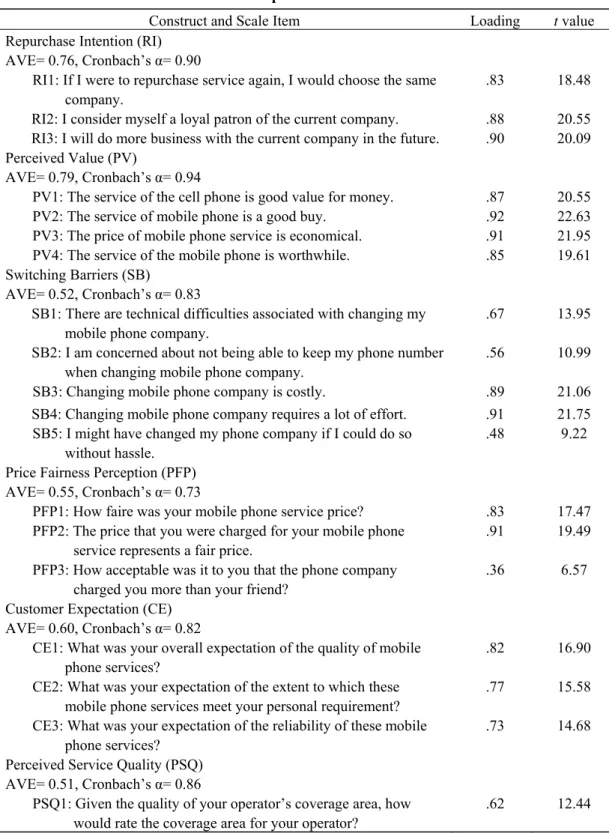
Measures for the various constructs were validated items used in prior research. For appropriate measuring, the survey was translated into Chinese from its original English version. The authors used a common practice of consulting bilingual domain experts to ensure consistency in meaning, proper use of terminology in Chinese, and understandability of the survey. The measurement items used in this study are listed in Table 2.
Measures for repurchase intention consisted of three items based on Tsai et al. (2006). A four-item scale used by Chiou (2004) was used as the measure for perceived value. Measures for switching barriers consisted of five items, which were adopted from Ranaweera and Prabhu (2003). Price fairness perception was measured based on a three-item scale adopted from Grewal et al. (2004). The three items had the format of (1= very unfair; 7 =very fair), (1= strongly disagree; 7= strongly agree) and (1=very unacceptable; 7=very acceptable). Customer expectation was measured by a three-item scale adopted from Turel and Serenkom (2006). Each item was measured via a 7-point Likert-Scale from very low to very high (1=very low; 7=very high). A unidimensional measurement (a six-item scale) based on Aydin and Özer (2005) was used for perceived service quality. Each item was in the form of a 7-point Likert-Scale from very dissatisfied to very satisfied (1=very dissatisfied; 7=very satisfied). The five-item scale for attractiveness of alternatives and the four-item scale for switching
Table 2 Properties of Measurement
Construct and Scale Item Loading t value
Repurchase Intention (RI) AVE= 0.76, Cronbach’s α= 0.90
RI1: If I were to repurchase service again, I would choose the same company.
.83 18.48 RI2: I consider myself a loyal patron of the current company. .88 20.55 RI3: I will do more business with the current company in the future. .90 20.09 Perceived Value (PV)
AVE= 0.79, Cronbach’s α= 0.94
PV1: The service of the cell phone is good value for money. .87 20.55 PV2: The service of mobile phone is a good buy. .92 22.63 PV3: The price of mobile phone service is economical. .91 21.95 PV4: The service of the mobile phone is worthwhile. .85 19.61 Switching Barriers (SB)
AVE= 0.52, Cronbach’s α= 0.83
SB1: There are technical difficulties associated with changing my mobile phone company.
.67 13.95 SB2: I am concerned about not being able to keep my phone number
when changing mobile phone company.
.56 10.99 SB3: Changing mobile phone company is costly. .89 21.06 SB4: Changing mobile phone company requires a lot of effort. .91 21.75 SB5: I might have changed my phone company if I could do so
without hassle.
.48 9.22 Price Fairness Perception (PFP)
AVE= 0.55, Cronbach’s α= 0.73
PFP1: How faire was your mobile phone service price? .83 17.47 PFP2: The price that you were charged for your mobile phone
service represents a fair price.
.91 19.49 PFP3: How acceptable was it to you that the phone company
charged you more than your friend?
.36 6.57 Customer Expectation (CE)
AVE= 0.60, Cronbach’s α= 0.82
CE1: What was your overall expectation of the quality of mobile phone services?
.82 16.90 CE2: What was your expectation of the extent to which these
mobile phone services meet your personal requirement?
.77 15.58 CE3: What was your expectation of the reliability of these mobile
phone services?
.73 14.68 Perceived Service Quality (PSQ)
AVE= 0.51, Cronbach’s α= 0.86
PSQ1: Given the quality of your operator’s coverage area, how would rate the coverage area for your operator?
Table 2 Properties of Measurement (Continued)
Construct and Scale Item Loading t value
PSQ2: Given the quality of your operator’s customer services, how would you rate the customer services for your operator?
.79 17.08 PSQ3: Given the quality of your operator’s adding service, how
would you rate the adding service for your operator?
.76 16.23 PSQ4: Given the quality of your operator’s vendor, how would you
rate the vendor for your operator?
.72 14.94 PSQ5: Given the quality of your operator’ campaign, how would
your rate the campaign for your operator?
.70 14.50 PSQ6: When you compare advertisements with services, how would
rate the services for your operator?
.70 14.39 Attractiveness of Alternatives (AA)
AVE= 0.69, Cronbach’s α= 0.91
AA1: All in all, competitors would be much more fair than my service company.
.66 13.52 AA2: Overall, competitors’ policies would benefit me much more
than my service company’s polices.
.84 19.02 AA3: I would be much satisfied with the service from competitors
than the service provided by my service company.
.89 21.03 AA4: In general, I would be much more satisfied with competitors
than I am with my service company.
.88 20.78 AA5: Overall, competitors would do better to do business with than
my service company.
.85 19.39 Switching Costs (SC)
AVE= 0.75, Cronbach’s α= 0.92
SC1: On the whole, I would spend a lot of time and money to switch from my mobile phone service company.
.85 19.57 SC2: Generally speaking, the cost in time, money, effort, and grief
to switch from my mobile phone service company would be high.
.92 22.43
SC3: Considering everything, the costs to stop doing business with my mobile phone service company and start up with new service company would be high.
.89 21.06
SC4: Overall, I would spend a lot and lose a lot if I switched from my mobile phone service company.
.79 17.68 Confidence Benefits (CB)
AVE= 0.63, Cronbach’s α= 0.89
CB1: I believe there is less risk that something will go wrong. .79 17.32 CB2: I feel I can trust the service provider. .83 18.67 CB3: I have more confidence the service will performed correctly. .82 18.21 CB4: I have less anxiety when I buy the service. .81 18.09 CB5: I know what to expect when I buy it. .70 14.54 Note: AVE=Average Variance Extracted
costs were adopted from Bansal et al. (2004). The construct of confidence benefits was measured using a five-item scale based on Gwinner et al. (1998). Except items for price fairness perception, customer expectation, and perceived service quality, the rest of the items were in the form of a 7-point Likert-Scale from strongly disagree to strongly agree (1=strongly disagree; 7=strongly agree).
4. Data Analysis and Results
This research followed the two-stage approach of data analysis (Anderson and Gerbing, 1988): to assess convergent validity of measurement model using confirmatory factor analysis (CFA), and then test the proposed theoretical model (Figure 1) and research hypotheses by performing structural equation analysis. Both used the LISREL 8.54 program.
4.1 Measurement Model
The first-order measurement model showed a reasonable fit. The Chi-square statistic was significant. The ratio of χ2 /df was 1.74 (χ2 =1095.2, df=629), which was less than the cutoff point of 2.
Furthermore, the Goodness-of-Fit Index (GFI) was .86, Adjusted Goodness-of-Fit Index (AGFI) was .84, Normed-Fit Index (NFI) was .95, Nonnormed-Fit Index (NNFI) was .97, Comparative-Fit Index (CFI) was .98, and the Root Mean Square Error of Approximation (RMSEA) was .05. All were in acceptable ranges, indicating a reasonable fit.
The Cronbach’s alphas for each factor are listed in Table 2. Internal reliability assessed by Cronbach’s alphas for all constructs in the measurement model is above acceptable level of reliability of .70 (Nunnally and Bernstein, 1994). The individual reliability of each item was evaluated by examining the loadings with their respective constructs. Following recommendations (Hair et al., 1992), a factor loading was considered significant when greater than .50. All but two items (SB5 and PFP3) in the measurement model had loadings above .50.
To assure convergent validity, all factor loadings of items for corresponding constructs should be significant (t values should be greater than 1.96) and above .60 (Bagozzi and Yi, 1988), while the value of average variance extracted (AVE) should exceed .50 (Fornell and Larcker, 1981). A value of AVE exceeding .50 demonstrates that more than 50% of the variance of the construct is because of its indicators. A high value of AVE indicates the extent of convergence among the items measuring the same construct. In this study, the t values ranged from 6.57 to 22.63, significant at p<.001 level as shown in Table 2. Only three item loadings are below .60. The AVE of each constructs exceeded .50, indicating all constructs had acceptable convergent validity.
4.2 Structural Model
Simultaneous maximum-likelihood-estimation procedures were utilized to examine the hypothesized relationships in the research model. Based on the model performance statistics (χ2=1182.01, df=640, χ2/df=1.85, GFI=.85, CFI=.97, NNFI=.97, RMSEA=.049), it can be concluded
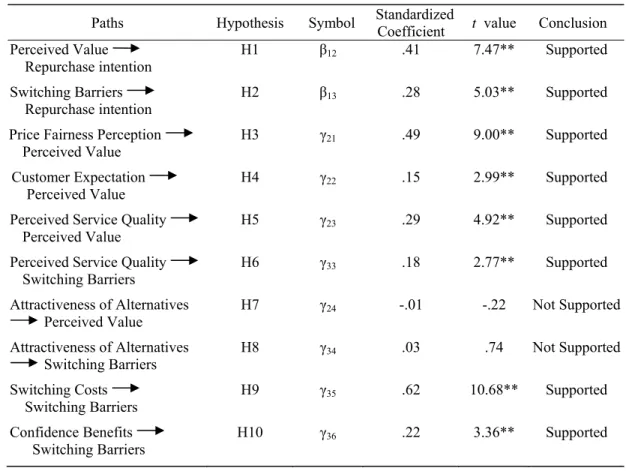
that the hypothesized model had a reasonable fit. Next step was to test the specified paths for hypotheses. The path coefficients and t values are reported in Table 3. All proposed paths, except two (γ24, γ34), were significant. Therefore, all hypotheses, except H7 and H8, were supported. In this
research, the total model explained 30% variance in repurchase intention. Price fairness perception, customer expectation, perceived service quality, and attractiveness of alternatives accounted for 53% variance in perceived value. Perceived service quality, attractiveness of alternatives, switching costs, and confidence benefits accounted for 63% variance in switching barriers.
Table 3 Structural Parameter Estimates
Paths Hypothesis Symbol StandardizedCoefficient t value Conclusion
Perceived Value
Repurchase intention H1 β12 .41 7.47** Supported Switching Barriers
Repurchase intention H2 β13 .28 5.03** Supported Price Fairness Perception
Perceived Value H3 γ21 .49 9.00** Supported Customer Expectation
Perceived Value H4 γ22 .15 2.99** Supported Perceived Service Quality
Perceived Value H5 γ23 .29 4.92** Supported Perceived Service Quality
Switching Barriers H6 γ33 .18 2.77** Supported Attractiveness of Alternatives
Perceived Value H7 γ24 -.01 -.22 Not Supported Attractiveness of Alternatives
Switching Barriers
H8 γ34 .03 .74 Not Supported
Switching Costs
Switching Barriers H9 γ35 .62 10.68** Supported Confidence Benefits
Switching Barriers
H10 γ36 .22 3.36** Supported
The authors further tested whether the perceived value had a greater influence on repurchase intention than switching barriers did. One model in which β12 and β13 were constrained to be equal was
compared to the unconstrained model in which the paths were estimated freely. The results did not show there existed a significant difference between β12 and β13 (χ2diff = 0.62, df = 1, p > 0.05) although
they had different values (β12=.41, β13=.28). To test whether any of the antecedents had statistically
greater influence on perceived value and switching barriers than other antecedents, constrained models (with equated path coefficients) were compared with the unconstrained model (the paths were estimated freely). If the χ2 statistic of the unconstrained model differs from that of a constrained model,
then one construct has a greater influence on the dependent construct than the other construct. In the case of perceived value, the results showed that price fairness perception had greater influence (minimum χ2
diff = 4.22, df = 1, p < .05) than the other three antecedents (i.e., γ21 > γ22, γ23, γ24) and
perceived service quality had greater influence on perceived value (χ2
diff = 8.88, df = 1, p < .01) than
attractiveness of alternatives (i.e., γ23 > γ24). In regard to switching barriers, the results showed only
switching costs had greater influence on switching barriers (minimum χ2
diff = 15.59, df = 1, p < .001)
than the other three antecedents (i.e., γ35 > γ33, γ34, γ36).
5. Discussion
This paper focuses on issues to explain customer repurchase intention. It conceptualizes and shows that perceived value and switching barriers as two drivers, pull-in and push back forces, respectively, of repurchase intention. The model is comprehensive in that it considers the two aspects of customer decision making and multiple contributing factors. It is among the first to compare the impacts of perceived value and switching barriers directly in one model. Although mobile phone service is the context of study, we believe the findings can be applied to other highly competitive and subscription-based services.
5.1 Perceived Value and Switching Barriers to Repurchase Intention
This study explains the complex phenomenon of repurchase intention by an elaborate examination on how customers use the perceived value and switching barriers in deciding whether to repurchase. It is evident that both perceived value and switching barriers play important roles in forecasting the customer repurchase intention (H1 and H2). The impacts of perceived value and switching barriers on repurchase intention have no significant difference. Therefore, businesses should provide more value-added services that customers desire to gain a competitive advantage and/or build switching barriers, which can also affect customers’ decision to stay or leave a service provider (Kim et al., 2004). That is to use both pull-in and push-back forces.
Consistent with prior research and expectations, perceived value seems to be a comprehensive measure of a customer’s overall evaluation of service. In the model, more than just service quality affects perceived value. Perception of price fairness and customer expectation also play significant roles when customers are evaluating the service they get and making a decision of whether to continue purchasing. Customers want value, which is high service quality at a low or comparable cost and price (Bolton and Drew, 1991). Price fairness perception and customer expectation actually occur in the pre-purchase stage and are reevaluated afterwards while perceived service quality is normally reached later. So perceived service quality itself might not be able to adequately explain the whole decision making process of repurchase. Perceived value should be used as a powerful predictor of repurchase intention.
Customers tend to employ the net utility to determine whether they will maintain their relationship with the current service provider. That is, customers consider what they gain by switching to another service and how hard it is to switch. If the gain cannot offset the pain, normally customers will stay. Switching gain comes from the difference in perceived value of the two service providers. The research model investigates both gain and pain by including perceived value and switching barriers. The lower the customers’ perceived value or their satisfaction with the current service is, the higher the switching gains would be and the higher the chance there is a better alternative service. Once the gain is bigger than the pain of switching, customers will defect. Therefore, the switching barriers are important to prevent customers from leaving if there is another superior service. But it alone will not reduce switching action.
5.2 Antecedents of Perceived Value and Switching Barriers
Customers may stay with a service provider because they want to (with perceived high value) or because they feel they have to (with high switching barriers). This study finds that price fairness perception, customer expectation, and perceived service quality have significant impacts on perceived value (H3, H4, and H5). Among them, price fairness perception has greater influence on perceived value with a coefficient of .49, which is larger than that of perceived service quality (.29) and customer expectation (.15). The price fairness perception actually has a very important impact on perceived value in the mobile phone service context. This may imply that customers could find little difference in Taiwan mobile phone service companies. When services are very similar, subscribers have little basis to make a strict choice. Thus, price becomes the main differentiating factor in decision making.
The research model includes several antecedents of switching barriers in the literature. The results show that perceived service quality, switching costs, and confidence benefits has significant impacts on switching barriers (H6, H9, and H10). Among them, switching costs have the strongest
impact on switching barriers with a coefficient of .62, which is larger than that of perceived service quality (.18) and confidence benefits (.22). In other words, switching costs are far more important and effective than other antecedents of switching barriers when customers seriously consider defection.
Among all antecedents, perceived service quality has a positive impact on both perceived value (H5) and switching barriers (H6). It means service quality has dual effects on switching gain and pain. It is clear that better service increases customers’ perception of value. On the other hand, losing a good service is a pain, which will offset the gain of switching to another service provider. Thus, providing high quality service and more value-added services addresses both issues of perceived value (pull-in force) and switching barriers (push-back force) simultaneously.
It is surprising to see the insignificant relationships between attractiveness of alternatives and perceived value (H7), and switching barriers (H8). It might be explained by whether or not alternative attractiveness is equivalent to a perception of “lack of alternatives” (Bansal et al., 2004). Although these two variables look similar, they are not the same. In prior service switching research, it was alternative attractiveness rather than lack of alternatives studied. The context of this study was mobile phone services in Taiwan, which was dominated by a couple of big telecommunication companies and there were few alternatives. In this situation, the question of how attractive the alternatives were might not be part of the customers’ decision. Therefore, relationships between alternative attractiveness and perceived value and switching barriers were insignificant in this study.
5.3 Managerial Implications
Findings of this study provide managers with important insights and tactical methods. First of all, because perceived value is an important driver to repurchase intention and a pull-in force, businesses should focus on maximizing customer value (Wang et al., 2004). In order to achieve superior customer value delivery and performance, companies should understand their customers’ desires first (Woodruff, 1997). Customer-oriented value-based competition represents a major shift in managerial practice and requires an organizational climate to achieve the goal. Companies should focus on cultivating customer-oriented culture and philosophy, rethinking the organizational structure, developing a marketing strategy and managerial capabilities, so that they have a deep understanding of their markets and customers. By doing so, business also acquire the ability to quickly recognize the changes of customers’ desired value and find the reasons behind the changes (Griffin and Lowenstein, 2001; Woodruff, 1997). For example, the mobile service industry needs to adjust their marketing strategies and focus on customer retention rather than on acquiring new subscribers and increasing market shares because it becomes such a high competitive industry and customers are no longer content with basic services (Turel and Serenkom, 2006).
In our model, three significant antecedents of perceived value are price fairness perception, perceived service quality, and customer expectation. Managers can improve value perception by actively managing the customers’ price fairness perception. Although the buyer’s perceptions of price unfairness are primarily based on different prices for the same service/product, a goal of fair pricing does not mean a one-price policy. It does not mean that customers do not accept price change or price difference. A key issue is how to make price difference more acceptable and eliminate perceptions of unfairness (Xia et al., 2004), or decrease customers’ sensitivity to price. It is recommended to build and use different communication programs for different market segments to reduce potential unfavorable price comparisons across distinct groups of customers. The communication programs, such as comparative price advertising, can be effectively used to promote appropriate comparisons for customers (Grewal et al., 1998; Varki and Colgate, 2001).
Improving service quality is an approach that kills two birds with one stone because it increases both perceived value and switching barriers as demonstrated by the model. Also pointed out by other researchers, businesses should further improve service quality and upgrade and expend services frequently to give customers the feeling they are receiving more value for the price. By doing so, companies create a loop reinforcing customer retention through better service quality, which contributes to positive reviews, market share, profit, and long-term survival (Aydin and Özer, 2005; Reichheld, 1994).
Customer expectation has a direct and positive association with a cumulative evaluation of a firm’s performance, such as perceived value, which affects repurchase intention. Customers learn from experience and predict the levels of quality and value they receive. Thus, it is critical for a firm to cultivate a good customer expectation of future quality.
Switching barriers are equally important as customers’ perceived value to repurchase intention. It is the push-back force that keeps customers in the relationship with the current service provider. Switching barriers can be incorporated in a customer loyalty program to dissuade customers from changing service providers. Companies can offer hard and/or soft benefits to build switching barriers. A hard benefit provides customers with a direct gain (e.g., free merchandise). It helps to get customers’ attention and build credibility. However, it may bring direct financial cost to the service provider. A soft benefit reflects in the perception of “special status.” It is achieved by using customer information in special recognition. Hence, customers with soft benefits have higher emotional attachment to the service provider and display a deeper and more durable loyalty (Balabanis et al., 2006).
In the model, switching costs are a major contributor of switching barriers compared to perceived service quality and confidence benefits. Switching costs can be a very effective method to discourage
customers from leaving. However, switching costs should be used with caution. First, although a business may build switching costs into its offerings, its competitors can always erect a range of strategies and incentives to help potential customers overcome the switching cost, which is out of the company’s control. For example, mobile phone service companies provide portability of mobile phone number and low introductory rates. Secondly, manipulating switching cost has its drawbacks. The trapped feeling may result in harmful outcomes and detrimental behaviors, such as negative feelings, bad reviews, more complaints, increased pricesensitivity, low acceptance rate of new services, and eventually profit loss (Colgate and Lang, 2001). Therefore, this strategy cannot be a long-term solution.
Besides switching costs, confidence benefits can serve as an exit barrier (Keaveney, 1995). When customers become aware of confidence benefits, they are more willing to be the new subscribers of a service or repurchase customers (Gwinner et al., 1998). However, customers seldom realize the importance of confidence benefits before entering the relationship and confidence benefits emerge after a long relationship with a service provider. Thus, service providers should promote the value of confidence benefits to customers, new and old alike. Techniques include customer differentiation and personalized services. Currently some mobile phone services have taken actions to cultivate “personal relationship,” such as sending promotional messages, but not enough. Customers are quite annoyed by mass distribution of messages that have little relevance to their own needs.
In summary, the net effect of switching efforts will depend upon the strength of the switching barriers relative to the available benefits – perceived value (Yang and Peterson, 2004). That is to make customers want to stay in the first place. In a competitive service industry, businesses should focus on improving customer perceived value to an acceptable level above the industrial standards. Only after perceived value is well delivered, can switching barriers take effect. If a company’s performance is beneath customers’ expected value and satisfaction, any efforts to establish switching barriers will fail. Companies have implemented techniques in their strategic marketing, but more in a piece-meal fashion. What this research suggests is to take a holistic approach using both pull-in and push-back forces. Although the research was conducted in the context of mobile phone services, the findings are insightful for other subscription-based services in which customer retention is the key, for example, online music downloading services.
5.4 Limitations and Future Research
There are several limitations of this study. First, a behavioral indicator, repurchase intention, represents customer loyalty in the model. In the future, other types of constructs, such as attitude, may be applied to measure customer loyalty in a research framework. The current study took the approach
of cross-sectional data collection, which is a snapshot of consumer behavior. Future research can conduct longitudinal studies to learn more about customers’ decision behavior. The convenient sample in the study mainly consisted of business students. A sample matching the profile of mobile phone users will prove to be useful to test whether the findings were affected by the sample. Current mobile service users were the focus for this research. Lost customers and potential customers can be included in future endeavors to broadly determine what customers need and want. Similarly, studies can be conducted in different countries to validate whether the results are world wide.
6. Conclusion
What reasons cause customers to stay or leave is important and of interest for both managers of service firms and service marketing scholars. Customer loyalty is a challenge and strategic objective for all businesses. Businesses get a higher share of customers’ wallets by keeping customers and cultivating loyalty. This study investigated drivers and antecedents of customers’ repurchase intention in the context of mobile phone services. The findings suggest that repurchase intention can be generated through improving customer perceived value, the pull-in force, and increasing switching barriers, the push-back force. Companies have to provide elite service quality, manage customer expectation, and understand customer price fairness perception to pull customers into the relationship and make them want to stay. It is noteworthy that switching costs, perceived service quality, and confidence benefits can be used to push mobile phone service subscribers back from defecting, thus staying in the relationship. Results of this research provide a new basis to broaden the previous research in customers repurchase intention and make a contribution to marketing knowledge.
References
Anderson, J. C. and Gerbing, D. W., “Structural Equation Modeling in Practice: A Review and Recommended Two-Step Approach,” Psychological Bulletin, Vol. 103, No. 3, 1988, pp. 411-423. Anderson, R. E. and Srinivasan, S. S., “E-Satisfaction and E-Loyalty: A Contingency Framework,”
Psychology & Marketing, Vol. 20, No. 2, 2003, pp. 123-138.
Aron, D., “The Effect of Counter-Experiential Marketing Communication on Satisfaction and Repurchase Intention,” Journal of Consumer Satisfaction, Dissatisfaction and Complaining
Behavior, Vol. 19, 2006, pp. 1-17.
Aydin, S. and Özer, G., “The Analysis of Antecedents of Customer Loyalty in the Turkish Mobile Telecommunication Market,” European Journal of Marketing, Vol. 39, No. 7/8, 2005, pp. 910-925.
Bagozzi, R. and Yi, Y., “On the Evaluation of Structural Equation Models,” Journal of the Academy of
Marketing Science, Vol. 16, No. 1, 1988, pp. 74-94.
Balabanis, G., Reynolds, N., and Simintiras, A., “Bases of E-Store Loyalty: Perceived Switching Barriers and Satisfaction,” Journal of Business Research, Vol. 59, No. 2, 2006, pp. 214-224.
Bansal, H. S., Irving, P. G., and Taylor, S. F.,“A Three-Component Model of Customer Commitment to Service Providers,” Journal of the Academy of Marketing Science, Vol. 32, No. 3, 2004, pp. 234-250.
Bolton, L. E., Warlop, L., and Alba, J. W., “Consumer Perceptions of Price (Un)fairness,” Journal of
Consumer Research, Vol. 29, No. 4, 2003, pp. 474-491.
Bolton, R. N. and Drew, J. H., “A Multistage Model of Customers' Assessment of Service Quality and Value,” Journal of Consumer Research, Vol. 17, No. 4, 1991, pp. 375-384.
Bolton, R. N., Kannan, P. K., and Bramlett, M. D., “Implications of Loyalty Program Membership and Service Experiences for Customer Retention and Value,” Journal of the Academy of Marketing
Science, Vol. 28, No. 1, 2000, pp. 95-108.
Boulding, W., Kalra, A., Staelin, R., and Zeithamal, V. A., “A Dynamic Process Model of Service Quality: From Expectations to Behavioral Intentions,” Journal of Marketing Research, Vol. 30, No. 1, 1993, pp. 7-27.
Burnham, T. A., Frels, J. K., and Mahajan, V., “Consumer Switching Costs: A Typology, Antecedents, and Consequences,” Journal of the Academy of Marketing Science, Vol. 31, No. 2, 2003, pp. 109-126.
Chang, Y.-H. and Chen, F.-Y., “Relational Benefits, Switching Barriers and Loyalty: A Study of Airline Customers in Taiwan,” Journal of Air Transport Management, Vol. 13, No. 2, 2007, pp. 104-109.
Chaudhuri, A. and Holbrook, M. B., “The Chain of Effects from Brand Trust and Brand Affect to Brand Performance: The Role of Brand Loyalty,” Journal of Marketing, Vol. 65, No. 2, 2001, pp. 81-93.
Chen, P.-Y. and Hitt, L. M., “Measuring Switching Costs and the Determinants of Customers Retention in Internet-Enabled Businesses: A Study of Online Brokerage Industry,” Information
Systems Research, Vol. 13, No. 3, 2002, pp. 255-274.
Chen, Z. and Dubinsky, A. J., “A Conceptual Model of Perceived Customer Value in E-Commerce: A Preliminary Investigation,” Psychology & Marketing, Vol. 20, No. 4, 2003, pp. 323-347.
Chiou, J.-S., “The Antecedents of Consumers’ Loyalty Toward Internet Service Providers,”
Colgate, M. and Lang, B., “Switching Barriers in Consumer Markets: An Investigation of the Financial Services Industry,” The Journal of Consumer Marketing, Vol. 18, No. 4/5, 2001, pp. 332-347. Cronin, J. J. J., Brady, M. K., and Hult, G. T. M., “Assessing the Effect of Quality, Voice, and
Customer Satisfaction on Consumer Behavioral Intentions in Service Environment,” Journal of
Retailing, Vol. 76, No. 2, 2000, pp. 193-218.
de Ruyter, K., Wetzels, M., and Bloemer, J., “On the Relationship between Perceived Service Quality, Service Loyalty and Switching Costs,” International Journal of Service Industry Management, Vol. 9, No. 5, 1998, pp. 436-445.
Dick, A. S. and Basu, K., “Customer Loyalty: Toward an Integrated Conceptual Framework,” Journal
of the Academy of Marketing Science, Vol. 22, No. 2, 1994, pp. 99-113.
Dodds, W. B., Monroe, K. B., and Grewal, D., “Effect of Price, Brand, and Store Information on Buyers' Product Evaluations,” Journal of Marketing Research, Vol. 28, No. 3, 1991, pp. 307-319. Fornell, C., “A National Customer Satisfaction Barometer: The Swedish Experience,” Journal of
Marketing, Vol. 56, No. 1, 1992, pp. 6-21.
Fornell, C., Jonson, M. D., Anderson, E. W., Cha, J., and Bryant, B. E., “The American Customers Satisfaction Index: Nature, Purpose, and Findings,” Journal of Marketing, Vol. 60, No. 4, 1996, pp. 7-18.
Fornell, C. and Larcker, D. F., “Evaluating Structural Equation Models with Unobservable Variables and Measurement Error,” Journal of Marketing Research, Vol. 18, No. 1, 1981, pp. 39-50.
Gremler, D. D. and Gwinner, K. P., “Customer-Employee Rapport in Service Relationships,” Journal
of Service Research, Vol. 3, No. 1, 2000, pp. 82-104.
Grewal, D., Hardesty, D. M., and Iyer, G. R., “The Effects of Buyer Identification and Purchase Timing on Consumers’ Perceptions of Trust, Price Fairness, and Repurchase Intentions,” Journal of
Interactive Marketing, Vol. 18, No. 4, 2004, pp. 87-100.
Grewal, D., Monroe, K. B., and Krishnan, R., “The Effects of Price-Comparison Advertising on Buyers' Perceptions of Acquisition, Transaction Value, and Behavioral Intentions,” Journal of
Marketing, Vol. 62, No. 2, 1998, pp. 46-59.
Griffin, J. and Lowenstein, M. W., “Winning Back a Lost Customer: Customer Winback: How to Recapture Lost Customers -- and Keep Them Loyal,” Direct Marketing, Vol. 64, No. 3, 2001, pp. 49-65.
Gwinner, K. P., Gremler, D. D., and Bitner, M. J., “Relational Benefits in Services Industries: The Customer's Perspective,” Journal of the Academy of Marketing Science, Vol. 26, No. 2, 1998, pp. 101-114.
Hair, J. F., Anderson, R. E., Tatham, R. L., and Black, W. C., Multivariate Data Analysis with
Readings, New York: Macmillan, 1992.
Hellier, P. K., Geursen, G. M., Carr, R. A., and Rickard, J. A., “Customer Repurchase Intention: A General Structural Equation Model,” European Journal of Marketing, Vol. 37, No. 11/12, 2003, pp. 1762-1800.
ITU, “International telecommunications union: World telecommunications indicators,” Accessed on Oct 20, 2008. http://www.itu.int/ITU-D/icteye/Reporting/ShowReportFrame.aspx?ReportName= /WTI/CellularSubscribersPublic& RP_intYear=2007&RP_intLanguageID=1,
Jahanzeb, S. and Jabeen, S., “Churn Management in the Telecom Industry of Pakistan: A Comparative Study of Ufone and Telenor,” Journal of Database Marketing & Customer Strategy Management, Vol. 14, No. 2, 2007, pp. 120-129.
Jen, W. and Hu, K.-C., “Application of Perceived Value Model to Identify Factors Affecting Passengers Repurchase Intentions on City Bus: A Case of Taipei Metropolitan Area,”
Transportation, Vol. 30, No. 3, 2003, pp. 307-327.
Jiang, P. and Rosenbloom, B., “Customer Intention to Return Online: Price Perception, Attribute-Level Performance, and Satisfaction Unfolding Over Time,” European Journal of Marketing, Vol. 39, No. 2, 2005, pp. 150-165.
Jones, M. A., Mothersbaugh, D. L., and Beatty, S. E., “Switching Barriers and Repurchase Intentions in Services,” Journal of Retailing, Vol. 76, No. 2, 2000, pp. 259-274.
Jones, M. A., Mothersbaugh, D. L., and Beatty, S. E., “Why Customer Stay: Measure the Underlying Dimension of Services Switching Costs and Managing their Differential Strategic Outcomes,”
Journal of Business Research, Vol. 55, No. 6, 2002, pp. 441-450.
Kalyanaram, G. and Little, J. D. C., “An Empirical Analysis of Latitude of Price Acceptance in Consumer Package Goods,” Journal of Consumer Research, Vol. 21, No. 3, 1994, pp. 408–19. Keaveney, S. M., “Customer Switching Behavior in Service Industries: An Exploratory Study,”
Journal of Marketing, Vol. 59, No. 2, 1995, pp. 71-82.
Kim, H.-S. and Yoon, C.-H., “Determinants of Subscriber Churn and Customer Loyalty in the Korean Mobile Telephony Market,” Telecommunications Policy, Vol. 28, No. 9/10, 2004, pp. 751-765. Kim, M.-K., Park, M.-C., and Jeong, D.-H., “The Effects of Customer Satisfaction and Switching
Barrier on Customer Loyalty in Korean Mobile Telecommunication Services,” Telecommunications
Policy, Vol. 28, No. 2, 2004, pp. 145-159.
Lam, S. Y., Shankar, V., Erramilli, M. K., and Murthy, B., “Customer Value, Satisfaction, Loyalty, and Switching Costs: An Illustration from a Business-to-Business Service Context,” Journal of the
Lichtenstein, D. R., Ridgway, N. M., and Netemeyer, R. G., “Price Perceptions and Consumer Shopping Behavior: A Field Study,” Journal of Marketing Research, Vol. 30, No. 2, 1993, pp. 234-245.
Lin, H.-H. and Wang, Y.-S., “An Examination of the Determinants of Customer Loyalty in Mobile Commerce Contexts,” Information & Management, Vol. 43, No. 3, 2006, pp. 271-282.
Mathwick, C., Malhortra, N., and Rigdon, E., “Experiential Value: Conceptualization, Measurement and Application in the Catalogue and Internet Shopping Environment,” Journal of Retailing, Vol. 77, No. 1, 2001, pp. 39-56.
McDougall, G. H. G. and Levesque, T., “Customer Satisfaction with Services: Putting Perceived Value into the Equation,” Journal of Services Marketing, Vol. 14, No. 5, 2000, pp. 392-410.
Nunnally, J. C. and Bernstein, I. H., Psychometric Theory, New York: McGraw-Hill, 1994.
Ofir, C. and Simonson, I., “The Effect of Stating Expectations on Customer Satisfaction and Shopping Experience,” Journal of Marketing Research, Vol. 44, No. 1, 2007, pp. 164-174.
Oliver, R. L., Satisfaction: A Behavioral Perspective on the Consumer, New York, NY: McGraw-Hill, 1997.
Olsen, S. O., “Comparative Evaluation and the Relationship between Quality, Satisfaction, and Repurchase Loyalty,” Journal of the Academy of Marketing Science, Vol. 30, No. 3, 2002, pp. 240-249.
Patterson, P. G. and Spreng, R. A., “Modelling the Relationship between Perceived Value, Satisfaction and Repurchase Intentions in a Business-to-Business, Services Context: An Empirical Examination,”
International Journal of Service Industry Management, Vol. 8 No. 5, 1997, pp. 414-434.
Ping, Jr., R. A., “The Effects of Satisfaction and Structural Constraints on Retailer Exiting, Voice, Loyalty, Opportunism, and Neglect,” Journal of Retailing, Vol. 69, No. 3, 1993, pp. 320-352.
Ranaweera, C. and Prabhu, J., “The Influence of Satisfaction, Trust and Switching Barriers on Customer Retention,” International Journal of Service Industry Management, Vol. 14, No. 3/4, 2003, pp. 374-395.
Reichheld, F. F., “Loyalty and the Renaissance of Marketing,” Marketing Management, Vol. 2, No. 4, 1994, pp. 10-21.
Rosenbaum, M. S., Massiah, C., and Jackson, D. W., “An Investigation of Trust, Satisfaction, and Commitment on Repurchase Intentions in Professional Service,” Service Marketing Quarterly, Vol. 27, No. 3, 2006, pp. 115-136.
Sharma, N. and Patterson, P. G., “Switching Costs, Alternative Attractiveness and Experience as Moderators of Relationship Commitment in Professional, Consumer Services,” International
Sivakumar, K. and Raj, S. P., “Quality Tier Competition: How Price Change Influences Brand Choice and Category Choice,” Journal of Marketing, Vol. 61, No. 3, 1997, pp. 71–85.
Snoj, B., Korda, A. P., and Mumel, D., “The Relationships among Perceived Quality, Perceived Risk and Perceived Product Value,” The Journal of Product and Brand Management, Vol. 13, No. 2/3, 2004, pp. 156-167.
Tsai, H.-T., Huang, H.-C., Jaw, Y.-L., and Chen, W.-K., “Why On-Line Customers Remain with a Particular E-Retailer: An Integrative Model and Empirical Evidence,” Psychology & Marketing, Vol. 23, No. 5, 2006, pp. 447-464.
Turel, O. and Serenkom, A., “Satisfaction with Mobile Services in Canada: An Empirical Investigation,” Telecommunications Policy, Vol. 30, No. 5/6, 2006, pp. 314-331.
van Riel, A. C. R., Lemmink, J., Streukens, S., and Liljander, V., “Boost Customer Loyalty with Online Support: The Case of Mobile Telecoms Providers,” International Journal of Internet
Marketing and Advertising, Vol. 1, No. 1, 2004, pp. 4-23.
Varki, S. and Colgate, M., “The Role of Price Perceptions in an Integrated Model of Behavioral Intentions,” Journal of Service Research, Vol. 3, No. 3, 2001, pp. 232-240.
Vazquez-Carrasco, R. and Foxall, G. R., “Positive vs. Negative Switching Barriers: The Influence of Service Consumers' Need for Variety,” Journal of Consumer Behavior, Vol. 5, No. 4, 2006, pp. 367-379.
Wang, Y., Lo, H.-P., and Yang, Y., “An Integrated Framework for Service Quality, Customer Value, Satisfaction: Evidence from China’s Telecommunication Industry,” Information Systems Frontiers, Vol. 6, No. 4, 2004, pp. 325-340.
Woodruff, R. B., “Customer Value: The Next Source for Competitive Advantage,” Journal of the
Academy of Marketing Science, Vol. 25, No. 2, 1997, pp. 139-153.
Xia, L., Monroe, K. B., and Cox, J. L., “The Price is Unfair! A Conceptual Framework of Price Fairness Perceptions,” Journal of Marketing, Vol. 68, No. 4, 2004, pp. 1-15.
Yang, Z. and Peterson, R. T., “Customer Perceived Value, Satisfaction, and Loyalty: The Role of Switching Costs,” Psychology & Marketing, Vol. 21, No. 10, 2004, pp. 799-822.
Zeithaml, V. A., “Consumer Perceptions of Price, Quality, and Value: A Means-End Model and Synthesis of Evidence,” Journal of Marketing, Vol. 52, No. 3, 1988, pp. 2-22.
Zeithaml, V. A., Berry, L. L., and Parasuraman, A., “The Behavioral Consequences of Service Quality,” Journal of Marketing, Vol. 60, No. 2, 1996, pp. 31-46.