Department of Business Administration
I-Shou University
Master Thesis
The valuation job satisfaction of staff
Binh Duong Department of taxation
Advisor: Dr. Chiao Ping Bao
Co-Advisor: Dr. Ho Sy Tan
Graduate Student: Pham Ba Tuoc
Department of Business Administration
I-Shou University
Signature Page
This is to certify that the thesis prepared by PHAN
1
..
A TVG&
entitled "---
he vokalioh job
,4a
-l1g4oei-flor) ck (c)4044_
Plitt9via be,popf tvien0--
ior Vefi-to
99has been approved by his/her committee as satisfactory completion of the
thesis requirement for the degree of Master of Business Administration.
Supervising Committee:
Advisor(s):
C
13
ac)
---
-
7Department Chair: i(A
e- 67 cdt
0A"
Acknowledgements
It is a rare pleasure for me to express my profound gratitude and thanks to Dr. Chiao Ping
Bao and Dr. Ho Sy Tan who are supervisors to this research, for their valuable guidance, explicit direction, and encouragement throughout this research.
My special thanks also go to the management of Binh Duong Department of taxation, especially Dr. Chiao Ping Bao, for providing me helpful information and giving critical
comments on this research.
My thanks are also extended to I-Shou University for their help and cooperation during
period of my MBA course.
To all my lovely friends, I give my sincerest appreciation for their warm encouragement,
friendship and help at all times, especially their motivation during my studying time.
Please send sincere thanks to everyone.
ii
Abstract
The purpose of this subject is to measure the Satisfaction ofstaff Binh Duong Department of
taxation. On that basis, a number of measures is recommended to help the Binh Duong Department of taxation to further improve the quality of factors affect the satisfaction of
staff Binh Duong Department of taxation
The recommended research model was built on the basis of the theory of human resource
management, the satisfaction of labors. Inheritance and selective discovered from studies of theory , the preliminary research to establish the ten components affecting the satisfaction of
staff Binh Duong Department of taxation with the name call (1) Jobs, (2) Salary, (3) Colleague, (4) Leaders, (5) Training - Promotion, (6) Working condition, (7) Achievement
acceptance. A quantitative study with a sample size 165 staff Binh Duong Department of taxation is carried out to assess the scale and test theoretical models. Cronbach Alpha
reliability results and explored factor analysis (EFA) showed that the scale will meet the reliability, value and acceptance. Thus, based on the research findings, policy makers,
managers of Binh Duong Department of taxation will further understand the level of interest, satisfaction of staff; then apply appropriate changes to boost satisfaction of staff
Results after testing scale by Cronbach Alpha, we have identified six factors affecting to Satisfaction of staff (Jobs, Salary, Colleague working condition, Leaders, Promotion,
Achievement acceptance) regression analysis results have five components scale satisfaction of staff are statistically significant and affects the satisfaction of labors, proved
that the five hypothesis of the study is acceptable. Most powerful factor to the satisfaction are Jobs, Salary, Colleague working condition, Leaders, Promotion
Table of Contents
ACKNOWLEDGEMENTS ... I
ABSTRACT ... II
TABLE OF CONTENTS ... III
LIST OF TABLES ... VI
LIST OF FIGURES ... VII
CHAPTER 1 INTRODUCTION... 1
1.1 Reasons To The Thesis ... 1
1.2. Objectives of the projects ... 2
1.3. Scope and methodology ... 3
1.4. Implications of the project practical ... 3
1.5. Structure of the project ... 4
CHAPTER 2 LITERATURE REVIEW ... 5
2.1 Overview of human resource management ... 5
2.1.1 Concept, role and meaning of human resource management ... 5
2.1.2 Purpose of Human resource management ... 6
2.1.3 The basis functions of human resource management ... 6
2.2 Definition of employee satisfaction ... 13
2.3 The theory of demand and satisfaction of employees ... 14
2.3.1 Theory of Maslow's hierarchy of needs ... 14
2.3.2 ERG Theory... 17
2.3.3 Herzberg’s two factor theory ... 18
2.3.4 Adams fairness theory ... 19
2.4 THEORETICAL RESEARCH MODEL ... 20
2.4 Overview Binh Duong Department of Taxation ... 21
CHAPTER 3 RESEARCH METHODOLOGY ... 24
3.1. Research methods ... 24
3.1.1 The Preliminary research ... 26
3.1.2 Official research (quantitative research) ... 32
3.2 Data analysis plan ... 33
3.2.1 Describing research sampling ... 36
3.2.2 Evaluating scale through Cronbach Alpha significant Coefficient ... 36
3.2.3 Exploratory Factor Analysis: ... 37
3.2.4 Regression Analysis ... 38
4.1. Descriptive research sampling... 53
4.2. Evaluating scale based on Cronbach Alpha ... 54
4.3. Evaluating scale by using Exploratory Factor Analysis (EFA) ... 56
4.4 Official research model ... 61
4.5. Testing research model through regression method ... 62
4.5.1. Testing correlation between the variables ... 62
4.5.2 Regression analysis ... 64
CHAPTER 5 CONCLUSIONS AND RECOMMENDATIONS ... 67
5.1 Conclusions ... 67
5.2 Limitations And Recommendations ... 67
5.2.1 Limitations ... 67 5.2.2 Recommendations ... 68 REFERENCES ... 70 APPENDIX ... 71 QUESTIONNAIRE ... 71 CRONBACH ALPHA ... 75 EFA ... 79 REGRESSION ... 85
List of Tables
Table 2.1: The elements in Maslow's hierarchy of needs ... 17
Table 2.2: Two groups of factors Herzberg's ... 18
Table 3.1: Scale is encoded ... 33
Table 4.1: Research sampling categorized in accordance with interview objects ... 53
Table 4.2: The Cronbach alpha coefficients of components: ... 54
Table 4.3: the KMO and Bartlett's component measurement coefficient of factors affect the satisfaction of staff ... 57
Table 4.4: Exploratory Factor Analysis 1st ... 58
Table 4.5 Exploratory Factor Analysis 2st ... 59
Table 4.6 Exploratory Factor Analysis 3st ... 60
Table 4.7 Correlation matrix between the variables: ... 63
Table 4.8: Regression analysis ... 64
List of Figures
Figure 2.1: Maslow's hierarchy of needs ... 15
Figure 2.2: Model research ... 20
Figure 3.1: The process of implementing research... 25
Figure 4.1: The research model studying factors affecting Satisfaction staff Binh Duong
Chapter 1 INTRODUCTION
1.1 Reasons To The Thesis
In recent times the state officials - civil servants, especially the young staff - capable resigned tends to increase. That makes leadership Binh Duong Department of Taxation extremely worried. Although there is no official basis but leadership Binh Duong Department of Taxation also somewhat aware that there is dissatisfaction in the work of the group resigned. Therefore urgent problems of today's Pacific Tax Department to find out the level of satisfaction in the work of civil servants working at the Department for workers are not satisfied, the elements make them unhappy.
Human resources requirement has always been a hot question of the business organizations. In order to recruit talents, organizations/businesses constantly develop human resources policies in which salaries and many different treatment regimes is every business leader’s interest. Human resources are the living resources. Human value to society is mainly reflected by their labor capacity but labor capacity can’t exist independently outside a healthy body. Therefore, an employee with professional qualifications, who businesses need, have to get a healthy body, creative consciousness and the ability to adapt organizational environment and culture. That is the most important resources of the organizations/businesses.
Managing human resources in the current period is not merely the implementation of administrative procedures related to humans, but should be seen as a development strategy of any organization in a competitive environment and integration. Modern management of human resources does not allow the owner of the organization/business to consider labor input-costs merely; the employment
relationship can’t be seen the hiring relationship. They need to be aware that human is the most valuable asset in their organization; especially in Department of taxation environment, human is as a core element of the organization, determining the long-term development of a training facility. Therefore, staffs are the resources having to be invested and planned sustainable strategies.
Thus, investing and developing human resources which is academic staff Binh Duong Department of taxation is one of the solutions to increase competitiveness of Binh Duong Department of taxation
From this fact, the project: "Evaluate job satisfaction of staff Binh Duong
Department of taxation" is very meaningful research to help Department of
taxation administrators identifies factors affecting the job satisfaction of staff. There from, administrators can impact on the factors to improve the satisfaction of the staff of Binh Duong Department of taxation.
1.2. Objectives of the projects
The project was carried out with the aim of:Build a research model about job satisfaction of staff Binh Duong Department of taxation.
Adjust the scale of the job satisfaction of staff to accord with the conditions Binh Duong Department of taxation.
Test the hypothetical model and identify the components affecting the satisfaction of staff Binh Duong Department of taxation.
1.3. Scope and methodology
The subject of the project is staff Binh Duong Department of taxation
The scope of the research is current staff Binh Duong Department of taxation.
The procedure for this research was carried out through two main steps: a preliminary study using qualitative methods and formal study using quantitative methods.
Preliminary study was done by qualitative research with group discussion and interviewing technique. The purpose of this study was to calibrate and supplement the scale satisfaction of staff Binh Duong Department of taxation.
Formal study was done by quantitative research methods. Direct interviewing technique was used to gather information from staffs.
The collected information is processed by SPSS 21 software. Scale was assessed by Cronbach alpha reliability coefficient and exploratory factor analysis (EFA), and then regression analysis was used to test the research model.
1.4. Implications of the project practical
This project has practical implications for the researching and evaluating the job satisfaction of staff Binh Duong Department of taxation as follows:
Assess the level of job satisfaction of staff Binh Duong Department of taxation. Support managers, Binh Duong Department of taxation administrators to capture components affecting the job satisfaction of staffs so that the Binh Duong Department of taxation better focus on improving and enhancing the job satisfaction of staffs.
1.5. Structure of the project
The study is divided into five chapters with contents as follows:
Chapter 1: Introduction
Chapter 2: Literature Review
Chapter 3: Research Methodology
Chapter 4: Research Results and Analysis
Chapter 2 LITERATURE REVIEW
2.1 Overview of human resource management
2.1.1 Concept, role and meaning of human resource management
2.1.1.1 Concept
Human resource is based on the foundation in which each individual holds the different
roles and is connected by the certain goals. This is different from other resources because of the characteristic of people. Employees are distinct by their capacities, personal traits. They,
whose actions can change and depend on their own or the affect from environment, get the potential to develop; the competent to form teams and union to protect their benefits; the
ability to assess and question about activities of managers. Consequently, managing the human resource is much more difficult and complicated than managing other elements in
business process.
Human resource management is a system of philosophy, policy and operational function in
attracting, training – developing and maintaining the organization’s people to get the optimal results for both the organization and its staffs.
2.1.1.2 Role and meaning of Human resource
Researching Human resource management supports the administrators to reach goals,
results through others and also to learn how to deal with others, how to find the same ideas and be sensible with staff’s requirements, how to assess them accurately, how to create the
passion of job for them, and to avoid mistakes in selecting and employing the staffs, to find the way to combine the organization’s aims with individual’s ones, to improve the
efficiency of the organization and can gradually put human strategies become an integral part of the business strategy of the enterprise.
2.1.2 Purpose of Human resource management
Human resource management research issue about people management in one organization at the micromanage with two basic purposes as below:
* Using effectively human resource in order to increase the productivity and the effect of the organization.
* Satisfying the increasing demand of employees, enabling employees to maximize individual capabilities so that they are stimulate, encouraged as much as possible at
the workplace leading to the loyalty and the dedication for the company
2.1.3 The basis functions of human resource management
Human resource activities concerns to all issues about rights, obligations and
responsibilities of employees, which is the aim of high effect for both organization and staffs. In the reality, these activities is extremely diverse, abundant and different according
to the characteristics in organizational structure, technology, human resources, finance, development levels of the organization. Nonetheless, the main human resource activities
can be divided into three categories based on the functions that are: attracting, training and developing.
2.1.3.1 Functional group of attracting human resource
Functional group of attracting human resource focuses on the assurance about sufficient
right people for the right tasks, firstly the company must be based on producing and business plan and actual situation of employing staffs in that one in order to figure out
which tasks need more people. This group includes: job analysis, human resource plan, recruitment and work environment integration
2.1.3.2 Functional group of training and developing
This group concentrates on improving the staffs’ capacity, assuring that they own the
necessary techniques and levels to complete well-job, and providing good conditions for staffs to have maximum development of individual capacity. Beside training new ones, it is
required to re-train the old when the producing and business demand changed or the technical process and technology is innovated.
Training: is a systematic process for accumulating and enhancing knowledge and
practical techniques that help staffs implement a good job. That is a process of learning, which supports the labors to master more about their works, and learning activity in order to improve labors’ capacity and techniques for a more effective working task.
Developing: is learning activities which are out of the framework of labors, in order
to open to the new jobs based on the future direction of the organization Roles of training and developing
Directly support staffs to work better.
Update new knowledge and techniques for staffs. Avoid out-of-date management.
Guide the new jobs for new staffs.
Prepare for the team of manager staffs and the nearest specialization Satisfy the developing demand of staffs.
2.1.3.3 Functional group of maintaining human resource
This group focuses on maintaining and using effectively human resource in the organization.
This includes two smaller functions: stimulating and motivating staffs, and maintaining to develop good work relationships in the enterprise.
o Stimulating and motivating function: focuses on encouraging and motivating labors so that they can be energetic, enthusiastic and responsible to complete tasks with high quality. Enterprises give staffs extremely challengeable tasks, allow the staffs to get assessment from leaders about completion level and the meaning of successful completion, pay the salary equally and promptly reward the initiatives of individual, etc.
o Labor relation function: relates to activities to complete the working environment and working relation such as: signing contracts, resolving complaints, disputing labors, employee relations, improving working environment, health, insurance and occupational safety.
The operation applied to maintain effect of team working in businesses is diverse, including activities such as work achievement assessment, remuneration, and labor relations.
a) Work achievement assessment
Work achievement assessment is used with vary purposes:
Providing feedback to the employee's level of performance of their work in comparison with the standard model and other individuals.
Stimulating, motivating employees through the terms of assessment, recognition and support.
Providing information as the basis for issues of training, salary, reward, employees transfer, improved organizational structure.
Developing an understanding on the company through conversations about opportunities and career planning…
b) Remuneration
The structure of labor income
Income of employees from their work includes the following: basic salary, allowances, bonuses, and other kinds of benefits.
- Basis salary: is the salary is defined on the foundation of all the basic needs about biology, sociology, the complexity and the consumption level of labors in the average condition by career and work.
- Allowances: is the money paid for labors except for basis salary. It supplements the basic salary and additional offset for employees working in unstable or unfavorable conditions that have not been taken into account of basis salary. Allowances include responsibility allowances, toxic and dangerous allowances, etc. But in fact there are some other allowances, such as travelling, etc.
- Reward is a kind of stimulus material that provides positive effect on employees in striving to make a better job.
o Reward for productivity and quality
o Reward for initiatives
o Reward for saving.
o Reward according to operation results.
o Reward for ensuring working days.
- Benefits: The types of benefits that workers receive are very diverse and depend on many different factors such as government regulations, financial viability of the business, etc. Benefits express enterprise’s concern on lives of workers, create a stimulating effect on employee loyalty and close to it. Benefits of an enterprise include:
o Social insurance, health insurance
o Pension
o Vacations
o Subsidies for lunch of enterprise
o Allowance for employees having many children and disadvantaged circumstances
o Gifts of company for employees on the holidays, etc.
Aims of salary system
Enterprises tend to have 4 basis aims:
o Attracting candidates
o Maintaining good employees
o Stimulating, motivating employees
o Satisfying law’s requirements
Payroll forms
Generally, there are 3 ways of payroll, which is mainly applied in enterprises.
o Payment based on time
o Payment based on employees
o Payment based on working result
Payment based on working result is the most stimulated one to staffs in one enterprise and showed in 3 levels
Individual stimulus: includes payroll forms based on productions, standard working times and commission
Group stimulus (task system of group paying) Business result stimulus of enterprise
Non-financial treatment
Today, when the society is more and more developed, non-financial treatment is equally essential in order to meet the higher demand such as needs of society, needs to be respected
and needs to self-express according to Maslow’s opinion.
Stimulating non-financial treatment is divided into two kinds: work itself and work scenes.
Work itself must have exciting tasks, jobs requiring striving. Work has to be along with responsibilities and employees working to have chances to be recognized by superiors all of achievements in the past can complete tasks and get chances of promotion.
Work scenes: employees want to work in one environment with appropriate policy, colleagues with owning same character, suitable position, comfort working edition, flexible working hours, accrued working weeks. Moreover, they also want to share the tasks, etc.
c) Employment relationship
Union
Labors join into union because of 2 basic reasons: economy and reducing some unfair treatment from leaders.
In Viet Nam, union holds 3 basic tasks: to protect the interests of the workers, to attend to manage enterprise, to educate and motivate employees.
Collective labor agreement
Collective bargaining agreement is a written agreement between a collective labor and the employer about working conditions, rights and obligations of both parties in the
employment relationship. Collective agreement is a social advancement, recognizing the rights of employees, through their representatives which is the union to collectively
determine the working conditions, particularly useful conditions to employees in the comparison with those prescribed by law
about the most important issues relating to labors’ rights such as salary, bonus, working hours, working conditions and social insurance.
Labor dispute
Labor disputes often arise from conflicts needing to be resolved in range of labor relations. In Vietnam, labor disputes can occur among individual workers or among collective
workers with employers about benefits related to employment, wages, income and other labor’s conditions.
2.1.4 Labors require administrations
About job
A safe job.
A job without boring.
A job in which labors can use all of their techniques. A stable job.
About working conditions
A suitable working scene. Suitable facilities
Suitable working hours The individual rights
Being treated with the high respect on people’ characteristic. Being viewed as essential person.
Being employed by superiors who have capacity to work with others that means they know how to communicate with their human resource.
Having the right to take part in the decisions, which directly effect on labor’s own. Being known what superiors expect from labors’ completion.
Being assessed objectively.
Not getting any special right and bias. Wages and benefits
Equally wage system. Appropriate benefits funds.
Being paid according to what labors did for their company. Chances of training and promoting
Opportunity to learn new skills. Opportunity to be promoted equally.
Opportunity to get the training and developing programs. Being aware of the achievements of the past by superiors. Opportunity to improve living standards.
Job with opened future.
2.2 Definition of employee satisfaction
According to ISO 9000:2000 customers’ satisfaction is their feeling of the response level required by organization.
According to Philip Kotler, customer satisfaction is their sense of satisfaction or disappointment that results is the comparison between the processes of perceiving about a
product with their expectations.
can be defined as follows: employee satisfaction is a distance between what employees receive compared to what they expected. Thus, the greater the distance of employee
satisfaction lower.
Additionally, employee satisfaction is also understood to be the general attitude of the
individual employee to work. This satisfaction is also assessed as perceptions and feelings of that employee for his/her work.
2.3 The theory of demand and satisfaction of employees
To get employee satisfaction, the most important thing is to understand what needs and motivation of employees are. So, the study of employee satisfaction is often associated with
the theories of demand and encouragement. In this thesis, the author refers to the following theories: the theory of Maslow's hierarchy of needs, ERG theory, Herzberg's two factors
theory, the theory of fairness of Adams
2.3.1 Theory of Maslow's hierarchy of needs
According to Maslow, people work to satisfy their own needs. Those have been divided into
5 categories and are arranged hierarchically from low to high according to the following diagram:
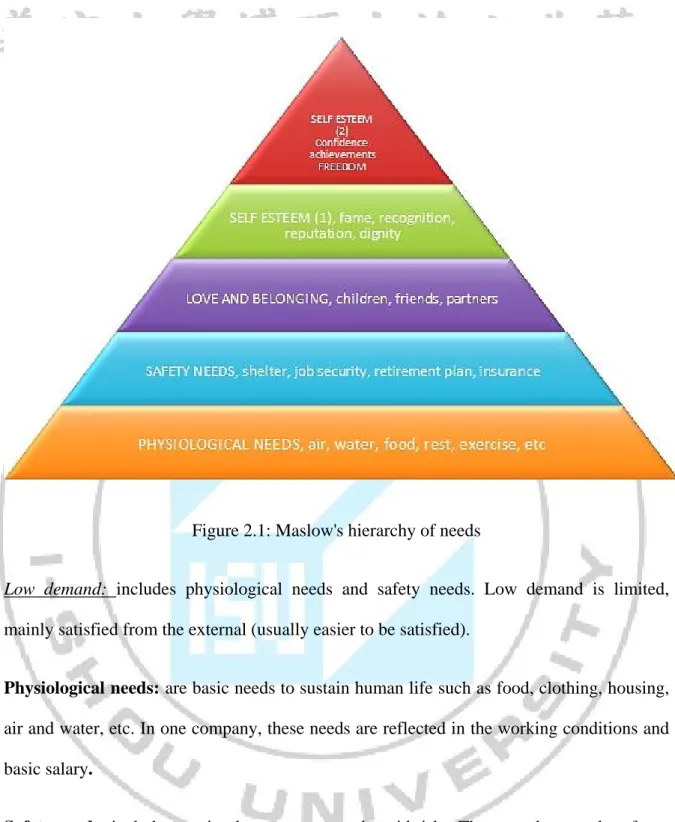
Figure 2.1: Maslow's hierarchy of needs
Low demand: includes physiological needs and safety needs. Low demand is limited,
mainly satisfied from the external (usually easier to be satisfied).
Physiological needs: are basic needs to sustain human life such as food, clothing, housing,
air and water, etc. In one company, these needs are reflected in the working conditions and basic salary.
Safety needs: include security, law to protect and avoid risks. These needs not only refer to
the physical safety but also refer to spiritual safety, which avoid the emotional damage
caused. In business it can be contracts, social insurance policy, safe jobs and long-term ones.
High demand: includes social needs, self-esteem and self-expression. These needs are met
Social needs: are the needs to have a good relationship with surroundings. Because humans
are members of society, other people should accept them. In organization, this demand is
expressed through expectations to have good relationships with colleagues and leaders.
Demand to be respected (self-esteem): is the need to have status, be recognized and
respected by others as well as respected by their own. Company can help staff achieve this demand by rewarding, promoting, or increasing salary.
Demand for self-expression: this is the highest and the most difficult demand to be
satisfied by Maslow. This includes personal development and self-improvement needs. A
individual who are satisfied the demand to be respected will desire to express his/her creativity in work and life, and deal with the challenges. Individuals are always trying to be
better and to be more complete. In enterprise, to satisfy these needs, it should create opportunities for everyone to grow, to be creative, to provide training courses so that they
have enough capacity and confidence to cope with the demands of work and new challenges.
According to Maslow, the order to satisfy the demand goes from low to high, while the
lower-level needs are met, the higher needs will appear. Therefore, to effectively encourage for achieving the highest level of employees’ satisfaction, managers need to know which
demand their employees are in to be supplied in order to make the necessary solution to satisfy their needs, thereby ensuring that the objectives of the organization are made.
This is the theory of human needs. This theory is applied in this study because when workers' demands are met, they are satisfied. And this is expressed as different variables
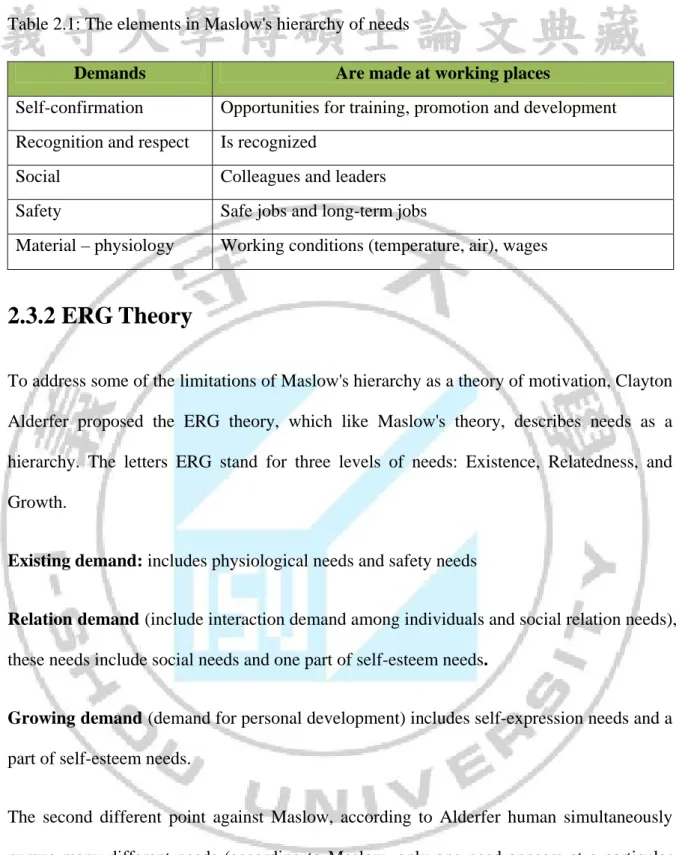
Table 2.1: The elements in Maslow's hierarchy of needs
Demands Are made at working places
Self-confirmation Opportunities for training, promotion and development Recognition and respect Is recognized
Social Colleagues and leaders
Safety Safe jobs and long-term jobs
Material – physiology Working conditions (temperature, air), wages
2.3.2 ERG Theory
To address some of the limitations of Maslow's hierarchy as a theory of motivation, Clayton Alderfer proposed the ERG theory, which like Maslow's theory, describes needs as a
hierarchy. The letters ERG stand for three levels of needs: Existence, Relatedness, and Growth.
Existing demand: includes physiological needs and safety needs
Relation demand (include interaction demand among individuals and social relation needs),
these needs include social needs and one part of self-esteem needs.
Growing demand (demand for personal development) includes self-expression needs and a
part of self-esteem needs.
The second different point against Maslow, according to Alderfer human simultaneously
pursue many different needs (according to Maslow, only one need appears at a particular time). The third different points against Maslow, as the offset factor among demands when
a certain demand is blocked, people will put all of efforts into satisfying other needs.
Applying to consider in this study, when the needs of the employee satisfaction is
2.3.3 Herzberg’s two factor theory
Herzberg's theory is formed on the basis of investigation and taking comments from employees. Practical research by asking workers which measure of launched measures by
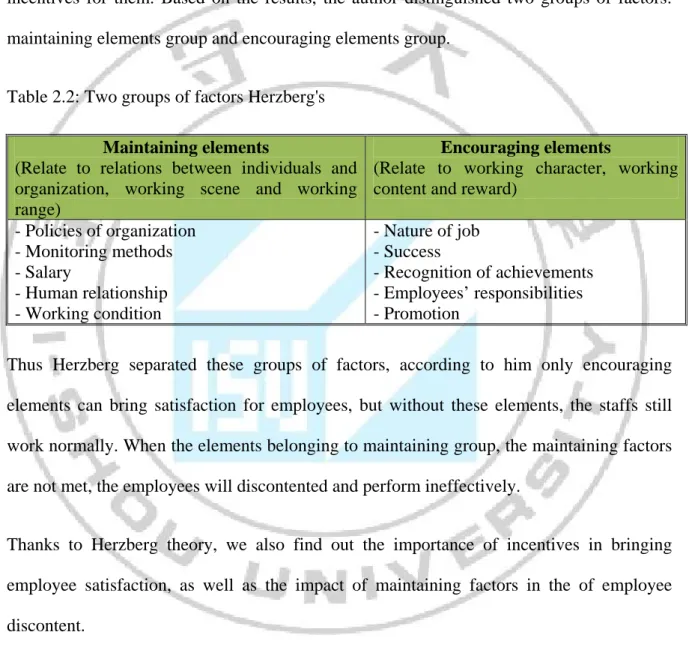
research workers can motivate them to work harder, and which measure can’t create incentives for them. Based on the results, the author distinguished two groups of factors:
maintaining elements group and encouraging elements group.
Table 2.2: Two groups of factors Herzberg's
Maintaining elements
(Relate to relations between individuals and organization, working scene and working range)
Encouraging elements
(Relate to working character, working content and reward)
- Policies of organization - Monitoring methods - Salary - Human relationship - Working condition - Nature of job - Success - Recognition of achievements - Employees’ responsibilities - Promotion
Thus Herzberg separated these groups of factors, according to him only encouraging
elements can bring satisfaction for employees, but without these elements, the staffs still work normally. When the elements belonging to maintaining group, the maintaining factors
are not met, the employees will discontented and perform ineffectively.
Thanks to Herzberg theory, we also find out the importance of incentives in bringing
employee satisfaction, as well as the impact of maintaining factors in the of employee discontent.
Thereby we can realize that, satisfaction factors are different from elements creating dissatisfaction. Hence enterprise cannot wait for the satisfaction of workers by removing the
causes of the discontent. To achieve that, company has to deal with both these groups of elements.
2.3.4 Adams fairness theory
According to J. Stacy Adams, the employees in the organization want to be treated equally; they tend to compare their contributions to the incentives and rewards that they received
(known as private fairness). Moreover, they also compare their contributions, dedication and incentives with other colleagues in the company (social fairness). When making these
comparison, there are three cases occurring:
- If workers think that they are well treated, get appropriate rewards and incentives they will continue to maintain their working efficiency.
- If employees believe they are badly treated, rewards and incentives are not commensurate with their effort; they will be discontented leading to work without their full capacity or even drop out of work.
- If workers get rewards and incentives, which is higher than their expectation, they will work harder.
Thus, the fairness theory applied in this study is that a staff cannot be satisfaction if they
realized they are not treated fairly in wages, incentives, training opportunities, promotion and the attention and support from leaders.
In conclusion
Those theories which are hierarchy of needs theory of Abraham Maslow, Alderfer’s ERG
theory, Herzberg's two factors theory , have the different objects but generally show that the demand for money is not the only demand; there are many other needs wanted to be
satisfied . It can be spiritual needs as learning, developing, self-control in work; or emotional needs as loving and being loved by those surroundings. And of course these
needs are difficult to meet if the employees do not have a good health, certain material conditions to achieve the above ones. And at the same time employees need to satisfy many
factors also greatly influenced to the employees (according to the theory by Adams)
Above parts presented: An overview of human resource management, the concept of
employee satisfaction, the theories of demand and satisfaction of employees. The author draws on theoretical research model consisting of 10 elements is shown in Picture 2.2.
2.4 THEORETICAL RESEARCH MODEL
H1: Jobs positive relationship with satisfaction
H2: Salary positive relationship with satisfaction
H3: Colleague positive relationship with satisfaction
H4: Leaders positive relationship with satisfaction
H5: Training - Promotion positive relationship with satisfaction
H6: Working condition positive relationship with satisfaction
H7: Achievement acceptance positive relationship with satisfaction
2.4 Overview Binh Duong Department of Taxation
Binh Duong Department of taxation is an organization under the The Ministry of Finance,
functional implementation of management of taxes, charges, fees, and other revenues of the state budget within the scope of duties of the industry in the area of tax under the provisions
of law.
Binh Duong Department of taxation has legal personality, its own seal and open accounts at
the State Treasury under the provisions of law.
Binh Duong Department of taxation to perform the tasks, powers and responsibilities under
the provisions of the Law on Tax Administration, tax laws, and other laws and regulations related
Organization
a) The Propaganda - Support the taxpayer;
c) The tax inspectorate;
d) Examine some of the tax;
e) The Debt Management and Debt Enforcement Tax;
e) The sum - Professional - estimates;
f) The Management of personal income tax;
g) The Internal Audit;
h) The Administration - Human Resources - Finance - India only;
i) The registration fee and other revenue;
k) A tax Teams communal wards....
Leaders
1. Department of Taxation Department deputy chief and a Director.
Department heads are responsible to the Director for Administration of Taxation and the
law for the entire operation of the Tax Office in the area.
Chief Deputy Director Department is responsible before the law for growth and field work
is assigned.
2. Appointment, dismissal, demotion, discipline, leadership maneuvering Tax Department
carried out under the provisions of law and regulations on decentralization of the Ministry of Finance officials.
Chapter 3 RESEARCH METHODOLOGY
Chapter 2 presented the theoretical basis and research model built on the hypothesis. Chapter 3 will introduce the research methods to test the theoretical model combined with the
proposed hypothesis.
3.1. Research methods
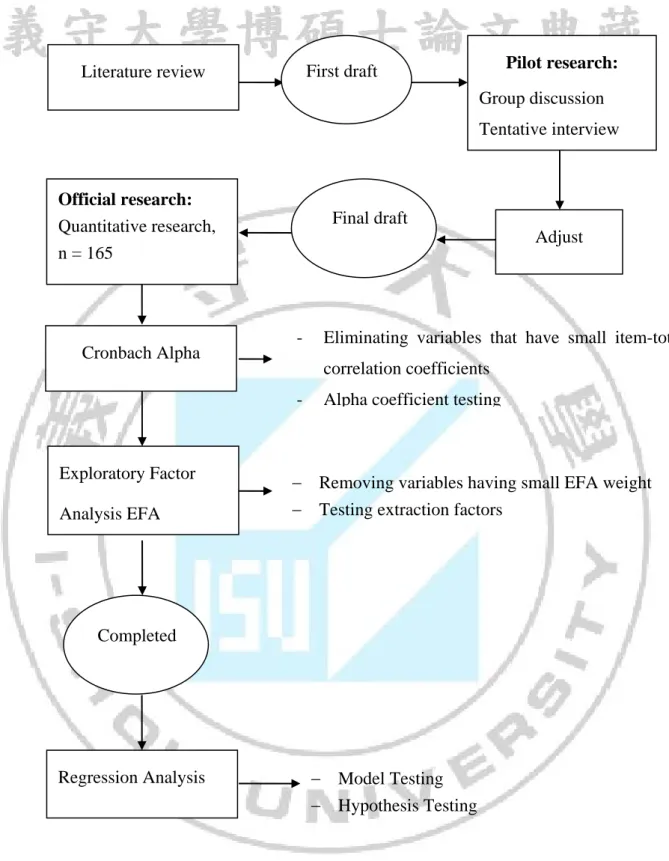
Implementing this research includes two main steps: preliminary research and official
Figure 3.1: The process of implementing research Pilot research: Group discussion Tentative interview Literature review Adjust Official research: Quantitative research, n = 165 Cronbach Alpha Exploratory Factor Analysis EFA Regression Analysis
- Eliminating variables that have small item-total correlation coefficients
- Alpha coefficient testing
Removing variables having small EFA weight Testing extraction factors
Model Testing Hypothesis Testing First draft
Completed
3.1.1 The Preliminary research
3.1.1.1 Discussing Expert Group
In this study, the authors come in contact with real staff by opening questionnaire is aimed
to discover the information that the author has not thought to support the complete set of questionnaires. In qualitative research, the authors discuss directly with 3 Binh Duong
Department of Taxation administrators and staff, lists the following interview:
• Vice Binh Duong Department of Taxation
• Chief administrative organization
• Chairman of the Trade Union
Content preliminary interview
Interview Questions:
Question 1: There are many factors leading to satisfaction in your work. So according to you which is which factors?
Question 2: You list details each factor. If they do not figure out the elements, the author suggests such scale as follows:
Examples of factors "Salary" details are as follows:
Competitive salaries compared to other Binh Duong Department of Taxation in the province
Salary paid fair
Salary from the Binh Duong Department of Taxation can support his family
…
Question 3: Through the questionnaire, you can add, remove or change?
Qualitative Research Results
The factors affecting the satisfaction Binh Duong Department of Taxation, in order to be most telling
• Salary – welfare
• Working conditions
• Support colleagues
• Attractive jobs, safety
• The opportunity for training, promotion
Having mentioned factors, but in small quantities
• Treated fairly
• Autonomy at work
• Leader attention
• The external relations can be at work
Therefore: Through qualitative research, the elements which interviewees quoted depended on the elements of the original model author gave.
care and support from leaders) were surveyed with the corresponding variable such as compensation - benefits, training opportunities creation, promotion, leadership)
Conclusion: After doing qualitative research, the authors found no difference compared with the theoretical model, hence, the author retain the original theoretical model made of 7
factors influencing the satisfaction Binh Duong Department of Taxation.
Through qualitative research interviews and the comments of the Vice Binh Duong
Department of Taxation, Chief administrative organization, about the initial questionnaire, the authors have amended the questionnaire to collect data.
3.1.1.2 Designing Questionnaire
After the group discussion, the designed questionnaire consists of two parts as follows:
Part I of the questionnaire is designed to collect the labors assessment satisfaction in work.
Part II of the questionnaire is used to classify information provided by respondents.
Part I of the questionnaire consists of 27 variables in which include the initial 26 observation variables used to measure the amount factors affect satisfaction in work of
labors. The next 1 observation variables used to measure satisfaction of labors
Completed questionnaire was tentatively used to interview 10 people to check the clarity of
the questionnaire and collected information. After the questionnaire is adjusted, the official questionnaire (see Appendix) was sent to officially interview.
3.1.1.3 Adjusted scale
Scale is a tool used to estimate the status or level of the surveyed units by the characteristic.
(Hoang Trong – Chu Nguyen Mong Ngoc, 2008).
In this study, the authors used only two types of scales: nominal scale, interval scale
Nominal scale: The nominal type, sometimes also called the qualitative type, differentiates between items or subjects based only on their names or (meta-) categories and other
qualitative classifications they belong to. Examples include gender, nationality, ethnicity, language, genre, style, biological species, and form.
Interval Scale: The interval type allows for the degree of difference between items, but not the ratio between them. Examples include temperature with the Celsius scale, which has an
arbitrarily-defined zero point (the freezing point of a particular substance under particular conditions), and date when measured from an arbitrary epoch (such as AD). Ratios are not
allowed since 20°C cannot be said to be "twice as hot" as 10°C, nor can multiplication/division be carried out between any two dates directly. However, ratios of
differences can be expressed; for example, one difference can be twice another. Interval type variables are sometimes also called "scaled variables", but the formal mathematical
term is an affine space (in this case an affine line).
Likert scale is a type of range scale, is a scale in which a series of statements relate to the
attitude in raised questions and the answers will select one to answer.
The reason to choose 2 types of scale: nominal scale, interval scale
One of the purposes of this topic is to find out, determine the satisfaction level of the staff, thus Likert scale format is best suited for the answers of the respondents in the form of this
scale, we will see the fulfillment of workers in every aspect in the satisfaction or dissatisfaction and much and less level (specifically, authors use 5 level Likert scale, 1 very
because of the scale Likert scale is range one, we can use the collected data for processing, quantitative analysis to determine the correlation relationships, linear relationship among
variables in general, as well as among the independent variables and the dependent variable.
In addition, to examine if the satisfaction level of the target group (age, gender...) is
different or not, it must have the parts for asking about this group then namely scale will be used.
From the theoretical basis and research model proposed in Chapter 2 in combination with qualitative research the author made a scale of model research about satisfaction are as
below:
Component of the Jobs
1. Job allows you to use good personal capacity
2. Job is consistent with profession
3. Work is assigned responsibility, clear guiding
4. When completed work fine, Binh Duong Department of Taxation will be very welcome
Component of the salary
1. You get higher salaries compared to the market
2. Wages you receive match your capabilities
3. You can live quite well based on income from the Binh Duong Department of Taxation
4. Income distribution of the Binh Duong Department of Taxation is equal
Component of the colleague
1. The support for specialized knowledge from colleagues at work
2. Colleagues are ready to assist you when having trouble
3. Colleagues in Binh Duong Department of taxation are friendly
4. Colleagues in the Binh Duong Department of taxation listen and respect your opinions
Component of the leaders
1. Leadership timely assist you whenever you need
2. Binh Duong Department of Taxation leaders expressed a care to each staff
3. Binh Duong Department of Taxation leaders fairly treat to all subordinates
4. Binh Duong Department of Taxation leaders listen to the opinions of staffs
Component of the promotion
1. Know what conditions you are to get promoted
2. Binh Duong Department of Taxation Pacific has promoted policies for capacity
3. Advancement opportunities are fair to all employees
Component of the working condition
1. Tools and equipment is sufficient to complete your work
2. Temperature conditions can ensure that you can work well
3. Jobs doesn’t require frequent extra-time
Component of the achievement acceptance
2. Superior recognize the your achievement
3. You are rewarded before others when getting new achievement
The scale of satisfaction
1. In general, you are completely satisfied when working in Binh Duong Department of Taxation
3.1.2 Official research (quantitative research)
Official research is implemented by using quantitative research methods. Quantitative
research solely tests the scale in the research model through the questionnaire used to survey.
3.1.2.1 The method collecting information and sample size
Collecting secondary information
References include: theories of human resource management, market research, analyzing
research data with SPSS
Documentation for internal use and website Binh Duong Department of Taxation
Collecting primary information
Primary data was collected through surveying staff. Direct interview technique and
interviewing through the Internet are used to collect data.
Research Sample
Resembling other marketing research this research used a convenient sampling method. In
general, the sample size is as large as better, but how many the samples are enough in a convenient sampling, which is a question that is not clearly answered. According to Hair et al
(1998), in order to be able to use exploratory factor analysis, the sample size is least at 5 upon a observation variable and the sample size should not be less than 100.
The questionnaire used in this study consists of 41 questions, so the tentative sample size is n
= 150. Total released questionnaires are 250 the total number of collected questionnaires was 200. The collected data is processed, the the number of valid questionnaires are used to handle
SPSS 20.0 are 165, which is a proportion of 82.5%.
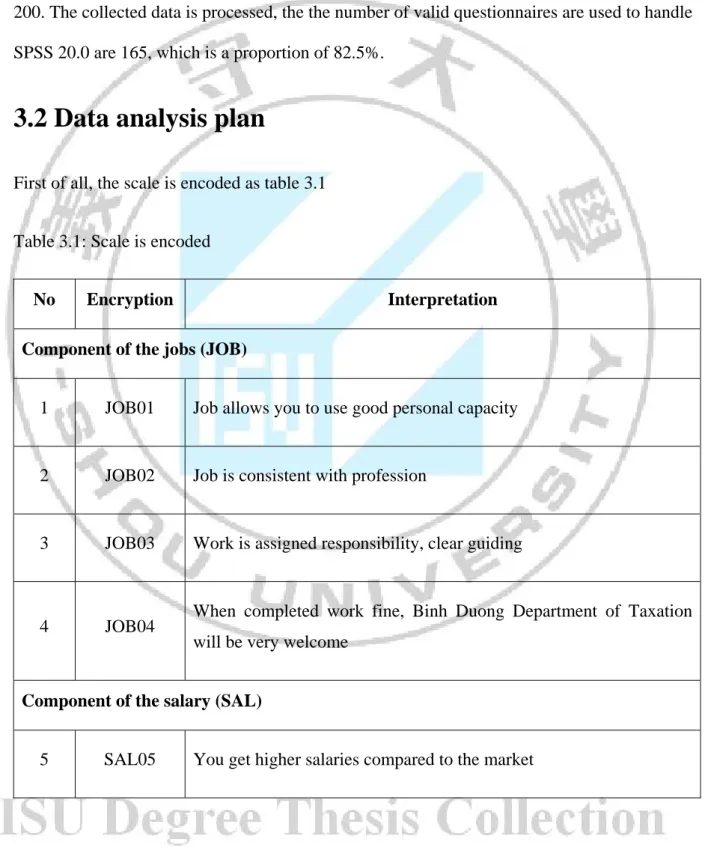
3.2 Data analysis plan
First of all, the scale is encoded as table 3.1
Table 3.1: Scale is encoded
No Encryption Interpretation
Component of the jobs (JOB)
1 JOB01 Job allows you to use good personal capacity
2 JOB02 Job is consistent with profession
3 JOB03 Work is assigned responsibility, clear guiding
4 JOB04 When completed work fine, Binh Duong Department of Taxation will be very welcome
Component of the salary (SAL)
6 SAL06 Wages you receive match your capabilities
7 SAL07 You can live quite well based on income from the Binh Duong Department of Taxation
8 SAL08 Income distribution of the Binh Duong Department of Taxation is equal
9 SAL09 You get a raise based entirely on the ability to perform the job
Component of the colleague (COL)
10 COL10 The support for specialized knowledge from colleagues at work
11 COL11 Colleagues are ready to assist you when having trouble
12 COL12 Colleagues in Binh Duong Department of taxation are friendly
13 COL13 Colleagues in the Binh Duong Department of taxation listen and respect your opinions
Component of leaders (LEA)
14 LEA14 Leadership timely assist you whenever you need
15 LEA15 Binh Duong Department of Taxation leaders expressed a care to each staff
16 LEA16 Binh Duong Department of Taxation leaders fairly treat to all subordinates
17 LEA17 Binh Duong Department of Taxation leaders listen to the opinions of staffs
Component of the promotion (PRO)
18 PRO18 Know what conditions you are to get promoted
19 PRO19 Binh Duong Department of Taxation Pacific has promoted policies for capacity
20 PRO20 Advancement opportunities are fair to all employees
Component of the working condition (WOR)
21 WOR21 Tools and equipment is sufficient to complete your work
22 WOR22 Temperature conditions can ensure that you can work well
23 WOR23 Jobs doesn’t require frequent extra-time
Component of the achievement acceptance (ACH)
24 ACH24 You are evaluated fairly by the Binh Duong Department of Taxation
25 ACH25 Superior recognize the your achievement
26 ACH26 You are rewarded before others when getting new achievement
The scale of satisfaction (SAT)
27 SAT
Duong Department of Taxation
The data will be collected after cleaning and processing by SPSS 20.0 software. Some
analytical methods used in the study are as follows:
3.2.1 Describing research sampling
Implementing descriptive statistics based on objects participating the survey and
characteristics, such as gender, salary, age…from the objects taking part in the survey process
3.2.2 Evaluating scale through Cronbach Alpha significant
Coefficient
Analyzing and evaluating scale whose purpose of this method is to check whether the
research questions are questions really contributing to the measurement of theoretical concepts that we are studying. The items of research questionnaire are incorporated to
measure a latent concept and simultaneously the items must be correlation with the remaining items in the group. Cronbach's Alpha coefficient is an approach to test strictly
statistics extent at which the research questions in the scale correlation with each other. On that foundation, the variables having correlation coefficients with item-total correlation less
than 0.3 will be removed and the standard to choose the scale when they have Alpha significant at 0.65 or more. Typically, the scale having the Cronbach alpha that is from 0.7
to 0.8 are reasonably used. Many researchers believe that when the scale reliability that is from 0.8 to 1 (as close as possible) is a good measurement scale. However, if the concept of
measure is new or absolutely new to the respondents in the context of studying, the coefficient of Cronbach's Alpha should be accepted from 0.6 or higher (Nunnally, 1978;
3.2.3 Exploratory Factor Analysis:
Exploratory Factor Analysis EFA: After appraising the reliability of scale through Cronbach alpha coefficients and eliminating variables that do not ensure reliability, EFA is used to
shorten and summary data.This method is very beneficial in identifying the cluster of variables that are necessary for research problems and are utilized to find out the
relationship between variables.
Bartletti’s Test of Sphericity: the Bartlett’s parameter is used for testing the Ho hypothesis
of variables that do not correlate with overall. Testing Bartlett’s is meaningful (significant) at sig that is inferior than 0.05. In the other words, Ho hypothesis declaring that correlation
matrix between variables within population is identity matrix will be omitted.
For Exploratory Factor Analysis, the KMO indicator (Kaiser-Meyer - Olkin) is an indicator
used to check whether Factor Analysis is appropriate or not. KMO indicator must possess a value that is able to be from 0.5 to 1, so the Factor Analysis is valid. On the other hands, if
the indicator is smaller than 0.5, the Factor Analysis is not potentially suitable for implementing Exploratory Factor Analysis.
Moreover, Exploratory Factor Analysis also bases on eigenvalue to determine the number of Factors. Only if Factors have eigenvalue greater than 1 can the factors keep in model.
The eigenvalue value is representative a mount of variation explained by the factors. The factors having eigenvalue less than 1 will not be used to summary data. In this case, an
original variable will be a good option to summary data.
One important part of the result tables derived from Exploratory Factor Analysis is
Component Matrix or Rotated Component Matrix). Variables having the weight smaller than 0,45 will be removed and variables possessing the weight that do not achieve high
discrimination between Factors, specifically less than 0,3 are also will be eliminated.
Factor Matrix contains coefficients demonstrating standardized variables through Factors
(each variables is a polynomial that contains the factors). Factor loadings illustrate the correlation between variables and factors. The coefficients show factors and variables have
correlation strictly with each other. Using Principal Component Factor analysis method is suitable when Factor Loadings must have weighted number greater 0.45.
3.2.4 Regression Analysis
Testing theory model through Multiple Linear Regression analysis:
After extracting factors obtained from Exploratory Factor Analysis, then Multiple Linear
Regression analysis is reasonably used. Multiple linear Regression analysis is a statistical approach used to analyze the relationship between a dependent variable and independent
variables. The purpose of using the Multiple Linear Regression method is to describe the relationship and simultaneously help us predict the extent of dependent when we foresee the
value of independent variables. When running the Multiple linear Regression model, we should pay intention some parameters, including:
Beta coefficient: Standardize regression coefficients allow researchers to compare directly between coefficients based on the interpreting relationship of the coefficients with the
dependent variable.
Coefficient of determination R2: Evaluate the changing part of the independent variable
interpreted independent variables or predictor variable. The R2 fluctuates from 0 to 1.
Adjusted coefficient R2: Since Coefficient of determination R2 is demonstrated to be a
The more independent variables mount into model, the more the value of R2 increases. However, the equation containing many variables is not always a suitable equation, which is
demonstrated. By comparing the model whose adjusted coefficient R2 is greater other models whose adjusted coefficient R2 will explain satisfaction of staff Binh Duong Department of
Chapter 4 RESEARCH RESULTS
4.1. Descriptive research sampling
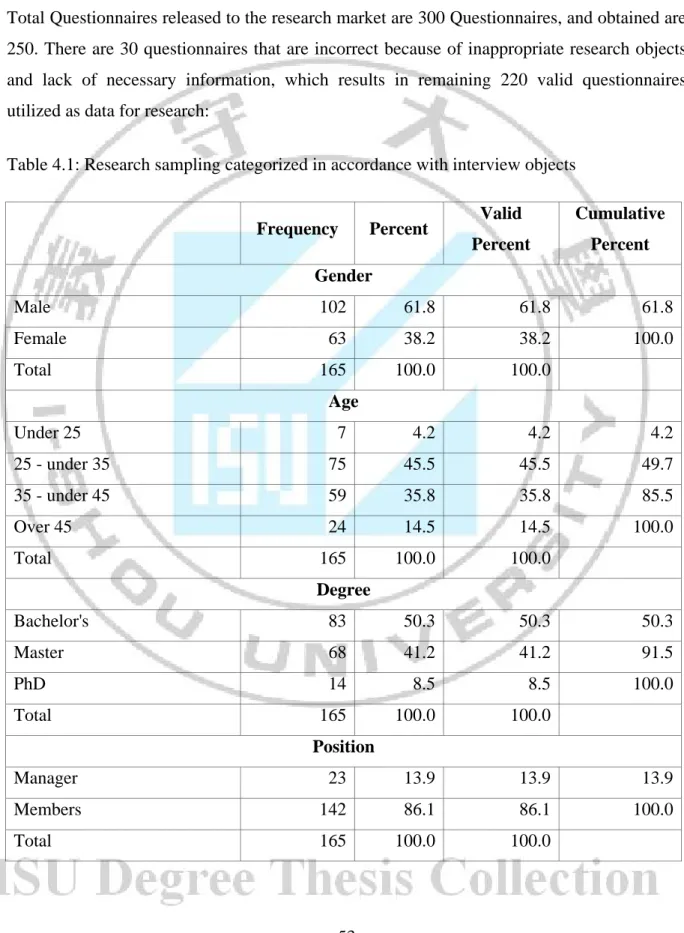
Total Questionnaires released to the research market are 300 Questionnaires, and obtained are 250. There are 30 questionnaires that are incorrect because of inappropriate research objects and lack of necessary information, which results in remaining 220 valid questionnaires utilized as data for research:
Table 4.1: Research sampling categorized in accordance with interview objects
Frequency Percent Valid
Percent Cumulative Percent Gender Male 102 61.8 61.8 61.8 Female 63 38.2 38.2 100.0 Total 165 100.0 100.0 Age Under 25 7 4.2 4.2 4.2 25 - under 35 75 45.5 45.5 49.7 35 - under 45 59 35.8 35.8 85.5 Over 45 24 14.5 14.5 100.0 Total 165 100.0 100.0 Degree Bachelor's 83 50.3 50.3 50.3 Master 68 41.2 41.2 91.5 PhD 14 8.5 8.5 100.0 Total 165 100.0 100.0 Position Manager 23 13.9 13.9 13.9 Members 142 86.1 86.1 100.0 Total 165 100.0 100.0
Table 4.1 depicted Gender of the respondents were male accounted for 61.8%, femal accounted for 38.2%. Because the sample is convenient sample, so the dispersion pattern is uneven and the difference is quite clear between Male and Female.
According to the criteria of age, the age group under 25 years accounted for 4.2%. The remained percentage is the age group from 25 – under 35 years in the total sample, 45.5%.
The remained percentage is the age group from 35 – under 45 years in the total sample, 35.8%. The remaining 14.5% is over 45
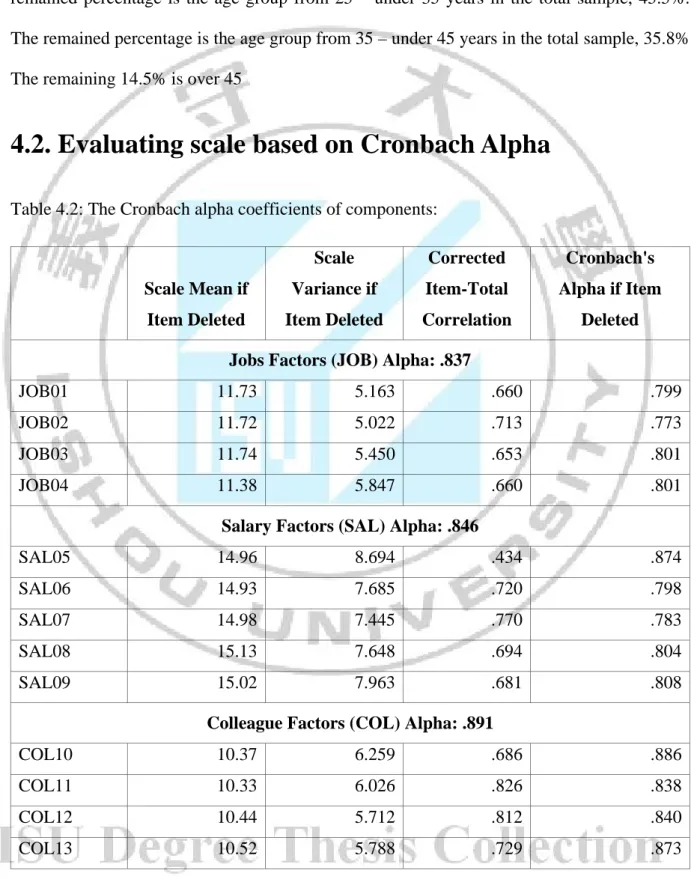
4.2. Evaluating scale based on Cronbach Alpha
Table 4.2: The Cronbach alpha coefficients of components:
Scale Mean if Item Deleted Scale Variance if Item Deleted Corrected Item-Total Correlation Cronbach's Alpha if Item Deleted
Jobs Factors (JOB) Alpha: .837
JOB01 11.73 5.163 .660 .799
JOB02 11.72 5.022 .713 .773
JOB03 11.74 5.450 .653 .801
JOB04 11.38 5.847 .660 .801
Salary Factors (SAL) Alpha: .846
SAL05 14.96 8.694 .434 .874
SAL06 14.93 7.685 .720 .798
SAL07 14.98 7.445 .770 .783
SAL08 15.13 7.648 .694 .804
SAL09 15.02 7.963 .681 .808
Colleague Factors (COL) Alpha: .891
COL10 10.37 6.259 .686 .886
COL11 10.33 6.026 .826 .838
COL12 10.44 5.712 .812 .840
Leaders Factors (LEA) Alpha: .835
LEA14 10.76 4.929 .710 .771
LEA15 10.47 5.190 .700 .777
LEA16 10.62 5.116 .706 .774
LEA17 10.42 5.660 .552 .840
Promotion Factors (PRO) Alpha: .816
PRO18 6.85 4.434 .665 .751
PRO19 6.52 4.349 .699 .715
PRO20 6.45 4.761 .641 .774
Working condition Factors (WOR) Alpha: .880
WOR21 7.18 3.113 .772 .826
WOR22 7.15 3.166 .788 .813
WOR23 7.11 3.073 .745 .852
Achievement acceptance Factors (ACH) Alpha: .822
ACH24 6.81 3.422 .635 .799
ACH25 6.64 3.402 .721 .710
ACH26 6.46 3.506 .677 .754
Jobs factors have 04 observation variables including JOB01, JOB02, JOB03, JOB04 all of which having item-correlation coefficients greater than 0.3 should be accepted. Beside, the Cronbach Alpha reliability coefficient is 0.837 (greater than 0.7), Jobs factor scales are used to implement next factor analysis.
Salary factors have 05 observation variables including SAL05, SAL06, SAL07, SAL08, SAL09 all of which having item-correlation coefficients greater than 0.3 should be accepted.
Beside, the Cronbach Alpha reliability coefficient is 0.846 (greater than 0.7), Salary factor scales are used to implement next factor analysis.
Colleague factors have 04 observation variables including COL10, COL11, COL12, COL13 all of which having item-correlation coefficients greater than 0.3 should be accepted. Beside,
scales are used to implement next factor analysis.
Leaders factors have 04 observation variables including LEA14, LEA15, LEA16, LEA17
all of which having item-correlation coefficients greater than 0.3 should be accepted. Beside, the Cronbach Alpha reliability coefficient is 0.835 (greater than 0.7), Leaders factor scales
are used to implement next factor analysis.
Promotion factors have 03 observation variables including PRO18, PRO19, PRO20 LEA17
all of which having item-correlation coefficients greater than 0.3 should be accepted. Beside, the Cronbach Alpha reliability coefficient is 0.816 (greater than 0.7), Promotion factor
scales are used to implement next factor analysis.
Working condition factors have 03 observation variables including WOR21, WOR22,
WOR23 all of which having item-correlation coefficients greater than 0.3 should be accepted. Beside, the Cronbach Alpha reliability coefficient is 0.880 (greater than 0.7),
Working condition factor scales are used to implement next factor analysis.
Achievement acceptance factors have 03 observation variables including ACH24, ACH25,
all of which having item-correlation coefficients greater than 0.3 should be accepted. Beside, the Cronbach Alpha reliability coefficient is 0.822 880 (greater than 0.7), Achievement
acceptance factor scales are used to implement next factor analysis.
4.3. Evaluating scale by using Exploratory Factor
Analysis (EFA)
After checking the reliability of the scale, EFA is employed. That the method is chosen to analyze the factors is the principal components method with varimax rotation.
After testing the reliability through Cronbach Alpha, the 26 observation variables ensure reliability. Exploratory Factor Analysis is used to evaluate convergence extent of the
observation variables along with components.
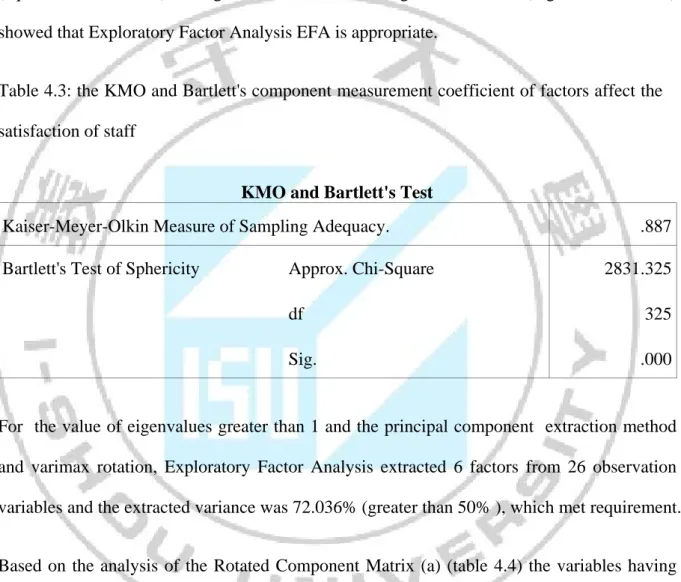
Testing KMO and Bartlett's in the factor analysis showed that the coefficient of KMO high
(equal to 0.887 > 0.5) testing Bartlett's value with significance level (Sig. = 0000 <0.05) showed that Exploratory Factor Analysis EFA is appropriate.
Table 4.3: the KMO and Bartlett's component measurement coefficient of factors affect the satisfaction of staff
KMO and Bartlett's Test
Kaiser-Meyer-Olkin Measure of Sampling Adequacy. .887
Bartlett's Test of Sphericity Approx. Chi-Square 2831.325
df 325
Sig. .000
For the value of eigenvalues greater than 1 and the principal component extraction method and varimax rotation, Exploratory Factor Analysis extracted 6 factors from 26 observation
variables and the extracted variance was 72.036% (greater than 50% ), which met requirement.
Based on the analysis of the Rotated Component Matrix (a) (table 4.4) the variables having
weight less than 0.5 will be removed, the variables having weight that do not achieve a high distinction between the factors, in particular is smaller 0.3 will also be eliminated.
Table 4.4: Exploratory Factor Analysis 1st
Rotated Component Matrixa
Component 1 2 3 4 5 6 JOB01 .798 JOB02 .812 JOB03 .712 JOB04 .701 SAL05 SAL06 .818 SAL07 .781 SAL08 .714 SAL09 .705 COL10 .613 COL11 .774 COL12 .830 COL13 .814 LEA14 .734 LEA15 .832 LEA16 .783 LEA17 .601 PRO18 .754 PRO19 .881 PRO20 .778 WOR21 .537 WOR22 WOR23 .502 ACH24 .753 ACH25 .782 ACH26 .788
Extraction Method: Principal Component Analysis. Rotation Method: Varimax with Kaiser Normalization. a. Rotation converged in 7 iterations.
After the inappropriate variables were removed, the components of factors affecting
satisfaction of staff are measured by 24 observation variables. Exploratory Factor Analysis EFA results at second round showed that total variances extracted from 6 factors that have
Based on the analysis of the Rotated Component Matrix (a) (table 4.5) the variables having weight less than 0.5 will be removed, the variables having weight that do not achieve a
high distinction between the factors, in particular is smaller 0.3 will also be eliminated. Specifically, the variables including COL10 will be omitted.
Table 4.5 Exploratory Factor Analysis 2st
Rotated Component Matrixa
Component 1 2 3 4 5 6 JOB01 .800 JOB02 .818 JOB03 .718 JOB04 .704 SAL06 .810 SAL07 .785 SAL08 .725 SAL09 .714 COL10 .612 .502 COL11 .774 COL12 .833 COL13 .816 LEA14 .735 LEA15 .837 LEA16 .786 LEA17 .608 PRO18 .763 PRO19 .870 PRO20 .794 WOR21 .535 WOR23 .501 ACH24 .763 ACH25 .778 ACH26 .797
Extraction Method: Principal Component Analysis. Rotation Method: Varimax with Kaiser Normalization. a. Rotation converged in 7 iterations.
After the inappropriate variables were removed, the components of factors affecting satisfaction of staff are measured by 23 observation variables. Exploratory Factor Analysis
EFA results at third round showed that total variances extracted from 6 factors that have Eigenvanlues greater than 1 is equal to 73.378%, which showed that extracted variance met
requirement (> 50%).
Table 4.6 Exploratory Factor Analysis 3st
Rotated Component Matrixa
Component 1 2 3 4 5 6 JOB01 .803 JOB02 .821 JOB03 .718 JOB04 .698 SAL06 .810 SAL07 .795 SAL08 .726 SAL09 .727 COL11 .752 COL12 .834 COL13 .832 LEA14 .737 LEA15 .836 LEA16 .788 LEA17 .607 PRO18 .764 PRO19 .873 PRO20 .794 WOR21 .532 WOR23 .509 ACH24 .767 ACH25 .780 ACH26 .794
Extraction Method: Principal Component Analysis. Rotation Method: Varimax with Kaiser Normalization. a. Rotation converged in 7 iterations.
Jobs Salary Colleague.working condition Satisfaction Leaders Promotion Achievement acceptance H1 H2 H3.6 H7 H4 H5
For the table 4.6, we can say that 7 components of factors affecting satisfaction of staff Binh Duong Departmemt of Taxation initially after analysis the remaining 6 factors to explain
Satisfaction in the current period. With total extracted variance is 73.378%, which concludes that the factors explain probably 73.378% variation in data.
4.4 Official research model
For Exploratory Factor Analysis method, the research model describes the elements affecting to satisfaction of faculty members as follow:
Figure 4.1: The research model studying factors affecting Satisfaction staff Binh Duong Department of Taxation
The H1, H2, H4, H5, H7 hypothesis are kept as initially.
H3.6: Working condition - Colleague positive relationship with satisfaction of staff
From the results of factor analysis was conducted to explore the values of the new variables as follows:
JOB = Mean (JOB01, JOB02, JOB03, JOB04)
SAL = Mean (SAL06, SAL07, SAL08, SAL09)
COL_WOR = Mean (COL11, COL12, COL13, WOR21, WOR23)
LEA= Mean (LEA14, LEA15, LEA16, LEA17)
PRO = Mean (PRO18, PRO19, PRO20)
ACH = Mean (ACH24, ACH25, ACH26)
4.5. Testing research model through regression method
After testing scale by Cronbach Alpha and EFA, we have identified 7 factors affecting to Satisfaction of faculty member.
Before going into our regression analysis tested the correlation between the variables
4.5.1. Testing correlation between the variables
The first step that analyzes linear regression is view the relationship of linear correlation between the dependent variable and each of independent variables and between independent variables. If correlation coefficients between independent variables and dependent variables are large, linear regression analysis is probably appropriate. On the other hand, if the correlation between independent variables is large, multicollinearity will be able to occur in
Table 4.7 Correlation matrix between the variables:
Correlations
SAT JOB SAL COL.WOR LEA PRO ACH
SAT Pearson Correlation 1 .574** .593** .620** .509** .402** .427** Sig. (2-tailed) .000 .000 .000 .000 .000 .000 N 165 165 165 165 165 165 165 JOB Pearson Correlation .574** 1 .504** .542** .371** .221** .329** Sig. (2-tailed) .000 .000 .000 .000 .004 .000 N 165 165 165 165 165 165 165 SAL Pearson Correlation .593** .504** 1 .596** .412** .162* .522** Sig. (2-tailed) .000 .000 .000 .000 .038 .000 N 165 165 165 165 165 165 165 COL.W OR Pearson Correlation .620** .542** .596** 1 .519** .424** .488** Sig. (2-tailed) .000 .000 .000 .000 .000 .000 N 165 165 165 165 165 165 165 LEA Pearson Correlation .509** .371** .412** .519** 1 .431** .439** Sig. (2-tailed) .000 .000 .000 .000 .000 .000 N 165 165 165 165 165 165 165 PRO Pearson Correlation .402** .221** .162* .424** .431** 1 .257** Sig. (2-tailed) .000 .004 .038 .000 .000 .001 N 165 165 165 165 165 165 165 ACH Pearson Correlation .427** .329** .522** .488** .439** .257** 1 Sig. (2-tailed) .000 .000 .000 .000 .000 .001 N 165 165 165 165 165 165 165
**. Correlation is significant at the 0.01 level (2-tailed). *. Correlation is significant at the 0.05 level (2-tailed).
This matrix shows that the correlation between the satisfaction variables – SAT (dependent variable) for each independent variable, as well as the correlation between the independent
variables. The correlation coefficients between the variables are highly (> 0.4) the lowest variable - PRO = 0.402. Preliminary view, we can conclude that the independent variables
(JOB, SAL, PRO, LEA, COL_WOR, ACH) can be mounted in the model to account for the variables, which is appropriate because the value of Sig. were small (<0.05).