利用分群分析香菇菌種類源與多醣結構的特色及利用多樣統計分析香菇多醣結構與巨噬細胞活性關係之研究
126
0
0
全文
(2) 利用分群分析香菇菌種類源與多醣結構的特色及利用多 樣統計分析香菇多醣結構與巨噬細胞活性關係之研究 Elucidation of Strains Grouping and Polysaccharide Structural Features by Cluster Analysis and the Relationships of Polysaccharide Structure-Macrophage Stimulatory by Various Statistical Analyses on Ten Regionally Different Strains of Lentinula edodes. 研 究 生:羅千婷. Student:Tiffany Chien-Ting Lo. 指導教授:張正. Advisor:Cheng Allen Chang. 國 立 交 通 大 學 生 物 科 技 學 系 博 士 論 文. A Thesis Submitted to Department of Biological Science and Technology College of Biological Science and Technology National Chiao Tung University in partial Fulfillment of the Requirements for the Degree of Doctor in Biological Science and Technology May 2007 Hsinchu, Taiwan, Republic of China. 中華民國九十六年五月.
(3) 中文摘要 本研究利用深層培養十株不同的香菇菌種,將菌種培養至靜止期後萃取其發酵濾液 中的多醣體進行單醣組成、分子量分布、結構型態、免疫調節活性及抗腫瘤活性的測定。 測定出十株菌種的多醣體皆為α-(1→4)-glucan 鍵結β-(1→6)-glucan 複雜巨分子,分 子量分布在 1x10² 至 3x10³ kDa,並且各由不同比例的七種單醣所構成,包括了:葡萄 糖、甘露糖、木糖、半乳糖、黑藻糖、鼠李糖及阿拉伯糖。由於固態的多醣體具有不易 回溶水的特性,因此我們開發以超臨界流體系統之高壓水方式,在 10.1MPa、28°C、70 分鐘的條件下提升多醣體的回溶率可達 90%,而且此萃取方法依然能保α-(1→4)-glucan 鍵結β-(1→6)-glucan 的結構及其生物的活性。我們也發現α-(1→4)-glucan 鍵結 β-(1→6)-glucan 多醣體亦能引發 RAW264.7 巨噬細胞的細胞與細胞間之訊息傳遞。 另外,以多變量迴歸分析十種多醣體中單醣組成與 RAW264.7 巨噬細胞活性的關聯 及建立結構-活性預測模式;以主成分分析法和因素分析法探就出阿拉伯糖、甘露糖、 半乳糖及黑藻糖為多醣結構中的組成特色。最後再利用擴增片段長度多形性分析菌種的 類源及利用統計的群集分析醣鍵結的構型關係,進一步比較基因分群與結構分群的相同 或相異之處。多醣體的結構與其引發的生物活性相當複雜,我們的研究結果能助於開啟 醣類資訊學的新興研究的方法,也能有助於簡化醣類領域的複雜問題。. i.
(4) Abstract In this research, we have made major efforts to isolate polysaccharides from the submerged cultures of ten different strains of Lentinula edodes and have determined their monosaccharide compositions, molecular weights, structural linkage types, immuno-modulating and anti-cancer activities. The isolates had a molecular weight distribution between 1x10² and 3x10³ kDa. The monosaccharide composition analysis revealed that these polysaccharides were heterogeneous and contained glucose, mannose, xylose, galactose, fucose, rhamnose and arabinose in different ratios. A major form of polysaccharide linkage with a backbone of α-(1→4)-glucan and side chains of β-(1→6)-glucan has been identified. A method using the pressurized water extraction (PWE) technique (10.1 MPa, 28 °C, 70 min) to improve the extraction efficiency and to retain the general structures and bioactivities of the polysaccharides has also been developed. These polysaccharides were also found to stimulate macrophage cell-cell interactions. The use of multiple linear regression analysis allows the deduction of the correlation between the monosaccharide composition ratios and in vitro macrophage (RAW264.7) stimulatory activities of polysaccharides obtained from different mushroom strains. Arabinose, xylose, mannose, fucose and galactose were identified as the monosaccharides that could be related to macrophage stimulatory activities. In addition, principal component analysis and factor analysis methods were used to find ii.
(5) polysaccharide. structural. characteristics. of. these. L.. edodes.. Furthermore,. investigations by amplified fragment length polymorphism analysis (AFLP) and by statistical cluster analyses of GC-MS linkage data were compared to understand the relationships of genotypes and structural features of these species. The structures and biological activities of these polysaccharides were quite complex and remained to be delineated in the future at the molecular level. The novel feature of using statistical methods to treat limited but complex experimental data in this work represents a new approach in the bioinformatics area and allows the simplification of research problems in the glycobiology field.. iii.
(6) Acknowledgements I would like to convey my gratitude to the following, for their guidance and assistance during the period of my Ph. D. degree. Professor C. Allen Chang and Bor Cheh Wang, for their ideas, constructive criticisms and discussions. The committee members: Rong Long Pan, Ph.D., Anne Lien Ju Chao, Ph.D., Maw Rong Lee, Ph.D., Ting Jang Lu, Ph. D., Chiun Jye Yuan, Ph. D., Chih Sheng Lin, Ph. D., C. Allen Chang, Ph.D., and Bor Cheh Wang , Ph.D., for their encouraging and understanding. This study was supported by the Bioresources Collection & Research Center, Food Industry Research and Development Institute, Hsinchu, Taiwan ROC. I wish to express my thanks to the staff at Bioresources Collection & Research Center Lab for their help and my classmates: Chi Feng Tseng, Ching Ting Lin, Ying Jung Huang and Kuo Ling Ho, for their true friendship. Finally, I would like to express my sincere thanks to my parents, families and husband, for supporting me to get where I am today.. iv.
(7) Contents 中文摘要..............................................................i Abstract..................................................................ii Acknowledgements........................................................iv Contents..................................................................v Ⅰ. Introduction............................................................1 Ⅱ. Materials and methods..................................................10 PARTⅠ Polysaccharide Composition, Structure, In Vitro Immuno-Modulating and Anti-tumor Activities of Some Regionally Different Strains of Lentinula edodes 1. Abstract............................................................25 2. Results and discussion...............................................26 3. Conclusion..........................................................37 Tables Part Ⅰ.........................................................39 Figure Captions.........................................................40 Part Ⅰ...........................................................43 PARTⅡ Pressurized Water Extraction of Polysaccharides as Secondary Metabolites from Lentinula edodes 1. Abstract...............................................................54 2. Results and discussion..................................................55 3. Conclusion.............................................................61 Tables Part II....................................................................63 Figure Captions........................................................66 Part II....................................................................67. v.
(8) PARTⅢ Use of Statistical Methods to Find the Polysaccharide Structural Characteristics and the Relationships between Monosaccharide Composition Ratio and Macrophage Stimulatory Activity of Regionally Different Strains of Lentinula edodes 1. Abstract...............................................................70 2. Results and discussion..................................................71 3. Conclusion.............................................................74 Tables Part III...................................................................76 Figure Captions...........................................................78 Part III...................................................................79. PARTⅣ Glycosyl Linkage Characteristics and Classifications of Exo-polysaccharides of Some Regionally Different Strains of Lentinula edodes by Amplified Fragment Length Polymorphism Assay and Cluster Analysis 1. Abstract...............................................................81 2. Results and discussion..................................................82 3. Conclusion.............................................................90 Tables Part IV...................................................................92 Figure Captions...........................................................94 Part IV...................................................................95. Summary and Future Research Directions...................................100 References..............................................................102. vi.
(9) Ⅰ. Introduction Lentinula edodes Mushrooms such as rieshi (Ganoderma lucidum), shiitake (Lentinula edodes.) and others have been cultivated and used for many years (1). More than 140,000 different kinds of species, i.e. roughly 10% of available species on earth have been identified (2). They have been valued as flavorous and nutritious foods as well as precious medicines, e.g. as immune-modulators, in the Far East. Among them, the shiitake mushroom, Lentinula edodes (L. edodes) is the most important cultivated mushroom and is easily available from Korea, Russia, Taiwan, China and Japan (3, 4). Of all the mushroom immune-modulators investigated, bioactive polymers from L. edodes have been studied the most (5). More than 100 cultivated shiitake strains have been developed. Traditional methods to differentiate various strains typing in shiitake cultivars were usually carried out based on morphological, physiological, and somatic compatibility characteristics (6). Recently, additional molecular techniques were developed. For example, Vos et al. (7) developed AFLP (amplified fragment length polymorphism) fingerprinting analysis based on selective polymerase chain reaction (PCR) amplification of genomic DNA restriction fragments and demonstrated that AFLP analysis could reproducibly help identifying a large number of polymorphic loci to differentiate various. 1.
(10) strains (7). Applications of AFLP analysis (fingerprinting) for population studies have become quite popular and important, and have been reported frequently (8, 9). The technique could successfully differentiate not only the diversity in flowering plants populations but also a wide variety of organisms (10, 11, 12). For example, AFLP marker techniques have been successfully used to derive the genetic linkage map of L. edodes for frozen material and heat dried fruiting bodies (13, 14). Polysaccharides attract immunomodulatory activities The basic composition of mushrooms includes vitamins, minerals, phenolic compounds, total carbohydrates, dietary fiber, nitrogen, and protein that vary considerably in different strains (15, 16). According to Crisan et al. and Bano et al., the carbohydrate contents of L. edodes varied from 67.5% to 78% on a dry weight basis (17, 18). The carbohydrates in mushrooms include polysaccharides such as glucans, mono- and di-saccharides, sugar alcohols, glycogen, and chitin (19). Of all, β-glucan has been identified as the major structural component among many polysacchaides with anti-cancer activities (20). For example, Lentinan (extracted from cell wall of fruiting body), KS-2 (a α-mannan peptide extracted from culture mycelia) and LEM (a β-glucan-protein complex extracted from solid medium) of L. edodes are demonstrated to be immuno-potentiators and exhibit anti-cancer activities (21-24). Mueller et al., (25) have reported that binding of glucans to macrophage and. 2.
(11) neutrophil cell lines resulted in stimulation of the expression of nuclear factor-κB (NFκB). The structural elucidations for Lentinan show the presence of only glucose molecules with mostly β-(1→3)-glucan linkages in the regularly branched backbone and β-(1→6)-glucan in side chains (26, 27). The major active constituent of the KS-2 mycelium extract is reported to be a hetero-glycan protein conjugate containing ca. 24.6% protein and 44% monosaccharide in addition to nucleic acid derivatives and vitamins (28). Simultaneously, many other active polysaccharides, proteinpolysaccharide conjugates and water-soluble lignin’s were isolated (29). However, the reported structures are varied and include α-glucans as well as many hetero-glucans (30-32). Shida et al. reported the extraction of α-(1→3)-D-glucan from fruiting bodies of L. edodes (33, 34). However, not much attention was paid to the properties of this form of glucan. Rather, modified polysaccharides such as those by sulfation, sulfonylation or carboxymethylation that showed high anti-cancer activities gained rapid attention and wide scale applications in recent years (8, 35-37). Specifically, α-glucan and modified α-glucan (e.g. as sulfate) of L. edodes were demonstrated to show anti-cancer activities against Sarcoma 180 (in vivo) and against six tumor cell lines (in vitro, 38). In some cases, unmodified α-glucan failed to inhibit in vitro tumor growth (38).. 3.
(12) The studies on the structure-activity relationship and diversity of glucans mediated immuno-pharmacological activities have since gained momentum (4, 23, 39, 40). The pharmacological activities of mushroom polysaccharides against tumors have been thoroughly reviewed (41). The preliminary anti-cancer mechanisms of whole mushrooms and isolated polysaccharides are proposed to involve the intervention of macrophages and ‘T’ cells (42). TNF-α (tumor necrosis factor, a pro-inflammatory cytokine) is then released from macrophages or activated ‘T’ cells in response to microbes or other agents (43). The detailed mechanisms by which these polysaccharides compounds exert their anti-cancer effects remain largely unexplored despite the established vital role of glucans. We have selected ten regional different L. edodes and determined the monosaccharide composition, molecular mass distribution,. structural. linkages. and. macrophage-stimulating. and. of. their. polysaccharides extracts, hoping to add new and more insights to this important research area. Extraction of polysaccharides The isolation of solid polysaccharides from various sources remains as a major problem because they are heterogeneous with low water solubility and the water extraction yield was normally quite low. In our experience, the boiling water extraction (BWE) of the polysaccharides was usually lower than 30% of the obtained crude. 4.
(13) products (4, 44-46). Because the submerged cultivating process of L. edodes is rather time-consuming and normally takes several weeks, it is always necessary to optimize the polysaccharides extraction yield for further research and application purposes. Extractions of polysaccharide from mushrooms with boiling water, sodium hydroxide, ammonium oxalate and pulsed electric field were also reported for improving efficiency (44, 47). However, the structures and bioactivities of a number of polysaccharides extracted under these conditions were not compared before and after the extractions. On the other hand, extractions with supercritical fluids at high pressures have been demonstrated to be quite useful for many food and biological samples (48-53). The few reports were published on the use of pressurized water extraction (PWE) for polysaccharides from L. edodes. We reported that the PWE method could improve the extraction efficiency and could retain macrophage stimulating activity of the polysaccharides. Glyco-informatics Different strains of higher Basidiomycota mushrooms are known to produce biologically active polysaccharides with different properties and chemical structures. The structures include mainly glucan and glycan normally synthesized biologically to form tree structures with various types of branched linkages (54). Glucan and glycan play key roles in cell communication, protein interaction and immunity. Various. 5.
(14) monosaccharides form the nodes of the tree structures and with glycosidic bonds leading to branched linkages. For each monosaccaride there are six possible hydroxyl groups for linkage formation and two possible anomality ‘α’ or ‘β’ could result (55). Polysaccharides isolated from the different strains of Poria cocos mycelia showed different in vivo and in vitro anti-tumor activities, depending on their monosaccharide composition, molecular mass, and chain conformation (56). In the research, we reported the monosaccharide composition, molecular mass, structural linkage, immuno-modulating and anti-tumor activities for polysaccharides extracted from different phylogenetic groups of ten regional L. edodes (57). The immuno-modulating properties and anti-tumor activities of these L. edodes extracts were tested and the results showed that the ten isolated L. edodes could be classified into three distinct groups using amplified fragment length polymorphism assay. All polysaccharides had similar molecular mass distribution between 1x10⁴ and 3x10⁶. The monosaccharide composition analysis revealed the presence of heterogeneous materials containing glucose, mannose, xylose, galactose, fucose, rhamnose and arabinose in different ratios. Most of the extracts exhibited significant enhancement in macrophage stimulatory activities (MSA). However, although several studies were reported concerning the immunological activity and structure of polysaccharides (mostly β-glucan) in regionally different L. edodes, the determining factors for the. 6.
(15) structure-function relationships remained unsolved. Many methods in applied mathematics and statistics are often used to summarize and/or simplify complex data and help deducing relationships among variables. Regression analyses have been broadly employed to predict sources or structure-function relationship in biological sciences. Examples include the utilize of regression analyses to predict the distribution of tree and shrub species, terrestrial animal species (58), drug discovery (59), and culture conditions of L. edodes (60). However, for different areas and/or at different resolutions, it may be difficult to compare the results of these methods (58). A simple linear regression analysis of monosaccharide (arabinose, mannose and xylose) contents in sediments was applied to determine the sources of carbohydrates (61). In addition, principal component analysis and factor analysis could be constructive in describing and classifying different functional or structural groups, for the measure of glycan structures taking into account of species, for the exploration of molecular structural characteristics, for the evaluation of the polysaccharide composition in lignfied woody plant cell wall, for the evaluation of molecular lipophilicity, for the understanding of organic reaction mechanisms, for quantitative structure-retention studies in chromatography, for quantitative structurebiodegradatoion relationship, and for classification of drug-free subject and drug. 7.
(16) abuses groups employ the metal contents in hair samples (54, 59, 62). For example, Hori et al. used a combination of FT-IR microscopic techniques and principal component analysis method to investigate the chemical variations between softwood species as well as types of wood cell walls (63). Hizukuri et al., applied the principal component analysis to the composition data and found that the compositions of mannose, xylose and arabinose were important characteristics that distinguished the difference between yeast, sycamore and wheat (55). To the best of our knowledge, there have been few reports applying more than one statistical methods for a comprehensive analysis of experimental data to deduce polysaccharide structurefunction relationship, particularly when the amount of data are limited (59). The relationship of genotypes and structural features of these species In particular, the glycosyl linkages, formed by various monosaccharides at the nodes of the polysaccharide tree formations, would reveal essential structural information and have been mostly elucidated by gas chromatographic and mass spectrometric (GC-MS) techniques. However, the analyses of these linkage data are sophisticated, usually incomplete and difficult, at least because of the following reasons: (1) most polysaccharides are heterogeneous with high molecular weights, (2) there are many combinations of linkage types between any two monosaccharides, and (3) there is a lack of a complete set of standard materials of all linkage types that. 8.
(17) could be used as reference standards. Recently, mathematical and statistical methods have been applied to help understand the monomer composition of polysaccharide characteristics of woody plants and to establish polysaccharide classifications of Vochysiaceae (63, 64). Multiple linear regression analysis, principal component analysis and factor analysis methods have also been used to find the polysaccharide structural characteristics and their relationships with macrophage stimulatory activity of regionally different strains of L. edodes (65). Among these statistical methods, cluster analysis could be employed to measure strain similarities if some experimental variables (i.e. glycosyl linkages) are potentially highly correlated (64). Cluster analysis is a generic name for multivariate analysis techniques to create groups of objects based on their degree of association (66). Clustering is useful in several exploratory pattern-analysis, grouping, decision-making and machine-learning situations, including data mining, document retrieval, image segmentation, and pattern classification (67). In this research, we applied cluster analysis to classify GC-MS likage data. We wish to report the equivalent or difference between the genotypes grouping and glycosyl linkages classification from ten regionally different L. edodes.. 9.
(18) Ⅱ. Materials and methods Strains, media, and growth conditions. The ten strains of L. edodes are: No.135 (L24) and No.939 (L25) from China, Tainung No. 1 “white cap” (L1) and”red cap” (L4) from Taiwan, Japanese 271 (L11, L15), Jongxing 5 (L6), Jongxing 8 (L10), Hey-King-Gang (L21) and Jong-Wen 600 (L23) from Japan. The culture growth conditions were optimized by first incubating the mushroom (L11) for 3, 5, 7, 12, 14, 17, 19, 21, 24, 26, 28 and 31 days at 26℃. The culture broth of L. edodes was obtained from medium (pH 4.5) containing 2% oat, 0.5% yeast extract, 0.1% KH2PO4, 0.05% MgSO4, 0.15% CaCO3, at 26℃ and reciprocating shaking (150 rpm/min) and fermented for 14 days. The cultivation developed in the flasks was transferred to static incubation. The liquid was filtered (Membrane filter pore size >0.45 μm), to collect the culture broth filtrate (CBF) and then passed through the autoclave. The mycelia pellets were collected and washed with distilled water. The mycelia pellet dry weight was determined by drying in an oven for 7 days at 60℃.. Polysaccharides isolation. The CBF was added to three volumes of 95% ethanol and stored at 4℃ overnight. The precipitate was collected by centrifugation, followed by washing with. 10.
(19) 75% ethanol, and then freeze-dried to obtain a culture precipitate. The crude polysaccharide is treated with boiling water to prepare a BWE that was filtered (Milli-pore, 0.22 μm) and collected (>molecular mass 10,000 Da fractions) of for immunoassay and freeze-dried for further analyses.. Amplified fragment length polymorphism analysis (AFLP). Mycelia were harvested onto filter paper, rinsed with distilled water, and freeze-dried. Genomic DNA for each progeny was extracted by use of the DNeasyTH Plant Mini Kit (Qiagen, Hilden) and DNAs were eluted twice from the DNA binding column with 100 μl AE (50 mM NaAcetate pH 5.2, 10 mM EDTA) solution. AFLP analysis was carried out adopting modification of the procedure described by Vos et al., (7), Terashima et al., (13) the instruction manual of the AFLP core Reagent Kit (Invitrogen), and the AFLP Microbial Fingerprinting Kit (Applied Biosystems). Electrophoresis and detection of amplified fragments were performed using the 373 DNA Genetic Analyzer (Perkin Elmer). Each gel track ranged from the size-marker 50 bp band to the 500 bp band. Patterns were normalized with reference to molecular mass of the internal ROX-labeled size standard that was added to each sample. After normalization, the levels of genetic similarity between the AFLP patterns were calculated with Pearson correlation. For cluster analysis of AFLP banding patterns,. 11.
(20) the un-weighted pair group method applying arithmetic averages (UPGMA) was used (68). Internal standards of L. edodes strains employed are BCRC 36024 (CBS 454.69, IFO 8340) and 36482 (MUCL 28773). Phylogenetic grouping was performed using Bio Numerics software.. Molecular mass determination. The molecular mass fractions of CBF extract was determined utilizing a gel-chromatographic technique with H2O (0.3 ml/min) as a mobile phase (Waters Hsp-Gel AQ5.0, Waters 1515 isocratic pump, 717 plus injector and 2410 RI detector). The calibration curve was constructed with standard dextrans (Polymer Standards Service) within the range of molecular mass from 180 to 2,100,000 Da. Four distinct fractions were identified and labeled as A, B, C, and D, accordingly. L15 BWE or PWE was injected into the gel-permeation chromatograph column (Mix D column, PL Aqua-gel-OH), mobile phase being H2O, and collected five different fractions- A, B, C and D (and E), applying the same fraction collector as described for CBF extraction.. Monosaccharide composition. Monosaccharide analysis was performed usage the method of Blakeney and Hoebler (69, 70). The Polysaccharides from CBF (2 mg) were completely hydrolyzed. 12.
(21) in a sealed tube with 0.3 ml of 2 M trifluoroacetic acid (TFA) at 120℃ for 90 min to convert the monosaccharides into alditol acetates. The amounts of neutral monosaccharides in the polysaccharides were analyzed as alditol acetates by gas chromatography (GC, Varian 3800). Myo-inositol (1 mg) was added as an internal standard. The amounts of neutral monosaccharides (polysaccharides contents) were determined using the phenol-sulfuric acid method (14, 71, 72).. Structure analysis. In order to determine the functional group of the most immunological active strain, crude polysaccharides or BWE were further characterized using FTIR (all strains) and NMR (L15) spectroscopic techniques. The glycosyl linkage composition was analyzed using gas chromatography (all strains). The FTIR spectra were obtained from 1 mg of crude polysaccharides in 100 mg of KBr. Twelve scans were accumulated with a resolution of 2 cm-1 in the range 500-1800 cm-1 (Jasco 8900) (73-75). Glycosyl linkage composition analysis was carried out by taking 1 mg of crude polysaccharides that were methylated using the modified NaOH-DMSO (dimethyl sulfoxide) method (13, 73, 75, 76). The per-methylated products were hydrolyzed, reduced, acetylated and then analyzed by GC-MS (HP 6890/MSD 5973) at 25℃.. 13.
(22) The 1H,. 13. C NMR and DEPT (Distortionless Enhancement by Polarization. Transfer) experiments were recorded at 600 and 150 MHz respectively, on a Bruker DMX-600 spectrometer (71, 73, 77). The exchangeable proton in BWE residue was exchanged with deuterium by adding sufficient D2O (99.96% atom2H, Aldrich). The 1H and. 13. C NMR spectra were recorded at 25℃. Methanol was used as an internal. standard (δ 49 ppm) for the. 13. C spectrum. The 1H NMR spectrum was recorded by. adjusting the HOD signal at δ 4.68 ppm. 2D-NMR experiments (COSY and HSQC) were performed by using the standard XWIN-NMR 3.5 software.. Macrophage stimulating activity assay. The O2- production of macrophage cell line (Mouse BALB/C macrophage, RAW 264.7) was measured by a modified nitroblue tetrazolium (NBT, Sigma) reduction assay. The RAW 264.7 was cultured in Dulbecco’s modified Eagle’s medium (DMEM, Gibco) containing 10﹪fetal bovine serum (FBS, Hyclone). Macrophage cell lines were placed into wells of a 96-well microtiter plate (2.5 x 10⁵ per well) and were treated with 20 μl of polysaccharide extracts for 48 h at 37℃. After removal of the supernatant, the macrophage cell line monolayer was covered with 100 μl of 2 mg ml-1 of NBT. The plates with stimulated cells were incubated for 4 h at 37℃. The reduced formazan within macrophage cell line was solubilized in DMSO (Merck). Optical density was. 14.
(23) measured using an ELISA reader at 570 nm (78, 79). L. edodes culture medium was used for control experiments and PBS (phosphate-buffer saline) as blank solution for optical density experiments. The % NBT reduced is estimated utilizing the equation: {[(Sample Average) – (Blank Average)] / [(Control Average) – (Blank Average)]}x100.. Preparation of ‘T’ cell. T-cell line (J45.01, Human acute ‘T’ cell) was placed into wells of a 96-well microtiter plate (9 x 10³ per well) and was treated with 20 μl of CBF for 72 h. The determination of 3-(4,5-dimethylthiazol-2yl)-2,5-diphenyltetrazolium bromide (MTT) was performed by a colorimetric assay as described in Tada et al., 1986 (80).. TNF-α release activity. The ability of CBF of L. edodes strains L15 and L23 to stimulate production of tumor necrosis factor-α (TNF-α) by mouse BALB/C macrophage cell line (RAW 264.7) was investigated. The RAW 264.7 cells were cultured in DMEM containing 10﹪FBS. Macrophage cell lines were placed into wells of a 24-well microtiter plate (2.5 x 10⁵ per well) and stimulated with or without CBF (negative control) or lipo-polysaccharide (Sigma, 10 μg/ml) for 5 to 24 h in a humidified 5% CO2, 37℃ incubator. After incubation, culture supernatant was collected by centrifugation and measured using a. 15.
(24) TNF-α Kit (Entogen) in ELISA system (MRX, Dynex). The control experiments were conducted usage PBS (Dulbeccos, Ca2+/Mg2+ free, D-PBS, GibcoBRL 21600-010). The positive control assay was conducted using lipo-polysaccharide.. Direct anti-cancer activity assay. Normal cell line (MRC-5) of human embryonal lung cell-density of 3 x 10³, human cervical carcinoma cancer cell line (Hela), cell density of 1.5 x 10³, human gastric cancer cell line (AGS), cell density of 3 x 10³ per well, human hepatocellular carcinoma cell line (Hep G2), cell density of 3 x 10³ per well, human breast cancer cell line (MCF-7), cell density of 3 x 10³ per well were placed into wells of a 96-well microtiter plate and were treated with 20 μl of CBF (all strains) or HWE (L15 only). The plates with stimulated cells were incubated for 72 h at 37℃. MTT solution was prepared in PBS at 5 mg/ml concentration. This MTT solution (20 μl) was added to each well. It was further incubated for 4 h. Thereafter, the supernatant was aspirated carefully from each well, and the formazan crystals were dissolved in DMSO (Merck). Optical density was measured using ELISA reader at 540 nm. Then the % viability was calculated in comparison to control, taking control (culture L. edodes medium) as 100% viable.. 16.
(25) Indirect anti-cancer activity assay. Macrophage cell lines (RAW 264.7) were placed into wells of a 96-well microtiter plate (2.5 x 10⁵ per well) and were treated with 20 μl of CBF (L15, L10, L21 and L23) or L. edodes culture medium for 48 h. After incubation, culture supernatant was collected by centrifugation and then added (20 μl/well) to MRC-5, Hela, AGS, Hep G2 and MCF-7 contained in 96-well microtiter plates. The entry with L. edodes culture medium was used as control that contained only the cells. The plates with stimulated cells were incubated for 72 h at 37℃. The MTT solution prepared in PBS at 5 mg/ml concentration was added (20 μl) to each well. Culture macrophage medium is the control. Further analysis was carried out as described in anti-cancer activity for MTT colorimetric assay. The resulting data of all the above experiments are presented as a mean (S.D. from triplicates).. Cell-cell communication assay. Macrophage cell lines were placed into wells of a plate (2.5 x 10⁵ cells/ml) and were treated separately with 100 μl of PBS as a control, LPS (10 μg/ml) as a positive control, and L15 polysaccharides (1.5 mg/ml) as test sample. They were then incubated for 24 h at 37°C. Cell-cell communication of macrophage was measured. 17.
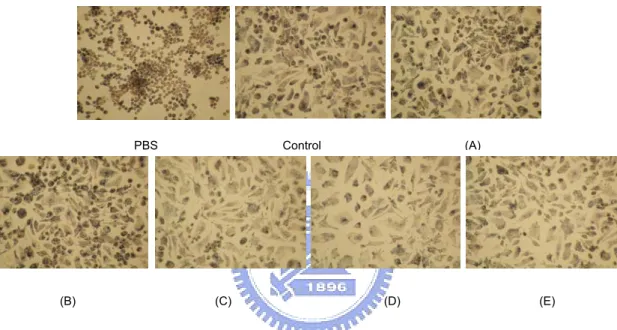
(26) applying the scrape loading dye transfer technique. The fluorescent dye Lucifer yellow (Sigma), Dissolved in PBS, was added the cells (RAW 264.7). After incubation the cells were washed with PBS to remove extracellular dye. Dye migration was observed and digitally photographed at 200× using Nikon eclipse TE 2000-s microscope.. Pressurized water extraction. The crude polysaccharides were then treated with pressurized water (ISCO, 260D) at different pressures and time periods to obtain the PWE products. Normally, 35 mg crude polysaccharides were added to each extraction cell (10 ml). The effects of the two factors, i.e. pressure and time, were investigated in the ranges of 2.5-25.3 MPa and 10-80 min at 28°C. The PWE polysaccharides were filtered (Milli-pore, 0.22 μm) for immunoassay and the residues were dried to determine recovery yields. The BWE polysaccharides obtained at 0.1 MPa for 40 min were used for control experiments (81). The data of the above experiments were presented as a mean and relative standard deviation (R.S.D. %) of three replicate measurements.. Macrophage morphology. Macrophage cell lines were placed into wells of a microtiter plate (2.5 x 10⁵ cells/ml) and were treated separately with 100 μl of PBS (10 μg/ml) as a blank,. 18.
(27) lipopolysaccharide (LPS, 10 μg/ml, Sigma) as a positive control, and BWE and PWE polysaccharides (10.1 MPa, 70 min). They were then incubated for 24 h at 37°C. After decanting the supernatant, a cell culture medium (DMEM) was added at the end of incubation. The macrophage morphologies were observed utilizing differential interference contrast (DIC) microscopy (Leica DMRXA, photo CCD-Leica DC500).. Multiple linear regression analysis (MLRA). Multiple linear regression analysis was conducted similarly to a previous reported paper with minor modifications (58). With a multiple regression model, the relationship is described using a generalization of a straight line equation (equation 1): Y=β0+β1X1+β2X2+…...+β pXp+ e. (1). where Y denotes the response variable (NBT reduction value), β0 is a constant (intercept), X1, X2, …,Xp. is a vector of p predictor variables (monosaccharide. composition value), β1, β2, …, βp is the vector of p regression coefficients. Each predictor variable has its own coefficient, and the outcome variable is predicted from a combination of all the variables multiplied by their respective coefficients plus an error term. The relationship was determined using the least square fitting technique. A residual analysis was applied to check the model fitting (82). MLRA was performed utilizing the computer software-Statistical Package for the Social Sciences (SPSS). 19.
(28) and S-PLUS.. Principal component analysis (PCA). Principal component analysis was used to transform a number of potentially correlated variables (descriptors) into a number of relatively independent variables that could be ranked based upon their contribution for explaining the variation of the whole data set (59). Based on this method, the relatively important components of high-dimensional pattern could be successfully identified. Thus, the original high-dimensional data could be mapped onto a lower dimensional space, and therefore the complexity of a high-dimensional pattern classification problem is substantially reduced (54). For a random vector x, where x = (χ1,…, χn)T. (2). the mean of the random vector is denoted by. μ x = Ε{x}. (3). and the covariance matrix of the same random vector is Cx = Ε{(x-μ x) (x-μ x)T}. (4). The components of Cx, denoted by C ij, represent the covariances between the random variable componentsχi andχj. The component Cii is the variance of the. 20.
(29) component χi. The variance of a component indicates a measure of spread of the component values around its mean value. If two componentsχI andχj of the data are uncorrelated, then their covariance is zero (Cij = C ji=0). The covariance matrix is, by definition, always symmetric. From a sample of vectors X1,…..,XM, the sample mean and sample covariance matrix can be calculated to estimate the mean and the covariance matrix respectively. From a symmetric matrix such as the covariance matrix, an orthogonal basis can be calculated by finding its eigenvalues and eigenvectors. The eigenvectors ei and the corresponding eigenvalues λi are the solutions of the equation (83): C x ei =λi ei, i=1,.., n. (5). For our present study, data matrix consisted of the monosaccharide compositions of ten strains of L. edodes and pattern recognition based on PCA was performed using the SPSS (59, 62, 82).. Factor analysis (FA). Factor analysis was applied to describe the correlation among several variables in terms of a few quantities, i.e. factors. FA and PCA are two different approaches to analyze the correlation structure of a set of real valued random variables. In practice, it is often observed that the results of FA are very close to those of PCA. These two. 21.
(30) approaches are strongly related to each other (84). FA uses an estimate of common variance among the original variables in order to generate the factor solution. A factor is the linear combination of original variables. The number of factors will always be less than the number of original variables (59). The aim of FA is to summarize the correlation structure of observed variables X1,X2...,Xp. For this purpose one constructs k < p unobservable or latent variables f1,..,fk, which are called the factors, and which are linked with the original variables through the equation for each 1 ≤ j ≤ p. Xj = λj1f1 +λj2f2 +…….+λjkfk + εj. (6). The error variables ε1,..,εp are assumed to be independent, but they have specific variances ψ1,.., ψp. The coefficients, λjl, called factor loadings, are elements of the matrix of loadings Λ (85). Factor analyses to evaluate relationships between different strains and monosaccharide compositions were also carried out using SAS (59, 86).. Cluster analysis. Cluster analysis methods were applied to investigate the relationships between types of glycosyl linkages (using the relative GC-MS abundance data) and L. edodes strains. The relative abundances of all glycosyl linkages in the ten samples were normalized to the myo-inositol internal standard of the L1 sample and were used for. 22.
(31) later cluster analysis (59). Two key steps are involved in cluster analysis. The first is the measurement of the object similarity based on the Euclidean distance or Manhattan distance between objects (67). The second is to group the objects based upon the resulted distances (linkages). Linkage methods are based upon how the association between groups is measured. The Euclidean distance (DEucl.) between any two objects xi and yi was probably the most commonly chosen type of distance and in the multidimensional space was computed as below: DEucl. (x,y) = {Σ (xi - yi)2 }½. (1). This method has certain advantages, e.g., the distance between any two objects is not affected by the addition of new objects to the analysis, which may be outliers. The Manhattan distance (DMann.) is simply the average differences across dimensions. In most cases, the results of these distance measurements are similar to those of simple Euclidean distances (59, 87). However, the effect of single large differences (outliers) is dampened (since they are not squared) in this measure. The Manhattan distance is computed as below: DMann. (x,y) = Σ |xi - yi|. (2). In this study, both Euclidean and Manhattan distances with five clustering methods were employed: average, complete, single, Ward’s and weighted linkage. 23.
(32) type (87). Further standardization (i.e. Z-score normalization) of variables has been undertaken to enable the comparison of variables to minimize the bias in weighting which may result from differing measurement scales and ranges (59). Then, the linkage type similarity within each cluster was calculated and plotted. The analysis was performed using S-PLUS.. 24.
(33) PARTⅠ Polysaccharide. Composition,. Structure,. In. Vitro. Immuno-. Modulating and Anti-tumor Activities of Some Regionally Different Strains of Lentinula edodes. Abstract The. monosaccharide. composition,. molecular. mass,. structural. linkage,. immuno-modulating and anti-tumor activities were investigated for polysaccharides extracted from different phylogenetic groups of ten regional L. edodes. The immuno-modulating properties and anti-tumor activities of these L. edodes extracts including crude polysaccharides and hot-water-extracts obtained from culture broth filtrates were tested using several different cell lines. The results showed that the ten isolated L. edodes could be classified into three distinct groups using amplified fragment length polymorphism assay. All isolates had similar molecular mass distribution between 1x10² and 3x10³ kDa and the monosaccharide composition analysis revealed the presence of glucose, mannose, xylose, galactose, fucose, rhamnose and arabinose in different ratios. The elucidated structural features of a crude polysaccharide fraction showed a new form of polysaccharide linkage with a backbone of α-(1→4)-glucan and side chains of β-(1→6)-glucan. Most of the culture. 25.
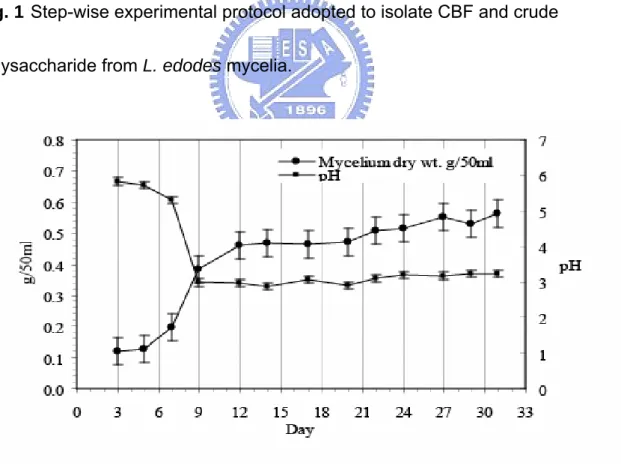
(34) broth filtrates exhibited significant enhancement in macrophage stimulatory activity. Indirect in vitro anti-cancer assay was also positive indicating that the effect is possibly due to a preliminary macrophage stimulatory activity with subsequent release of TNF-α or other biochemicals to inhibit tumor cell growth.. Results and discussion The step-wise experimental procedures adopted to prepare culture broth filtrate (CBF) and to isolate boiling water extract (BWE) of crude polysaccharides for composition analysis and anti-cancer activity assays are shown in Fig. 1.. L. edodes culture. The optimum environmental conditions for culture growth and polysaccharides production of mushrooms in liquid cultures are dependent on strains. Initially, the growth conditions of the culture were optimized that showed a stationary phase after 14 days. It was observed that L. edodes produced most polysaccharides and showed highest immuno-stimulating activity in the stationary phase. The biomass of the CBF extracts of all strains was estimated to be in the range 0.35 to 0.40 g/50 ml and pH between 2.5 and 2.8 for 14 days (Fig. 2 and Fig. 3). These values would be useful as references for optimization and pilot plant production studies in the future. Recently,. 26.
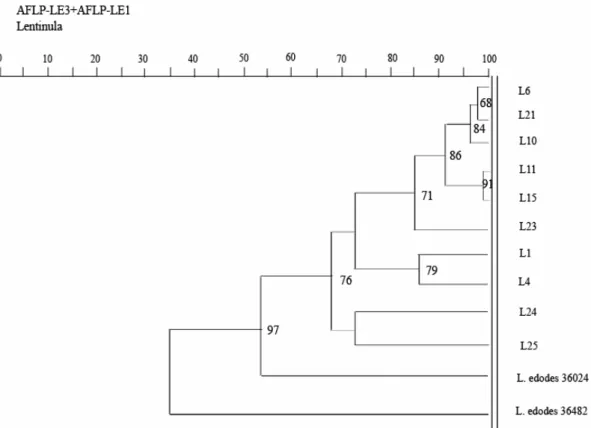
(35) the submerged cultivation of mushroom has received much attention in Asian regions as a promising alternative for efficient production of its valuable metabolites, especially polysaccharides and ganoderic acids (38, 88). It usually takes several months to cultivate the fruiting body of the mushroom, and it is also difficult to control product quality during soil cultivation. There is a great need to supply the market with a large amount of high-quality mushroom products. Therefore, submerged cultivation of mushroom could eventually supplement the need and proves useful over fruiting body cultivation.. Strain typing/phylogenetic mapping. The ten isolates of L. edodes were grouped into three distinct clusters by AFLP: (1) L24 and L25 isolates from China; (2) L1 and L4 isolates from Taiwan; (3) L6, L10, L11, L15, L21 and L23 isolates from Japan. The DNA material and adaptors were digested with restriction enzymes, Mse I and Eco RI, to prepare the AFLP template for sequence analysis. Two primer sets, Eco RI-AC-FAM/Mse I-CAA and Eco RI-AA-FAM/Mse I-CAC, were employed for selective amplification. The band positions of selected primers were used to construct a similarity index and an attempt was made to match the regionally different strains. A dendrogram of the similarity index based on the bands obtained for selected two primer sets was plotted to. 27.
(36) distinguish the closely related strains (Fig. 4). A very close genetic homogeneity among cultivated strains of Japanese mushrooms, L11, L15 and L10 was seen. Similarly, for the Taiwanese and Chinese mushrooms, the obtained AFLP fingerprints point out close resemblance to the genetic homogeneity. However, L24 and L25 mushrooms from China were quite different from the Japanese and Taiwanese mushrooms. The mushrooms, L1 and L4 were cultivated heterogeneous strains comprising of Japanese strains SL-19 and 271. The dendrogram obtained using AFLP (fingerprinting) analysis of L. edodes provides new insight into the population structure of this mushroom species and proves useful for phylogenetic type studies. The results appear promising and are well supported by results obtained using random amplified polymorphic DNA (RAPD) assay (fingerprinting) for the same species (89). Therefore, application of AFLP fingerprint assay for phylogenetic studies of mushrooms can now be included among other reported species in population studies.. Immuno-modulating and anti-cancer activities. The molecular mass fractions and chemical compositions of polysaccharides produced are strongly dependent on strain variations, extraction methods and culture conditions (56). Therefore, a comparative study of immuno-modulating and. 28.
(37) anti-cancer properties using CBF deserved further investigation. The CBF of all mushroom strains were used to treat macrophage (RAW 264.7 cell line) to test the immuno-stimulating activity (Fig. 5A). The strains with increasing NBT % reduction follow the order: (L15>L23>L10)> (L21>L6)> (L11> L24)> (L1>L25>L4). Based on the order of highest immuno-stimulating activity exhibits, the CBF of L15 and L23 strains were. further. tested. for. its. ability. to. produce. TNF-α. (Fig.. 5B).. When. lipo-polysaccharide or glucan extracts alone were used, TNF-α release was not impressive. But adding them together resulted in synergistically increased production of TNF-α. Similar behavior was observed previously among different strains of fungi and it was suggested that lipo-polysaccharide triggers a so-called ‘priming effect’ on polysaccharides (40). Thus, it was necessary to conduct further indirect anti-cancer activity experiments using CBF. Indirect anti-cancer activity tests were conducted on all the selected cancer cell lines with CBF of L15, L23, L10 and L21 strains (Fig. 5C). The cancer cell survival rate was moderate (<60% for AGS and MCF-7) with L15 and very high with L23 (for all selected cancer cell lines). Direct anti-cancer activity experimental results did not show effective inhibition of tumors (Fig. 5D). Among all the cell lines, gastric cancer cell line (AGS) responded to some extent better than others. Normal cell line (MRC-5) responded in a similar range to all other cancer cell lines.. 29.
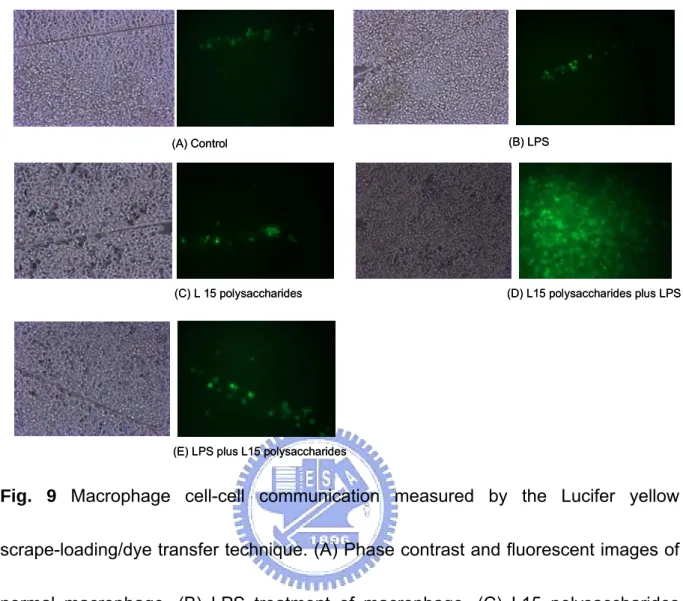
(38) Both CBF and BWE of L15 strain show better performance in tests for immuno-modulating properties. The BWE of L15 was further fractionated to obtain four different molecular mass fractions (Fig. 6). The polysaccharide content of the fractions was in the range 0.2-0.7 mg/ml (Fig. 7A). They were further tested for immuno-stimulating activity and roles in the direct anticancer activity. The immunity-enhancing properties of BWE’s were similar to those of CBF. The results of immuno-stimulating activity assays of mixtures of all fractions were similar to individual high molecular mass fractions ‘B’ (Fig. 7B, Fig. 8). However, in the direct anti-cancer activity assays, low molecular mass fractions gave better results confirming their vital role in immune-stimulating pathways (Fig. 7C).. Cell-cell communication assay. The scrape loading/dye transfer were used to demonstrate the macrophage cellular communication. The phase contrast and fluorescent images (Fig. 9A) shows the normal macrophage unable to transfer dye to neighboring cells. The LPS or L15 polysaccharides-treated macrophage, the results shows the lack of Lucifer yellow dye transfer to cells (Fig. 9B and Fig. 9C). The macrophage only treated with L15 polysaccharides or LPS can not exhibition cell-cell communication. Interestingly, an additive effect of the macrophage first treated with L15 polysaccharides and then. 30.
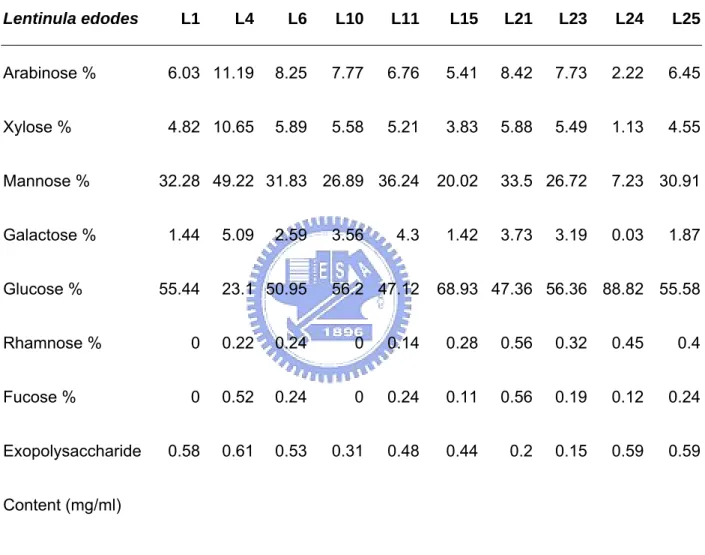
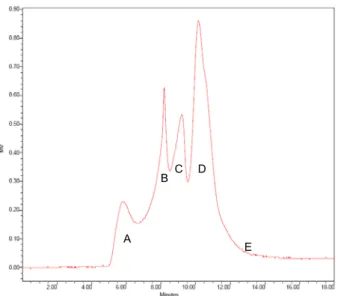
(39) treated with LPS on dye transfer was found in Fig. 9D. The Fig. 9D (L15 polysaccharides plus LPS) shows the dye transfer ability higher than the Fig. 9E (LPS plus L15 polysaccharides).. Molecular mass and monosaccharide composition. To deduce the structure-activity relationship, it is important to determine the molecular mass distribution and monosaccharide composition of the various polysaccharides isolates. Gel permeation chromatographic studies showed that all isolated polysaccharides had up to four similar molecular mass fractions (designated as A, B, C, D) with different distribution in the range 1x10² kDa and 3x10³ kDa (Fig. 10). A thorough examination revealed that the molecular mass fractions A and D were present in all strains while fractions B and C showed some disparity. The monosaccharide composition was determined from the standard calibration curves plotted for individual monosaccharide. The data revealed differences in the distribution of glucose, mannose, xylose, galactose, fucose, rhamnose and arabinose in the CBF of all mushrooms (Table 1). For example, the L15 polysaccharides contained mainly glucose and mannose and the contents of glucose in PS of L1, L4, L6, L10, L11, L21, L23, L24 and L25 were 55.4%, 23.1%, 51%, 56.2%, 47.1%, 47.4%, 56.4%, 88.8% and 55.6%, respectively. The nature of these compositions and. 31.
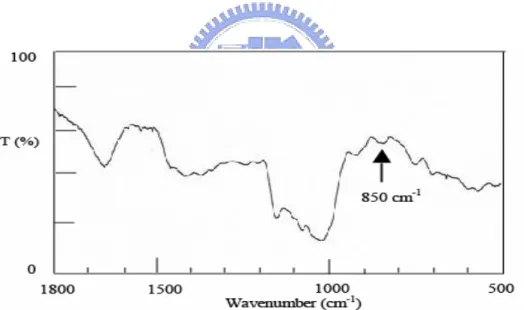
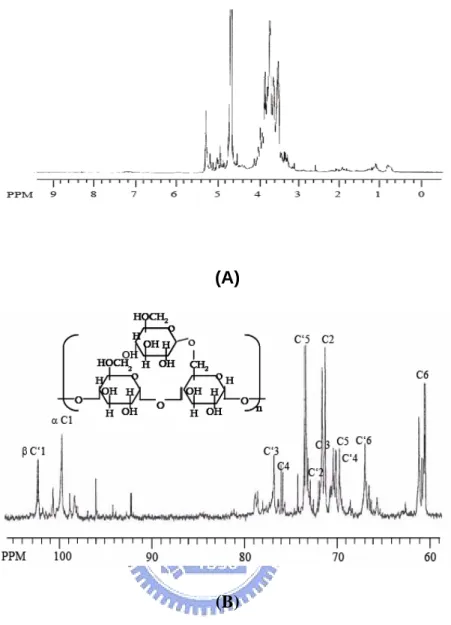
(40) differences remain unclear at this moment and would need further investigation when more relevant knowledge and analytical skills are available.. Structures. The structural features of the crude polysaccharides/BWE extracted from strain L15 were elucidated by using the FT-IR, NMR and GC-MS spectroscopic techniques to establish structure-immuno-stimulating and anti-cancer activity relationships. In the FT-IR spectra of the crude PS (all strains), the bands corresponding to the ν (C=O) vibration in the carboxyl group at 1650 cm-1 indicate that this carboxyl group was hydrogen bonded (Fig. 11). The absence of carbonyl bands at 1535 cm-1 and 1700 cm-1 indicates that these strains contain neither proteins nor uronic acids, respectively. In addition to the characteristic bands of glucans in the 1000-1100 cm-1 range, FT-IR spectra showed a weak band at 850 cm-1 (Fig. 11) that revealed the ‘α’ configuration of the main glucan linkages (79). The chemical shifts of individual proton and carbon peaks are shown in the NMR spectra of L15 BWE (Fig. 12). The two groups of anomeric proton signals centered at δ 5.29 and 4.93 ppm were assigned to (1→4)-D-Glcp and (1→6)-D-Glcp, respetively, Fig. 12A (71). The two major carbon peaks at δ 99.68 and 102.43 ppm were assigned to α-(1→4)-D-Glcp and β-(1→6)-D-Glcp residues, respectively (Fig. 12B). The. 32.
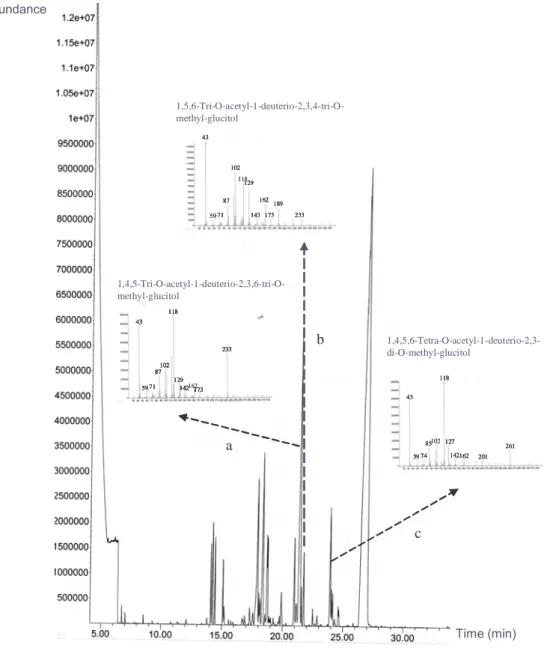
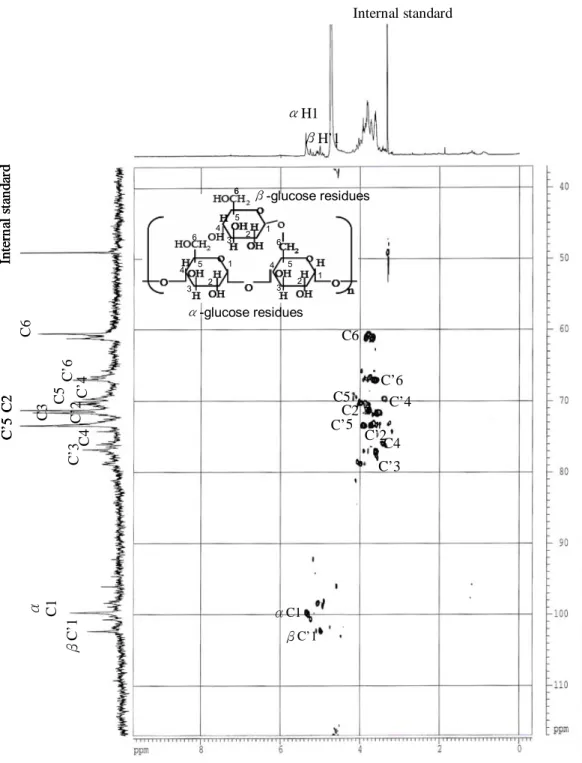
(41) anomeric carbon signals at δ 71.55, 71.28, 76.06, 70.09, and 60.86 ppm were assigned, respectively, to C-2, C-3, C-4, C-5, and C-6 of α-(1→4)-D-Glcp, due to their relatively higher peak intensities. The other carbon signals assigned for β-(1→6)-D-Glcp are C-2 (73.16), C-3 (76.79), C-4 (69.75), C-5 (73.45) and C6 (66.96). Further confirmation was based on analysis for alditol acetates using GC-MS in crude polysaccharides of L15 (Fig. 13). The resulting chromatograms demonstrated the presence of α-(1→4)-linked-D-glucopyranosyl and β-(1→6)-linked-D-glucopyranosyl moieties in the glucan, i.e. peak a: 1,4,5-tri-O-acetyl-1-deuterio-2,3,6-tri-Omethyl-D-glucitol (m/z: 43, 59, 71, 87, 102, 118, 129, 142, 162, 173, 233; α-(1→4)) and peak b: 1,5,6-tri-O-acetyl-1-deuterio-2,3,4 -tri-O-methyl-D-glucitol (m/z: 43, 59, 71, 87, 102, 118, 129, 143, 162, 173, 189, 233; β-(1→6)). The 1,4,5,6-tetra-O-acetyl-1deuterio-2,3-di-O-methyl-glucitol (m/z: 43, 59, 74, 85, 102, 118, 127, 142, 162, 201, 261) indicates (1→4) and (1→6) linkage (71). Linkage assignment was further confirmed by the. 1. H-13C HSQC 2D-NMR. spectrum that shows the cross relationships of the proton and carbon peaks that define glycosidic linkages (71, 90, Fig. 14). Note that the chemical shifts of C-4 and C’6 typify (1→4)-linked and (1→6)-linked glucose residues, respectively (91). Also note that the relative positions of the anomeric signals for both constituents (denoted H-1 and H’-1) are typical for an α-anomeric and a β-anomeric configuration. Although. 33.
(42) this linkage has been found for other mushrooms, it is new for the BWE from L. edodes. Analysis of the L15 BWE monosaccharide composition revealed that the one with the highest content is glucose (68.9%), the next is mannose (20%), and the remaining five constitute a total of 11%. This composition is rare, particularly for the presence of a total of seven different monosaccharides, and has not been reported in the literature. The tentative. 13. C NMR peak assignments for the mannopyranosyl residual are: C1. (96.02), C2 (69.65), C3 (70.35), C4 (78.5), C5 (74.25), C6 (61.2) (37, 92).. Discussion The procedures adopted to test the immuno-modulating and anti-cancer activities were similar to the experiments described by several authors (34, 80). The common protocol accepted is the use of fruiting bodies, extractions using aqueous or non-aqueous phases and structural characterization of the isolated products. Some experimental modifications were introduced including the method of isolation of the polysaccharides and the experimental steps involving treatment of cancer cell lines with polysaccharides. An important result of this study was the ability of the polysaccharides to stimulate immune cells irrespective of method of isolation, i.e. either using CBF or BWE or fractionated BWE. The polysaccharides from both BWE. 34.
(43) and crude polysaccharide seem to contain similar backbone structures. Ohno et al. (40) reported that the release of TNF-α by macrophages could be induced by β-glucans with specific molecular weights and lower branching ratios. The mechanisms for the recognition of β-glucans by macrophage were proposed to be fairly complex and the β-glucans were assumed to be broken down to lower molecular weight fragments through various cellular functions (40, 43). Also, the addition of lipo-polysaccharide resulted in a “priming effect” and increased the TNF-α production by various β-glucans (40, 93). Our results showed that structurally different α-glucans extracted from different mushroom strains could also stimulate RAW 264.7 cells to secret. TNF-α.. A. synergistic. effect. on. the. TNF-α. release. by. adding. lipo-polysaccharide was also observed in the in vitro studies. It would be of interest to see if the same effect is observed in the in vivo studies. In the indirect anti-cancer activity, the cytotoxic response of peritoneal macrophages and enhanced release of TNF-α are accounted for increased immuno-stimulating activity. Among the regional strains classified, the mushroom isolates from Japan showed the highest immuno-stimulating activity, followed by isolates from China and Taiwan, respectively. ploysaccharides in different strains of mushroom have anti-cancer activities that differ greatly in their chemical compositions and configurations. Although it is difficult to correlate the structure and anti-cancer. 35.
(44) activity, particularly due to the difficulty in determining the three dimensional structures, some correlations can be inferred. Earlier investigations revealed that the enhanced immuno-stimulating activity of the mushrooms might be due to the presence of α-glucans (94). Not only mushrooms, α-glucan in the polysaccharides was also identified in several medicinal plant extracts (94-96). All of these active polysaccharides, regardless of their origin, were obtained by different extraction methods and collected at different fractions and were found to vary in polymer structures. In some of the studies, extracted glucans with varying substituted. monosaccharides. in. the. side. chain. have. shown. enhanced. immuno-modulating activity (75), e.g. Bao et al. employing hot water extracted polysaccharides from Ganoderma lucidum. (73). Ukawa et al. found out that the neutral monosaccharide composition, i.e. fucose, xylose., mannose., galactose, and glucose, in the polysaccharides from isolates of fruiting bodies of Lyophyllum decastes Sing. were different from other species and this along with various protein content exerted increased anti-cancer activity (97). Tomati et al. (77) discovered that the proportion of the monosaccharides present in the hot water extract of CBF of L. edodes, glucose content was the highest and xylose second, with a 7:1 ratio. Other monosaccharides were ribose, arabinose and mannose and the total content was less than 1% (77). Similar phenomena were observed for some medicinal plant extracts,. 36.
(45) used as anti-cancer compounds (98).. Conclusions Natural polysaccharides with various monosaccharide compositions are difficult to synthesize in the laboratory, yet they are quite efficacious in many biological events and pharmacological treatment. We have established an experimental platform by adopting several classical and modern chemical and molecular biological protocols to prepare these materials and to use them for further studies and biotechnological applications. These include submerged liquid phase culture, separation by extraction, precipitation and chromatographic purification, molecular mass and structural characterization by various chromatographic and spectroscopic techniques such as FT-IR, NMR and GC-MS, and various biological activity assays. This report reveals that the polysaccharide fractions in the molecular mass range 1x10² and 3x10³ kDa of the culture broth filtrate (CBF) and boiling water extract (BWE) from L. edodes mycelia are able to show macrophage-stimulating and indirect anti-cancer activities. A new form of polysaccharide linkage with a backbone of α-(1→4)-glucan and side chains of β-(1→6)-glucan has been identified. It is important to further identify the key structural features at lower molecular mass fractions necessary to maintain similar or better biological activities to establish a clearer structure-activity relationship and for more. 37.
(46) convenient handling of future pharmacological and nutraceutical applications. The detailed mechanisms as well as related signal transductions involved with the biological activity such as macrophage-stimulation and subsequent release of TNF-α and/or other biochemicals to inhibit tumor growth need further clarification. The effects of these polysaccharides on other biological events such as cell-cell interactions are also worth exploring. We are currently in the process to do so.. 38.
(47) Tables PartⅠ Table 1. Monosaccharide composition of fractionated polysaccharide from different strains of L. edodes. Lentinula edodes. L4. L6. L10. L11. L15. L21. L23. L24. L25. Arabinose %. 6.03 11.19. 8.25. 7.77. 6.76. 5.41. 8.42. 7.73. 2.22. 6.45. Xylose %. 4.82 10.65. 5.89. 5.58. 5.21. 3.83. 5.88. 5.49. 1.13. 4.55. 32.28 49.22 31.83 26.89 36.24. 20.02. Mannose % Galactose % Glucose %. L1. 1.44 55.44. 5.09. 2.59. 23.1 50.95. 3.56. 4.3. 56.2 47.12. 1.42. 33.5 26.72. 7.23 30.91. 3.73. 0.03. 3.19. 1.87. 68.93 47.36 56.36 88.82 55.58. Rhamnose %. 0. 0.22. 0.24. 0. 0.14. 0.28. 0.56. 0.32. 0.45. 0.4. Fucose %. 0. 0.52. 0.24. 0. 0.24. 0.11. 0.56. 0.19. 0.12. 0.24. 0.58. 0.61. 0.53. 0.31. 0.48. 0.44. 0.2. 0.15. 0.59. 0.59. Exopolysaccharide Content (mg/ml). 39.
(48) Figure Captions PartⅠ Fig. 1:. Step-wise experimental protocol adopted to isolate CBF and crude polysaccharide from L. edodes mycelia.. Fig. 2:. Time course of the mycelium growth of L. edodes ‘L11’ strain submerged liquid culture.. Fig. 3:. Dry cell weight of mushroom strains.. Fig. 4:. Dendogram of L. edodes constructed using AFLP assay.. Fig. 5:. (A) Macrophage stimulatory activity assay (% NBT reduction) using CBF of all strains. (B) TNF-α release activity using CBF of L15 and L23. (C) Indirect anti-cancer assay (% MTT reduction) using CBF of 4 different strains. (D) Direct anti-cancer assay using CBF of all strains. The CBF was first treated with immune cell lines-RAW 264.7 (% NBT reduction) and J45.01 (% MTT reduction) and then added to other different cancer cell lines (% MTT reduction).. Fig. 6:. Molecular mass fractions of L15 BWE. (A) >2750 kDa (B) ~2700 kDa (C) ~534 kDa (D) ~11.7 kDa.. Fig. 7:. (A) Polysaccharides content of different molecular weight fractions (A, B, C, D and E) extracted from L15 BWE and control sample from L15 BWE. 40.
(49) mixture fractions. (B) Macrophage stimulatory activity (% NBT reduction) of obtained weight fractions, and, (C) Direct anti-cancer assay (% MTT reduction) of obtained weight fractions (PBS as control). Fig. 8:. Macrophage stimulatory activity morphological images by NBT reduction assay. (A), (B), (C), (D) and (E) show that macrophage was treated of different molecular weight fractions (A, B, C, D and E) extracted from L15 BWE (L15 BWE mixture fractions as control sample and PBS as blank control).. Fig. 9:. Macrophage cell-cell communication measured by the Lucifer yellow scrape-loading/dye transfer technique. (A) Phase contrast and fluorescent images of normal macrophage, (B) LPS treatment of macrophage, (C) L15 polysaccharides treatment of macrophage, (D) L15 polysaccharides (1.5 mg/ml) plus LPS (10 μl/ml) treatment macrophage, and (D) LPS (10 μl/ml) plus L15 polysaccharides (1.5 mg/ml) of macrophage.. Fig. 10: GP chromatogram obtained from CBF of mushroom strains. Molecular mass fractions are indicated. Fig. 11: A typical FTIR spectrum recorded from crude polysaccharides of L15. Fig. 12: NMR spectra of crude polysaccharides boiling water extracted from L15. (A) The two anomeric proton signals are at δ 5.29 and 4.93 ppm that were. 41.
(50) assigned as (1→4)-D-Glcp and (1→6)-D-Glcp (600 MHz), (B) The anomeric carbon signals for the (1→4)-D-Glcp and (1→6)-D-Glcp residues were assigned at δ 99.68 and 102.43 ppm, respectively, from 13C (150 MHz). The carbon signals at δ 71.55, 71.28, 70.09, and 60.86 ppm correspond, respectively, to C-2, C-3, C-5, and C-6 of (1→4)-D-Glcp. The other signals for (1→6)-D-Glcp are C-2 (73.16), C-3 (76.79), C-4 (69.75), and C-5 (73.45), Fig. 13: GC-MS data for the alditol acetates derived from the methylated polysaccharide BWE isolated from L15 L. edodes. The presence of (a) 1,4,5-tri-O acetyl-1-deuterio-2, 3, 6-tri-O-methyl-D-glucitol and, (b) 1,5,6tri-O acetyl-1-deuterio-2, 3, 4-tri-O-methyl-D-glucitol. were detected. (c). The1,4,5,6-tetra-O-acetyl-1-deuterio-2,3-di-O-methyl-glucitol indicates (1→ 4) and (1→6) linkage. Fig. 14: The 2D (HSQC) NMR spectrum of the L15 BWE in D2O.. 42.
(51) PartⅠ. Fig. 1 Step-wise experimental protocol adopted to isolate CBF and crude polysaccharide from L. edodes mycelia.. Fig. 2 Time course of the mycelium growth of L. edodes ‘L11’ strain submerged liquid culture.. 43.
(52) Fig. 3 Dry cell weight of mushroom strains.. Fig. 4 Dendogram of L. edodes constructed using AFLP assay.. 44.
(53) L15 L23. TNF-a production (pg/ml). 30000 25000 20000 15000 10000 5000 0 Control. LPS. CBF. 45. CBF+Medium. CBF+LPS.
(54) Fig. 5 (A) Macrophage stimulatory activity assay (% NBT reduction) using CBF of all strains. (B) TNF-α release activity using CBF of L15 and L23. (C) Indirect anti-cancer assay (% MTT reduction) using CBF of 4 different strains. (D) Direct anti-cancer assay using CBF of all strains. The CBF was first treated with immune cell lines-RAW 264.7 (% NBT reduction) and J45.01 (% MTT reduction) and then added to other different cancer cell lines (% MTT reduction).. 46.
(55) B. C. D. A. E. Fig. 6 Molecular mass fractions of L15 BWE. (A) >2750 kDa (B) ~2700 kDa (C) ~534 kDa (D) ~11.7 kDa.. Fig. 7(A) Polysaccharides content of different molecular weight fractions (A, B, C, D. 47.
(56) and E) extracted from L15 BWE and control sample from L15 BWE mixture fractions. (B) Macrophage stimulatory activity (% NBT reduction) of obtained weight fractions, and, (C) Direct anti-cancer assay (% MTT reduction) of obtained weight fractions (PBS as control).. PBS. (B). Control. (A). (C). (D). (E). Fig. 8 Macrophage stimulatory activity morphological images by NBT reduction assay. (A), (B), (C), (D) and (E) show that macrophage was treated of different molecular weight fractions (A, B, C, D and E) extracted from L15 BWE (L15 BWE mixture fractions as control sample and PBS as blank control).. 48.
(57) (A) Control. (B) LPS. (C) L 15 polysaccharides. (D) L15 polysaccharides plus LPS. (E) LPS plus L15 polysaccharides. Fig. 9 Macrophage cell-cell communication measured by the Lucifer yellow scrape-loading/dye transfer technique. (A) Phase contrast and fluorescent images of normal macrophage, (B) LPS treatment of macrophage, (C) L15 polysaccharides treatment of macrophage, (D) L15 polysaccharides (1.5 mg/ml) plus LPS (10 μl/ml) treatment macrophage, and (D) LPS (10 μl/ml) plus L15 polysaccharides (1.5 mg/ml) of macrophage.. 49.
(58) C A. B. D. Fig. 10 GP chromatogram obtained from CBF of mushroom strains. Molecular mass fractions are indicated.. Fig. 11 A typical FTIR spectrum recorded from crude polysaccharides of L15.. 50.
(59) (A). (B) Fig. 12 NMR spectra of crude polysaccharides boiling water extracted from L15. (A) The two anomeric proton signals are at δ 5.29 and 4.93 ppm that were assigned as (1→4)-D-Glcp and (1→6)-D-Glcp (600 MHz), (B) The anomeric carbon signals for the (1→4)-D-Glcp and (1→6)-D-Glcp residues were assigned at δ 99.68 and 102.43 ppm, respectively, from. 13. C (150 MHz). The carbon signals at δ 71.55, 71.28, 70.09, and. 60.86 ppm correspond, respectively, to C-2, C-3, C-5, and C-6 of (1→4)-D-Glcp. The other signals for (1→6)-D-Glcp are C-2 (73.16), C-3 (76.79), C-4 (69.75), and C-5 (73.45), 51.
(60) Abundance. 1,5,6-Tri-O-acetyl-1-deuterio-2,3,4-tri-Omethyl-glucitol 43. 102 118 129 87 59 71. 162. 189. 143 173. 233. 1,4,5-Tri-O-acetyl-1-deuterio-2,3,6-tri-Omethyl-glucitol 118 43. 233. b. 1,4,5,6-Tetra-O-acetyl-1-deuterio-2,3di-O-methyl-glucitol. 102 87 59 71. 118. 129 142162 173 43. 85102 127. a. 59 74. 261. 142162. 201. c. Time (min). Fig. 13 GC-MS data for the alditol acetates derived from the methylated polysaccharide BWE isolated from L15 L. edodes. The presence of (a) 1,4,5-tri-O acetyl-1-deuterio-2, 3, 6-tri-O-methyl-D-glucitol and, (b) 1,5,6-tri-O acetyl-1-deuterio-2, 3, 4-tri-O-methyl-D-glucitol were detected. (c) The1,4,5,6-tetra-O-acetyl-1-deuterio2,3-di-O-methyl-glucitol indicates (1→4) and (1→6) linkage.. 52.
(61) Internal standard. αH1. Internal standard. βH’1. 6. β-glucose residues. 5 4. 6. 3 1. 5. 4 3. 2. 2. 1 6 5. 4 3. 1. 2. C3 C5 C’6 C’2 C’4. C6. C5 C2 C’5. C’3 C4 βC’1. α C1. C’5 C2. C6. α-glucose residues. C’6 C’4 C’2 C4 C’3. αC1 βC’1. Fig. 14 The 2D (HSQC) NMR spectrum of the L15 BWE in D2O.. 53.
(62) PARTⅡ Pressurized Water Extraction of Polysaccharides as Secondary Metabolites from Lentinula edodes. Abstract The suitability of pressurized water extraction (PWE) of crude polysaccharides as secondary metabolites from L. edodes was investigated. A series of experiments were carried out to examine the effects of extraction times and pressures. The results indicated that the maximum recovery of polysaccharides was about 90% of the crude polysaccharides from mycelia pellets when the pressure was at 10.1 MPa for 70 min (28 °C). This was a drastic improvement over that of boiling water extraction (BWE) at 0.1 MPa for 40 min, which gave only 27.9% recovery. A nitroblue tetrazolium (NBT) reduction assay was used to examine the macrophage stimulating activities (MSA), and it was found that the PWE polysaccharides retained the MSA. The morphology of the macrophage cells treated by PWE polysaccharides was also examined and found to be similar to that of the positive control lipopolysaccharides treated. Finally, gel chromatographic and NMR experiments revealed that both PWE and BWE polysaccharides showed the presence of four similar molecular mass components and the α-(1→4)-D-Glcp and β-(1→6)-D-Glcp linkage residues. The improved PWE. 54.
(63) efficiency is probably due to the possibility that under high pressure, the solid polysaccharide’s hydrogen bonding is partially destroyed to increase structure elasticity and water solubility.. Results and discussion Optimization of L. edodes Culture Growth and PWE of Polysaccharides. Fig. 1 shows the time course of mycelia growth curve expressed as plots of dry weights versus time. The results indicated that the mycelia dry weight reached 461.2 mg/50 mL at the 12th day and that the growth rate of mycelia could be roughly divided into three phases. The first one appeared from the 3rd to the 7th day and had a slow growth rate. The second one appeared from the 7th to the 12th day with the best mycelia growth rate. After the 14th day, the mycelia growth moved to a stationary phase. The MSA measured by using the NBT reduction assay on the collected culture broth filtrates (CBF) from the mycelia culture at various days are also plotted in Fig. 1. Although the MSA was slightly greater for the 17th day polysaccharides, because of the considerations of (1) the quantity of polysaccharides, (2) polysaccharide bioactivity, and (3) time, the operational time to harvest the mycelia growth and crude polysaccharides production were set at the 14th day. BWE (40 min at 0.1 MPa, as control experiments) and PWE (between 10 and 80. 55.
(64) min at 25.3 MPa) of the crude polysaccharides as secondary metabolites from L. edode culture broth filtrate were performed to obtain the optimum extraction time; 25.3 MPa was the highest pressure the instrument could achieve. Under this pressure the optimum extraction time was obtained, and at this optimum extraction time, the pressure was then reduced to find the optimum extraction efficiency (48, 49). It was found that BWE recovered only 27.9% of the crude polysaccharides, which was much less than those extracted with PWE at all time conditions (Table 1). When the PWE time was increased from 10 to 70 min, the polysaccharide recovery increased from 80.6 to 88.6%. The greatest recovery of polysaccharides was 88.6% at a pressure of 25.3 MPa for 70 min. As shown in Table 1, increasing the extraction time to 80 min did not increase polysaccharide recovery. Thus, extraction time was set at 70 min for subsequent experiments. Table 1 also shows the polysaccharide extraction data at various pressures at 70 min. The recoveries of polysaccharides slightly increased from 85.1% at an extraction pressure of 2.5 MPa to 90.0-90.3% at 10.1-15.2 MPa and then diminished to 88.6% at 25.3 MPa. A maximum recovery (~90%) at 10.1 MPa was obtained. Thus, an optimum condition for PWE was therefore set at 10.1 MPa and 70 min. At 2.5-25.3 MPa, the yield (i.e., solubility) of polysaccharides was about 29.8-31.6 mg/10 mL (calculated from the initial 35 mg/10 mL of crude polysaccharides). The extraction reproducibility was expressed by RSD (%). It was. 56.
(65) found that for BWE, the RSD was 21.5%, which was much greater (and hence less reproducible) than those of PWE, which were normally <2.7%. This was due, probably in part, to the lack of precise control of pressure and temperature under the traditional extraction processes. Generally, the extracted amount of polysaccharides depends on temperature, pressure, pH of the solvent, ionic strength, and fineness of solid particle grinding. The polysaccharide Lentinan was first isolated and studied by Chihara (81). The extractions were performed using 80-100 °C boiling water for 8-16 h. Mizuno et al. later modified the extraction method, and the extractions of high molecular mass polysaccharides were performed with three successive steps, that is, with water (100 °C, 3 h), 2% ammonium oxalate (100 °C, 6 h), and 5% sodium hydroxide (80 °C, 6 h) (1, 44). A strong base such as NaOH alone in the extraction medium resulted in a higher extraction yield than pure water at all temperatures tested (45, 99, 100). This modified method was more efficient and relatively less costly when compared to the original Chihara method (46, 81, 101). However, the use of boiling water was not convenient, and dilute alkaline solution may alter the structures and bioactivities of the polysaccharides (45). Note that the -OH groups in the anhydrous glucose units are ionized at high pH (i.e., pH 12.5), which might increase the polysaccharides’ water solubility and structure elasticity in addition to the reduction of polymer chain. 57.
(66) agglomeration and molecular degradation (102, 103).. MSA and Macrophage Morphology. It has been reported that polysaccharides possess an immunomodulating effect by the activation of a variety of macrophage functions, for example, superoxide anion production and cytokine production (104, 105). The MSA of the PWE polysaccharides were examined by using the NBT assay, and the results are shown in Fig. 2. The NBT reduction of macrophage activities at 5.1, 7.6, 10.1, 15.2, and 25.3 MPa extractions were 148, 166, 172, 192, and 207%, respectively. These data were close to that of BWE (151%), indicating that both the PWE and BWE methods were able to retain the bioactivities of the polysaccharides. It is noted that CBF has higher macrophage activities, probably due to the presence of other metabolites in addition to polysaccharides. When macrophage cells were cultivated for 24 h with LPS, BWE, or PWE polysaccharides, dramatic morphological changes were observed (Fig. 3). The LPS is a cell wall component of a Gram-negative bacteria and can activate monocytes and mocrophages (106, 107). Figure 4b shows that the macrophage cells appeared to have distinct dendritic-like morphology after 24 h of culturing in the presence of the LPS positive control as compared with those of unstimulated macrophage cells (Fig.. 58.
數據
+7
Outline
相關文件
Segmented Bushy Path 分為兩個步驟,第一個步驟是文件結構的切割 (Text Segmentation),也就是分析文件內容並將文件內容切割成幾個具有代 表的結構。Text Segmentation
4.1 多因子變異數分析 多因子變異數分析 多因子變異數分析 多因子變異數分析與線性迴歸 與線性迴歸 與線性迴歸 與線性迴歸 4.1.1 統計軟體 統計軟體 統計軟體 統計軟體 SPSS 簡介 簡介
在軟體的使用方面,使用 Simulink 來進行。Simulink 是一種分析與模擬動態
本研究採用的方法是將階層式與非階層式集群法結合。第一步先運用
過去有許多學者使用過幾種方法來評估組織績效,以下舉出常用的八種 方法:(1)比例分析法(Ratio Approach)。(2)平衡計分卡(Balanced Scorecard)
•自內分泌系統分泌的激素利用血液輸送到 目 標器官。類固醇和甲狀腺激素是非極 性,且為脂 溶性,所以能通過細胞膜進入 目標細胞。大部分
工作分解結構 (WBS, Work Breakdown Structure) 檢核清單 (check list or risk profile). 假設與限制分析 (assumptions and constrains
在集群分析方法中,Stuart Lloyd 於 1957 年提出了 K-Means 分析法。它是利用劃分方 式的ㄧ種聚類算法。此種方式以隨機選取
