銷售責任額困難度、客戶導向服務、工作滿足及離職傾向關係探討 -以高雄地區財富管理銀行理財人員為例
79
0
0
全文
(2) 謝辭 很榮幸有機會在畢業後多年重返校園進修,心中非常興奮及擔心,因為自己深知 已不再只是當年單純的學生,而是要身兼雙重角色,必須付出多份心力同時堅守 目前工作及學生的崗位。很慶幸的是能得到學校師長、同學的協助及公司主管、 同事的鼎力支持,才能夠順利的完成這兩年的學習過程。. 論文得以如期完成,要感謝許多的人,首先要衷心感謝恩師劉維琪教授及陳世哲 教授對我的的悉心指導與鼓勵。在論文撰寫期間,由於工作繁重,無法與定時與 教授聚會討論,導致進度落後,透過陳世哲教授對我耐心的指導及鼓勵,終於在 最後關頭得以完成。口試時間,承蒙黃良志博士及溫金豐博士熱心指導,並提出 極具深度的見解及逐頁逐句的剴切指正,使本論文更為周詳完善,特此謝忱。在 工作崗位上,要感謝主管俞斐雲經理對我的包容與體諒才得以全心全力投入及時 完成。在論文寫作上感謝好友、同事協助發送及填寫問券,尤其是好友瓊文,犧 牲個人休假予以協助指正論文並提供許多寶貴的意見,為我紓解不少寫作時的壓 力。. 感謝父母對我過去數十年來無怨無悔的栽培及支持。在職求學期間,感謝家人、 師長、好友、同事及同學給我許多精神上及實質的鼓勵與協助。謹以此論文獻給 我最心愛的家人,衷心感謝他們無所求的付出。. 黃佩琪. 謹誌於. 國立中山大學企業管理研究所 民國九十四年八月. I.
(3) 中文摘要 論文名稱:銷售責任額困難度、客戶導向服務、工作滿足及離職傾向關係探討 -以高雄地區財富管理銀行理財人員為例 校所組別:國立中山大學企業管理研究所. 頁數:69. 畢業時間及提要別:九十三學年度第二學期碩士學位論文摘要 研究生:黃佩琪 (Pei-Chi Huang) 指導教授:劉維琪博士(Victor W.C. Liu, Ph. D.)、 陳世哲博士(Shyh-Jer Chen, Ph. D.). 論文摘要內容:. 綜觀過去數十年台灣產業結構的變化,服務業已逐漸成為國內最大產業,而 財富管理銀行業務更是近幾年來最熱門之金融服務。財富管理在歐美已行之有 年,但在台灣仍屬開發初期。然而在追求企業高利潤及分攤風險的原則下,如何 提升理財人員的服務品質與工作績效,以及如何留住優秀的人才都是金融服務業 重要的管理課題。本研究以財富管理銀行理財人員為研究對象,探討其認知的銷 售責任額困難度、客戶導向服務、工作滿足及離職傾向之間的關係。. 本研究採取問券調查方式並以 SPSS 統計軟體針對樣本進行信度分析、描述 性統計分析、單因子變異數分析及事後檢定、獨立樣本檢定、相關分析及回歸分 析,重要發現如下:. 1. 個人變項的不同對銷售責任額困難度、客戶導向服務、工作滿足及離職傾向 有部分顯著之差異。 2. 銷售責任額困難度對客戶導向服務及工作滿足有顯著的負相關。 3. 銷售責任額困難度對離職傾向有顯著的正相關。 4. 客戶導向服務對工作滿足有顯著的正相關。 5. 客戶導向服務及工作滿足對離職傾向有顯著的負相關。 6. 客戶導向服務對銷售責任額困難度及工作滿足並沒有顯著的中介效果。. II.
(4) 客戶及員工是企業最寶貴的兩大資產,本研究結果發現理財專員認知之銷售 責任額困難度對客戶導向服務及工作滿足有顯著的負相關。建議金融機構之財富 管理事業應重視訂定合理的銷售責任額,並強調客戶導向服務的重要性,並架構 公平完善的福利制度及訓練課程。畢竟,快樂的員工及優質的服務品質才能為企 業創造出最佳的績效。. 關鍵字:財富管理、財務顧問、銷售責任額、客戶導向服務、工作滿足、離職傾 向. III.
(5) A Study on the relationships between financial advisors’ perceived quota difficulty, customer orientation, job satisfaction and turnover intention- Using Kaohsiung area wealth management banking sector as an example. Abstract: In retrospect over the changes of past few decades, service industry has gradually become the largest industry in Taiwan and wealth management banking services has become the most desired financial services over the past few years.. Despite that. wealth management service has already been in existence in the western world for a long period of time, it is still in its infant stage for the domestic banking sector.. In. the face of fierce competition, gaining highest profit with lowest risk has been the objective of every bank in Taiwan.. How to strengthen the service quality, enhance. productivity and retain qualified financial advisor has been financial players’ utmost goal.. Thus, this study aims to study the relationships between financial advisors’. perceived quota difficulty, customer orientation, job satisfaction and turnover intention.. This research utilizes questionnaire study method and using SPSS for Windows as the tool to conduct statistical analysis, including reliability test, descriptive analysis, ANOVA test, correlation and regression analysis.. The research findings are as. follow:. 1. There has been partial significant difference for individual variables’ with respect to their perceived quota difficulty, customer orientation, job satisfaction and turnover intention 2. There are significant negative correlations between financial advisors’ perceived quota difficulty and customer orientation as well as job satisfaction. 3. There are significant positive correlations between financial advisors’ perceived quota difficulty and turnover intention. 4. There are significant positive correlations between financial advisors’ customer orientation and job satisfaction. 5. There are significant negative correlations between financial advisors’ customer orientation and turnover intention. 6. There was no significant evidence of mediation for customer orientation with IV.
(6) respect to perceived quota difficulty and job satisfaction.. Given the research results, the financial institutions should seriously look into setting up a reasonable sales quota while simultaneously stress the importance of customer oriented service. The human resources department should establish a comprehensive and thorough benefit policy and training program to enhance employee job satisfaction and reduce turnover intention. On balance, customers and employees are the two most valuable assets for a firm. Only happy employees and excellent service quality can create utmost value and profit for a firm.. Key words: wealth management, salespeople (financial advisor), perceived quota difficulty, customer orientation, job satisfaction, turnover intention.. V.
(7) Table of Contents Contents. Page. Acknowledgements/謝辭………………..………………………..…………... I. Chinese Abstract/中文摘要………………..………………………..……… II Abstract ………………..………………………..………………………..……. IV. Table of Contents…………………………………..…………………………... VI. List of Tables…………………………………..………………………………. VIII List of Figures…………………………………..……………………………... IX. Chapter 1 Introduction …………………………………..……………………. 1. Chapter 2 Literature Review…………………………………………………. 4. 2.1 Perceived quota difficulty………………………………………. 4. 2.1.1 Perceived quota difficulty and sales customer orientation……. 5. 2.2 Customer orientation……………………………….. …………... 6. 2.3. Job satisfaction and turnover intention…………………………. 9 2.3.1 Job satisfaction……………………………………………….... 9. 2.3.2 Perceived quota difficulty and job satisfaction………………... 12. 2.3.3 Customer orientation and job satisfaction…………………….. 12. 2.3.4 Turnover intention………………………………. …………… 12 2.4 The Banking Industry-Wealth Management Overview…………. 14. 2.4.1 Wealth management services………………………………….. 15. 2.4.2 Overview on the domestic wealth management market………. 16. Chapter 3 Research hypothesis and methodology …………………... …….... 18. 3.1 Theoretical Framework ………………………... ……... …….... 18. 3.2 Method…………………………………. ……... ……... …….... 20. 3.2.1 Sample and Data Collection………………………………….. 20. 3.2.1.1 Sample Details…………………………………………….. 20. 3.2.2 Operationalization of study variables……………………... …. 21. 3.2.3 Measure and analysis assessment …………………………….. 25. Chapter 4 Measure assessment results ………………………………... …….... 26. VI. 33.
(8) 4.1 Reliability test….. ……... ……... ……...……... ……... ……...... 26. 4.2 Descriptive statistics.. ……... ……... ……... ……... ……... …... 29 4.2.1 Sample demographic data analysis……. ……. ……. ………... 29. 4.2.2 Perceived quota difficulty data analysis………………………. 31 4.2.3 Customer orientation data analysis. .………… ………………. 31. 4.2.4 Job satisfaction data analysis………………. ……………….... 32. 4.2.5 Turnover intention data analysis.………………. …………….. 33. 4.3 One-way ANOVA test…………………………………..………. 35. 4.3.1 One way analysis of variance (ANOVA) test between. 36. demographics variables and perceived quota difficulty……… 4.3.2 One way analysis of variance (ANOVA) test between. 36. demographics variables and customer orientation…………… 4.3.3 One way analysis of variance (ANOVA) test between. 37. demographics variables and job satisfaction…………………. 4.3.4 One way analysis of variance (ANOVA) test between. 37. demographics variables and turnover intention…………….... 4.4 Correlation analysis………………. ……. ……. ……. ……….. 42. 4.5 Regression analysis……………………………………………... 44. 4.5.1 Perceived quota difficulty regression…………………….…… 44 4.5.2 Customer orientation regression.……………….………….... 45. 4.5.3 Job satisfaction regression……………………………..……… 45 4.5.4 Multiple regression……………………….…….……….….... Chapter 5 Research results and theoretical/ managerial implications. 46. 48. 5.1 Research results….. ……. ……. ……. ……. ……. ……. …….. 48. 5.2 Theoretical implications……. ……. ……. ……. ………. ……... 50. 5.3 Limitations and future research……. ……. ……. ………. ……. 52. References……………………………………………………. ……. ……. ….. 54. Appendix Appendix I : Sample Survey Questionnaire (in Chinese) …….……………….. 64. Appendix II: Survey Questionnaire Scale Items……. ……. ……. …..………. 67. VII.
(9) List of Tables. Page. Table 4-1 Perceived Quota Difficulty Reliability Test…………………………. 26. Table 4-2 Customer Orientation Reliability Test………………………………. 26. Table 4-3 Selling Orientation Reliability Test………………………………..... 27 Table 4-4 Job Satisfaction Reliability Test…………………….………………. 27 Table 4-5 Turnover Intention Reliability Test………………………………….. 28. Table 4-6 Sample data demographic descriptive statistics…………..………… 30 Table 4-7 Perceived Quota Difficulty Summary………………………………. 31 Table 4-8 Customer-orientation data summary………………………………... 32 Table 4-9 Job Satisfaction data analysis……………………………………….. 34 Table 4-10 Turnover intention data summary………………………………….. 35. Table 4-11 One-way ANOVA test Results: Demographic vs. Perceived Quota 38 Difficulty………………………………………………………….. Table 4-12 One-way ANOVA test Results: Demographic vs. Customer. 39. Orientation………………………………………………………… Table 4-13 One-way ANOVA test Results: Demographics vs. Job Satisfaction. 40. Table 4-14 One-way ANOVA test Results: Demographic vs. turnover. 41. intention……………………………………………………………. Table 4-15 Correlations analysis of studied variables…………………………. 43. Table 4-16 Regression Analysis: Using Perceived Quota Difficulty as. 44. independent variable and customer orientation and job satisfaction as dependant variable……………………………………………… Table 4-17 Regression Analysis: Using customer orientation as independent 45 variable and job satisfaction as dependent variable……………….. Table 4-18 Regression Analysis: Using Job satisfaction as independent. 46. variable and turnover intention as dependant variable…………….. Table 4-19 Regression Analysis: Using Perceived Quota Difficulty as independent variable and customer orientation as the mediator and job satisfaction as dependent variable…………………………….... VIII. 47.
(10) List of Figures Figure. Page. Figure 1: Conceptual Model of the effect of perceived quota difficulty,. 18. customer orientation, job satisfaction and turnover intention…….. IX.
(11) Chapter 1: Introduction Over the past decades, service industry has become the largest industry in Taiwan. According to the statistics data published by the Ministry of Economic Affairs, our industry breakdown demonstrated that service industry contributed to over 70% of our national GDP. Among the functional areas of service industry, sales and marketing have been the most frequent targets of criticism (Dabholkar and Kellaris, 1992; Levy and Dubinsky, 1983; Murphy and Laczniak, 1981). Despite salespeople have important contribution to the success of the firms, there has been a saying that salespeople are always over-promising and sell goods/services to their clients seeking to maximize their personal benefit instead of their customers’. People tend to view salespeople as not trustworthy and dishonest due to their ‘hard sell’ nature; since during any selling process, most of the time customers always have to pay an upfront fee for services/products rendered. After product/service received, many times customers have responded many discrepancies between what was expected and what actually is.. This phenomenon is mainly attributed by the fierce. competition in the business environment whose objective is profit maximization. Indeed, a main reason for salesperson’s persistence with sales orientation and reluctance to engage in customer orientation is that the latter requires greater salesperson effort in customer relationship development activities (Saxe and Weitz, 1982). Seeking for survival and to gain customer attraction, creative marketing techniques has been developed; meanwhile, with the rise of consumer rights, the sales and marketing events conducted by businesses have been questioned by consumers. The strong criticism of sales practices may be rooted in the nature of the selling job itself.. Salespeople constantly face enormous tension created by the dual. requirements of short-term performance and long-term customer satisfaction (Dabholkar and Kellaris, 1992).. Likewise, financial industry over the past has been. regarded as very stable and well-paid jobs. According to the relevant research conducted by foreign financial institutions, the domestic family’s liquid assets over NT$ 3,000,000 is about 450,000 accounts. By year 2010, the figure is estimated to double to over 1,000,000 accounts. Doubtlessly, it is that banks of every description 1.
(12) in Taiwan are launching wealth-management or personal banking services, or reorganizing and renaming existing offering as such and unquestionably the demand for positions like personal account officers or financial advisors has reached its peak. However, with intense competition from domestic banks as well as foreign banks in Taiwan, and the rise of unemployment rate, working for banks are no longer considered stable as the so called “golden-bowl”, moreover, sales related tasks are required for the entire institution which may result important impact on employees job satisfaction and further influence their turnover intention.. Simultaneously, it will. have parallel effect on employee’s customer orientation, which may influence the employee’s service quality and jeopardize customer’s goodwill. Researchers have investigated many resources on the relationship between employee job satisfaction and turnover intention (Russ and McNeilly, 1995; Homburg and Stock, 2004). Moreover, job satisfaction of a company’s employees is also an important driver of customer satisfaction. For example, Homburg and Stock (2004) have found out that the relationship between salespeople’s job satisfaction and customer satisfaction is found to be particularly strong in the case of high frequency of customer interaction, high intensity of customer integration into the value-creating process, and high product/service innovativeness. It has been broadly known in prior literature that customer-oriented selling (or customer orientation) creates greater long-term performance benefits for the salesperson relative to sales-oriented (Brady and Cronin, 2001; Goff et al., 1997; Kelley, 1992; Langerak, 2001; Reicheld and Sasser, 1990; Saxe and Weitz, 1982). Since effort is determined by motivation (Deci and Ryan, 1985), salesperson’s motivation to engage in customer orientation is a precondition for its practice. Despite that the research all support customer orientation would lead to long-term benefit for the customer, the company as well as for the salesperson himself. However, under fierce competitive environment, company’s tend to assign rather difficult goals for their sales staff.. The individual’s assigned quota may have. significant effect on a salesperson’s relevant customer oriented behavior (Schwepker and Good, 1999).. If the assigned sales quota has been perceived as rather difficult. and unachievable, would that have any affect on a salesperson’s customer orientation? Can a salesperson grasp a balance between attaining what has been assigned by his 2.
(13) managers and at the same time satisfy what his/her customers demand? The purpose of this study seeks to examine the relationship and the influence of financial officers’ perceived sales quota difficulty and their customer orientation, job satisfaction and turnover intentions. Because of the important contributions of salespeople with respect to the success (or failure) to the banks, this research aims to focus on the sales representatives in the banking industry, namely the personal account officers/ financial advisors working in the wealth management banking sector as the object of examination. In Taiwan, the wealth management service is still in its infant stage, a financial officer’s job is to provide a variety of services to his/her customers, while interacting with clients, he/she also represents the image of the bank. Recently, this profession has received a lot of attention from the public due to its debate on whether it serves the customer any good. Besides the fad over the establishment of priority banking services, many newspapers, TV programs also expressed the negative responses by customers regarding the service they received from wealth management banks that their personal account officers did not fully disclose the relevant product information to them and as a result caused serious losses in their investment. By examining bank’s account officers’ perception on their assigned quota difficulty, customer orientation, job satisfaction and turnover intention; I hope to identify the interrelationship among the four variables.. To this end, I will first. provide a literature overview of the above-mentioned variables as well as a review of the banking- wealth management industry and the job characteristics of account officers. Based on my literature review, I will further propose a research framework to explain the influence of account officers’ perception on their quota difficulty and their customer orientation, job satisfaction and turnover intention. By collecting and processing the empirical data, results for this research can be generated.. Lastly, I. will conclude this study by highlighting the implication of the research findings, and hopefully can provide contributable information and suggestion to practitioners and academic researchers of related fields.. 3.
(14) Chapter 2: Literature review In service industry, customer-contact sales employees are one of the critical contributors to the success (or failure) of their firms, there has been a great deal of research interest in exploring various aspects of selling situation and desirable sales behaviors (Schwepker and Good, 1999). Numerous studies have designed to extend our understanding of salespeople’s situation and their behavior, such as individual seller qualities (e.g. Swenson and Herche, 1994), client relationship (e.g., Anderson, Hakansson, and Johanson, 1994) and sales quotas (e.g., Darmon, 1997; Good and Stone, 1991). Although only limited attention has been given to sales quotas, it represents as one critical facet of marketing compensation (Darmon, 1997; Good and Stone, 1991), and according to Schwepker and Good (1999), sales quotas clearly direct some selling behavior. In this section, I will discuss sales quotas and their influential impact on sales behavior in detail.. 2.1 Perceived Quota Difficulty In its most basic format, sales quotas are defined as an objective for the sales unit that is widely accepted as a standard of performance measurement (Good and Stone, 1991). Important objective of sales quotas is to channel “salespeople’s efforts according to management’s priorities and/or for offering convenient benchmarks against which actual sales performance can be assessed and controlled” (Darmon, 1997).. For example, when salespeople are assigned quotas for designated. products/services, the organizational intent is to direct sales efforts to these products/services.. Hence,. sales. quotas. represent. specific. outcome-based. performance measures designed for controlling and evaluating sales people in a setting where the individual is held responsible for its results, but not on how the goals have been achieved (Anderson and Oliver, 1987).. In this setting, the use of. sales quota is a catalyst affecting attitudes, motivations strategies, and performance. (Oliver and Anderson, 1994). 4.
(15) 2.1.1 Perceived Quota difficulty and Sales Selling Orientation In general, quotas are widely used to forecast sales, establish standards of evaluation, and motivate salespeople (Anderson, Hair, and Bush 1988; Walker, Churchill, and Ford 1977). Research on quotas generally deals with a broad compensation and/or performance picture, and has not been applied within the direct context of specific selling conditions (quota assignments, strategic use, etc) explored in the study (e.g. Roberts et al., 1994; Sheperd and Ridnour, 1995). Quotas tend to focus salespeople on seeking immediate returns, which may be detriment of long-term results (Anderson and Oliver, 1987). On the other hand, while quotas obviously impact some selling conduct, it remains unclear the degree to which they influence other behaviors (i.e. Ethical conduct) critical to the selling environment. Unlike earlier studies that investigate relationships between compensation and unethical behavior (Bellizzi, 1995; Kurland, 1996), the premise of this analysis is not to examine the rewards received, but more importantly, a major process utilized to drive compensation, sales quotas. Moreover, sales quotas are also used as a motivator and a measure for performance, and they are key sales objectives that are widely used (Good and Stone, 1991; Walker et al., 1977). Despite that the actual composition of sales quotas (in volume, sales dollars, units, etc.) varies, it typically represents some aspect of sales volume (Jackson et al., 1983). Relationship between goals and outcomes suggests goals can foster negative outcomes (Locke and Latham, 1990). Accordingly, as quota is perceived to be increasingly difficult, it is posited that salespeople are more likely to engage in unethical behavior if it is perceived as necessary to make quota. (Wimbush and Shepard, 1994; Kurland, 1996; Schwepker and Good, 1999) When sales quota attainment is a dominant objective, ethical behavior may be perceived as an important sub-goal, only in so far as it does not detract from performance goals (Boomer et al., 1987). The use of perceived quota difficulty is important because it is more likely to have an effect on ethical judgment than the actual quota. Congruent with similar outcome-based research that is built upon such perceptions (Cravens et al., 1993; Oliver and Anderson, 1994; Schwepker and Good, 1999), these personalized observations provide realistic insights into how individuals visualize the interaction 5.
(16) between themselves and quota assignments, and provide the basis for my hypothesis proposed. Relevant studies (Abratt and Penman, 2002; Johnston and Kim, 1994; Lock and Latham, 1990; Oliver and Anderson, 1994; Schwepker and Good, 1999,) have expressed that if an individual’s perceived his/her quota as difficult and might likely engage in unethical events, which may affect the salesperson’s customer orientation. In the following section, I will further provide definitions of customer orientation and important research findings regarding it.. 2.2 Customer Orientation (CO) In salespeople’s everyday transactions, a key part of their function is to assist customer make purchase decisions that will satisfy customer preference (Saxe and Weitz, 1982; Spiro and Weitz, 1990).. Two selling strategies are widely discussed in. the literature, customer-oriented selling (or customer orientation) and sales-oriented selling (or sales orientation).. These two orientations differ both in terms of their. objectives and the means used to achieve objectives. Customers have preference both in the short-term and long-term.. Usually, immediate preferences (wants) are. felt and clearly articulated where as long-term preferences (needs) tend to be latent. A customer-oriented salesperson aims to discover and satisfy these latent needs.. In. fact, as stated by Saxe and Weitz (1982) mentioned that “highly customer oriented salespeople avoid actions which sacrifice customer interest to increase the probability of making an immediate sale.” On the other hand, the objective of sales orientation is to satisfy articulated customer preferences.. As items in the widely used “selling. orientation- customer orientation” (SOCO) scale make clear (Saxe and Weitz, 1982), the two selling orientations also differ with respect to means.. While customer. orientation puts emphasis on listening to customers (e.g. I try to find out what kind of product would be most helpful to a customer) and dialogue (e.g. I try to get customers to discuss their needs with me), sales orientation encourages opportunistic means (John, 1984) (e.g., I paint too rosy a picture of products to make them sound as good as possible), if these are necessary to make the sale.. 6.
(17) Work in this research stream can be traced to research conducted by Saxe and Weitz (1982), who found evidence that a two-dimensional “selling orientationcustomer orientation” measure (i.e. also known as the SOCO measure/scale) was connected to salesperson performance. They propose that customer-oriented selling is a behavioral concept that refers to the “degree to which salespeople practice the marketing concept by trying to help their customer make purchase decisions that will satisfy customer needs.” Customer oriented selling appears to help both the salesperson and his/her organization since it is related positively to customer relationships (Williams and Attaway, 1996). The current body of literature examining SOCO indicates that it is important from a salesperson, organization and customer perspective (e.g. Dunlap et al., 1988; Goff et al., 1997; Swensen and Herche, 1994). Since the development of SOCO scale, it has generated researches interests in three general dimensions.. They. are (1) addressing measurement issues (Saxe and Weitz 1982); (2) identifying possible consequences of using a customer oriented or sales oriented approach (Keillor, Parker, and Pettijohn, 1999); and (3) Identifying potential organizational, personal, and attitudinal antecedents of salesperson SOCO (Baldauf and Cravens, 1999; Boles et al., 2001; O’Hara, Boles, and Johnson, 1991) In order to be customer oriented, the salespeople has to be motivated to expend their greater effort, relative to sales orientation (Saxe and Weitz, 1982). Motivation through effort is generated through rewards, with rewards being either intrinsic or extrinsic (Deci and Ryan, 1985). The feeling of accomplishment that arises from successful activity performance is regarded as an intrinsic motivator for it is a rewarding psychological state that is attained through successful activity performance (Brown et al., 1993; Hall, 1976).. Conversely, compensation that is received in. exchange for activity performance enables the individual to obtain outcomes of value and thus is seen as an extrinsic motivator (Lawler, 1971, 1973). As mentioned by Thakor. and. Joshi. (2003),. experienced. meaningfulness. and. organizational. identification foster the feeling of accomplishment, in turn motivating the individual to engage in customer orientation via intrinsic means, and pay satisfaction foster salesperson’s ability to procure valued outcomes, thereby promote individual’s motivation to employ customer orientation via extrinsic means. 7.
(18) Moreover, research conducted by Boles et al. (2001) demonstrated that a firm’s customer orientation, centralization and employee perceptions of support from individuals in the organization were significantly related to customer orientation, selling orientation or both.. Firm level customer orientation and perceptions of work. environment support were positively related to a salesperson’s degree of customer orientation and negatively related to selling orientation. Customer orientation was positively related to performance, while selling orientation was not related.. From a. performance perspective, for example, a study of residential real estate salespeople, top-performing salespeople reported higher levels of customer-orientation than equally experienced, but less successful, realtors (Dunlap et al., 1988).. Likewise, in. a business-to-business sales settings, Swensen and Herche (1994) reported that customer orientation was related to higher performance. Two different studies have also found that organizational commitment is positively related to customer orientation (Donavan, Brown, and Mowen, 2004; Kelley, 1992; O’Hara et al., 1991).. If a firm is perceived as being customer oriented,. salespeople for that firm are more likely to practice customer oriented selling (Flasherty, Dahlstrom, and Skinner 1999).. Favorable organizational culture. perception (Williams and Attaway 1996) and organizational climate (Kelley, 1992) are positively related to an employee adopting a customer orientation. Job satisfaction is also positively related to customer oriented selling (Hoffman and Ingram, 1991, 1992; Pettijohn, Pettijohn, and Taylor, 2002) and that service worker dispositional customer orientation will lead to job satisfaction (Donavan, Brown, and Mowen, 2004). Since salespeople play a critical role in developing mutually beneficial buyer-seller relationship (Crosby, Evans, and Cowles, 1990; Jackson, 1985), research that examines personal characteristics associated with salesperson behavior and job satisfaction is often of both practical and theoretical interest.. In the following. section, The study will further discuss the relationship between selling orientation-customer orientation, sales job satisfaction and turnover intention in the sales force.. 8.
(19) 2.3 Job satisfaction and turnover intention Job satisfaction refers to an employee’s affective reactions to a job, based on comparing desired outcomes with actual outcomes (Cranny, Smith, and Stone, 1992). In this study, we tend to investigate the relationship among the salespeople’s perceived quota difficulty, customer orientation, job satisfaction, and turnover intention. Due to differences in individual’s perceptions of assigned quota difficulty, salespeople’s selling behavior may vary from one to another, and result important impact on the individual’s job satisfaction and turnover intention. In order to better understand the nature of an employee’s job satisfaction and determinants of turnover intention, I will explain in detail the definitions and studies relevant to job satisfaction and turnover intention in association with the setting of salespeople’s perceived quota difficulty and customer orientation.. 2.3.1 Job Satisfaction (JS) Locke (1969) defined job satisfaction as “the pleasurable emotional state resulting from the appraisal of one’s job as achieving or facilitating the achievement of one’s job values.” Job satisfaction is generally acknowledged as a multifaceted construct that includes both intrinsic and extrinsic job elements (Howard and Frick, 1996). Job satisfaction may be both intrinsic, derived from internally mediated rewards such as the job itself and opportunities for personal growth and accomplishment, and extrinsic, resulting from externally mediated rewards such as satisfaction with pay, company policies and support, supervision, fellow workers, chances for promotion and customers (Walker et al., 1977). Porter and Steers (1973) argued that the extent of employee job satisfaction reflected the cumulative level of met worker expectations.. That is, employees. expect their job to provide a mix features (such as pay, promotion, autonomy, etc.) for which each employee has certain preferential values. The range and importance of these preferences vary across individuals, but when the accumulation of unmet expectations becomes sufficiently large, these is less job satisfaction and greater probability of withdraw behavior (Pearson, 1991). 9. In fact, some interest in job.
(20) satisfaction is focused primarily on its impact on employee commitment, absenteeism, intentions to quit, and actual turnover (Agho, Mueller, and Price, 1993). Several studies from a variety of occupations indicate that individuals’ job satisfaction is related to their perceptions of aspects of the firm’s organizational climate (Kaczka and Kirk, 1968; Friedlander and Margulies, 1969; Schneider, 1972; Schneider and Snyder, 1975; Pritchard and Karasick, 1973; Downey et al., 1974; Churchill et al., 1976; Ostroff, 1993; Pierce et al., 1996; Johnson and McIntye, 1998). For example, Research conducted by Schewepker (2001) suggested that salespeople’s perceptions of a positive ethical climate are positively associated with their job satisfaction and organizational commitment. There are numerous investigations that have studied the relationship between organizational commitment and job satisfaction (Currivan, 1999). The nature of the causal relationship between job satisfaction and organizational commitment is an issue that has not been resolved.. The predominant view is that job satisfaction is an. antecedent to organizational commitment (Lincoln & Kalleberg, 1990; Mowday, Porter, & Steers, 1982; Mueller, Boyer, Price, & Iverson, 1994; Williams & Hazer, 1986). There is also some support for the reverse causal ordering, organizational commitment as an antecedent to job satisfaction (Vandenberg & Lance, 1992). A recent meta-analysis on turnover research indicates that organizational commitment predicts turnover better than job satisfaction (Griffeth et al., 2000). These findings suggest that job satisfaction may be a more distal influence upon turnover intentions than organizational commitment.. Based on this finding from the meta-analysis and. the dominant view in the satisfaction – commitment research, the hypothesized model proposes that job satisfaction is an antecedent to organizational commitment which is turnover intention’s antecedent. Aspects of the work situation have been shown to be determinants of job satisfaction (Arvey, Carter, and Berkley, 1991).. Often, facet measures are averaged. together for an overall measure of satisfaction (Wright and Bonett, 1992). Fraser, Keck, and Kim (2002) argued that a viable theory of job satisfaction in the modern workplace must support the validity of reported employee perceptions, which spring from organizational culture. Research suggests that job satisfaction, as work-related outcome, is determined by organizational culture and structure. Kim (2002) suggested 10.
(21) that participative management that incorporates effective supervisory communication can increase employee’s job satisfaction. Wagner and LePine (1999) conducted a meta-analysis and revealed significant impacts of job participation and work performance on job satisfaction.. Daniels and Bailey (1999) concluded that. participative decision making enhances the level of job satisfaction directly, regardless of strategy development processes. Studies also found that empowerment had a significant impact on job satisfaction and performance (Eylon and Bamberger (2000). Moreover, studies on leadership behaviors related to inspiring teamwork, challenging tradition, enabling others, setting examples, and rewarding high performance have been found to have significant effects on role clarity, self-efficacy, and job satisfaction (Gaertner, 2000).. In a study of organizational culture and climate, Jonhson and. McIntye (1998) found that the measures of culture most strongly related to job satisfaction were empowerment, involvement and recognition.. These measures. reflect clearly the learning culture advocated by theorists of the learning organization (Watkins and Marsick, 1993, 2003). In addition, in the previous review, research has indicated that sales quota is often considered as a measure of salespeople’s job performance. The relevant studies of the relationship between job performance and job satisfaction have a controversial history.. A 1985 literature review suggested that the statistical correlation between. job satisfaction and performance was about 0.17 (Iaffaladano and Muchinsky, 1985). Thus these authors concluded that the presumed relationship between job satisfaction and performance was a “management fad” and “illusory”.. In addition in a more. recent review of 301 studies, Judge, Thoresen, Bono, and Patton (2001) found that when the correlations are appropriately corrected, the average correlation between job satisfaction and job performance is 0.30.. In addition, the relationship between job. satisfaction and job performance was would to be even higher for complex (e.g., professional) jobs that for less complex job. Hence, opposite to earlier review, it appears that job satisfaction is predictive of performance, and the relationship is even stronger for professional jobs.. 11.
(22) 2.3.2 Perceived quota difficulty and job satisfaction Conventionally, sales quotas are considered a measure of performance.. While. quotas are perceived as hard to achieve, poor performance will result. When goals appear to be out of reach, motivation for achieving target drops as expectations regarding goal achievement diminishes.. Decreases in motivation are likely to yield. lower achievement level. Tension may escalate between salesperson and managers as conflict arises concerning goals, resulted in a variety of damaging consequences such as reduced organizational commitment and job satisfaction (Good and Schwepker, 2001; Oliver and Anderson, 1994).. 2.3.3 Customer orientation and job satisfaction From studies conducted by Boles et al. (2001) indicated a positive relationship observed between a customer orientation and job performance, which in turn will lead of higher job satisfaction.. Previous literature from business to business (Saxe and. Wetiz, 1982) and non-store retail selling environments (Dunlap et al., 1988) indicated that customer-oriented selling approaches can result in superior performance. Salespeople will be motivated to expend the additional effort that is required by customer-oriented selling if feeling of accomplishment can be experienced, which is a factor associated with job satisfaction (Hall, 1976). Experienced meaningfulness fosters the activity importance by making the work “count” in salesperson’s own system of values (Hackman and Oldham, 1980).. 2.3.4 Turnover Intention (TI) For the purpose of this study, turnover intension is defined as a conscious and deliberate willingness to leave the organization (Tett and Meyer, 1993).. According. to Trevor (2001), most major voluntary turnover models are descendents of the March and Simon (1958) model.. Due to the practical implications and potential for. productivity impact, employee turnover has been studied by researchers in multiple disciplines for a long period, often exploring the inverse relationship to job 12.
(23) satisfaction. Variables theorized to influence turnover and turnover intentions include job satisfaction, organizational commitment, role stress, ethical climate, supervisory variables, and environmental variables.(Apasu, 1986; Bluedorn, 1982; DeGeorge, 1990; Fishbein, 1967; Mathieu and Zajac, 1990; Mobley, 1982; Tett and Meyer, 1993) Previous studies have identified numerous variables that may predict employee turnover (Griffeth, Hom, & Gaertner, 2000; Kirschenbaum & Weisberg, 2002; Price, 2001; Zeffane, 1994). These variables fall into the categories of: employee characteristics, such as age, education, gender, tenure, and family responsibilities; nature of the current job, such as security, skill variety and autonomy, job stress, and job satisfaction; nature of the current organization, such as supervision, pay and benefits, and current performance rating; and external conditions such as the unemployment rate (Fields et al., 2005). Human Resources Management related fields have examined turnover and turnover intention in association with job satisfaction, organizational commitment, personality, aptitude, intelligence, governmental policies and rates of unemployment (Hatcher, 1999; Sturman et al., 2003). When a sales representative initiates its thought about leaving his/her current job, he/she is also likely to consider other opportunities and actively search for them.. If. the opportunities are not available or does not seem too attractive, the salesperson may choose to “withdraw’ from the organization, disengaging emotionally, and mentally, resulted increasing absenteeism and lessen enthusiasm and effort. Whether the actual resignation takes place or not, the invisible cost applied to the organization is rather significant; result of increased hiring and training costs or lost sales and poorer customer relations (Russ and McNeilly, 1995). Doubtlessly, managers and researchers are seeking to understand the causes for turnover intention for its underlying costs as well as its immediate attitudinal predecessor to actual turnover (e.g. Sager et al., 1989). Empirical efforts to identify circumstances that will cause sales representatives and other employees to consider leaving an organization have been rather frequent. Intention to leaving appears to be the immediate precursor to actually quitting. 13.
(24) It is consistent with Fishbein’s (1967) model of attitudes, intentions and behavior and its use is commonly endorsed in the literature as a predictor of turnover (Mobley, 1977, 1982). A literature review by Bluedorn (1982) cited 23 studies which reported finding significant positive relationships between leaving intentions and actual leaving behavior. There have been several models of turnover proposed in the last two decades. Horn and Griffeth (1995) and Maertz and Campion (1998) provide comprehensive summaries of the various theoretical frameworks.. Past investigations have shown. that job satisfaction and organizational commitment are antecedents to turnover intention (Arnold & Feldman, 1982; Horn and Griffeth, 1995; Mobley, 1982; Mobley et al., 1979; Porter et al., 1974; Slattery and Selvarajan, 2005).. In line with these. results, in the proposed model, job satisfaction and organizational commitment are depicted as antecedents to turnover intention.. For this study, job satisfaction was. defined as positive emotions an employee has toward his or her job (Locke, 1976); organizational commitment as the extent to which individuals feel loyal to their organization (Price, 1997); and turnover intention as one’s propensity to leave (Lyons, 1971). There is a substantial body of literature that has reported that job satisfaction is negatively related to turnover intention (Currivan, 1999; Griffeth, Horn, and. Gaertner, 2000). Extending these findings to the current research, in the model there is a direct path between job satisfaction and turnover intention. Again, there is a substantial body of research that has found that organizational commitment is negatively related to intention to quit. (Horn & Griffith, 1995; Mathieu & Zajac, 1990; Mowday et al., 1982).. 2.4 The Banking Industry-Wealth Management Overview The present study examines the relationship between the salespeople’s perceived quota difficulty, customer orientation, job satisfaction, and turnover intention among financial officers. Financial officers make an interesting group to study when examining these relationships. In this section, I will explain the content of wealth 14.
(25) management services and the job of a financial officer, and then give an overview on the domestic wealth management market in Taiwan.. 2.4.1 “Wealth Management” Services In Taiwan, the names being used for the wealth management department may differ from banks to banks, and their corresponding target customer segmentation may also vary, so far there have not been a formal definition available regarding wealth management services.. The term wealth management has also been named as the. “Mass Affluent”, “Affluent Banking”, “Privilege Banking”, “Priority Banking”, “Personal Banking”, etc.. Hence, for the purpose of this study, wealth management. services is defined as a specific banking sector targeting those customers having accessible liquid asset over NT$ 3,000,000 deposited in financial institutions, providing one-stop shopping financial services to them. Via different channels and medium, provide integrated and yet personalized services, such as personal financial planning, investment and savings, protection (life & illness), income replacement, pensions & retirement portfolio, mortgages/ property investment and asset management services.. wealth and. Wealth Management banking service is one of the most. attractive businesses in financial services offering steadily growing revenue while requiring relatively little commitment of capital. By utilizing different financial tools, hoping to effectively provide asset management, protect customer’s assets from risk erosion and offer diversified investment portfolio and seeking to offer attractive in return.. Simply speaking, the wealth management services simplest definition is to. manage one’s wealth and asset based on different stages of each individual’s lifetime needs.. It involved at least five aspects of services, namely asset protection, taxation. planning, risk management, guarantee allocation and investment planning. On the other hand, financial advisor, also known as personal account officer, customer relationships manager, are the ones that work for the wealth management department in banks and offer personalized financial services to their mass affluent customers.. In general, the financial advisors are the bridge between the customer. and the bank. They act as the liaison between what banks can offer to their wealthy customers. Banks, like any business, offer services to sell and need customers to buy 15.
(26) them.. Seeking the consumer’s dollar in the face of tough competition relies on the. efforts of financial advisors. The role of financial advisor is to offer investment, tax, trust advices for a fee collected by the bank. They deliver tailored advice to allow customers to make informed decisions about their wealth. Since this ‘new service’ has only been introduced to Taiwan in recent years, hence the financial advisor’s guidance is primitive and generally limited to cross-selling a bank’s own products. The success of selling of services heavily relies on the officer’s customer relationship management skill as well as their professional expertise. Financial advisors are generally assigned a monthly or quarterly sales quota to achieve, mostly are calculated based on fee income, new customer account attrition as well as their customers asset under management. Usually, once assigned quota has been achieved, monthly/quarterly or annually reward/incentive will be granted to the salesperson.. The most frequent type of reward in the banking practice will be. offering monetary reward or traveling incentives.. 2.4.2 Overview on the domestic wealth management market Foreign financial institutions have been offering wealth management or private banking services for many decades, but this concept has only been brought into Taiwan only over the past few years.. The main reason was that, (1) the. accumulation of personal asset was reflected on the increasing scale of disposable income, and it has only been significantly increasing over the past decade; (2) the grave global recession between 2000~2004 raised the demand and awareness of fixed income related financial products; (3) due to the financial liberalization over the past few years and the release of many new government legislation, and since foreign banks have been experienced wealth managers, offering flexible financial tools, thus provide a new market opportunity for the domestic banking whose main income was primarily from gaining deposit/loan spread and now opened an innovative way of creating revenues; hence, this service started to gain local banks’ attention. Wealth management’s greatest attraction is that, in spite of add-on services, it is principally about asset management- investing customers’ money in return for a fee. 16.
(27) Those fees, particularly in difficult or recession periods, it is so welcomed like a lifesaver and a cash cow for the banks. While it provides stable income compared to the troublesome transactions of deal-making and lending. What makes it even more attractive is that it does not impose any burden on bank’s need for additional capital. According to the relevant research conducted by Solomon Smith Barney (2003), Taiwan has been a promising land. The domestic family’s liquid assets over NT$ 3,000,000 is about 450,000 accounts.. In the coming ten years, its annual growth is. estimated at 7~14% growth rate. By year 2010, the figure is estimated to double to over 1,000,000 accounts. Compare this data with those of more mature regions like the United States and Europe, Taiwan is considered as a fertile virgin land yet to be explored. And likewise, it attracted many world-known foreign banks entering the Taiwanese personal banking market sector over the past few years. The affluent banking service was first inaugurated by CitiBank Taiwan in 1999, using CITIGOLD as their logo to offer high asset customers one-on-one services. Over the past three years, Citibank Taiwan gained a very appealing growth rate of 69% merely from investment transaction and account management fee income. That is why banks of every description in Taiwan are plunging into this sector, launch new or reorganizing and renaming existing offering as such and unquestionably the demand for positions like personal account officers or financial advisors has reached to its peak. However, with intense competition from both domestic and foreign banks, and the rise of recent unemployment rate in Taiwan, the jobs is no longer considered stable and since sales related tasks are assigned across the entire institution which may result important impact on employees job satisfaction and further influence their turnover intention.. Simultaneously, it will have parallel effect on employee’s. customer orientation, which may influence the employee’s service quality and jeopardize customer’s goodwill.. 17.
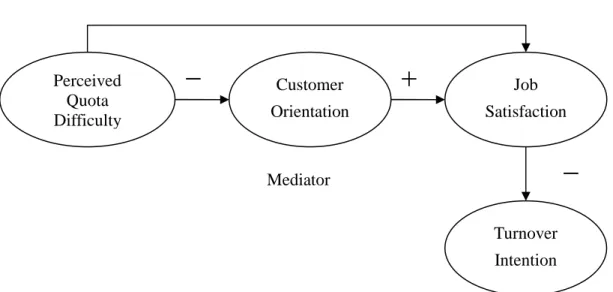
(28) Chapter 3: Research Hypothesis and Methodology 3.1 Theoretical Framework The conceptual framework that guided this study is shown in Figure 1.. After studied. over past relevant research, this study aims to explore a salesperson’s (namely the financial officers working at the Wealth Management Banking Services) perceived quota difficulty and its impact on his/her customer orientation and on the individual’s job satisfaction and turnover intention.. − Perceived Quota Difficulty. −. Customer. +. Orientation. Job Satisfaction. −. Mediator Turnover Intention. Figure 1: Conceptual Model of the effect of perceived quota difficulty, customer orientation, job satisfaction and turnover intention.. 18.
(29) Based on the abovementioned research objective and relevant literature review, the purpose of this research is to explore the following hypothesis:. H1-a:. Salespeople’s perceived quota difficulty will have impact on his/her customer orientation. H1-b:. Once salespeople’s perceived quota difficulty increases, it will have negative effect on his/her customer orientation. H2-a:. Salespeople’s perceived quota difficulty will have impact on his/her job satisfaction. H2-b:. Once salespeople’s perceived quota difficulty increases, it will have negative effect on his/her job satisfaction. H3-a:. Salespeople’s customer orientation will have impact on his/her job satisfaction. H3-b:. If salespeople’s customer orientation behavior is stronger, it will have positive effect on his/her job satisfaction. H4-a:. Salespeople’s job satisfaction will have impact on his/her turnover intention. H4-b:. Once salespeople’s job satisfaction increases, it will have negative effect on his/her turnover intention. H5:. Customer orientation may act as a mediator between salespeople’s perceived quota difficulty and job satisfaction. 19.
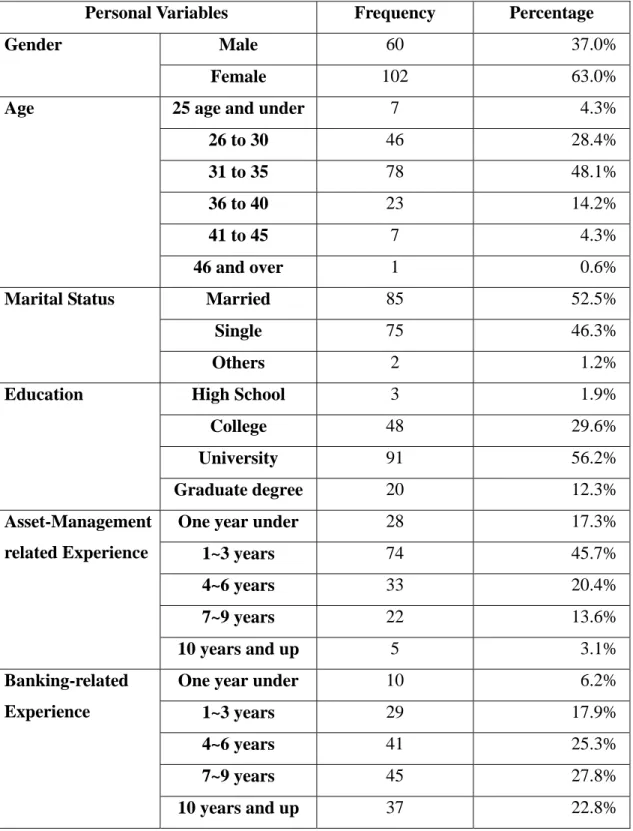
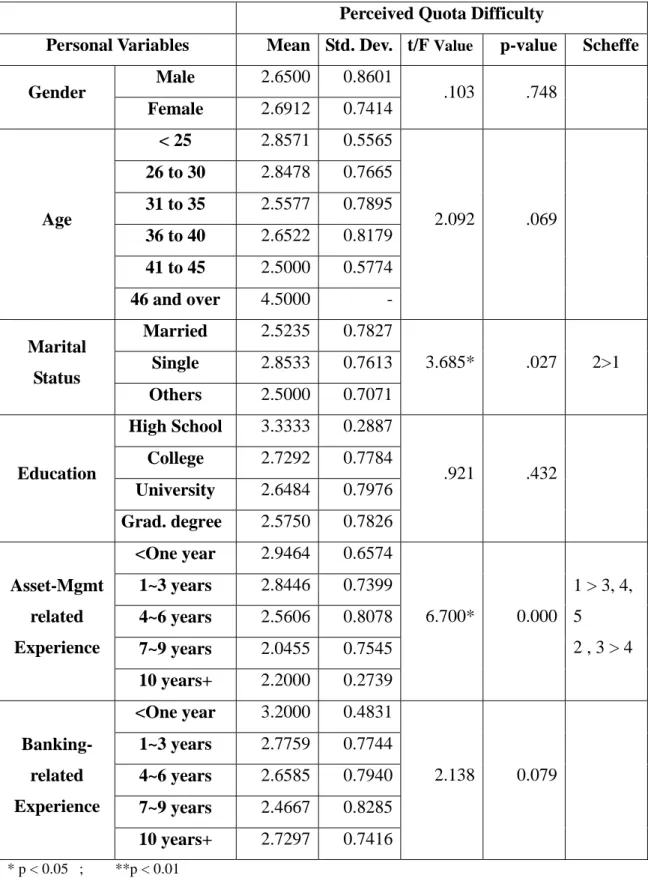
(30) 3.2 Method A survey research method was used to investigate the effect and the relationships among financial advisor’s perceived quota difficulty, customer orientation, job satisfaction and intention to turnover.. The use of an employee. survey was deemed appropriate to address the proposed researched questions.. 3.2.1. Sample and Data Collection Participants were financial advisors/ personal account officers employed by. banks that offer wealth management services.. All interviewee are full-time. employees and work in Kaohsiung. Over 250 surveys were distributed to well-known banks that offer wealth management services and have branch offices located in Kaohsiung. Total of 170 surveys were collected, with 8 surveys being unusable. A response rate of 68% was obtained with 3.2% of non-valid survey. This return rate was determined to be acceptable for several reasons. This was an optional questionnaire and the nature of the research questions likely reduced the return rate. As Good and Stone (1995) noted, there are occasions when marketing respondents are asked confidential questions which can be expected to reduce their response rates. Hence, although anonymity is guaranteed, it is reasonable to conclude that the nature of these questions (turnover intention) would discourage some respondents from completing the questionnaire.. Additionally, as characterized by previous study, non response is. more common when salespeople are used.. In our case, personal account officer/. financial advisor are defined as a salesperson position in a bank and bear in mind that this study has no sponsorship nor provided with inducements (Swenson and Herche, 1994).. 3.2.1.1. Sample Details Of the valid questionnaire, participants included 60 males, 102 females. 20.
(31) Approximately 52.5% of the respondents were married.. The percentage of. participants who fell into the different categories for age included: 4.3% in the 25 age and under group; 28.2% in the 26 to 30 age group; 47.9% in the 31 to 35 age group; 14.1% in the 36 to 40 age group; 4.3% in the 41 to 45 age group; 0.6% in the over 46 age group.. The majority of the interviewees have at least university/ college degree. (85%). Account Officers’ relevant advising experiences is mostly lies in the 1 to 3 years of experience (45.4%) and 4 to 6 years of experience (20.2%). Their relevant banking experience are much longer than their advisory experience, over 77% have at least 4 years of banking experience.. Participants were informed that their individual. responses would be confidential and thus not available to anyone at their servicing organizations.. 3.2.2. Operationalization of study variables Measures used in this study were taken from existing measures found in the. marketing, business research as well as organizational behavior literature.. Few items. were adapted slightly to make them more consistent with the banking environment where the study was conducted. Sample items for each measure can be viewed in Appendix I. Demographics 1. Gender: divided into two groups, male(1) or female (2) 2. Age: based on respondent’s actual age, divided into six age groups, age 25 and under (1); 26 to 30 age group (2); 31 to 35 age group (3); 36 to 40 age group(4); 41 to 45 age group (5) and over 46 age group(6). 3. Marital Status: divided into three categories, married(1), single(2),and others (3) 4. Education Level: divided into four groups, namely, high school and under(1); college(2); university(3), graduate school(4) 5. Financial Advisory Related Experience: for the purpose of this research, the financial advisory related experience is only relevant to the position the respondent is in, i.e. wealth management service related experiences.. Divided. into five categories: less than one year (1); 1 to 3 years (2); 4 to 6 years (3); 7to 9 21.
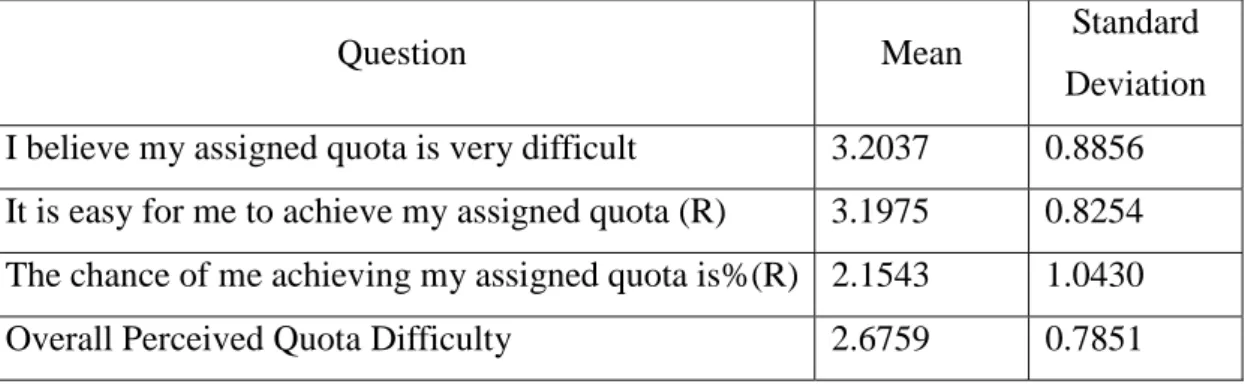
(32) years (4); over 10 years (5) 6. Banking Related Experience: for the purpose of this study, it include all banking experiences both operational and other department experiences and does not exclude previous banking related experiences with other employers.. Similar to. previous question, it is also divided into five groups: less than one year (1); 1 to 3 years (2); 4 to 6 years (3); 7to 9 years (4); over 10 years (5). Perceived quota difficulty (QD) In this study, the focus is only limited to externally assigned quota. Most often, sales quotas are reconsidered to be task goals or performance targets assigned by management team or by sales managers.. Unlike self-set performance targets, the. externally assigned goals may result two offsetting effects must be considered, i.e. if the managers set the quotas too high, the salesperson may be discouraged and decrease his/her motivation; on the other hand, if goals are set too easy, individuals may not work to their maximum potential. It was measured with a three-item scale developed by Schwepker Jr. and Good (1999) via discussions with several sales managers and salespeople. Two items used five-point Likert scales ranging from (1) “strongly disagree” to (5) “strongly agree”, while the third asked respondents to assess their chances of achieving their assigned quota on a five-point scale ranging from (1) “under 20% achievement” to (5) “over 80% achievement.. After reverse coding items two and three, responses were. summated such that higher scores indicate more difficult quotas. Since Schwepker Jr. and Good (1999)’s questionnaire has already been used and adopted in relevant studies in Taiwan, and has been translated into Mandarin. (Chen, 2002). Hence, this. study has adopted the same questionnaire to avoid translation bias and used it as a reference. Higher score for this section signify the individual’s perception of his/her assigned goal as being more difficult.. 22.
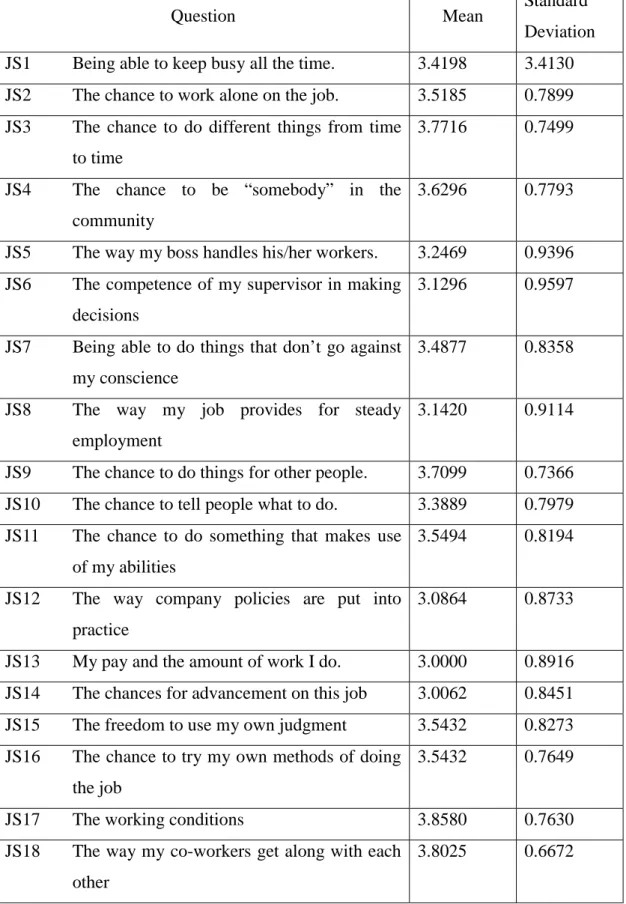
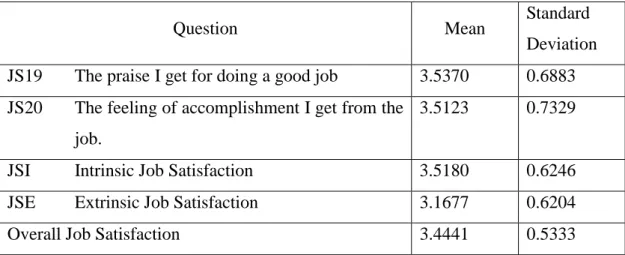
(33) Customer Orientation (CO) It was assessed by adapting relevant items from the existing Saxe and Weitz (1982) SOCO scale (selling orientation-customer orientation scale).. All four. questions used five-point Likert scales ranging from (1) “strongly disagree” to (5) “strongly agree”.. Adaptations to the customer orientation scale such as those. proposed in the study are reported in prior published researches (e.g. Brown et al., 2002; Cravens et al., 1993).. Higher score for this question stands for the. salespeople’s favorable customer orientation.. The Saxe and Weitz (1982) SOCO. scale questionnaire has been widely used and adopted in relevant studies in Taiwan, and has been translated into Mandarin Chinese (Chu, 2002).. Hence, the same. questionnaire has been adopted in this study to avoid translation bias and used it as a reference.. Job Satisfaction (JS) It was derived from the Minnesota Satisfaction Questionnaire (MSQ) short form. This form consists of 20 items from the long-form MSQ that best represent each of the 20 scales. Factor analysis of the 20 items resulted in two factors—Intrinsic (JSI) and Extrinsic (JSE) Satisfaction. Scores on these two factors plus a General (JSG) Satisfaction score may be obtained.. All 20 questions used a five-point Likert scale. ranging from (1) “strongly disagree” to (5) “strongly agree”. The higher the score, the more satisfied the respondent is related his/her existing job. The Minnesota Satisfaction Questionnaire (MSQ) short form has been widely used and adopted in relevant studies in Taiwan, and has been translated into Mandarin Chinese (Yu, 2001). Hence, the same questionnaire has been adopted to avoid translation bias and used it as a reference. Of the twenty questions related to job satisfaction, they are divided into three subgroups namely: intrinsic job satisfaction, extrinsic job satisfaction and general job satisfaction. The questions corresponding to the three subsections are as follow:. 23.
(34) Factor 1: Intrinsic Job Satisfaction (Questions: 1,2,3,4,7,8,9,10,11,15,16,20) JS1. Being able to keep busy all the time.. JS2. The chance to work alone on the job.. JS3. The chance to do different things from time to time. JS4. The chance to be “somebody” in the community.. JS7. Being able to do things that don’t go against my conscience .. JS8. The way my job provides for steady employment. JS9. The chance to do things for other people.. JS10. The chance to tell people what to do.. JS11. The chance to do something that makes use of my abilities. JS15. The freedom to use my own judgment. JS16. The chance to try my own methods of doing the job. JS20. The feeling of accomplishment I get from the job.. Factor 2: Extrinsic Job Satisfaction (Questions: 5,6,12,13,14,19) JS5. The way my boss handles his/her workers.. JS6. The competence of my supervisor in making decisions.. JS12. The way company policies are put into practice. JS13. My pay and the amount of work I do.. JS14. The chances for advancement on this job. JS19. The praise I get for doing a good job. Factor 3: General Job Satisfaction (Sum all 20 questions together) JS17. The working conditions. JS18. The way my co-workers get along with each other. Turnover Intention (TI) It was measured with four items from the literature (Horn & Griffeth, 1995; Mowday, Koberg, & McArthur, 1984). Propensity to leave was assessed using a four item instrument (Lyons, 1971). Subjects were asked to rate their intention that. 24.
(35) they would quit the existing job or change work units in the near future.. Anchor. points on 5-point Likert item scales ranging from (1) “strongly disagree” to (5) “strongly agree”, with higher scores signify stronger intention to resign from existing job. The turnover intention questionnaire has been widely used and adopted in relevant studies in Taiwan, and has been translated into Mandarin Chinese (Hsueh, 2002).. Hence, the same questionnaire has been adopted to avoid translation bias. and used it as a reference.. 3.2.3. Measure and Analysis assessment Upon completion of questionnaire collection, the data obtained from the. questionnaire has been coded and organized in accordance with the sequence of research structure.. By using SPSS statistical software as the analyzing tool to. conduct the following analysis: 1.. Reliability test: conducted to all variables under survey, Cronbach’s alpha value will be used to testify data’s reliability.. 2.. Descriptive Statistics for all variables. 3.. Analysis of Variance: using one-way Anova to test the difference demographic variables’ variance with respect to each of the variables under research, namely, perceived quota difficulty, customer orientation, job satisfaction and turnover intention.. Pot hoc tests, like Scheffe’s test will be used to further understand. whether difference among groups were significant. 4.. Correlation Analysis: by utilizing Pearson’s Product Moment Correlation to analyze the relationship between perceived quota difficulty, customer orientation, job satisfaction and turnover intention.. 5.. Regression Analysis: used to analyze the causal relationship between independent and dependent variables. the significance of the mediator factor.. 25. Lastly, using stepwise regression to test.
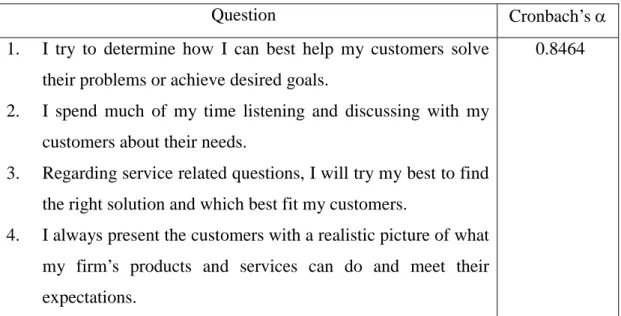
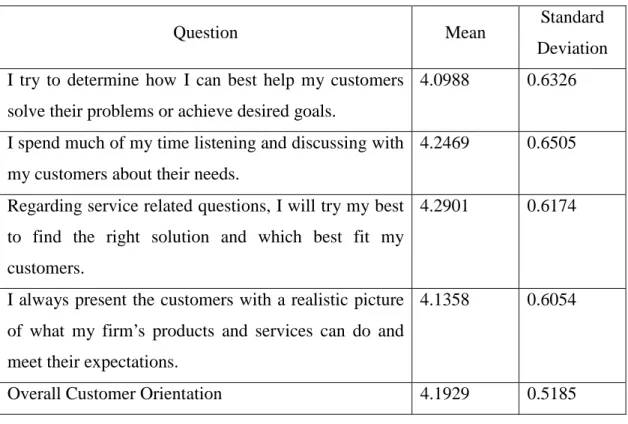
(36) Chapter 4: Measure Assessment Results 4.1 Reliability Test Prior to conduct any further study, reliability of the measures was assessed by using the coefficient alpha. Cronbach’s alpha is a measure of a scale’s internal consistency, also known as scale reliability coefficient.. It assesses the reliability of a. rating scale by summarizing the responses which attempt to measure some underlying factor. Nunnally (1967) recommended a Cronbach’s alpha equal to or greater than 0.6 as the minimum value sufficient for research purpose.. Cronbach (1951). recommended an alpha equal to or greater than 0.7. Since all scales under test have a Chronbach’s alpha greater than 0.7 except for the perceived quota (QD) scale only achieved a coefficient alpha of 0.6339, however it is still acceptable by Nunnally, and thus the overall scales have satisfactory reliability.. Refer to table 4-1~4-5 for each. factor under study. Table 4-1: Perceived Quota Difficulty Reliability Test (n=162) Cronbach’s α. Question 1.. I believe my assigned quota is very difficult. 2.. It is easy for me to achieve my assigned quota. 3.. The chance of me achieving my assigned quota is %. 0.6339. Table 4-2: Customer Orientation Reliability Test (n=162) Cronbach’s α. Question 1.. I try to determine how I can best help my customers solve their problems or achieve desired goals.. 2.. I spend much of my time listening and discussing with my customers about their needs.. 3.. Regarding service related questions, I will try my best to find the right solution and which best fit my customers.. 4.. I always present the customers with a realistic picture of what my firm’s products and services can do and meet their expectations. 26. 0.8464.
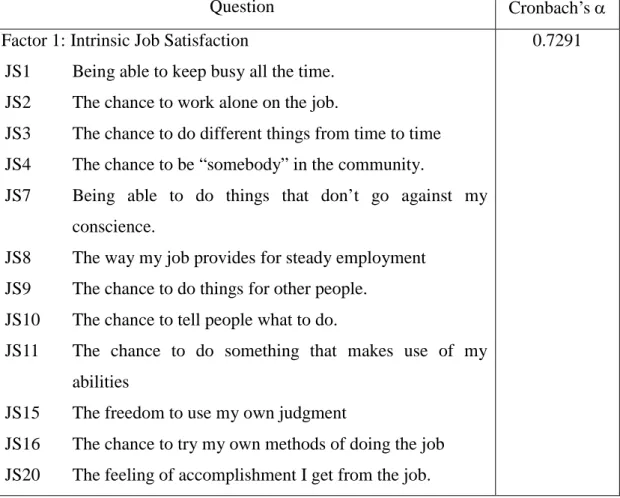
(37) Table 4-3: Selling Orientation Reliability Test (n=162) Cronbach’s α. Question 1.. It is acceptable for me that by manipulating my customer’s. 0.6599. weakness to close a deal. 2.. It is acceptable for me that if I am not sure a product/service is right for a customer, I will still apply pressure to get him to buy.. 3.. It is acceptable for me to persuade a customer to buy even prior to understand his/her needs.. 4.. It is acceptable for me to stretch the truth in describing a product to a customer.. Table 4-4: Job Satisfaction Reliability Test (n=162) Cronbach’s α. Question Factor 1: Intrinsic Job Satisfaction. 0.7291. JS1. Being able to keep busy all the time.. JS2. The chance to work alone on the job.. JS3. The chance to do different things from time to time. JS4. The chance to be “somebody” in the community.. JS7. Being able to do things that don’t go against my conscience.. JS8. The way my job provides for steady employment. JS9. The chance to do things for other people.. JS10. The chance to tell people what to do.. JS11. The chance to do something that makes use of my abilities. JS15. The freedom to use my own judgment. JS16. The chance to try my own methods of doing the job. JS20. The feeling of accomplishment I get from the job.. 27.
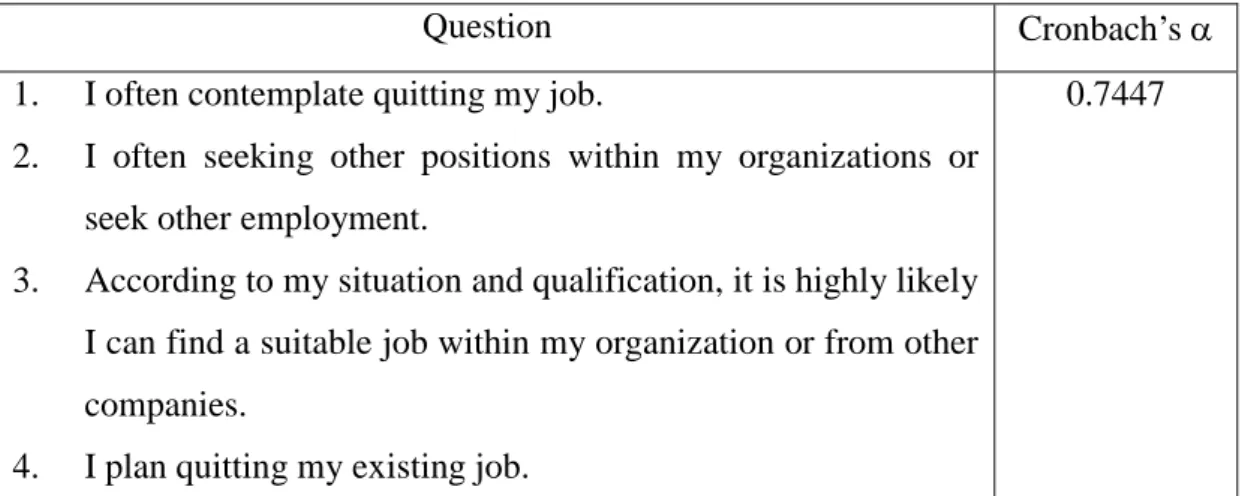
(38) Table 4-4: Job Satisfaction Reliability Test (n=162) (continued) Cronbach’s α. Question Factor 2: Extrinsic Job Satisfaction JS5. 0.8060. The way my boss handles his/her workers.. JS6. The competence of my supervisor in making decisions.. JS12. The way company policies are put into practice. JS13. My pay and the amount of work I do.. JS14. The chances for advancement on this job. JS19. The praise I get for doing a good job. Factor 3: General Job Satisfaction. 0.5760. JS17. The working conditions. JS18. The way my co-workers get along with each other. Overall Job Satisfaction. 0.8287. (Add All 20 Questions together). Table 4-5: Turnover Intention Reliability Test (n=162) Cronbach’s α. Question 1.. I often contemplate quitting my job.. 0.7447. 2.. I often seeking other positions within my organizations or seek other employment.. 3.. According to my situation and qualification, it is highly likely I can find a suitable job within my organization or from other companies.. 4.. I plan quitting my existing job.. 28.
數據
+7
相關文件
學校中層管理者是一個召集人,責任包括個別學科的教 學、對同工的計劃及工作的支持、資源管理、評核及記
以「照顧服務員、托育人員、擬真測試系統」等職類為徵求重點,分數以 30 分計;另為強化區域均衡,所在區域為花蓮縣、台東縣及離島地區者,每一辦
為了解民眾對本機關各項 為民措施及服務人員的評 價,委外辦理「整體服務 品質滿意度調查」 ,針對洽 公民眾、受訓學員、轄區
當年度各主管機 關(含所屬機 關)自行辦理或 薦送參加其他機 關辦理 1 日以上 之中高階公務人 員培訓發展性質 班別之中高階公 務人員(合格實
(主頁 > 學校行政及管理 > 財務管理 > 學校財務注意 事項 > 學校及其教職員收受利益和捐贈事宜參考資料 ). EDB ScExO Ind Prog
例如:會計人員、行政助理、代課老師....等 以提供行政支援,協助設立和執行財務及人力
並整合「 顧客關係管理」,以問卷調查方式,了解機械行業對「顧 客關係管理」的認知與狀況。 在前述的基礎下, 探討企業實施顧 客關係管理在
competitive strategy to explore in order to provide some of the domestic banking wealth management business recommendations, and thus enhance the stability of domestic
