The Effects of Tracking on Math Performance: Evidence
from the Junior High Students in Taiwan
Wei-Lin Chen Research Assistant
Center of Educational Research and Evaluation National Taiwan Normal University
E-mail: [email protected]
Ping-Yin Kuan Associate Professor Department of Sociology National Chengchi University E-mail: [email protected]
A paper prepared for the Spring Meeting on Social Consequences of Economic Uncertainty: Local and Global Perspectives, the Research Committee on Social Stratification and Mobility (RC28), International Sociological Association, May 9-11, 2010, University of Haifa, Israel.
The present study uses the method of propensity score matching and multilevel data to assess the causal effects of tracking on junior high students in Taiwan. Our research questions are: Would students who took part in high-achievement tracks have performed less well if they had not been tracked? Would students of low-achievement tracks have performed better if they had not been tracked? Who would benefit or suffer most from tracking?
With data gathered by Taiwan Education Panel Survey (TEPS) in 2001 and 2003, we focus on estimating the average treatment effect on the treated (ATT) by comparing separately the math performance of 9th of students who were assigned to
high-achievement (N=1,216) or middle/low-achievement tracking (N=1,383) to students who attended schools with no tracking system (N=3,266).
After obtaining each student’s propensity scores of participation in either high-achievement tracks or low-high-achievement tracks, we further stratify samples into five strata based on their math ability scores in the 7th grade to explore differential
treatment effects. The results of PSM analysis shows that tracking in general has positive effects on students of high-achievement tracks. The ATT of this track type is between 4 to 5 points. For students of middle/low tracks, the impact of tracking is inconclusive depending on the matching model. With the inclusion of school-level variables in the matching model, the result points to the direction that this track type would have a small negative effect on students’ math performance.
The findings further show that students with lower prior math ability would benefit more by being assigned to the high-achievement tracks. On the other hand, students with higher prior math ability would lose the most if they were assigned to the middle/low achievement tracks.
The Effects of Tracking on Math Performance: Evidence from the Junior High Students in Taiwan
Wei-Lin Chen & Ping-Yin Kuan
1. Introduction
Tracking in the form of separating students into different classes, courses, or course sequences based on their achievement is quite prevalent in junior high schools in Taiwan. Despite the practice of tracking is prohibited by the Ministry of Education and many advocators for educational reform protest strongly against the practice, schools use tracking to enhance student’s competitiveness in the high-stake
examination. The 9th graders of the junior high in Taiwan would need good test grades
to enter elite senior high schools. Schools operate the practice of tracking under various names, like gifted classes, to circumvent the restriction of law.
Tracking has been a controversial and much investigated issue in the past. Considerable research has focused on the impact of tracking on student performance (Hanushek & Woßmann, 2006; Pekkarinen, Uusitalo & Kerr, 2009). However, depending on the research design and the quality of the data, the effect of tracking may be positive, negative, or neutral (Kulik, 2004). Moreover, the effect of tracking differs from country to country (Gamoran, 2009). Tracking has been found to have a positive impact on student performance in countries with high-stake testing, such as South Korea and Israel. Taiwan is also a country with high-stake testing. The educational policy in Taiwan also offers a curriculum guideline which dictates the content of teaching and learning in junior high. Hence, it is possible that the effect of tracking in Taiwan may not be as negative as the Ministry of Education or educational reformers in Taiwan have contented.
Since it is not possible to conduct an experiment of tracking in Taiwan, in order to assess the effect of tracking, we have to use survey data and proper statistical
analysis like propensity scores matching to tell the difference of academic performance between the tracked and untracked groups. The present study uses longitudinal data collected by Taiwan Education Panel Survey (TEPS) in 2001 and 2003, and assesses the effect of tracking by comparing separately the math
performance of 9th of students who were assigned to high-achievement or
middle/low-achievement tracking to students who attended schools with no tracking system. The following sections will first discuss in more details about the possible effects of tracking, as well as the condition that may bring about the effect of tracking. We, then, state our research design and methods used to assess the effect of tracking. Finally, we describe the data used for this analysis and present our findings.
2. Tracking and its causal effects on students’ academic
performance
In the present study, tracking refers to a school’s practice of separating students into different classes, courses, or course sequences based on their achievement. Previous research findings about the effects of tracking have been inconsistent. The literature has debated about the impact of tracking and the proper method should be used to evaluate the effect of tracking. Both qualitative and quantitative methods have been used to evaluate the effect of tracking. Research with different designs and methods have shown tracking to have either positive, negative, or no significant effect on students’ academic performance.
2-1 Does tracking work?
The effect of tracking is probably the most controversial issue in the debate for or against the practice of tracking. Advocates of tracking believe that tracking benefits students’ academic performance and detractors, on the other hand, believe that
tracking would increase the achievement gap between tracked students. Previous empirical research shows divergent results.
Research on tracking in U.S. and U.K. has consistently shown that tracking was positive to the students who were assigned to high tracks and was negative to the students assigned to low tracks (Gamoran, 2009). Hence, tracking increases the achievement gap between high tracks and low tracks, and enlarges inequality. However, Hallinan (1994) has argued that tracking would decrease inequality if the criterion of tracking is students’ performance or grades.
Moreover, tracking has been found to be able to lessen achievement inequalities in Israel, South Korea and Taiwan. For instance, Kim, Lee & Lee (2008), after comparing the academic performance of high school students enrolled in either the mixing and sorting system in South Korea, found that sorting system helps students increase their test scores. Broaded (1997) investigated Taiwan’s situation and found that students benefited from tracking and the negative effect of disadvantage family has been lessened.
Gamoran (2009) maintained that the key condition that brings about the positive effect of tracking in Taiwan or South Korea is the high-stakes exam. This kind of exams leads governments to standardize the curriculum and assessment. Facing the exams, both teachers and students are committed to gaining high scores.
Consequently, to be successful in the exam is a strong incentive to both students and teachers, and the incentive results in favorable influence of the tracking.
2-2 The limitations of the past research
Kulik (2004) in his extensive review of prior research on tracking has divided the research into three kinds in terms of the research design: experimental, correlational, and ethnographic. Different research designs may lead to divergent findings of the
effect of tracking mentioned earlier. Kulik (2004) also believed that the most reliable evidence comes from experimental research, because of its elegant design and method. Since correlational analyses can’t control all the factors which may affect both student achievement and track placement, their causal effect is inconclusive. Ethnographic studies usually focus on their cases, and their results could not be generalized easily to other cases.
As Gamoran (2009) has argued, to investigate the effects of tracking and its causal relationship, we must distinguish the effects of track assignment from the effects of preexisting differences among students and its effects after tracking. If we can’t discern these two causes, we could make commit the mistake of selection bias, which could mislead our findings. Most of prior quantitative studies of tracking, however, used cross-sectional data which may not give sufficient information to account for selection bias fully. Longitudinal data, on the other hand, because of repeated observations of the same individuals, can be used more effectively to control selection bias and catch individual variation.
The investigation of the effect of tracking is further complicated by the fact the practice of tracking is offered by the school. Hence, to assess the effect of tracking, we not only have to control for individual preexisting differences, but also school differences. While methods with hierarchical linear modeling can be used to include the school-level variables in our examination of the impact of tracking (e.g.,
Gamoran, 1992), Arpino & Mealli (2008) points out that there is also the problem of selection bias at the cluster or group level, if one or more cluster level variables affect the selection of individuals into treatment groups.
With the awareness of the limitations of previous research in mind, the present study uses the method of propensity score matching as well as longitudinal and
multi-level data to deal with the possible problem of preexisting differences at both student and school level.
3. Research Design
3-1 Method
Even though experimental studies seem to be the best research design to assess the causal effect of tracking (Kulik, 2004), it is more common to use observational studies such as surveys to accomplish the attempt. Experimental studies use
randomization to control preexisting differences when subjects are assigned to either the treatment or the control group. In the present study, tracking could be considered as an experimental treatment. Whether or not a student is tracked and to which track, however, is not a random assignment. When using non-experimental or observational data to evaluate treatment effects, propensity score matching, a method developed under the framework of counterfactual causal inference, is gaining popularity to overcome the problem of nonrandom assignment (Guo & Fraser, 2010).
We use “psmatch2”, a Stata 10 routine developed by Leuven and Barbara (2003), to perform propensity score matching. The matching is performed in the following steps. First, we use logistic regression to estimate the probability that students enter into different tracks. In order to control the preexisting school differences, we estimated the propensity scores of being tracked by using both school-level and student-level information. Although there are different ways to estimate propensity scores with the multilevel data (Arpino & Mealli, 2008), we aggregate from students’ math ability scores gathered by TEPS in 2001 to estimate the mean and the standard deviation of math performance of each school. The school average and the standard deviation of math performance is a straightforward proxy for school characteristics. By matching these two school-level variables, we are able to account for the impact of
various school factors, such as school’s resources and teachers’ qualities, which may influence students’ performance.
In order to be sure about our estimation of the causal effect of tracking, we use four different matching algorithms, Mahalanobis, one-to-one, five nearest-neighbor with caliper equals to .001, and radius with caliper equals to .001, to estimate the causal effect of tracking. Morgan & Winship (2007) have pointed out that different matching methods could lead to different estimation the treatment effect. The method of propensity score matching can be used to estimate three different types of causal effect: the average treatment effect on the treated (ATT), the average treatment effect on the untreated (ATU), and the average treatment effect of both treated and untreated (ATE). In the present study, we focus on exploring the average treatment effect on the treated, which in the present study is the ATT of students who were assigned to either the high or the middle/low tracks. We compare the following matched cases
separately: (1) Students who have been in high-achievement tracks since the 8th grade versus students who attended schools with no tracking system, and (2) Students who have been in middle/low-achievement tracks since the 7th grade versus students who attended schools with no tracking system. The estimated ATTs would help us know how students who took part in high-achievement tracks or middle/low tracks would have performed if they had not been tracked.
Finally, in order to investigate if tracking may have differential effects on students of different preexisting math ability, we stratify the sample according to the math ability scores in the 7th grade and compare the estimated ATT of each stratum.
3-2 Data
The present study uses the core panel of TEPS which consists of junior high students who were 7th graders when first surveyed by TEPS in 2001 and then
surveyed again as 9th graders in 2003. Our data is the on-site version of TEPS (Chang, 2009). For the present analysis, we delete students who attended private schools from the analytical sample. We then identify three kinds of students in terms of their participation in tracking: (1) Students who have never been tracked (N = 3,266); (2) Students who have been in high-achievement tracks since the 8th grade (N = 1,216); and (3) Students who have been assigned to middle/ low-achievement tracks since the 7th grade (N = 1,383). TEPS data does not offer information about students who were assigned to middle/low-achievement tracks since the 8th grade. Since TEPS first surveyed the 7th graders in the middle of the first semester in 2001, we believe
students’ math performance measured at that time in large part could be attributed to their math ability gained before the 7th grade. Therefore, the comparison between
students who have been assigned to middle/low-achievement tracks with those who have never been tracked is justifiable.
Since tracking as defined by the present study is a school’s practice, we can only compare students across schools which either implement tracking or not. Hence, our analysis explores the differences in estimation of causal effects of tracking by matching only individual-level variables as well as matching both individual-level variables and school-level means and standard deviations of math performance to control for school-level differences. The individual-level matching variables consist of (1) student’s individual characteristics (2) family backgrounds, (3) class and school characteristics.
3-3 Measures
The outcome variable of the present analysis is a transformation of the IRT math ability scores of the 9th graders. We change IRT scores into scores with a mean of 50 and a standard of 21 for easy interpretation and understanding.
The following is the description of variables used for the present analysis to perform the propensity score matching.
(1) Math ability IRT scores in the 7th grade: This variable is a continuous variable.
(2) Gender: 1 is male and 0 is female.
(3) Student’s educational expectation: This variable is coded into three levels of educational expectation: expectation of getting a high school diploma or below, getting a college degree, and getting a graduate degree. The reference group in the regression analysis is getting a high school diploma or below.
(4) Sibsize: This variable is constructed from student’s answers to four questions regarding the number of younger and older sisters and brothers. This number of siblings is double checked and corrected with five questions about whether living with siblings, the number of siblings under 18 years old, if parents are partial towards a particular sibling, and the relationship between siblings.
(5) Living with both biological parents: This variable is dummy coded with 1 indicating yes and 0 indicating no.
(6) Ethnicity: Four ethnic groups are constructed according to parents’ answer about their ethnicity. They are Minnan, Hakka, Mainlander, and Aborigine. Minnan is the reference group in the logistic regression.
(7) Monthly family income: The monthly family income is divided into less than NT$20,000, NT$20,000 to less than NT$50,000, NT$50,000 to less than
NT$100,000, and NT$100,000 or above. The reference group in the regression analysis is less than NT$20,000.
(8) Father’s occupation: Three types of father occupation constructed are professional or clerical workers, sales and service workers, and others. The classification is based on the differentiation of white collar and blue collar jobs as
well as the consideration of the sample size of each category. The reference group in the regression analysis is others.
(9) Mother’s occupation: Three types of mother occupation constructed are professional or clerical workers, sales and service workers, and others. The classification is based on the differentiation of white collar and blue collar jobs as well as the consideration of the sample size of each category. The reference group in the regression analysis is others.
(10) Parental educational expectation: This variable is coded into three levels of educational expectation: expectation of getting a high school diploma or below, getting a college degree, and getting a graduate degree. The reference group in the regression analysis is getting a high school diploma or below.
(11) Father’s educational level: in years. (12) Mother’s educational level: in years.
(13) School location: This variable is related the level of urbanization of which each school locates. There are three levels: rural, small city, and major city. Major city is the reference group in the logistic regression analysis.
(14) Remote school: 1 is yes and 0 is no. While this variable is related to school locations, there are a number of schools identified by the Ministry of Education as remote schools at each level of urbanization. Schools identified as in remote areas tend to be small in size and students need to travel far away from home to attend schools. These schools also have less resource and fewer teachers, who may need to cover several different subjects.
(15) Classmates often discuss homework or study together: This is an ordinal variable ranges from 1 to 4 with 1 indicating strongly agree and 4 indicating strongly disagree.
ranges from 1 to 4 with 1 indicating strongly agree and 4 indicating strongly disagree. (17) School mean math achievement: This variable is derived from students’ math ability IRT scores in the 7th grade within the same school.
(18) Within school standard deviation of math achievement: This variable is derived from students’ math ability IRT scores in the 7th grade within the same school.
4. Results
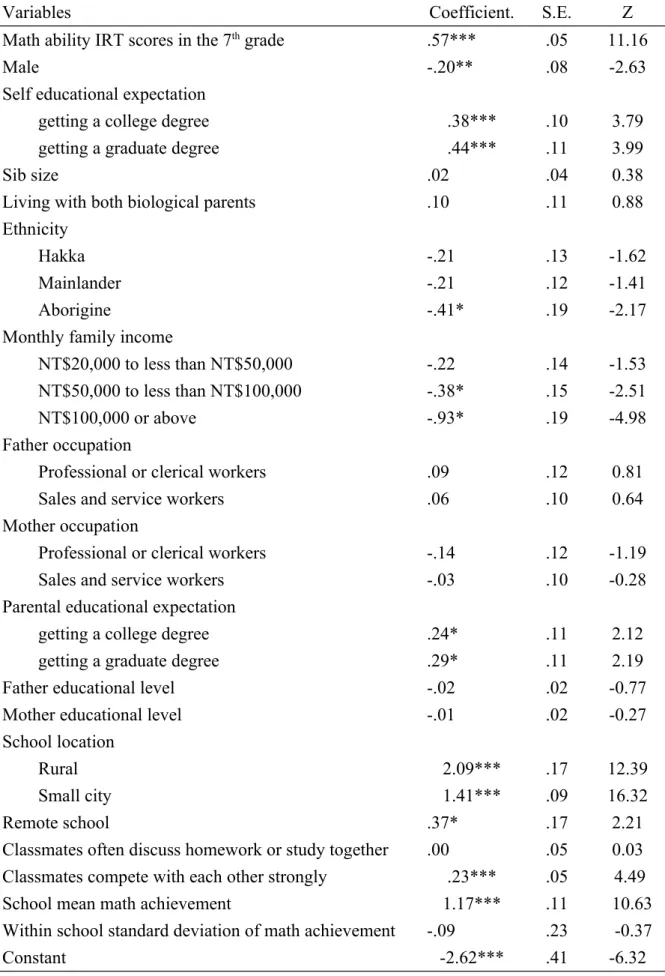
4-1 The propensity and the effects of being tracked to high-achievement tracks Table 1 is the logistic regression of being in high-achievement tracks, and it shows many differences between students who take part in high-achievement tracks and those who are not tracked. We find that students with higher math ability IRT scores in the 7th grade and higher self educational expectation have higher probability of being assigned to high-achievement tracks. Table 1 also shows that students with higher parental educational expectation, low or middle level of monthly family income have higher probability of being in high-achievement tracks. Moreover, school and class characteristics do matter. We find that students when in the 7th grade
attended classes with competitive climate, or attended schools of which the mean math achievement is high or the within school standard deviation of math
achievement is large would all increase the chance of being tracked to
high-achievement tracks. We also find that junior high schools located in the remote area, the rural area, or the small city are more likely to have tracking, and this finding matches observations made by other researchers in Taiwan (Chen, 2010). The finding of schools with high mean math achievement or large within school standard
deviation of math achievement tend to offer tracking is also consistent with Huang’s (2009) study, which uses the data of TIMSS and finds that classes at Grade 8 in
Taiwan are not homogeneous.
[Table 1 is about here]
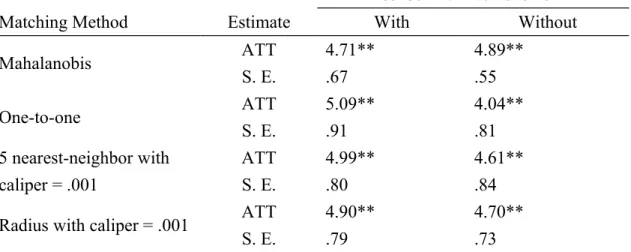
The result of PSM analysis further shows that being assigned to
high-achievement tracks would have a positive effect on math performance at the 9th grade (Table 2). Moreover, ATT estimated is slightly different with four kinds of matching methods. We find that for students of high-achievement tracks, the ATT is between 4 to 5 points, and the ATT is lower after further matching school-level means and standard deviations of math performance in the analysis (Table 2). Table 2 also shows that the estimated effect of high-achievement tracks is quite consistent among four different matching methods. In short, the findings show that if students assigned to high-achievement tracks would have performed less well, about 1/4 of the standard deviation less than what they have achieved currently, if they had not been tracked.
[Table 2 is about here]
4-2 The propensity and the effects of being tracked to middle/low tracks
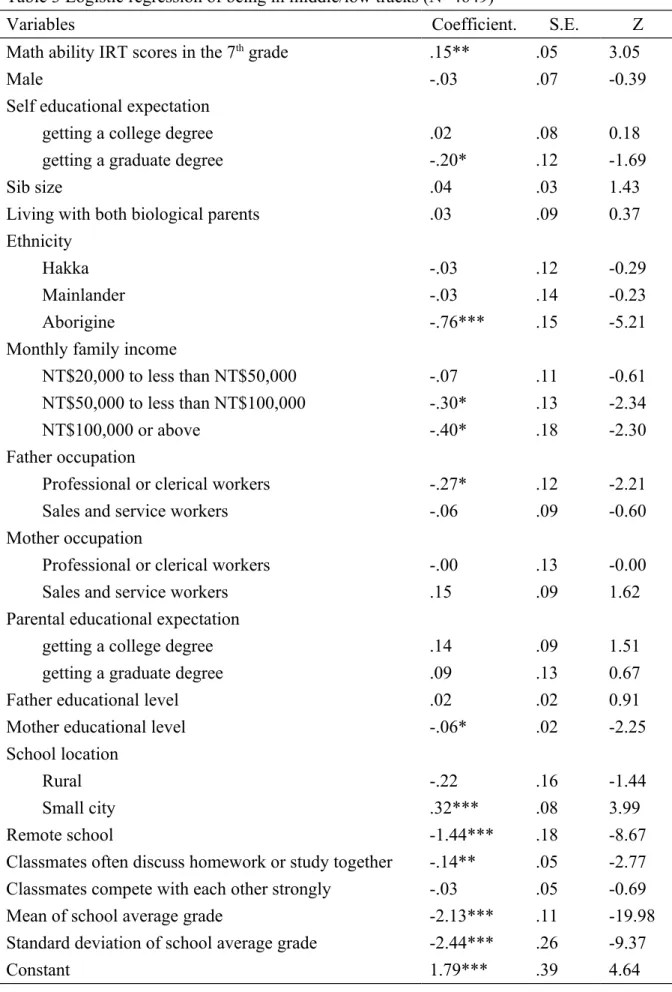
Table 3 is the logistic regression of being in middle/low tracks, and we find that the likelihood of students being assigned to middle/low tracks is negatively related to student’s self educational expectation, mother’s educational level, and monthly family income. However, students with higher math ability IRT scores in the 7th grade have a higher chance of being in middle/low tracks. One of the reasons for this puzzling finding could be related to the combination of middle and low tracks into a single category as measured by TEPS. The possibility that the assignment of tracks is based on criteria other than academic criteria cannot be ruled out either. Table 3 also shows
that students who often discuss homework or study with their classmates have lower chance of being in middle/low tracks. While schools in the remote areas would lower the probability of students being assigned to middle/low tracks, students studying in the small city school, on the other hand, have a greater chance of being in middle/low tracks. Moreover, the mean school math achievement and the within school standard deviation of math achievement would lower the chance of students being in
middle/low tracks. The latter result may essentially reflect the negative relationship between tracking practice and the degree of heterogeneity of students’ math
achievement.
[Table 3 is about here]
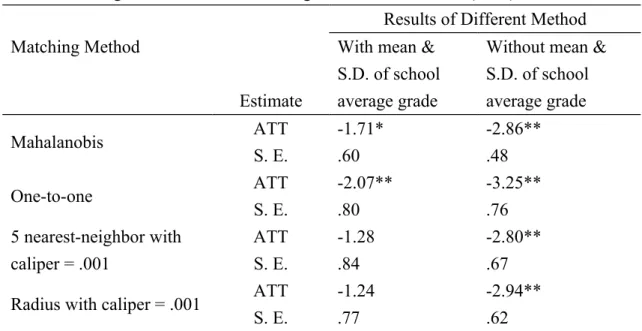
For students of middle/low tracks, the ATT is between minus 1 to 4 points (Table 4). Moreover, the result shows that the ATT is smaller after further matching school-level variables in the analysis. We find the effect of middle/low tracks is minus 1 to 3 points, after the model includes school-level variables. However, the effect of middle/low tracks is positive if matching does not include school-level variables. The finding points toward the direction that student’s math performance would be harmed somewhat by being assigned to middle/low-achievement tracks.
[Table 4 is about here]
4-3 Who would be benefited most from tracking?
In order to understand the differential effects of tracking, we stratify math ability IRT scores in the 7th grade into five strata. Table 5 shows that if we stratify math
to the high-achievement tracks is negatively related to student’s prior math ability. The students of the 1st stratum to the 3rd stratum would increase about 5 to 11 points,
depending on matching methods. On the other hand, students of the 4th stratum to the
5th stratum, which are strata of students whose math ability is above average, would
gain less than 2 points.
[Table 5 is about here]
As to the effect of middle/low tracks, Table 6 shows that students with higher math ability IRT scores in the 7th grade would lose the most. We find that students of
the 5th stratum would lose about 8 to 11 points and students of the 4th stratum lose 2 to
6 points. Contrarily, students with lower math ability IRT scores in the 7th grade
would lose fewer points, and the effect of middle/low tracks could even turns into positive to those students whose prior math ability is at the lowest stratum.
[Table 6 is about here]
5. Conclusion and Discussion
Does tracking have positive influence on students’ math performance? Hallinan (1994) has suggested, among other things, that grouping students’ strictly on objective academic criteria may counterbalance the negative effect of tracking. Gamoran (2009) also maintains that high-stakes exams are crucial, and tracking is positive to students’ performance in schools or countries with high-stakes exams. Our findings conform to what these scholars have argued. We find that the tracking would be positive to students’ math performance, if the criteria of tracks are based on objective assessment like prior math achievement.
However, we also find that the effect of tracks could be negative, if students are wrongly tracked to especially middle/ low-achievement tracks. Stratifying analysis of propensity scores matching shows this point. When the criteria of tracks does not only base on students’ performance, the result of being tracked could increase inequalities.
There are some questions need to be investigated in the future. First, what criteria are actually used by schools in tracking students in Taiwan? Our analysis has found that students with higher prior math ability also tended to be assigned to
middle/low achievement tracks. If the tracking is based other than objective academic assessment, then tracking would be harmful to students who are wrongly tracked to middle/low tracks.
Second, even though the result shows that the effect of middle/low tracks is smaller than the effect of high-achievement tracks, we should explain the results carefully. Our analysis has used different duration of tracking for those who were assigned to middle/low tracks and those who were assigned to high-achievement tracks. The duration of middle/low tracks is three years, but duration of high-achievement tracks is two years.
Third, the most important question is the issue of the method used to assess the effect of tracking. We use the mean and the standard deviation of school average math performance, and our purpose is to match features of schools. However, features of schools are school-level variables, and the findings could be more precise, if we combine the matching method with the multilevel analysis. Hong & Raudenbush (2006) have demonstrated such a possibility. However, how to integrate multilevel analysis with the method of propensity score matching can have other possibilities and this will be our future goal to explore these possibilities.
Table 1 Logistic regression of being in high-achievement tracks (N = 4,482)
Variables Coefficient. S.E. Z
Math ability IRT scores in the 7th grade .57*** .05 11.16
Male -.20** .08 -2.63
Self educational expectation
getting a college degree .38*** .10 3.79
getting a graduate degree .44*** .11 3.99
Sib size .02 .04 0.38
Living with both biological parents .10 .11 0.88
Ethnicity
Hakka -.21 .13 -1.62
Mainlander -.21 .12 -1.41
Aborigine -.41* .19 -2.17
Monthly family income
NT$20,000 to less than NT$50,000 -.22 .14 -1.53
NT$50,000 to less than NT$100,000 -.38* .15 -2.51
NT$100,000 or above -.93* .19 -4.98
Father occupation
Professional or clerical workers .09 .12 0.81
Sales and service workers .06 .10 0.64
Mother occupation
Professional or clerical workers -.14 .12 -1.19
Sales and service workers -.03 .10 -0.28
Parental educational expectation
getting a college degree .24* .11 2.12
getting a graduate degree .29* .11 2.19
Father educational level -.02 .02 -0.77
Mother educational level -.01 .02 -0.27
School location
Rural 2.09*** .17 12.39
Small city 1.41*** .09 16.32
Remote school .37* .17 2.21
Classmates often discuss homework or study together .00 .05 0.03 Classmates compete with each other strongly .23*** .05 4.49
School mean math achievement 1.17*** .11 10.63
Within school standard deviation of math achievement -.09 .23 -0.37
Variables Coefficient. S.E. Z
Log likelihood -2186.84
LR
χ
2 (27) 865.00Pseudo R2 0.17
Table 2 Average treatment effect of being in high-achievement tracks (ATT)
With or without the mean & S.D. of school math achievement
Matching Method Estimate With Without
Mahalanobis ATT S. E. 4.71** .67 4.89** .55 One-to-one ATT S. E. 5.09** .91 4.04** .81 5 nearest-neighbor with caliper = .001 ATT S. E. 4.99** .80 4.61** .84 Radius with caliper = .001 ATT
S. E.
4.90** .79
4.70** .73 Standard errors are estimated by bootstrapping.
Table 3 Logistic regression of being in middle/low tracks (N=4649)
Variables Coefficient. S.E. Z
Math ability IRT scores in the 7th grade .15** .05 3.05
Male -.03 .07 -0.39
Self educational expectation
getting a college degree .02 .08 0.18
getting a graduate degree -.20* .12 -1.69
Sib size .04 .03 1.43
Living with both biological parents .03 .09 0.37
Ethnicity
Hakka -.03 .12 -0.29
Mainlander -.03 .14 -0.23
Aborigine -.76*** .15 -5.21
Monthly family income
NT$20,000 to less than NT$50,000 -.07 .11 -0.61
NT$50,000 to less than NT$100,000 -.30* .13 -2.34
NT$100,000 or above -.40* .18 -2.30
Father occupation
Professional or clerical workers -.27* .12 -2.21
Sales and service workers -.06 .09 -0.60
Mother occupation
Professional or clerical workers -.00 .13 -0.00
Sales and service workers .15 .09 1.62
Parental educational expectation
getting a college degree .14 .09 1.51
getting a graduate degree .09 .13 0.67
Father educational level .02 .02 0.91
Mother educational level -.06* .02 -2.25
School location
Rural -.22 .16 -1.44
Small city .32*** .08 3.99
Remote school -1.44*** .18 -8.67
Classmates often discuss homework or study together -.14** .05 -2.77
Classmates compete with each other strongly -.03 .05 -0.69
Mean of school average grade -2.13*** .11 -19.98
Standard deviation of school average grade -2.44*** .26 -9.37
Variables Coefficient. S.E. Z
Log likelihood -2304.24
LR
χ
2 (27) 1051.36Pseudo R2 0.19
Table 4 Average treatment effect of being in middle/low tracks (ATT)
Results of Different Method Matching Method
Estimate
With mean & S.D. of school average grade
Without mean & S.D. of school average grade Mahalanobis ATT S. E. -1.71* .60 -2.86** .48 One-to-one ATT S. E. -2.07** .80 -3.25** .76 5 nearest-neighbor with caliper = .001 ATT S. E. -1.28 .84 -2.80** .67 Radius with caliper = .001 ATT
S. E.
-1.24 .77
-2.94** .62 Standard errors are estimated by bootstrapping.
* P < .05 ** P < .01 *** P < .001
Table 5 Average treatment effect of being in high-achievement tracks (ATT) stratified by math ability IRT scores in the 7th grade
Math ability IRT scores in the
7th grade Mahalanobis One-to-one K-Nearest Radius
1st stratum(Lowest) 8.40 11.03 10.28 10.58
2nd stratum 6.70 9.45 5.25 5.03
3rd stratum 5.00 5.74 5.74 5.56
4th stratum 2.75 2.73 1.12 .98
5th stratum(Highest) 1.45 .10 .50 .44
Table 6 Average treatment effect of being in middle/low tracks (ATT) stratified by math ability IRT scores in the 7th grade
Math ability IRT scores in the
7th grade Mahalanobis One-to-one K-Nearest Radius
1st stratum(Lowest) .30 1.28 .58 .57
2nd stratum .67 -3.50 .53 .56
3rd stratum -2.54 -2.15 -2.38 -2.51
4th stratum -4.78 -2.16 -6.28 -6.25
References
Arpino, B.& Mealli, F.(2008). The specification of the propensity score in multilevel
observational studies. DONDENA WORKING PAPERS. Retrieved March 27,
2010, from
http://mpra.ub.uni-muenchen.de/17407/1/MPRA_paper_17407.pdf.
Broaded, C. M. (1997). The Limits and Possibilities of Tracking: Some Evidence from Taiwan. Sociology of Education, 70 (1), 36-53.
Chang, Ly-yun. (2009). Taiwan Education Panel Survey: Base Year (2001) Student
Data and Parent data [on-site release computer file]. Center for Survey
Research, Academia Sinica. License number: TEPS2A002097.
Chen, Wei-lin. (2010). The relationship between tracking and students’ performance
on math. Unpublished master thesis, National Taiwan Normal University.
Gamoran, A. (1992). The Variable Effects of High School Tracking. American Sociological Review, 57(6), 812-828.
Gamoran, A. (2009). Tracking and inequality: New directions for research and
practice (WCER Working Paper No. 2009-6). Madison: University of
Wisconsin–Madison, Wisconsin Center for Education Research. Retrieved December 27, 2009, from
http://www.wcer.wisc.edu/publications/workingPapers/papers.php
Guo, S. & Fraser, M. W. (2010). Propensity score analysis: statistical methods and
application. Sage: California.
Hallinan, M. T. (1994). Tracking: From Theory to Practice. Sociology of Education,
67(2), 79-84.
Hanushek, E. A. & Woßmann, L. (2006). Does educational tracking affect performance and inequality? Differences-in-differences evidence across
countries. The Economic Journal, 116, 63–76.
Hong, G., and Raudenbush, S. W. (2006). Evaluating kindergarten retention policy: A case study of causal inference for multi-level observational data. Journal of
the American Statistical Association, 101(475), 901-910.
Huang, Min-Hsiung. (2009). Classroom homogeneity and the distribution of student math performance: A country-level fixed-effects analysis. Social Science
Research, 38(4), 781 -791.
Kulik, J. A. (2004). Grouping, tracking, and de-tracking. In Walberg, H. J., Reynolds, A. J. & Wang, M. C.(Eds.), Can unlike students learn together? grade
retention, tracking, and grouping (pp. 157-182), Greenwich, Conn. :
Information Age Pub.
Kim, T., Lee, J., & Lee, Y. (2008). Mixing versus sorting in schooling : Evidence from the equalization policy in South Korea. Economics of Education Review,
27, 697–711.
Leuven, E. & Barbara S. (2003). Psmatch2: Stata Module to perform full
Mahalanobis and Propensity Score Matching, Common Support Graphing, and Covariate Imbalance Testing. Retrieved April 4, 2009, from
http://ideas.repec.org/c/boc/bocode/s432001.html#abstract
Morgan, S. L. & Winship, C. (2007). Counterfactuals and Causal Inference: Methods
and Principles for Social Research. New York : Cambridge University Press
Pekkarinen,T., Uusitalo,R. and Kerr, S. (2009). School Tracking and Development of