Department of Business Administration
I-Shou University
Master Thesis
Synthesizing the Effects of Service Quality and
Customer Satisfaction on Behavioral Intention
The Case of Vietinbank
Advisor:
Dr. Wan-Ching Chang
Co-Advisor:
Dr. Nguyen Dang Huy
Graduate Student:
Pham TrungTuyen
Acknowledgements
In the process of learning and study, I get the help heartedly collective and individual agencies within and outside the Hanoi University of Business and Technology.
I would like to express respect and gratitude to the teacher most Wan-Ching Chang Ph.D - Dept. of Tourism, I-Shou University has dedicated guide, told me during the research this subject.
I sincerely thank the enthusiastic support of the departments at the Bank for Industry and Trade of Vietnam has helped me to collect data and complete research dissertation.
Besides the cooperation help in the work I also received encouragement from family and friends in the process of learning and research practice.
Despite trying but the level itself is limited, in my thesis will inevitably flawed, we respectfully request that the teacher, the teacher, the students contribute ideas for the content of this research word more perfectly.
Abstract
Banking industry are developing the banking services with many extra advantages especially in retailing services. The purpose of this study is to examine the relationship between the factors of SERVQUAL model and customer satisfaction and behavior intention in using retailing services of VietinBank. The empirical analysis used data from 150 customers who has been ever used retailing service of VietinBank. In this study, principle component method is used for explorative factor analysis. Regression is adopted to test the hypotheses,. Results of this study showed that all of five factors: Tangible, Assurance, Responsiveness, Reliability, Empathy have the positive relationship with customer satisfaction. Beside, the positive relationship between customer satisfaction and behavior intention was indicated in this study. The result from T-test and ANOVA shows that there are not different satisfaction and behavior intention among respondents characteristic. Based on the findings, the implications, limitations of this study and directions for the future research were discussed in the last chapter.
Keywords: Vietnam banking industry, retailing service, VietinBank,
Table of Contents
Acknowledgements ... i
Abstract ... ii
List of Tables ... vi
List of Figures ... vii
Chapter 1 INTRODUCTION ... 1
1.1. Research Background ... 1
1.2. Problem statement and research objectives ... 2
1.2.1. Research question ... 2
1.2.2. Research objective ... 3
1.3. Scope of research ... 3
1.4. Thesis outline ... 3
Chapter 2 LITERATURE REVIEW ... 5
2.1. Banking sector in Vietnam ... 5
2.2. Overview of Vietin Bank... 6
2.3. Service quality ... 7
2.4. The service quality theory ... 7
2.4.1. Theory of service ... 7
2.4.2. Characteristics of Service ... 9
2.4.3. Definition of service quality and models ... 11
2.5. Quality in banking service ... 14
2.6. Customer satisfaction ... 16
2.7. Behavior intention ... 18
2.8. The relationship of service quality, customer satisfaction and behavior intention ... 18
2.9. Hypotheses and research framework ... 22
Chapter 3 RESEARCH METHOD ... 23
3.1. Introduction ... 23 3.2. Sample design ... 23 3.3. Variable construct ... 23 3.4. Pilot test ... 26 3.5. Analysis ... 26 3.5.1. Reliability test ... 26
3.5.2. Factor analysis explored (EFA) ... 27
3.5.3. Linear regression ... 28
Chapter 4 RESULT ... 29
4.1. Respondent characteristic ... 29
4.2. Hypothesis testing ... 36
4.2.1. The relationship of reliability and customer satisfaction ... 36
4.2.2. The relationship of responsiveness and customer satisfaction ... 37
4.2.3. The relationship of Assurance and customer satisfaction ... 38
4.2.4. The relationship of Empathy and customer satisfaction ... 39
4.2.5. The relationship of Tangible and customer satisfaction ... 40
4.2.6. The relationship of customer satisfaction and behavior intention ... 41
4.3. T-Test and ANOVA ... 42
4.3.1. The different satisfaction and behavior intention level between male and female ... 42
4.3.2. The different satisfaction and behavior intention level among age group. .. 43
4.3.3. The different satisfaction and behavior intention level among education of customer. ... 44
4.3.4. The different satisfaction and behavior intention level among income of
customer. ... 45
4.3.5. The different satisfaction and behavior intention level between purposes of using retailing banking service ... 46
4.4. Discussion ... 47
Chapter 5 CONCLUSION AND RECOMMENDATION ... 49
5.1. Conclusion ... 49
5.2. Implication of research ... 50
5.2.1. Academic implication ... 50
5.2.2. Managerial implication ... 50
5.3. Research limitation and future study ... 53
References ... 54
Appendix: Questionnaire(English version) ... 58
List of Tables
Table 2.1 Hypothesis ... 22
Table 3.1 Variables and its items ... 24
Table 4.1 Respondent profile ... 30
Table 4.2 Servqual model factor analysis and reliability ... 32
Table 4.3 Factor analysis and reliability of Customer satisfaction and Behavior intention ... 34
Table 4.4 Variable Correlations ... 35
Table 4.5 The relationship of reliability and customer satisfaction ... 36
Table 4.6 The relationship of responsiveness and customer satisfaction ... 37
Table 4.7 The relationship of Assurance and customer satisfaction ... 38
Table 4.8 The relationship of Empathy and customer satisfaction ... 39
Table 4.9 The relationship of Tangible and customer satisfaction ... 40
Table 4.10 The relationship of customer satisfaction and behavior intention ... 41
Table 4.11 T-Test of satisfaction and behavior intention level between male ... 42
and female ... 42
Table 4.12 ANOVA test of satisfaction and behavior intention level among age group. . 43
Table 4.13 ANOVA test of satisfaction and behavior intention level among education44 Table 4.14 ANOVA test of satisfaction and behavior intention level among income . 45 Table 4.15 T-Test of satisfaction and behavior intention level purposes ... 46
List of Figures
Figure 2.1 Service Characteristic (Adapted from Jobber, 2004) ... 11
Figure 2.2 Gronroos model of service quality, Source: Gronroos (1984) ... 12
Figure 2.3 SERVQUAL model ... 14
Chapter 1 INTRODUCTION
1.1. Research Background
The year of 2014 is considered a positive business year of the banking industry in Vietnam. It is the era of innovation, restructuring, improving service quality, product diversification and expansion of its network to increase competitiveness and maintain stable growth (Thu Huong, 2015). In an effort to comprehensive renovation of the banking sector, the development of retail services, such as banks, tends to provide more options for targeting on individual customers, small and medium enterprises, and individual business households (Thu Huong, 2015)1 . In addition to change customer service business year of the banking methods, various types of products, advanced services, information technology applications for improving the management and production efficiency has brought to certain some banks.
The development of retail banking services is the inevitable trend of commercial banks. For customer, retail banking services bring the convenience and time-saving in the transaction process. From the perspective of banks, retail banking services bring stable revenue, promote the expansion of the market, and improve competitiveness.
However, retail banking services of commercial banks in Vietnam still exist some shortcomings. Despite fast-growing implementation of Internet Banking service for Vietnam banks, the use of online payment has not commonly accepted by the majority of the population. The tools of non-cash payment do not received the attention of the customers. Banking services such as asset preservation, financial advisory, investment advisory service high-income customers are not widely adopted. Retail banking services in the commercial banks over time were broad and in-depth. The presence of large foreign banks, have experienced are active in the retail banking market will increase competitive pressure for domestic commercial banks. This is a challenge as
1
Thu Huong ( 2015, January 27) Bank efforts to innovate and improve service quality Retrieved from
well as the necessary pressure to the local commercial banks further efforts to expand and improve service quality, learning management experience to progress to meet the needs of service the increasing customer (Nguyen Van Thang, 2015)2. Therefore, there is a need to evaluate the quality of e-banking services, and to study the relationship between service quality and customer satisfaction. The results will be meaningful for managers to improve e-banking services quality in the future in Vietnam.
To understand the importance of service quality; the researchers around the world have done much research on service quality.Currently, the service quality model, SERVQUAL, proposed by Parasuraman (1988) is used as the most popular model. To measure service quality, Parasuraman was given the scale consists of five components, such as reliability, responsiveness, empathy, assurance and tangible. There have been numerous SERVQUAL research and applications to evaluate the service quality in the different fields. Banks provide retail service based on the customers changing needs. These changes have arisen as a result of economic deregulation, government policies, globalization and information communication technology. The consequence of these factors of change become competition in the financial service industry. In order to remain the competitiveness, financial institutions are providing an increasingly assorted bouquet of financial services (Pikkarainen, Kari, et al, 2006).
1.2. Problem statement and research objectives
1.2.1. Research question
Marketing theory has identified critical factors for customer satisfaction especially in service industry, but there are still limited studies on Vietnamese industry, especially in Vietnamese banking sector. Therefore, this study will answer the research questions as below:
- Are there any relationship among dimensions of SERVQUAL and customer satisfaction?
2
Nguyen Van Thang ( 2015) A look back in retail banking in commercial banks, Retrieved fromhttps://www.vietinbank.vn/web/home/vn/research/11/110406.html
- Is there any relationship between customer satisfaction and behavioral intention in retail banking service?
- What are the critical factors affect customer satisfaction the retail service in
banking industry in Vietnam?
1.2.2. Research objective
- Reviewing the significant factors for service industry and deposit service in
banking industry
- Identifying factors that improve the customer satisfaction - Constructing a research model and hypotheses
- Testing the hypotheses with quantitative method
1.3. Scope of research
The focus of the study is on satisfaction and behavior intention of customer in using retail banking service in VietinBank in Hanoi. The author will conduct the survey with the customers of VietinBank.
1.4. Thesis outline
The study is divided into five chapters, which can be summarized as follows:
Chapter 1 provides an introduction to the study. It includes the reasons for
conducting this study, background of the research, the objectives, research questions, scope of research, and the outline of the thesis.
Chapter 2 includes the review of related literature on service industry, retailing
service, customer satisfaction and behavior intention. The chapter also gives an overview of the previous studies relating to terminological definitions. This is followed by the discussion of the relationship between factors of SERVQUAL model and customer satisfaction and behavior intention. Based on the literature review, the research model and hypotheses will be developed.
Chapter 3 presents the method and empirical studies, including the research
setting, sampling, description of variables and respondent, data collection instrument, data collection procedures and methods of data analysis.
Chapter 4 shows the major findings of the study obtained from data analysis.
The results compared with the results of other previous research.
Chapter 5 draws the conclusion to the whole study, discusses some
Chapter 2 LITERATURE REVIEW
2.1. Banking sector in Vietnam
The development of the banking sector in Vietnam can be marked from the birth of the State Bank of Vietnam (SBV) on Jun. 05 in 1951. Commercial banks in Vietnam developed 23 years ago, namely in May 5/1990 when two important decrees were issued: Decree on State Bank of Vietnam Male and Ordinance banks, credit cooperatives and financial companies. This provision actually put Vietnam from a country with a unique banking system into a two-tier banking system in which the function of state banks is concerned with the supervision of the monetary policy, the development of operating cash, credit management system, monitoring of commercial banks and foreign reserves management. Its primary objective is to stabilize the currency and control inflation. On the other hand, the financial intermediation function (commander and allocations) was transferred to the commercial banks (VP Bank Securities, 2014)3 . Since the first reform two decades ago, the banking sector has flourished for most of banks. From the system where only national banks were allowed to operate, the banking system has become crowded with 150 banks and more than 1,100 financial institutions non-bank within23 years. The development focuses on two stages and two banking groups. '90s' is the age and stage of commercial banks in the early 2000s mark the participation of foreign banks (VP Bank Securities, 2014).
The number of state-owned commercial banks (SCBs) remained stable. There were four SCBs, only the Mekong Delta (MHB) was founded in 1997. Meanwhile, the number of commercial banks increased in the 90s', peaked with 51 banks in 1996, but has declined since then to 34 banks under the provisions. Due to concerning the minimum charter capital and ratios, as well as minimum capital adequacy, resulting in the merger and consolidation of a wide range of small and weak banks (VP Bank Securities, 2014). Currently, there are five SCBs in Vietnam, including four largest banks system: JSB for Foreign Trade (Vietcombank), JSB Industry and Trade
3
(Vietinbank), JSB Investment and Development of Vietnam (BIDV), Vietnam Bank for Agriculture and Development Rural development (Agribank). Remaining SCBs Housing Development Bank Mekong Delta (MHB)
2.2. Overview of VietinBank
After separating from State Bank of Vietnam, VietinBank was established in 1988. It is one of the largest State-owned commercial banks of Vietnam. The total assets of VietinBank account for over 20 percent of the market share of the whole Vietnamese banking system. VietinBank there are five SCBs in Vietnam, including four largest banks system: JSB for Foreign Trade (Vietcombank), JSB Industry and Trade growth of 20 percent, especially 35 percent growth a year against that of last year. VietinBank has developed today for owning 1 Transaction Centers, 150 branches, for over 20 percent of the market share of in Vietnam. It has established correspondent relationship with 900 banks, financial institutions of 90 countries and territories all over the world.
Being diversified with 07 independent accounting subsidiaries: VietinBank Leasing Company, VietinBank Securities Company, the world capital resources keep on VietinBank Insurance Company, VietinBank pendent accounting subsidiaries: VietinBank Leasing Company, VietinBank Securities Company, the world capital resources keep on VietinBank accounting subsidiaries: VietinBank Leasing Company, Training Center.
As a founding member and partner of the joint venture INDOVINA Bank. There agency relationships with over 900 banks and financial institutions in more than 90 countries and regions worldwide. This mission of the VietinBank is to become the leading financial and banking corporation in Vietnam that operates in diverse areas, as well as provides products and services that conform to international standards, aiming to improve the values of life. The vision of the VietinBank is to become one of the most modern and effective financial and banking group in and outside the country. The VietinBank runs customer-oriented operations. The core values of the banks are dynamic, innovative, professional, devoted, transparent, modern;
2.3. Service quality
If the quality is tangible goods, service quality is invisible. The research results show that quality of service is very broad categories to define, build models and measurement tools. Many researchers have explored this topic according to the context and different research methods. From the 80s to now, the research has been shown different approach than in the past (Parasuraman et. al., 1985, 1988, 1991; Cronin and Taylor, 1992; Broderick andVachirapornpuk, 2002; Arun Kumar , Manjunath and Naveen Kumar, 2012) Therefore, to help managers improve the efficiency of business operations for the enterprise, this study investigate the service quality by using SERVQUAL model applied in the banking sector in Vietnam.
2.4. The service quality theory
2.4.1. Theory of service
Service is a process that works includes factors not present, addressing the relationship between the supplier and the customer or the customer's property without a change of ownership. Products of services possible within or beyond the scope of the material (Oliver, 1997).
Service is an intangible product. Customers receive the product through the operation of communication, information and comments received. Features that customers can only assess the quality of the entire service after the "buy" and "use" them.
Each type of service gives consumers a certain value. Value of services benefits associated with the service they receive from the service value. So here are not discussed merchandise value services, such as academic in political economy, and is not valid, because the value of using a wider range. The value here correspond to the consumer expected value, it has close ties with interest search engines and services purchased. The value of the service system called value chain. Value Chain overall benefit to consumers services. Similarly, the value of additional services by supporting activities and create additional benefits. For the same type of service value chain
represents an overall average that society can achieve and be recognized. But besides the overall value chain including the value chain of each supplier (Parasuraman et. al., 1991).
Retail banking services mean the bank provides financial services to individual customers and households, small and medium enterprises.
Retail banking services has invisible nature, when using these services, customers often could not distinguish the specific shape of this type of service, but only felt through the service utility that brings. Therefore, the service must constantly change and design as more convenient and add flexible features consistent with the market and meet the growing needs of customers. Also, more and more types of Retail banking services are implemented to create banks’ competitiveness. These services primarily are payment, transfer, payment order, checks, cards, deposits, guarantees, remittance, consulting, remittances, safe rental, insurance, securities ; foreign currency trading, international payments, collection of electric, water, telephone (Tran Dinh Thu, 2011)4.
For a deeper understanding of retail banking services, we understand the primary issues related to manufacturing provision of services (Malhotra et. al., 2005)
- Basic service: the service activities create value to satisfy the core interests of consumers. That is the goal of buyers look for.
- Satellite services: is the extra services or the independent stage of service which was created to bring additional value to customers. Services surround system may lie in the basic services and increase core interests or interests can be independently bring additional benefits.
- Elementary Services: Services elementary structures associated with the service, with the level of service and the regulation of providers.
4
Tran Dinh Thu ( 2011), Development of retail banking services directed at agriculture, rural, Retrieved from http://www.vietinbank.com/web/home/vn/research/11/110510.html
- Overall Service: the service system consists of basic services, satellite services, and rudimentary services. Overall service is not stable, it depends on the servicecomponent composition. Now suppler with overall service to its consumers. Service overall change and benefit changes.
2.4.2. Characteristics of Service
What exactly are the characteristics of a service? How are services different from a product? In fact many organizations do have service elements to the product they sell. Kotler et al. (2005) give the characteristics of a Service as flowing:
No transferred Ownership characteristics of a service? How are services different from a product? In fact many organizations do have service elements to the product they sell. Kotler et al. (2005) give the characteristics of a Service as
Intangibility How do you measure service? In a restaurant, the dish can be measured, but the efforts gone in making the same dish by two different chefs cannot be measured from the customer end. Same goes for large service corporates like Accenture and Infosys. The time and effort gone for giving service to the customer is intangible. Both ownership and intangibility are old school differences between goods and services.
Involvement of customer measure service? In a restaurant, the dish can be measured, but the efforts he involvement of customer as well. In services involvement of customers is much more than in products. For example – ATM’s are services wherein customer has to use the machine. The same goes for vending machines as well as for self service restaurants. Today ice cream chains like Hokey pokey and food chain like Subway have more than 50% involvement of customer where the customer gets to decide the ingredients they want in their ice cream / Sub.
Quality of customer measure service? In a restaurant, mass manufacturing means uniformity. However, services involve a lot of manual labor due to which the quality may vary each time. Uniformity in services is a factor which each service owner tries for. For example – The major challenge of food chains like Subway, Pizza
hut and dominos is to give the same quality over and over again, whereas in local restaurants the quality of food may vary time to time from the same restaurant.
Evaluation of services is tougher service? In a restaurant, mass manufacturing involvement of customer is maximum, evaluation of different services becomes tougher. For example, uniformity. However, services involve a lot of manual labor due to which the quality may vary each time. Uniformity in services is a factor how a barber cuts your hair.
Inventories are absent is tougher service? In a restaurant, mass manufacturing involvement of customer is maximum, evaluation of different services becomes tougher. For example, evaluation of different services you order it. The raw material and the chef might be present. But the production does not begin unless and until there is a customer to consume the service.
Time is very important in service? In a restaurant, mass manufacturing involvement of production and consumption is at the same time, time is a very important difference between goods and services. The keyword here is ere is a customer should be no delay in providing the service. Thus the cab should arrive on time, the food should be prepared by time and the trains should run on time.
Thus the difference between goods and services is base on many different factors. These factors are become more and more acute as the services sector rises in demand.
Kotler et al. (2005) state that services have a number of characteristics which differentiate them from goods and have implications for the way they are marketed. A company must take into account five service characteristics when designing marketing programs. These characteristics are often described as intangibility, inseparability, variability, perishability and lack of ownership (Malhotra, 2005). Words have meanings quality and can be used in many ways. Jobber, (2004) identified five ways to understand the concept of quality
2.4.3.
Definit F quality such as quality service 1991). betwee outcom quantit SERVQ service compon FiguDefinit
tion of serv For a long . Grentiate s (1) the t of functio , we can n Parasuram n the expe me of the se ative expe QUAL). Sc s. Finally nents of ure 2.1 Sertion of se
vice g time, ma e them from technical q n, interpret not fail to m man (1988 ectations o ervice". Th ertise to b cale of SER SERVQU services q rvice Charervice qu
any researc m goods a quality, wh ting servic mention th 8, p. 17) d of the cons hese author uild and s RVQUAL UAL scale quality, su racteristicuality an
chers have and have im hich is wh ces offered. e great con define serv sumers of rs have init scale comp is adjusted consists uch as: re c (Adaptednd model
e tried to mplication hat the cus . However, ntribution vice quali services a tiated and u ponents of d and teste of 22 var eliability, d from Jobls
define and ns for the w stomer rec , when it c of Parasur ty as "the and their p used qualit f quality o ed in many riables to responsiv bber, 2004 d measure w service ceives and omes to qu amanet,al. e level dif perceptions tative resea of service different t measure t eness, ass 4) service quality, (2) the uality of , (1988, fference s of the arch and (called types of the five surance,tangibl scale co differen charact service service market M T quality before measur functio F and th functio results. es and em omplete se nt service teristics. M s as well a quality is s . Models of The model , worth an using the re the qua nality and Figure 2 From the m e quality nality desc (3) The i mpathy. Par ervice qual es. Howe Many other as in many s not cons service qu l quality as nd reliabili service and ality of se quality of 2.2 Gronr model, (1) is what c cribed how image is a rasuraman ity, worth ver, each researcher y other co istent with uality ssessment ty, and ca d value tha ervices, Gr the image oos model the quality customers w to be prov a very imp et, al.,(19 and reliabi h specific rs have also untries. Re h each oth and techni an be appli at custome ronroos gi (Figure 2. l of service y of the tech get from vided or ho portant fact 991) confir ility, and c service o tested thi esults show her in the cal / functi ied to all t ers receive iven three 1). e quality, S hnical desc the servi ow custom tor, which rmed that can be appl sectors is scale wit wed that th service sec ional by G types of t when usin criteria: Source: G cription of ce. (2) Q mers receive was built the SERV lied to all t have thei th various t he compon ctor and d Grcomplete customers ng the serv technical ronroos (1 f services p uality of e quality te mainly ba VQUAL types of ir own types of nents of different service s expect vice. To quality, 1984) provided Service echnical ased on
technical quality and functional quality of service, in addition to a number of other factors such as tradition, oral, pricing policy, PR).
In 1985, Parasuraman, Zeithaml and Berry created SERVQUAL model to assess the quality of services through a series of steps and focus on the concept of perceived quality. Its described how to be provided or how customers receive quality technical. The perceived quality objectively than the other concepts of quality through the research methods on different target groups, the researchers sought to understand the essential characteristics that a service provider needs to improve service quality. They found that those in the audience were given the same standard. Based on the analysis, they build ten criteria to evaluate the quality of service. Later, they found that the overlap between the ten criteria, so customers can only distinguish five criteria. The perceived quality of service are drawn from the attitude of consumers towards a particular product or service.
Service quality difference between reality and expectations of consumers. Therefore, creating a good method to assess the quality of service and to understand consumers want any kind of service is very useful. We can evaluate the quality of service based on five criteria:
+ Facilities + Credibility + Enthusiasm + Assurance + Empathy
To gather information on the expectations and perceived by consumers, the researchers conducted a survey to provide a complete system scales better. For example, the survey asked about the expectations of consumers in a particular field, categorized according to the scale from 1 to 10, 10 being completely agree, one is absolutely opposed. Then, with a similar classification system, this time asking about perceived by consumers of services. There are two systems above, we can calculate
the deg process Current of mark below a
2.5. Q
T banking test, co underst through conduc gree of diff s with 90 o tly there ar ket and cu along withQuality
Tsoukatos& g services ompared wi tand the de h a two-sta cted throug fference be other coupl re five crit ustomer ex sample quin bank
&Mastrojia in order to ith the figu eterminant age process gh the inve etween feel es evaluati teria as bef xpectations uestions can Figureking ser
anni (201 o build a s ures SERV ts of qualit s. The stud estigation ling and ex ion questio fore becau . Instead, n be asked 2.3 SERVrvice
0) studied specific qu VQUAL and ty in the in dy materia of Greek xpectation ons. se we have we now h d consumer VQUAL m d the dete uality scale d BSQ is b ndustry. T ls and exp banking s s of consu e changed have ten cr rs (Figure 2 model erminants e retail ban being used This researc eriments w system. Da umers. Rep due to the riteria in th 2.2) of quality nking and t in banks t ch was con were retriev ata were an peat this e impact he table y retail through to better nducted ved and nalyzedthrough reliability testing, factor analysis and regression to determine the components, evaluate the reliability and value of it. Research results show that the determinants of quality retail banking services are the guarantee / empathy, efficiency, reliability and confidence, a combination of SERVQUAL and BSQ.
Morales et al. (2011) studied the banking services quality in Canada and Tunisia. The study aimed to compare customersvalue of it. Research results show banks in Tunisia and Canada. They build a service quality scale for satisfaction and customer loyalty. Data were collected by questionnaire from two convenient sample groups of bank customers (n1 = n2 = 250 in Canada and 222 in Tunisia). Service quality is measured by the five elements: tangible, reliability, responsiveness, assurance and empathy. Data were analyzed by factors confirmed, ANOVA and linear regression. Research results show that Canadians are aware of the higher quality of service than the people of Tunisia.
Lymperopoulos&Chaniotakis (2006) studied the importance of service quality in the selection of the mortgage lender. This study aims to provide a deep understanding of customer buying behavior of banks related to the selection process. It provides bank managers with useful insight into the development of high quality relationships with customers. The study reviewed the documents available on the bank selection criteria and the field studies, then identify factors affecting the choice of customers, and the development of relevant management impact. A survey by questionnaire to 1,092 bank customers in Athens. Differentiating factors were identified as the main selection criteria affect the choice of the consumer bank. Bank service quality is the most important factor that customers consider to select their mortgage provider and establish a long term relationship with them. Three other reference element are product attributes, the access and communications.
Herington &Weaven (2007) also explored the impact of online services quality to the level of customer interest and the development of customer relationship. A survey to collect data from a sample agreement convenience of 200 Australian respondents who use online banking. Factor analysis and linear structural model was used to test the models. The study results showed that the quality of online services
affecting the interests of clients, reliability and the development of strong relationships with customers and customer loyalty. However, factors that "efficiency" of quality online services related to trust and also indirectly affect customer relationships through trust. Factor "personal needs" and "the organization's web site," the quality of online services relating to loyalty, including "personal needs" have the strongest impact. Customer delight no relationship with quality online service, nor a relationship with trust, power relationships or loyalty.
Kari Pikkarainen&TeroPikkarainen (2006) used the model EUCS (End-User Computing Satisfaction) to investigate the satisfaction of users of online banking services. A survey (n = 268) was conducted by sampling convenience. After if exploring factor analysis (EFA), the authors conducted factor analysis confirmed (CFA) with LISREL 8.7 for testing models of online banking services. Analytical results provide three components (content, ease of use, accuracy) from the original model, converted into EUCS2 EUCS model used in the analysis of the satisfaction of the users bank online to individual customers.
2.6. Customer satisfaction
Customer satisfaction is the key to long term success of any organization (Peppers & Rogers, 2005). The application of the knowledge of customer satisfaction is imperative to establishing and maintaining a long-term relationship with customers and long-term competitiveness
There are many different definitions of customer satisfaction. Many researchers believe that satisfaction is the difference between customer expectations and perceived reality. According to Hokanson (1995), satisfaction or disappointment after consumption, are defined as customer reaction to the evaluation by perceived differences between expectation before the consumer to feel the reality of consumer product after it.
Waarden (2008) suggests that satisfaction may be associated with feelings of acceptance, happiness, help, excitement, joy. According Waarden (2008, P.89), "Customer satisfaction is an overall attitude of the customer for a service provider, or
an emotional reaction to the difference between what customers predict before and what they receive, to meet some of the needs, objectives or desired. " According Zeithaml&Bitner (2000), customer satisfaction is the evaluation of the customer about a product or service has met the needs and expectations of them. Kotler (2005), defines "satisfaction as a sense of satisfaction or disappointment with the results of a comparison of the actual receiving of the product (or result) in connection with these forward Their wait ". Customer satisfaction is the customer base of its few insights for a product or service that forms the evaluations or subjective judgments. It is a form of psychological feeling after the needs of customers are met. Customer satisfaction is formed on the basis of the experience, particularly when shopping accumulation and use of the product or service. After the purchase and use of the product the customer will have the comparison between reality and expectations, which assess satisfaction or dissatisfaction.
So the feeling of comfort or maybe disappointment arising from the buyer to compare the actual benefits of products and expectations of customers are satisfied or not after purchase depends on whether they are comparing the actual benefits of the products and their expectations before purchase. Product concept here is to understand not just an ordinary material object that it includes services. This definition clearly shows that satisfaction is a comparison between the actual benefits felt and expectations. If the actual benefits are not as expected, the customer will be disappointed. Even if the actual benefits expected to meet with the customer set will be satisfied. If the benefit is higher than the expectations of customers, it will generate higher satisfaction phenomenon or is satisfied beyond expectations.
For bank that based customer oriented, the customer satisfaction is both a target and is a major factor in the success of the bank. In the context of the current competition, the customer satisfaction is very important to the development of the bank. To achieve high levels of customer satisfaction is very important to a bank, because customer satisfaction greatly affect their loyalty to the bank. If customers are satisfied with the products and services provided when used, the more likely they will come back transactions and introductions to others and vice versa.
2.7. Behavior intention
Behavior intention is usually considered as intention to repurchase; price sensitivity; and intention to recommend the service to third parties (word-of-mouth promotion). These dimensions are more frequently used as loyalty measures in the service literature (Jones and Taylor , 2007). Stuart and Tax (2004) propose that satisfaction influences costumers loyalty affects the profit value of the company. Reichheld and Sasser (1991) claimed that high levels of costumer’s satisfaction would generate high levels of retention, as they described in a retail bank case. it increased clients’ retention rate in 5% and boosted profits up to 85%.
In short, customer satisfaction has significant influence in the creation of the purchasing power of customers in the future. Therefore, banks need to understand what customers want through measures including improved service quality is reasonable that banks need to do.
2.8. The relationship of service quality, customer
satisfaction and behavior intention
Customer satisfaction is the customer's evaluation of a product or service meets the needs and expectations in component form SERVQUAL has been widely used (Reichheld et. al., 1990; Tsoukatos et. al., 2010; Ladhari et. al., 2011). It seems little doubt that SERVQUAL is a tool commonly used to evaluate the quality of service, not only was accepted by researchers, but it can also be used to measure the quality of services in many different areas _ perhaps more than any method other quality assessment. It is used in many fields, many branches and organizations in many different countries: USA, UK, Singapore, Korea, Malaysia, Saudi Arabia, Kuwait ...
In a nutshell, the theme of "Quality of Service" is increasingly heated because of the close relationship it has on the production cost factor (Crosby, 1979), the profits of the enterprise (Buzzell& Gale , 1987), customer satisfaction (Bolton & Drew, 1991), customer loyalty (Reichheld&Sasser, 1990), or positive word of mouth from customers. Moreover, for the financial banking services, especially retail
services,Vietnam banks have been strengthened, improving service quality, quality of service use as a tool edge effective paintings which form the foundation, developing steadily, surging ahead to meet those requirements, require urgent in the process of regional integration and the world. The results of academic research on this world hope is a useful reference for those working in marketing in the banking sector, although individual banks may also require specific studies to look regularly transparent about their service quality, thereby to work out the most effective marketing strategies.
Some authors suggest that between service quality and customer satisfaction coincide so these two concepts can be used interchangeably. A number of other studies that between customer satisfaction and service quality are two different concepts; customer satisfaction as a result, the quality of service as the cause; satisfied with forecasts expecting nature, quality of service is an ideal standard. According to Zeithaml and Bitner (2000), service quality and customer satisfaction are two different concepts, while the quality of services focused on specific components of service, customer satisfaction is the concept general.
There is no consensus among researchers about the concept, but the majority of studies suggest that between service quality and customer satisfaction has ties to each other . However, very few studies have focused on examining the explanatory power of the components of service quality on customer satisfaction, especially in the service sector specific (Ladhari, et al. 2011).So, a question to further study the relationship of the factors of service quality to customer satisfaction with a particular field.
Customer loyalty for the brand plays an important role for the success of your business. According to Kotler et al (2005), the cost of attracting new customers can cost 5 times the retention and customer satisfaction a current definition of loyalty is the degree to which a customer can show repetitive behaviors purchasing products and services from one provider, have a positive attitude towards suppliers and intended only use of products and services providers when needed.
Service quality is measured based on the quality gap, denoted Gi = Pi - Ei, between feeling (Perceptions - P) and customer expectations (Expectations - E) for the
quality of their services banks in the current context of Vietnam, according to the quality of SERVQUAL model by developing Parashuraman et al (1991). According to these authors, service quality was assessed according to five criteria: a tangible medium, reliability, assurance, responsiveness, and empathy.
From the theoretical, Quality of service is considered as the gap between service expectations and perceptions of customers using the service (Parasurman, Zeithaml and Berry, 1985.1988) lays present, there are two common models used to service quality evaluation model Gronroos (1984) _ so that service quality is evaluated on two aspects, (1) the technical quality and (2) the quality of function; and model Parasuraman et al. (1985) _ service quality evaluation is based in difference (gap). But perhaps the model Parasuraman et al used more commonly, because of specific, detailed and assessment tools to always be the author and his colleagues tested and updated.
Based on the traditional definition of quality of service, construction Parasuramanda SERVQUAL to assess the quality of services includes 22 dependent variable 5 components to measure the quality of service expectations and perceived
Reliability: The ability to make appropriate service and on time the first time
- When companies promise to do something in a certain time, they will do - When you encounter obstacles, the company demonstrated concern really wants to take care.
- Company services performed right the first time - The company provides services as they promised time - The company noted no errors to occur
Responsiveness: tell the desire and willingness of staff to provide services to customers
- Staff tells you when performing services - Staff quickly performs services for you
- The staff never too busy to meet your requirements Assurance: express understanding and gracious staff
- The behavior of employees cause you trust
- Do you feel safe in dealing with companies - The staff are always welcoming with you
- Employees have the knowledge to answer your questions
Empathy: demonstrate care to each individual customer.
- Company special attention to you
- The company has a staff of interest to you
- The company took advantage of you is their mind
- The employee understands your needs
- The company worked on the hour convenience
Tangibles: expressed appearance, attire service personnel and equipment to perform the service.
- The company uses modern technology
- The Company has spacious facilities
- Staff polite outfit
- The document introduces the company's services related to clear, beautiful
2.9. Hypotheses and research framework
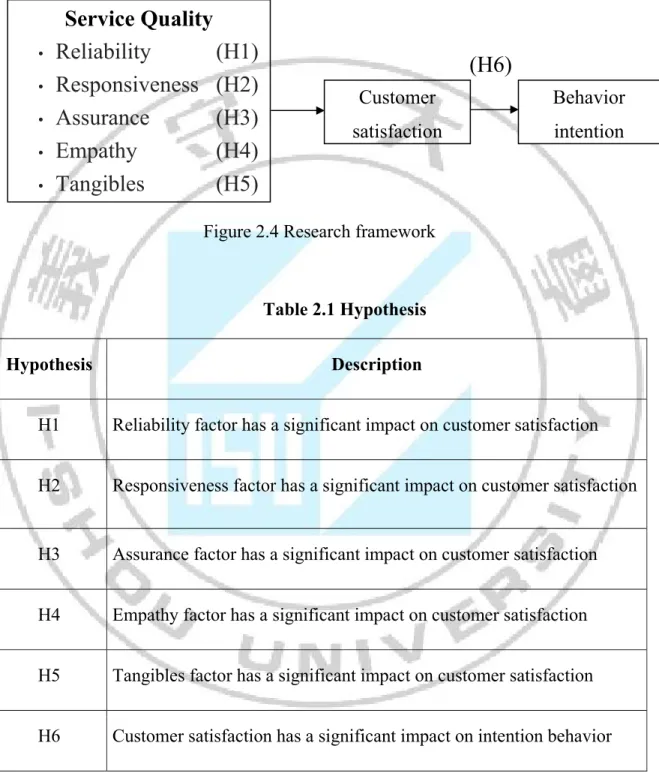
From the theory, this study develops the research model and hypotheses as flowing:
Figure 2.4 Research framework
Table 2.1 Hypothesis Hypothesis Description
H1 Reliability factor has a significant impact on customer satisfaction H2 Responsiveness factor has a significant impact on customer satisfaction
H3 Assurance factor has a significant impact on customer satisfaction H4 Empathy factor has a significant impact on customer satisfaction H5 Tangibles factor has a significant impact on customer satisfaction H6 Customer satisfaction has a significant impact on intention behavior
Service Quality
•Reliability
(H1)
•Responsiveness (H2)
•Assurance
(H3)
•Empathy
(H4)
•Tangibles
(H5)
Customer satisfaction Behavior intention(H6)
Chapter 3 RESEARCH METHOD
3.1. Introduction
Hughes and Sharrok (1997) have stated that there are two type of research methodology, including: positivism methodology and interpretive methodology. The differences between these two types of methodology came from the natural of them. Positivism method is usually used for the macro social phenomenon analysis by the data analysis tools based on the collected data. On the other hands, interpretive research methodology is often applied for micro social phenomenon research.
3.2. Sample design
The target population is customer who is currently using or used retailing service in VietinBank. According to Cooper and Schindler (2011), the important reasons that researchers use methods of non-probability sampling is the savings in cost and time. In addition, the author also reminds that the probability sampling is not always ensuring the accuracy and in some cases the probability sampling is not possible. However, the authors also state the biggest weakness of non-probability sampling method is a subjective in the sampling process could lead to distort research findings. Questionnaires was distributed to customer in Hanoi
3.3. Variable construct
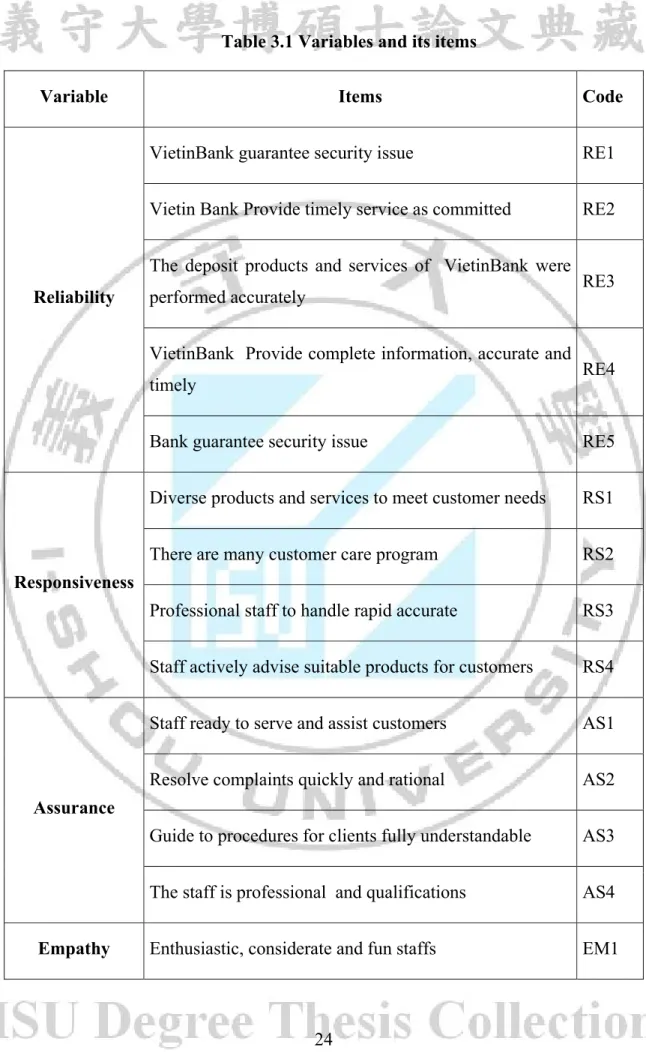
This study uses SERVQUAL model of Parasuraman (1988) to develop the questionnaire. There are 22 items distributing in 5 factors. The customer satisfaction variable these study uses scale of Bachelet (1995). The table 3.1 shows the variables and its items.
Table 3.1 Variables and its items
Variable Items Code
Reliability
VietinBank guarantee security issue RE1
Vietin Bank Provide timely service as committed RE2 The deposit products and services of VietinBank were
performed accurately RE3
VietinBank Provide complete information, accurate and
timely RE4
Bank guarantee security issue RE5
Responsiveness
Diverse products and services to meet customer needs RS1
There are many customer care program RS2
Professional staff to handle rapid accurate RS3 Staff actively advise suitable products for customers RS4
Assurance
Staff ready to serve and assist customers AS1
Resolve complaints quickly and rational AS2
Guide to procedures for clients fully understandable AS3 The staff is professional and qualifications AS4
Employees interested in the individual requirements of
the customer EM2
Always listen to customers EM3
Always polite, friendly customer EM4
Tangible
The location of transaction is convenience and in
accordance with customer needs TA1
Spacious transaction, using modern technology TA2 Nice layout of the counter, identifiable for Customers
reasonable TA3
The staff dresses polite TA4
Paper forms to be used in transactions were designed
easily TA5
Customer satisfaction
VietinBank offers more benefits than costs me money CS1 VietinBank is the best among competing banks CS2 VietinBank is much better than what I expected CS3
Behavior intention
Ready to become long-term customers of banks IB1
Ready to introduce family and friends IB2
If there are minor issues and comments will continue to
Likert scale was used to measure the perceived level of customer and their expectations about the quality of retail banking services, as well as customer loyalty, which from 1 "strong disagree ' to 7 995). The table 3.1 shows the variables and its items, the corresponding levels in between these two states. the survey was conducted customers during the period from March to May 2015 in Hanoi.
3.4. Pilot test
In this research, the pilot study for the first version of the questionnaire was conducted in May, 2015. Questions were sent to 30 students in the local MBA program to check how they understand the question. Then the question will be modified to have a final and ready for data collection.
3.5. Analysis
3.5.1. Reliability test
This study firstly use Cronbach alpha coefficient That is a statistical test allows, allows assessment of the reliability of the establishment of a "variable" sum based on multiple variables "single". This method allows the analysis of these variables eliminates inconsistent and limited junk variables in the research model. The correlation coefficient is a sea correlation of a variable with average scores of the other variables in the same scale, so the higher the coefficient of correlation of this variable with the other variables in the higher group . According to Nunnally&Burnstein (1994), these variables have a correlation coefficient of less than 3 gross variables are considered spam and will be removed from the scale. Accordingly, only those variables with a correlation coefficient of total conformity variables (Corrected Item-Total Corrlation) greater than 0.3 and an alpha coefficient greater than 0.6 to be considered acceptable and included in the analysis appropriate next steps. Many researchers agree that the Cronbach Alpha of 0.8 or higher to close the measurement scale as well, from 0.7 to 0.8 is almost unusable. Researchers also suggest that Cronbach's alpha of 0.6 or higher can be used in the case study concept is new or new to the respondents in the research context.
3.5.2.
F relation which w extent o basis fo variabl studies correlat testing. K factor a appropr the dat observe may ha C practica 0.3 is signific of at le size of load facFactor a
Factor ana nship betw was condu of the relat for a set o es upload , in which tion. Facto . KMO and analysis. KM riate, if KM ta. Bartlett ed variable ave been su Criteria fo al significa to achieve cant practic east 350, yo f 100 is cho ctor of abo Equanalysis
alysis was ween the o ucted accor tionship be of measure facility fac they boun or Analysis d Bartlett's MO value MO <0.5, t t's Test is es to zero i uitable for f or factor lo ance of EF e a minim cal. Selecti ou can cho osen load f out 50 facto uation 1: C (Sourceexplore
used to e observed v rding to th etween the ements to ctors. Num nd together s EFA is us Test is an of large (b the analysi used to t in general, factor analy oad factor FA. The va mum; great ion criteria oose load f factor coef ors that mu Cronbachs e: Cronbachd (EFA)
explore EF ariables an he type of e observed a shortene mber of fac r by rotatin seful in the n index us between 0.5 is of factor est the hy KMO wa ysis or not. r is greate alue of the ter than 0 a for the loafactor coef fficient gre ust be great seCronbac h, 1951)
)
FA to dete nd the late discovery variables a ed or redu ctors depen ng axis inte e initial exp sed to exam 5 and 1) is rs likely fu ypothesis H as used to t r than or coefficient .4 is impo ad factor v fficients gre eater than ter than 0.7 ch alpha co ermine the ent variabl to determ and factors ce the num nding on th ersecting v perimental mine the a meaningfu unction is n Ho: correla test whethe equal to 0 t of load fa ortant; gre value factor eater than 0.55; if the 75 (Hair, et o e structure les. EFA aine the sco s like basis mber of ob he basis of ectors to o steps or ex appropriate ul factor ana not appropr ation betw er the sam 0.5 to ens actor: grea eater than rs: the sam 0.3; if the e sample s t al, 2008). e of the analysis ope and s, as the bserved f model occur no xtended eness of alysis is riate for ween the mple size sure the ater than 0.5 are mple size sample size, the .
3.5.3. Linear regression
Regression analysis is to find dependencies of a variable, called the dependent variable to one or more other variables, called the independent variable for the purpose of estimating or predicting the expected value of the dependent variable when know the values of the independent variables Some other names of the dependent variable and the following independent variables:
Dependent variable: the variable is explained, forecasting variable, the regression variables, response variables, endogenous variables.
Independent variable: Explanatory variables, predictor variables, regression, variables or factors controlling variables, exogenous variables.. A multiple regression equation is stated as below:
Equation 2: Multiple regression equation Y = A + 2: Multiple regression
With Y: dependent variable X: independent/predictor variable
βX: independent/predictor variable equation
It is worth to indicate that the beta is expressed in the above equation is the most important factor. Beta illustrate the influence of the independent variable / dependent variable forecasts. In multiple regression, input method will be used which means that the variables included in the model at the same time to sort out the independent variables include the value of p (sig.) is less than 5% (or 0, 05). If the p-value less than 0.05 null- hypothesis (hypothesis Ho) will be rejected (no connection between the predictors and the dependent variable).
Chapter 4 RESULT
In this study, questionnaires was designed based on the previous literature and research methodology. There are two parts in the questionnaire. The first part is the tested construct, including factors that affect he customer satisfaction. The second part of the questionnaires included respondentparts in the questionnaire. The first part is the tested construct, including factors that affect survey was conducted in Hanoi. After that, the collected data was analyzed by SPSS software.
With 150 valid samples were conducted handled and analyzed with SPSS 20.0 software with the following results:
- Descriptive statistics analysis of respondent characteristic
- Assessment scale concepts by using the EFA and chronbach’s alpha - Regression analysis to test the hypothesis.
- T-Test and ANOVA test to find differences between the satisfaction and
behavior intention regarding to respondents demographic in retailing service at VietinBank
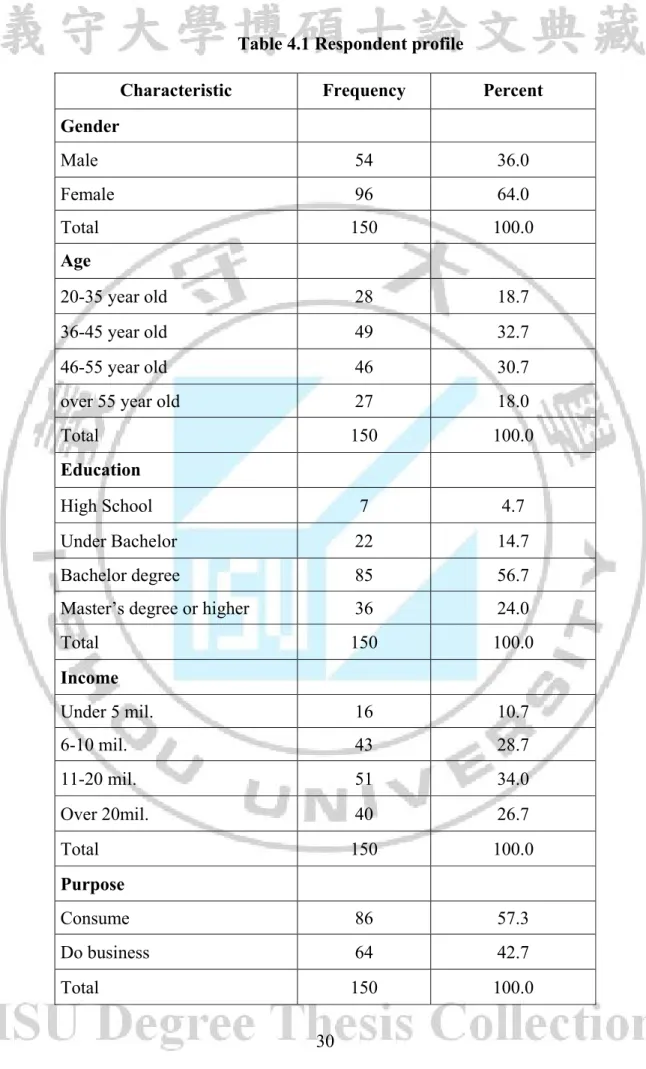
4.1. Respondent characteristic
According to result in the table 4.1, 150 respondents have been surveyed in the field of gender, the survey sample included 54 are male, counting for 36% and the female is 96, counting for 64%.
Table 4.1 Respondent profile
Characteristic Frequency Percent Gender Male 54 36.0 Female 96 64.0 Total 150 100.0 Age 20-35 year old 28 18.7 36-45 year old 49 32.7 46-55 year old 46 30.7
over 55 year old 27 18.0
Total 150 100.0
Education
High School 7 4.7
Under Bachelor 22 14.7
Bachelor degree 85 56.7
Master’s degree or higher 36 24.0
Total 150 100.0 Income Under 5 mil. 16 10.7 6-10 mil. 43 28.7 11-20 mil. 51 34.0 Over 20mil. 40 26.7 Total 150 100.0 Purpose Consume 86 57.3 Do business 64 42.7 Total 150 100.0
From table 4.1, result shows that almost customers in this survey are middle age. From 20-35 years old is 18.7% while the groups of 36-45 year old and 46-55 year old is 32.7% and 30.7%. The customer over 55 years old is only count for 18%. This result means that the customer who use the retailing service of VietinBank almost from 35 – 55 years old. This result is reasonable since the center bank is calling for reduce the interest rate for promoting production and business
Relating to education, there are 56.7% respondents have bachelor degree and 24.0% respondents have master degree or more. While there are only 4.7% respondents have high school degree and 14.7% have under bachelor degree.
In this study, income of respondent is asked to get the financial situation of customer who are using the retailing service of VietinBank, the result address that 10.7% of respondents have income VND 5 million per month, 28.7% belong to VND 6-10 million, 34% get VND 11-20 million per month while 26.7% have more than VND 20 VND million per month5.
For purpose of using retailing service of VietinBank, there are 57.3% of respondents using retailing banking service for family or individual consuming, and 42.7% of respondents use it for running business.
Reliability and factor analysis
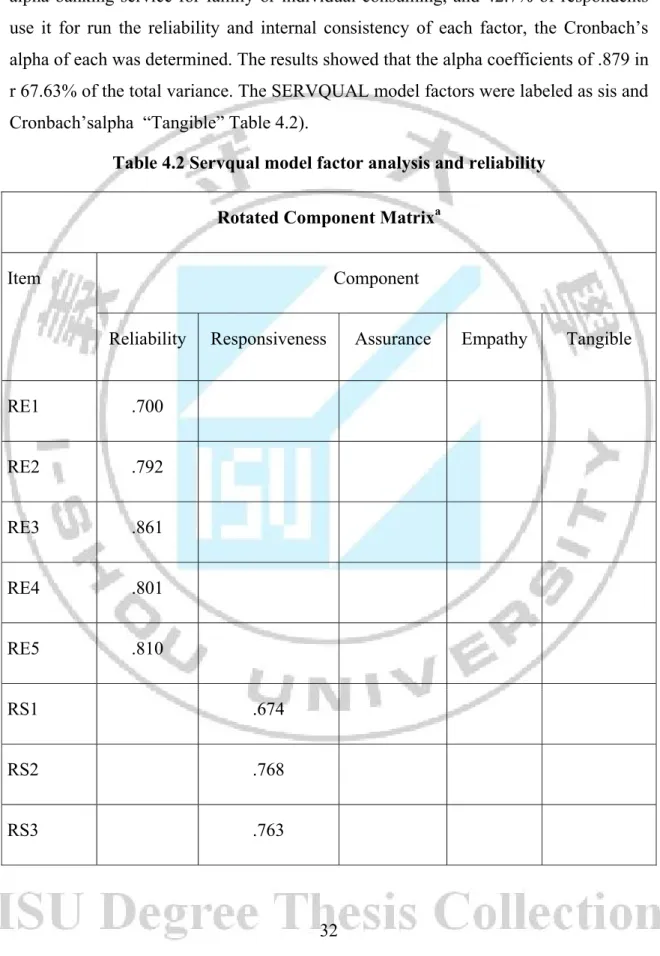
In this study, principle component method is used for explorative factor analysis and Cronbach’s alpha banking service for family or individual consuming, and 42.7% of respondents use it for running business. on per month, 28.7% belong to The result indicating that the Kaiser-Meyer-Olkin value was .783, and the Bartletts factor analysis and Cronbach’s alpha banking service for family or individual consuming, and 42.7% of respondents use it for running business. on per month, 28.7% belong to VND 6-10 million 3 items of the loading factor are less than 0.5 that have been removed from the model (Employees interested in the individual requirements of the customer; Nice layout of the counter, identifiable for Customers reasonable; The staff dresses polite).
5
The result of factor analysis revealed five factors accounting for 67.63% of the total variance. The SERVQUAL model factors were labeled as sis and Cronbach’s alpha banking service for family or individual consuming, and 42.7% of respondents use it for run the reliability and internal consistency of each factor, the Cronbach’s alpha of each was determined. The results showed that the alpha coefficients of .879 in r 67.63% of the total variance. The SERVQUAL model factors were labeled as sis and Cronbach’salpha “Tangible” Table 4.2).
Table 4.2 Servqual model factor analysis and reliability Rotated Component Matrixa
Item Component
Reliability Responsiveness Assurance Empathy Tangible
RE1 .700 RE2 .792 RE3 .861 RE4 .801 RE5 .810 RS1 .674 RS2 .768 RS3 .763
RS4 .612 AS1 .726 AS2 .797 AS3 .629 AS4 .703 EM1 .718 EM3 .821 EM4 .692 TA1 .687 TA2 .600 TA5 .690 Eigenvalue s 6.063 2.531 1.763 1.436 1.057 VE (%) 31.911 13.322 9.280 7.559 5.561 α .879 .781 .764 .679 .695
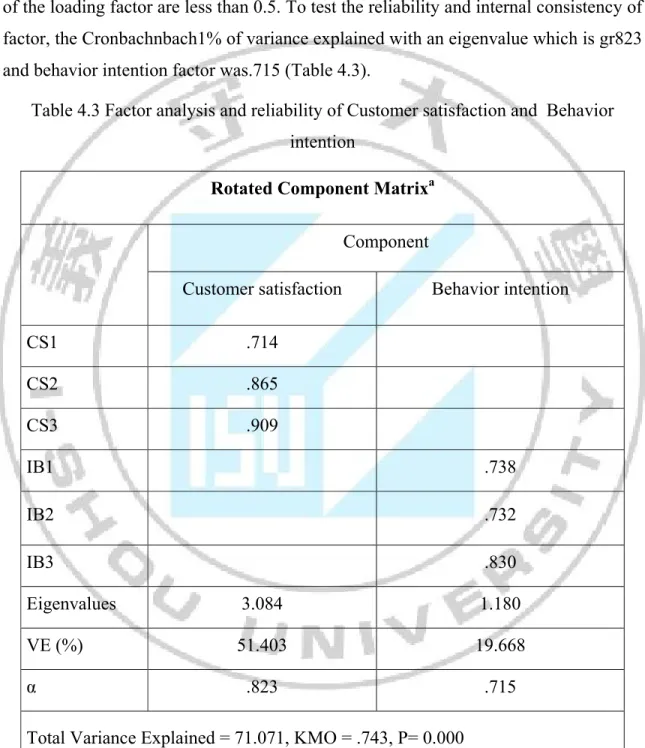
Regarding the customer satisfaction and behavior intention factors, there are 6 items are loaded. The result indicates that 71.071% of variance explained with an eigenvalue which is greater than 1.0 and the Kaiser-Meyer-Olkin value was 71.071, and the Bartlett’s Test of Sphericity was statistically significant at .000 level. No items of the loading factor are less than 0.5. To test the reliability and internal consistency of factor, the Cronbachnbach1% of variance explained with an eigenvalue which is gr823 and behavior intention factor was.715 (Table 4.3).
Table 4.3 Factor analysis and reliability of Customer satisfaction and Behavior intention
Rotated Component Matrixa
Component
Customer satisfaction Behavior intention
CS1 .714 CS2 .865 CS3 .909 IB1 .738 IB2 .732 IB3 .830 Eigenvalues 3.084 1.180 VE (%) 51.403 19.668 α .823 .715
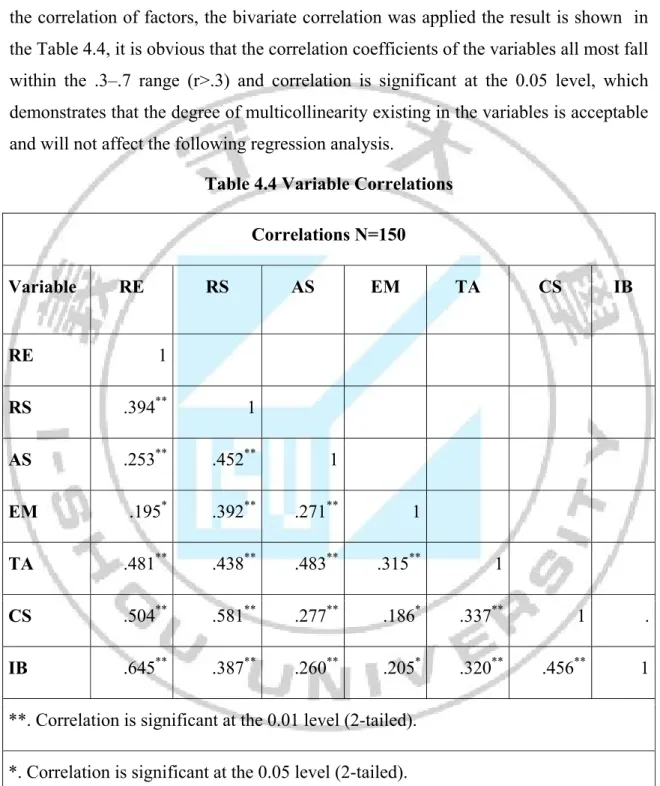
The result of the factor analysis is shown in Table 4.2 and table 4.3. From the result the Cronbach’s α were ranged from .879 to .679. Therefore, it demonstrates that all factors were accepted and reliable as recommended by Nunnally (1978). For testing the correlation of factors, the bivariate correlation was applied the result is shown in the Table 4.4, it is obvious that the correlation coefficients of the variables all most fall within the .3–.7 range (r>.3) and correlation is significant at the 0.05 level, which demonstrates that the degree of multicollinearity existing in the variables is acceptable and will not affect the following regression analysis.
Table 4.4 Variable Correlations Correlations N=150 Variable RE RS AS EM TA CS IB RE 1 RS .394** 1 AS .253** .452** 1 EM .195* .392** .271** 1 TA .481** .438** .483** .315** 1 CS .504** .581** .277** .186* .337** 1 . IB .645** .387** .260** .205* .320** .456** 1 **. Correlation is significant at the 0.01 level (2-tailed).
4.2. Hypothesis testing
4.2.1. The relationship of reliability and customer satisfaction
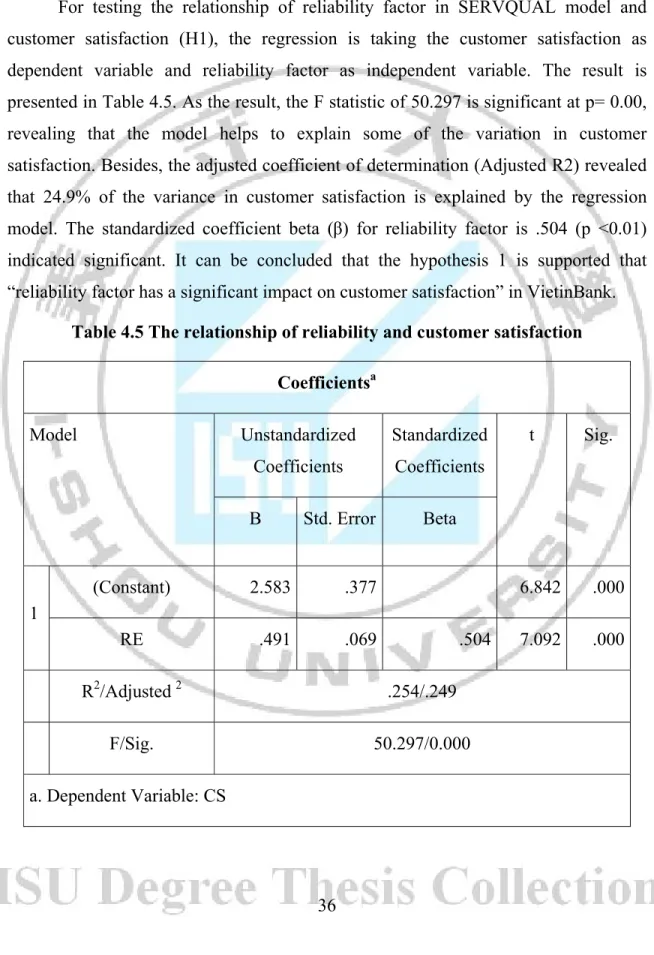
For testing the relationship of reliability factor in SERVQUAL model and customer satisfaction (H1), the regression is taking the customer satisfaction as dependent variable and reliability factor as independent variable. The result is presented in Table 4.5. As the result, the F statistic of 50.297 is significant at p= 0.00, revealing that the model helps to explain some of the variation in customer satisfaction. Besides, the adjusted coefficient of determination (Adjusted R2) revealed that 24.9% of the variance in customer satisfaction is explained by the regression model. The standardized coefficient beta (β) for reliability factor is .504 (p <0.01) indicated significant. It can be concluded that the hypothesis 1 is supported that “reliability factor has a significant impact on customer satisfaction” in VietinBank.
Table 4.5 The relationship of reliability and customer satisfaction Coefficientsa Model Unstandardized Coefficients Standardized Coefficients t Sig. B Std. Error Beta 1 (Constant) 2.583 .377 6.842 .000 RE .491 .069 .504 7.092 .000 R2/Adjusted 2 .254/.249 F/Sig. 50.297/0.000 a. Dependent Variable: CS
4.2.2. The relationship of responsiveness and customer satisfaction
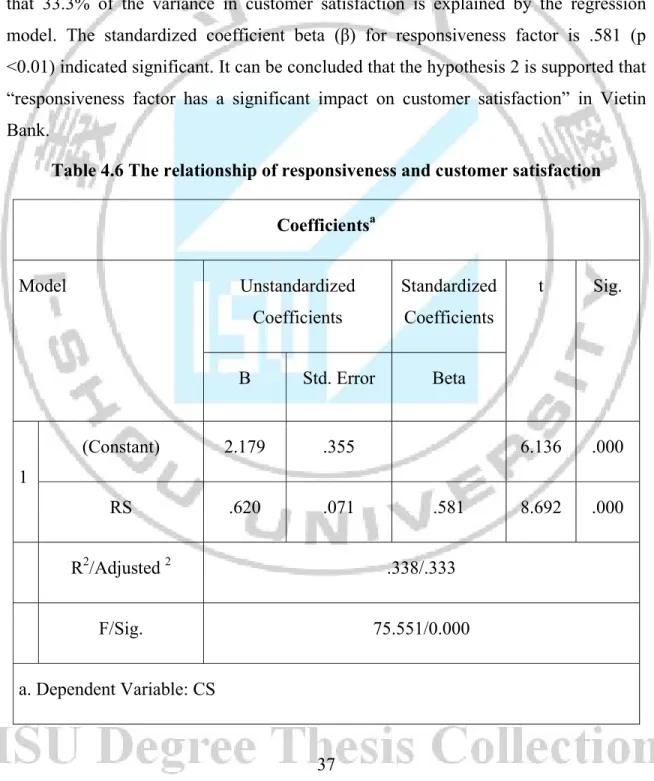
For testing the relationship of responsiveness factor in SERVQUAL model and customer satisfaction (H2), the regression is taking the customer satisfaction as dependent variable and responsiveness factor as independent variable. The result is presented in Table 4.6. As the result, the F statistic of 75.551 is significant at P= 0.00, revealing that the model helps to explain some of the variation in customer satisfaction. Besides, the adjusted coefficient of determination (Adjusted R2) revealed that 33.3% of the variance in customer satisfaction is explained by the regression model. The standardized coefficient beta (β) for responsiveness factor is .581 (p <0.01) indicated significant. It can be concluded that the hypothesis 2 is supported that “responsiveness factor has a significant impact on customer satisfaction” in Vietin Bank.
Table 4.6 The relationship of responsiveness and customer satisfaction Coefficientsa Model Unstandardized Coefficients Standardized Coefficients t Sig. B Std. Error Beta 1 (Constant) 2.179 .355 6.136 .000 RS .620 .071 .581 8.692 .000 R2/Adjusted 2 .338/.333 F/Sig. 75.551/0.000 a. Dependent Variable: CS
4.2.3. The relationship of Assurance and customer satisfaction
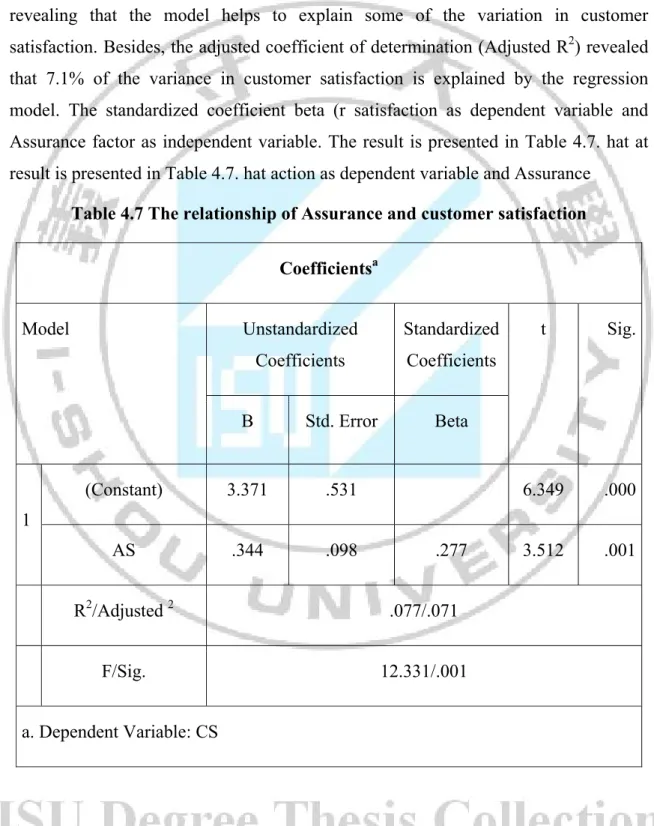
For testing the relationship of Assurance factor in SERVQUAL model and customer satisfaction (H3), the regression is taking the customer satisfaction as dependent variable and Assurance factor as independent variable. The result is presented in Table 4.7. As the result, the F statistic of 12.331is significant at P= 0.001, revealing that the model helps to explain some of the variation in customer satisfaction. Besides, the adjusted coefficient of determination (Adjusted R2) revealed that 7.1% of the variance in customer satisfaction is explained by the regression model. The standardized coefficient beta (r satisfaction as dependent variable and Assurance factor as independent variable. The result is presented in Table 4.7. hat at result is presented in Table 4.7. hat action as dependent variable and Assurance
Table 4.7 The relationship of Assurance and customer satisfaction Coefficientsa Model Unstandardized Coefficients Standardized Coefficients t Sig. B Std. Error Beta 1 (Constant) 3.371 .531 6.349 .000 AS .344 .098 .277 3.512 .001 R2/Adjusted 2 .077/.071 F/Sig. 12.331/.001 a. Dependent Variable: CS
4.2.4. The relationship of Empathy and customer satisfaction
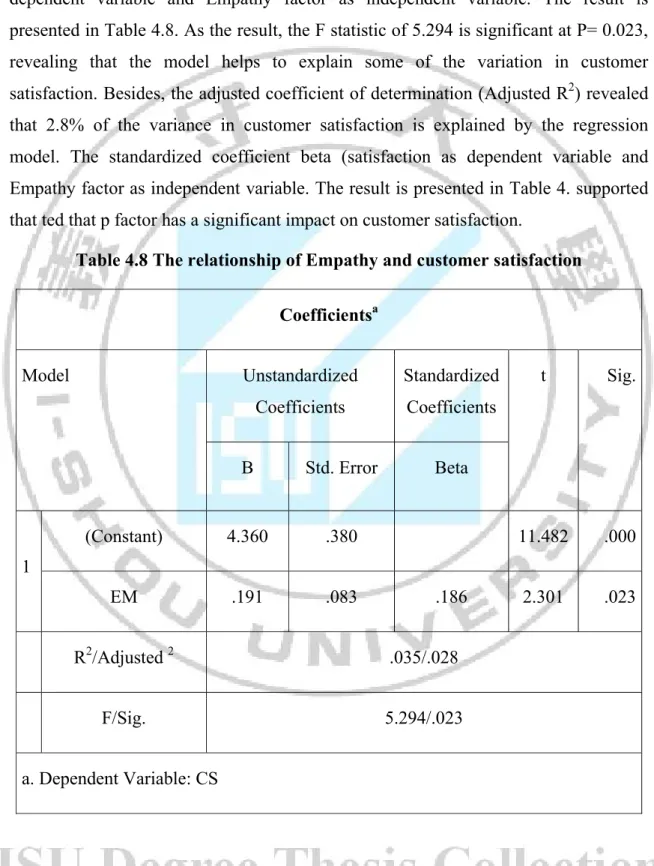
For testing the relationship of Empathy factor in SERVQUAL model and customer satisfaction (H4), the regression is taking the customer satisfaction as dependent variable and Empathy factor as independent variable. The result is presented in Table 4.8. As the result, the F statistic of 5.294 is significant at P= 0.023, revealing that the model helps to explain some of the variation in customer satisfaction. Besides, the adjusted coefficient of determination (Adjusted R2) revealed that 2.8% of the variance in customer satisfaction is explained by the regression model. The standardized coefficient beta (satisfaction as dependent variable and Empathy factor as independent variable. The result is presented in Table 4. supported that ted that p factor has a significant impact on customer satisfaction.
Table 4.8 The relationship of Empathy and customer satisfaction Coefficientsa Model Unstandardized Coefficients Standardized Coefficients t Sig. B Std. Error Beta 1 (Constant) 4.360 .380 11.482 .000 EM .191 .083 .186 2.301 .023 R2/Adjusted 2 .035/.028 F/Sig. 5.294/.023 a. Dependent Variable: CS
4.2.5. The relationship of Tangible and customer satisfaction
For testing the relationship of Tangible factor in SERVQUAL model and customer satisfaction (H5), the regression is taking the customer satisfaction as dependent variable and Tangible factor as independent variable. The result is presented in Table 4.9. As the result, the F statistic of 18.906 is significant at P= 0.000, revealing that the model helps to explain some of the variation in customer satisfaction. Besides, the adjusted coefficient of determination (Adjusted R2) revealed that 10.7% of the variance in customer satisfaction is explained by the regression model. The standardized coefficient beta (β) for Tangible factor is .337 (p <0.05) indicated significant. It can be concluded that the hypothesis 5 is supported that “Assurance factor has a significant impact on customer satisfaction” in VietinBank.
Table 4.9 The relationship of Tangible and customer satisfaction Coefficientsa Model Unstandardized Coefficients Standardized Coefficients t Sig. B Std. Error Beta 1 (Constant) 3.002 .514 5.835 .000 TA .413 .095 .337 4.348 .000 R2/Adjusted 2 .113/.107 F/Sig. 18.906/.000 a. Dependent Variable: CS
4.2.6. The relationship of customer satisfaction and behavior
intention
For testing the relationship of customer satisfaction factor in SERVQUAL model and behavior intention (H6), the regression is taking the behavior intention as dependent variable and customer satisfaction factor as independent variable. The result is presented in Table 4.10. As the result, the F statistic of 38.824 is significant at P= 0.000, revealing that the model helps to explain some of the variation in behavior intention. Besides, the adjusted coefficient of determination (Adjusted R2) revealed that 20.2% of the variance in behavior intention is explained by the regression model. The standardized coefficient beta (the behavior intention as dependent variable and customer satisfaction factor as independent variable. The result is present that the behavior intention as dependent variable and customer satisfaction factor as independent.
Table 4.10 The relationship of customer satisfaction and behavior intention Coefficientsa Model Unstandardized Coefficients Standardized Coefficients t Sig. B Std. Error Beta 1 (Constant) 2.422 .415 5.838 .000 CS .487 .078 .456 6.231 .000 R2/Adjusted 2 .208/.202 F/Sig. 38.824/.000 a. Dependent Variable: IB