科技部補助專題研究計畫報告
代謝型與情感型疾病交互作用的機制研究-代謝型疾病與憂鬱症
交互作用的機制研究:催產素的角色(3/3)
報 告 類 別 : 成果報告 計 畫 類 別 : 整合型計畫 計 畫 編 號 : MOST 108-2320-B-006-004-執 行 期 間 : 108年08月01日至109年07月31日 執 行 單 位 : 國立成功大學醫學系精神科 計 畫 主 持 人 : 陳柏熹 共 同 主 持 人 : 張惠華、歐弘毅 計畫參與人員: 碩士級-專任助理:吳珮瑄本研究具有政策應用參考價值:■否 □是,建議提供機關
(勾選「是」者,請列舉建議可提供施政參考之業務主管機關)
本研究具影響公共利益之重大發現:□否 □是
中 華 民 國 109 年 10 月 29 日
中 文 摘 要 : 近年之流行病學調查顯示情緒疾患與代謝異常發生率在全球均顯著 增加且彼此相關,而其相關醫療風險亦顯著增加,因此開始有研究 嘗試探討兩者之間是否有有共同之致病機轉。近期之遺傳學研究顯 示兩者之間並無共同之致病基因,而共通之環境因子益顯重要。已 知環境因子中社會壓力會造成邊緣系統下視丘-腦下垂體-腎上腺軸 活性之衡定性失常進而誘發情緒與代謝疾患。而參與社會壓力誘發 此兩種疾患之生物因子包含多種神經胜肽,皮質類固醇以及發炎因 子。其中催產激素是一種在下視丘生成之神經胜肽,在行為上催產 激素可影響情緒,社會認知已及調節社會壓力。近期之研究亦顯示 催產激素神經元可作為代謝感受體偵測體內葡萄糖濃度並在周邊調 節脂肪組織,肝臟已及胰臟之代謝恆定。因此,在本計畫我們假設 社會壓力會影響中樞與周邊催產激素系統之作用進而誘發情緒合併 代謝疾患。本研究將使用長期社交挫敗/社會孤立合併高脂飼糧誘導 肥胖之小鼠模式來做為社會壓力誘發情緒合併代謝疾患之動物模式 ,探討長期社會壓力與高脂飼糧對:(1)下視丘催產激素系統活性 狀態與邊緣腦區與週邊代謝組織中催產激素受體表現之影響與調控 機轉,(2)週邊葡萄糖、胰島素與瘦素濃度以及下視丘催產激素神 經元上之胰島素、瘦素受體與葡萄糖轉運體之表達及其投射之邊緣 腦區多巴胺系統活性之影響,最後運用此動物模式探討此狀況下 (3)在中樞與周邊投與催產激素、其衍生物以及受體拮抗劑對社會 行為與代謝調控之可能影響。目前之研究顯果顯示,長期社交挫敗 /社會孤立合併高脂飼糧誘導肥胖之小鼠其周邊血中催產素之濃度有 明顯改變。此外,若在群居之環境下,可降低長期社交挫敗/社會孤 立合併高脂飼糧後代謝異常之嚴重度。於對應之臨床研究中亦發現 (1)催產素受體基因多型性與葡萄糖恆定間之相關性,(2) 於情緒 疾患個案中社交支持可調節催產素系統進而減輕個案之孤獨感以及 壓力賀爾蒙,以及(3) 催產素對大腦多巴胺皮質紋狀體徑路求償系 統之回饋調節在雙相性情緒疾患個案有所缺損。 中 文 關 鍵 詞 : 催產激素,紋狀體,多巴胺,情感型疾病,代謝症候群,社會壓力 英 文 摘 要 : The prevalence of mood disorders (MoD) as well as metabolic
disorders (MetD) is concurrently growing worldwide, and both represent substantial risk factors for multiple medical complications. Moreover, they are the key factors that impact negatively in the prognosis for each other. Although MoDs and MetDs appear tightly interrelated, however, the underlying mechanisms have not been well characterized. Importantly, recent genetic studies
suggested no genetic correlation was observed between MoD and MetD. This indicated the MoD and MetD covariance might be better explained by environmental factors. Among
environmental factors, social stress related limbic system-hypothalamic-pituitary-adrenal (HPA) axis dysregulation is involved in the formation of MoD as well as MetD through mediators including neuropeptides, cortisol or pro-inflammatory factors. Oxytocin (OXT) is a cyclic
active OXT has been found to affect emotion, social
cognition as well as modulate reactivity to social stress. Recent studies have demonstrated OXT neurons function as glucose and metabolic sensors. In peripheral, OXT system could affect adipose tissue, liver and pancreas on their energy regulation. Accordingly, in the current study we hypothesize that central effect of OXT is one of the factors that link social stress induced MoD and MetD. By using the social defeated stress (SDS)/ social isolation (SI) with high fat diet (HFD) mouse model to represent the social stressed induced MoD and MetD condition, here we investigate the roles of social stress and HFD on: (Aim 1) of the changes of OXT system activity, the
function/expression of OXT receptor (OXTR) and its underlying epigenetic mechanisms, (Aim 2) the feedback regulations of OXT exocytosis by insulin and leptin in this model. We will measure the expression of insulin receptor, leptin receptor and glucose transporters in OXT neurons; dopaminergic activity in its conjugated mesolimbic brain regions. In (Aim 3) we will test the possible therapeutic effects of OXT on MoD-related behaviors and MetD-related indices. The levels of corticotropin-releasing hormone (CRH) and glucocorticoids will also be measured after the treatment. Results now showed OXT levels changes
significantly in social defeated stress (SDS)/ social isolation (SI) with high fat diet (HFD) mice. In addition, changing the housing coning by providing social interaction could alleviate their metabolic disturbance. On the other side, our clinical study also showed (1) the OXTR
polymorphism stratified the correlation of oxytocin and glucose homeostasis in non-diabetic subjects, (2) the Interaction of OXT and social support could reduce
loneliness and plasma cortisol levels in major depression and, (3) the dysregulation of OXT and dopamine in the corticostriatal circuitry in patients with bipolar II disorder.
英 文 關 鍵 詞 : Oxytocin, dopamine, mood disorders, metabolic syndrome, social stress, and striatum
目錄
目錄 ... I 計畫中文摘要 ... II 計畫英文摘要 ... III 前言 ... 1 研究目的: ... 5 文獻探討: ... 6 研究方法: ... 11 結果與討論(含結論與建議): ... 14計畫中文摘要。(五百字以內) 近年之流行病學調查顯示情緒疾患與代謝異常發生率在全球均顯著增加且彼此相關,而其相關醫 療風險亦顯著增加,因此開始有研究嘗試探討兩者之間是否有有共同之致病機轉。近期之遺傳學研究 顯示兩者之間並無共同之致病基因,而共通之環境因子益顯重要。已知環境因子中社會壓力會造成邊 緣系統下視丘-腦下垂體-腎上腺軸活性之衡定性失常進而誘發情緒與代謝疾患。而參與社會壓力誘發此 兩種疾患之生物因子包含多種神經胜肽,皮質類固醇以及發炎因子。其中催產激素是一種在下視丘生 成之神經胜肽,在行為上催產激素可影響情緒,社會認知已及調節社會壓力。近期之研究亦顯示催產 激素神經元可作為代謝感受體偵測體內葡萄糖濃度並在周邊調節脂肪組織,肝臟已及胰臟之代謝恆定。 因此,在本計畫我們假設社會壓力會影響中樞與周邊催產激素系統之作用進而誘發情緒合併代謝疾患。 本研究將使用長期社交挫敗/社會孤立合併高脂飼糧誘導肥胖之小鼠模式來做為社會壓力誘發情緒合 併代謝疾患之動物模式,探討長期社會壓力與高脂飼糧對:(1)下視丘催產激素系統活性狀態與邊緣 腦區與週邊代謝組織中催產激素受體表現之影響與調控機轉,(2)週邊葡萄糖、胰島素與瘦素濃度以 及下視丘催產激素神經元上之胰島素、瘦素受體與葡萄糖轉運體之表達及其投射之邊緣腦區多巴胺系 統活性之影響,最後運用此動物模式探討此狀況下(3)在中樞與周邊投與催產激素、其衍生物以及受 體拮抗劑對社會行為與代謝調控之可能影響。目前之研究顯果顯示,長期社交挫敗/社會孤立合併高脂 飼糧誘導肥胖之小鼠其周邊血中催產素之濃度有明顯改變。此外,若在群居之環境下,可降低長期社 交挫敗/社會孤立合併高脂飼糧後代謝異常之嚴重度。於對應之臨床研究中亦發現(1)催產素受體基 因多型性與葡萄糖恆定間之相關性,(2) 於情緒疾患個案中社交支持可調節催產素系統進而減輕個案之 孤獨感以及壓力賀爾蒙,以及(3) 催產素對大腦多巴胺皮質紋狀體徑路求償系統之回饋調節在雙相性情 緒疾患個案有所缺損。 關鍵字:催產激素,紋狀體,多巴胺,情感型疾病,代謝症候群,社會壓力
計畫英文摘要。(五百字以內)
The prevalence of mood disorders (MoD) as well as metabolic disorders (MetD) is concurrently growing worldwide, and both represent substantial risk factors for multiple medical complications. Moreover, they are the key factors that impact negatively in the prognosis for each other. Although MoDs and MetDs appear tightly interrelated, however, the underlying mechanisms have not been well characterized. Importantly, recent genetic studies suggested no genetic correlation was observed between MoD and MetD. This indicated the MoD and MetD covariance might be better explained by environmental factors. Among environmental factors, social stress related limbic system-hypothalamic-pituitary-adrenal (HPA) axis dysregulation is involved in the formation of MoD as well as MetD through mediators including neuropeptides, cortisol or pro-inflammatory factors. Oxytocin (OXT) is a cyclic neuropeptide synthetized in the hypothalamus. Behaviorally active OXT has been found to affect emotion, social cognition as well as modulate reactivity to social stress. Recent studies have demonstrated OXT neurons function as glucose and metabolic sensors. In peripheral, OXT system could affect adipose tissue, liver and pancreas on their energy regulation. Accordingly, in the current study we hypothesize that central effect of OXT is one of the factors that link social stress induced MoD and MetD. By using the social defeated stress (SDS)/ social isolation (SI) with high fat diet (HFD) mouse model to represent the social stressed induced MoD and MetD condition, here we investigate the roles of social stress and HFD on: (Aim 1) of the changes of OXT system activity, the function/expression of OXT receptor (OXTR) and its underlying epigenetic mechanisms, (Aim 2) the feedback regulations of OXT exocytosis by insulin and leptin in this model. We will measure the expression of insulin receptor, leptin receptor and glucose transporters in OXT neurons; dopaminergic activity in its conjugated mesolimbic brain regions. In (Aim 3) we will test the possible therapeutic effects of OXT on MoD-related behaviors and MetD-related indices. The levels of corticotropin-releasing hormone (CRH) and glucocorticoids will also be measured after the treatment. Results now showed OXT levels changes significantly in social defeated stress (SDS)/ social isolation (SI) with high fat diet (HFD) mice. In addition, changing the housing coning by providing social interaction could alleviate their metabolic disturbance. On the other side, our clinical study also showed (1) the OXTR polymorphism stratified the correlation of oxytocin and glucose homeostasis in non-diabetic subjects, (2) the Interaction of OXT and social support could reduce loneliness and plasma
cortisol levels in major depression and, (3) the dysregulation of OXT and dopamine in the corticostriatal
circuitry in patients with bipolar II disorder.
前言:
Social relationships and health
Social relationships, or the relative lack thereof, constitute a major risk factor for health—rivaling the effect of well-established health risk factors such as cigarette smoking, blood pressure, blood lipids, obesity and physical activity. Social relationships may provide social resources that promote adaptive behavioral or neuroendocrine responses to stressors [1]. Social relationships may be associated with the protective health effects directly through cognitive, emotional, behavioral, and biological means. Trends reveal reduced intergenerational living, greater social mobility, delayed marriage, dual-career families, increased single-residence households, and increased age-related disabilities indicate that the quantity and/or quality of social relationships in industrialized societies are decreasing [2]. Such findings suggest that despite increases in technology and globalization that would presumably foster social connections, people are becoming increasingly more socially isolated [3]. Given these trends, understanding the nature and extent of the association between social relationships and mortality is of importance [4].
Social stresses induce both MoD and MetD
Stress could be defined as ‘allostatic load and overload’ involving the cumulative wear-and-tear on the body and brain from adverse experiences over the life course in the social and physical environment along with resulting health-damaging behaviors [5]. Previous exposure to stressful conditions induce substantial biological changes that modify the maturation of neuroendocrine, autonomic, immune and metabolic systems involved in the active process of adaptation and maintaining homeostasis [6]. Brain circuits are plastic and remodeled by stress to change the balance between anxiety, mood control, memory, and decision making.
Social stress is stress that stems from one's relationships with others and from the social environment in general. Threats to social relationships may tap into the same neural and physiological 'alarm system' that responds to other critical survival threats, such as the threat or experience of physical harm. Similarly, experiences of social relationships may tap into basic reward-related mechanisms that have inhibitory relationships with threat-related responding. When social stress becomes chronic, one experienced emotional, behavioral, and physiological changes that can put one under greater risk for developing a mental disorder and physical illness [7, 8].
Loneliness predicts pain, depression, and fatigue [9]. Late-life depression in the elderly was reported to present with emotion dysregulation accompanied by high perceived loneliness [10]. People who were abused or neglected as children have increased lifetime risk for MoDs [11]. Previously abused or neglected study participants with depression were also more likely to meet the diagnostic criteria for at least one other mental disorder, such as post-traumatic stress disorder [12], drug dependence [13], dysthymia, or personality disorder. Childhood maltreatment, especially emotional abuse and neglect, represents a risk factor for severe, early-onset, treatment-resistant depression with a chronic course [14]. In addition, there are some biological correlates for adverse life experiences of childhood in BD patients [15]. An association between stressful social events and episode recurrences has repeatedly been found in BD patients [16]. Animal studies had showed social defeat and isolation induce clear signs of a depression-like state [17]. The strongest evidence to date suggesting that the development of the HPA axis may be affected by early life social stress [18]. A history of childhood abuse or neglect also contributes to the co-occurrence of depression and inflammation [19]. Role of childhood adversity in the development of medical co-morbidities associated with BD [20].
identified biomarkers related to inflammation, glucose and lipids as key players in allostatic overload [22]. In comparison with subjects not reporting any extremely stressful life events, those reporting work- or finance-related events had increased odds for having the metabolic syndrome [23]. The risk of insulin resistance, obesity, and triglycerides was further increased according to accumulation of stressful finance-related events [24]. In addition, obesity and diabetes in adults had a significant relationship to adverse social stresses in childhood [40]. Bullying victimization in childhood predicts obesity at mid-life. Importantly, the metabolic syndrome may be among the pathways by which loneliness increases risk of morbidity and mortality [25]. Animal studies also showed early social isolation increase both metabolic risk and depressive-Like behavior [26]. All evidences suggested social stress might play a causal role in the chain of events leading to the metabolic syndrome [27].
The bidirectional relationship between MoDs and MetD
Importantly, epidemiological studies indicate a bidirectional association between MoD and MetS [28]. In bipolar disorder (BD), a more severe form of MoD, epidemiologic evidences have also indicated increased metabolic disturbances patients with drug treatment [29]. Previous literature reported a 30-50% prevalence of metabolic syndrome in BD patients, which was higher than that in the general population [30]. Other studies indicated that 8% to 17% of BD patients have hyperglycemia and Type 2 diabetes, 17 to 36 % had high TG, 20 to 23% had low HDL-C, 36 to 49% had large waist circumferences, and 29 to 39% had hypertension [31]. These associations maybe related to increased risk of MetD in individuals with MoD, increased risk of MoD in individuals with MetD, or both. Prospective population studies had revealed MDD as a significant predictor of the onset of the metabolic syndrome and diabetes [32]. Conversely, longitudinal studies have also demonstrated that metabolic disturbances, including diabetes mellitus, predispose individuals to depressive symptoms [33]. Factors including gender and age could affect the bidirectional association.
Oxytocin system and social stress
In recent years, brain processes linked to social relationships have received considerable scientific attention. Extensive animal and recent human research have helped inform neuroendocrinological models of social cognition, motivation and behavior [34]. Oxytocin (OXT) is the neuropeptide originated from magnocellular neurons in the periventricular or supraoptic nucleus of the hypothalamus. In recent decades, studies revealed the multiple functions of OXT in human social behaviors. Evidence suggested that OXT system modulates multiple social and emotional cognitive domains in various emotional processing brain regions [35]. Regarding social relationship, The OXT system affects social attachment [7] and pro-social behavior modulation of the trust feeling, perceived threat prediction and parochial altruisms to promote in-group trust [36].
The central OXT system is also involved in the regulation of the HPA in a stressor- and site-specific manner [37]. Central administration of noradrenaline could stimulate OXT secretion into the circulation [38]. On the opposite, OXT injections in the PVN blocked these stress effects while promoting PVN GABA activity and release [39]. In human, healthy subjects with higher self-reports of depressive symptoms and stress had higher plasma OXT levels [40]. Epigenetic modification of OXTR genes might be involved in the mechanisms mediating the long-term influence of early adverse experiences and acute psychosocial stress on socio-behavioral outcomes [41, 42]. OXTR modulation could mediate some of the long-term effects of stress on memory, and possibly play a role in the regulation of HPA stress response [43].
Oxytocin system in mood disorder
Importantly, animal studies showed OXT regulated the salience of social cues together with the two important monoamines, serotonin and dopamine, that involved in mood disorders [44-46]. OXT modulates emotionality and hormonal stress responses. In animal studies, rats exposed to physical and emotional stressor found significant rise in OXT release within the hypothalamic PVN [47]. OXT also plays important roles in multiple aspects of mood disorders, including MDD and bipolar disorder [48]. Previous researches also indicated an important role of OXT as an underlying biological mechanism for stress-protective effects of positive social interactions [49].
Clinical evidence supports a role for HPA axis dysfunction in the pathogenesis of MoD, including MDD and BD [50]. Dysregulated patterns of OXT release with higher levels of cortisol had been observed in depression [51, 52]. Increased OXT mRNA expression and the number of OXT neuron in the PVN have been noted in post-mortem samples of depressed subjects [53, 54]. Compared to healthy control subjects, MDD subjects exhibited significantly higher plasma OXT concentrations [55]. Moreover, negative correlation between plasma OXT levels and severity of depressive symptoms has been observed in MDD patients [56]. In a population-based birth cohort study, perinatal OXT was associated with increased the risk of offspring BD and childhood cognitive impairment [57]. However, results from mixed patients group of MDD or BD had lower plasma OXT compared with healthy controls, both pre- and post-treatment [58].
Regarding the possible therapeutic effect of OXT on mood disorder, intranasal OXT could attenuate cortisol levels in stress response [59]. Intranasal OXT treated-monkeys exhibited lower ACTH concentrations after acute isolation [60]. In a placebo-controlled, double-blind study, the administration of OXT could enhance the buffering effect of social support to lower salivary cortisol concentrations as well as increase calmness and decrease anxiety on stress responsiveness [61]. Human and animal experimental evidence suggested that OXT revealed anxiolytic and anti-stress effects through its effects on the central amygdala and the hypothalamic PVN [62, 63]. OXT analogue, carbetocin, also demonstrated anti-depressant like effect in animal experiments [64].
Oxytocin and metabolic regulation
It is increasingly apparent that the brain plays a central role in metabolic homeostasis. Hypothalamic neuropeptides play essential roles in regulating energy and body weight [65]. OXT, a neuropeptide mainly originating from the hypothalamus, is important for energy homeostasis and regulating feeding behavior [66]. Mice that were genetically deficient either in OXT or receptor (OXTR) developed hyperphagia and obesity phenotypes [67]. On the opposite, palatable food regulates the activity of magnocellular oxytocin neurons. For example, the fat-induced satiety factor oleoylethanolamide could suppress feeding through central release of OXT [68]. Furthermore, impaired OXT release within the hypothalamic PVN is evident in DIO mice [69], which could lead to the decreased circulating levels in DIO mice [69], as well as obese humans and individuals with Type 2 diabetes [70]. Moreover, a reduced size and number of PVN OXT neurons is involved in the pathogenesis of Prader-Willi syndrome, a rare human genetic disorder characterized by hyperphagia and severe obesity [71].
Central administration of OXT is efficiently anorexigenic, reducing food intake and meal duration [72]. Previous studies demonstrated that anorexigenic effects would be regulated by co-activation of OXT neurons and AGRP neurons [73]. Parvocellular neurons of the paraventricular nucleus project to the caudal brainstem to regulate feeding via autonomic functions including the gastrointestinal vago-vagal reflex. In contrast, magnocellular neurons of the supraoptic and paraventricular nuclei release OXT from their dendrites to
diffuse to distant hypothalamic targets involved in satiety. The ventromedial hypothalamus, for example, expresses a high density of OXTR but does not contain detectable oxytocin nerve fibers.
In addition to homeostatic control, OXT may also have a role in reward-related feeding [74]. Human sutdies showed that OXT regulates nonhomeostatic reward-related energy intake [75]. And evidence from an animal study suggested that OXT may have a role in limiting the intake of palatable food by acting in the nucleus accumbens core [76]. Recent studies also demonstrated that supraoptic OXT neurons function as glucose and metabolic sensors [77]. And a feedback OXT secretion can be stimulated by changes in plasma glucose levels [78]. Importantly, OXT could act on effects on energy regulation tissues such as adipose tissue, liver and pancreas in peripheral [79]. The OXTR has been identified in pancreas and adipose tissue [80]. An insulin-like action of OXT has also been demonstrated in fat cells [81].
Regarding the possible therapeutic effect of OXT on metabolic disorders, Chronic central OXT infusion both reduced weight gain associated with the progression of HFD-induced obesity and elicited a sustained reduction of fat mass [82]. Peripheral OXT or analogs administration would improve the insulin sensitivity and even decrease the body weight in the treating obesity and diabetes [83]. Moreover, a newly published clinical trial showed body weight dependent inhibitory effect of intranasal OXT administration on food intake. Interestingly, a rat study demonstrated a similar result [84].
研究目的:
Social stress related limbic system-HPA axis dysregulation is involved in the formation of MoD, as well as metabolic disorders MetD through mediators including neuropeptides, cortisol or pro-inflammatory factors. The prevalence of these two conditions is concurrently growing worldwide, and both represent substantial risk factors for multiple medical complications [85]. Moreover, MetS is the key factor that impacts negatively in MoD prognosis [86]. Although MoD and MetD appear tightly interrelated, however, the underlying mechanisms have not been well characterized [28]. Importantly, recent genetic studies using linkage disequilibrium score regression analyses suggested no genetic correlation was observed between MoD and MetD [87]. This indicated the MoD and MetD covariance might be better explained by environmental factors. Therefore, to understand the shared neurobiological mechanisms influenced by environmental factors is of clinical importance.
Because behaviorally active OXT has been found to affect emotion, social cognition as well as modulate reactivity to social stress. And studies have demonstrated OXT neurons function as glucose and metabolic sensors. In peripheral, OXT system could affect adipose tissue, liver and pancreas on their energy regulation. Accordingly, in the current study we hypothesize that central effect of OXT is one of the factors that link social stress induced MoD and MetD. By using the social defeated stress (SDS)/ social isolation (SI) with high fat diet (HFD) mouse model to represent the social stressed induced MoD and MetD condition, here we will investigate the roles of social stress and HFD on: (Aim 1) of the changes of OXT system activity, the function/expression of OXT receptor (OXTR) and its underlying epigenetic mechanisms, (Aim 2) the feedback regulations of OXT exocytosis by insulin and leptin in this model. We will measure the expression of insulin receptor, leptin receptor and glucose transporters in OXT neurons; dopaminergic activity in its conjugated mesolimbic brain regions. In (Aim 3) we will test the possible therapeutic effects of OXT on MoD-related behaviors and MetD-related indices. The levels of corticotropin-releasing hormone (CRH) and glucocorticoids will also be measured after the treatment.
文獻探討:
1. Nickerson, A., et al., The longitudinal relationship between post-traumatic stress disorder and
perceived social support in survivors of traumatic injury. Psychol Med, 2016: p. 1-12.
2. Fu, T.S., et al., Changing trends in the prevalence of common mental disorders in Taiwan: a 20-year
repeated cross-sectional survey. Lancet, 2013. 381(9862): p. 235-41.
3. Kato, T.A., et al., Are Japan's hikikomori and depression in young people spreading abroad? Lancet, 2011. 378(9796): p. 1070.
4. Holt-Lunstad, J., T.B. Smith, and J.B. Layton, Social relationships and mortality risk: a meta-analytic
review. PLoS Med, 2010. 7(7): p. e1000316.
5. McEwen, B.S., Protective and damaging effects of stress mediators. N Engl J Med, 1998. 338(3): p. 171-9.
6. Sandi, C. and J. Haller, Stress and the social brain: behavioural effects and neurobiological
mechanisms. Nat Rev Neurosci, 2015. 16(5): p. 290-304.
7. Meyer-Lindenberg, A. and H. Tost, Neural mechanisms of social risk for psychiatric disorders. Nat Neurosci, 2012. 15(5): p. 663-8.
8. Eisenberger, N.I. and S.W. Cole, Social neuroscience and health: neurophysiological mechanisms
linking social ties with physical health. Nat Neurosci, 2012. 15(5): p. 669-74.
9. Jaremka, L.M., et al., Loneliness predicts pain, depression, and fatigue: understanding the role of
immune dysregulation. Psychoneuroendocrinology, 2013. 38(8): p. 1310-7.
10. Wong, N.M., et al., Loneliness in late-life depression: structural and functional connectivity during
affective processing. Psychol Med, 2016. 46(12): p. 2485-99.
11. Widom, C.S., K. DuMont, and S.J. Czaja, A prospective investigation of major depressive disorder and
comorbidity in abused and neglected children grown up. Arch Gen Psychiatry, 2007. 64(1): p. 49-56.
12. MD, D.E.B., et al., Neuropsychological findings in childhood neglect and their relationships to
pediatric PTSD. J Int Neuropsychol Soc, 2009. 15(6): p. 868-78.
13. Rogosch, F.A., A. Oshri, and D. Cicchetti, From child maltreatment to adolescent cannabis abuse and
dependence: a developmental cascade model. Dev Psychopathol, 2010. 22(4): p. 883-97.
14. Nelson, J., et al., Childhood maltreatment and characteristics of adult depression: meta-analysis. Br J Psychiatry, 2016.
15. Palmier-Claus, J.E., et al., Relationship between childhood adversity and bipolar affective disorder:
systematic review and meta-analysis. Br J Psychiatry, 2016. 209(6): p. 454-459.
16. Carter, C.S., The chemistry of child neglect: do oxytocin and vasopressin mediate the effects of early
experience? Proc Natl Acad Sci U S A, 2005. 102(51): p. 18247-8.
17. Francis, T.C., et al., Nucleus accumbens medium spiny neuron subtypes mediate depression-related
outcomes to social defeat stress. Biol Psychiatry, 2015. 77(3): p. 212-22.
18. Shea, A., et al., Child maltreatment and HPA axis dysregulation: relationship to major depressive
disorder and post traumatic stress disorder in females. Psychoneuroendocrinology, 2005. 30(2): p.
162-78.
19. Danese, A., et al., Elevated inflammation levels in depressed adults with a history of childhood
maltreatment. Arch Gen Psychiatry, 2008. 65(4): p. 409-15.
21. Alam, I., et al., Obesity, metabolic syndrome and sleep apnoea: all pro-inflammatory states. Obes Rev, 2007. 8(2): p. 119-27.
22. Wiley, J.F., et al., Modeling Multisystem Physiological Dysregulation. Psychosom Med, 2016. 78(3): p. 290-301.
23. Pyykkonen, A.J., et al., Stressful life events and the metabolic syndrome: the prevalence, prediction
and prevention of diabetes (PPP)-Botnia Study. Diabetes Care, 2010. 33(2): p. 378-84.
24. Raikkonen, K., K.A. Matthews, and L.H. Kuller, Depressive symptoms and stressful life events predict
metabolic syndrome among middle-aged women: a comparison of World Health Organization, Adult Treatment Panel III, and International Diabetes Foundation definitions. Diabetes Care, 2007. 30(4): p.
872-7.
25. Whisman, M.A., Loneliness and the metabolic syndrome in a population-based sample of middle-aged
and older adults. Health Psychol, 2010. 29(5): p. 550-4.
26. Vargas, J., et al., Early Life Stress Increases Metabolic Risk, HPA Axis Reactivity, and Depressive-Like
Behavior When Combined with Postweaning Social Isolation in Rats. PLoS One, 2016. 11(9): p.
e0162665.
27. Rutters, F., et al., Stressful life events and incident metabolic syndrome: the Hoorn study. Stress, 2015. 18(5): p. 507-13.
28. Lyketsos, C.G., Depression and diabetes: more on what the relationship might be. Am J Psychiatry, 2010. 167(5): p. 496-7.
29. Taylor, V. and G. MacQueen, Associations between bipolar disorder and metabolic syndrome: A
review. J Clin Psychiatry, 2006. 67: p. 1034-41.
30. Ford, E.S., et al., Prevalence of the metabolic syndrome among US adults: findings from the third
National Health and Nutrition Examination Survey. JAMA, 2002. 287: p. 356-59.
31. van Winkel, R., et al., Prevalence of diabetes and the metabolic syndrome in a sample of patients with
bipolar disorder. Bipolar Disorders, 2008. 10(2): p. 342-8.
32. Goldbacher, E.M., J. Bromberger, and K.A. Matthews, Lifetime history of major depression predicts
the development of the metabolic syndrome in middle-aged women. Psychosom Med, 2009. 71(3): p.
266-72.
33. Koponen, H., et al., Metabolic syndrome predisposes to depressive symptoms: a population-based
7-year follow-up study. J Clin Psychiatry, 2008. 69(2): p. 178-82.
34. McCall, C. and T. Singer, The animal and human neuroendocrinology of social cognition, motivation
and behavior. Nat Neurosci, 2012. 15(5): p. 681-8.
35. Maroun, M. and S. Wagner, Oxytocin and Memory of Emotional Stimuli: Some Dance to Remember,
Some Dance to Forget. Biological Psychiatry, 2016. 79(3): p. 203-212.
36. De Dreu, C.K., et al., The neuropeptide oxytocin regulates parochial altruism in intergroup conflict
among humans. Science, 2010. 328(5984): p. 1408-11.
37. Engelmann, M., R. Landgraf, and C.T. Wotjak, The hypothalamic-neurohypophysial system regulates
the hypothalamic-pituitary-adrenal axis under stress: an old concept revisited. Front Neuroendocrinol,
2004. 25(3-4): p. 132-49.
38. Onaka, T., Neural pathways controlling central and peripheral oxytocin release during stress. J Neuroendocrinol, 2004. 16(4): p. 308-12.
39. Smith, A.S., et al., Local oxytocin tempers anxiety by activating GABAA receptors in the hypothalamic
40. Holt-Lunstad, J., W. Birmingham, and K.C. Light, The influence of depressive symptomatology and
perceived stress on plasma and salivary oxytocin before, during and after a support enhancement intervention. Psychoneuroendocrinology, 2011. 36(8): p. 1249-56.
41. Unternaehrer, E., et al., Dynamic changes in DNA methylation of stress-associated genes (OXTR,
BDNF ) after acute psychosocial stress. Transl Psychiatry, 2012. 2: p. e150.
42. Kumsta, R., et al., Epigenetic regulation of the oxytocin receptor gene: implications for behavioral
neuroscience. Front Neurosci, 2013. 7: p. 83.
43. Liberzon, I. and E.A. Young, Effects of stress and glucocorticoids on CNS oxytocin receptor binding. Psychoneuroendocrinology, 1997. 22(6): p. 411-22.
44. Shamay-Tsoory, S.G. and A. Abu-Akel, The Social Salience Hypothesis of Oxytocin. Biol Psychiatry, 2016. 79(3): p. 194-202.
45. Dolen, G., et al., Social reward requires coordinated activity of nucleus accumbens oxytocin and
serotonin. Nature, 2013. 501(7466): p. 179-84.
46. Kato, T., Molecular neurobiology of bipolar disorder: a disease of 'mood-stabilizing neurons'? Trends Neurosci, 2008. 31(10): p. 495-503.
47. Bosch, O.J., et al., Release of oxytocin in the hypothalamic paraventricular nucleus, but not central
amygdala or lateral septum in lactating residents and virgin intruders during maternal defence.
Neuroscience, 2004. 124(2): p. 439-48.
48. Turan, T., et al., May oxytocin be a trait marker for bipolar disorder? Psychoneuroendocrinology, 2013. 38(12): p. 2890-6.
49. Heinrichs, M., et al., Social support and oxytocin interact to suppress cortisol and subjective responses
to psychosocial stress. Biol Psychiatry, 2003. 54(12): p. 1389-98.
50. Belvederi Murri, M., et al., The HPA axis in bipolar disorder: Systematic review and meta-analysis. Psychoneuroendocrinology, 2016. 63: p. 327-42.
51. Cox, E.Q., et al., Oxytocin and HPA stress axis reactivity in postpartum women. Psychoneuroendocrinology, 2015. 55: p. 164-72.
52. Neumann, I.D. and R. Landgraf, Balance of brain oxytocin and vasopressin: implications for anxiety,
depression, and social behaviors. Trends Neurosci, 2012. 35(11): p. 649-59.
53. Meynen, G., et al., Hypothalamic oxytocin mRNA expression and melancholic depression. Mol Psychiatry, 2007. 12(2): p. 118-9.
54. Purba, J.S., et al., Increased number of vasopressin- and oxytocin-expressing neurons in the
paraventricular nucleus of the hypothalamus in depression. Arch Gen Psychiatry, 1996. 53(2): p.
137-43.
55. Parker, K.J., et al., Preliminary evidence that plasma oxytocin levels are elevated in major depression. Psychiatry Res, 2010. 178(2): p. 359-62.
56. Scantamburlo, G., et al., Plasma oxytocin levels and anxiety in patients with major depression. Psychoneuroendocrinology, 2007. 32(4): p. 407-10.
57. Freedman, D., et al., Perinatal oxytocin increases the risk of offspring bipolar disorder and childhood
cognitive impairment. J Affect Disord, 2015. 173: p. 65-72.
58. Ozsoy, S., E. Esel, and M. Kula, Serum oxytocin levels in patients with depression and the effects of
gender and antidepressant treatment. Psychiatry Res, 2009. 169(3): p. 249-52.
60. Parker, K.J., et al., Intranasal oxytocin administration attenuates the ACTH stress response in monkeys. Psychoneuroendocrinology, 2005. 30(9): p. 924-9.
61. Heinrichs, M., et al., Social support and oxytocin interact to suppress cortisol and subjective responses
to psychosocial stress. Biological Psychiatry, 2003. 54(12): p. 1389-1398.
62. Neumann, I.D., Brain oxytocin: a key regulator of emotional and social behaviours in both females
and males. J Neuroendocrinol, 2008. 20(6): p. 858-65.
63. Neumann, I.D. and D.A. Slattery, Oxytocin in General Anxiety and Social Fear: A Translational
Approach. Biol Psychiatry, 2016. 79(3): p. 213-21.
64. Chaviaras, S., et al., Assessing the antidepressant-like effects of carbetocin, an oxytocin agonist, using
a modification of the forced swimming test. Psychopharmacology (Berl), 2010. 210(1): p. 35-43.
65. Arora, S. and Anubhuti, Role of neuropeptides in appetite regulation and obesity--a review. Neuropeptides, 2006. 40(6): p. 375-401.
66. Olszewski, P.K., et al., Molecular, immunohistochemical, and pharmacological evidence of oxytocin's
role as inhibitor of carbohydrate but not fat intake. Endocrinology, 2010. 151(10): p. 4736-44.
67. Kasahara, Y., et al., Oxytocin receptor in the hypothalamus is sufficient to rescue normal
thermoregulatory function in male oxytocin receptor knockout mice. Endocrinology, 2013. 154(11): p.
4305-15.
68. Gaetani, S., et al., The fat-induced satiety factor oleoylethanolamide suppresses feeding through
central release of oxytocin. J Neurosci, 2010. 30(24): p. 8096-101.
69. Zhang, G., et al., Neuropeptide exocytosis involving synaptotagmin-4 and oxytocin in hypothalamic
programming of body weight and energy balance. Neuron, 2011. 69(3): p. 523-35.
70. Qian, W., et al., Decreased circulating levels of oxytocin in obesity and newly diagnosed type 2
diabetic patients. J Clin Endocrinol Metab, 2014. 99(12): p. 4683-9.
71. Swaab, D.F., J.S. Purba, and M.A. Hofman, Alterations in the hypothalamic paraventricular nucleus
and its oxytocin neurons (putative satiety cells) in Prader-Willi syndrome: a study of five cases. J Clin
Endocrinol Metab, 1995. 80(2): p. 573-9.
72. Sabatier, N., G. Leng, and J. Menzies, Oxytocin, feeding, and satiety. Front Endocrinol (Lausanne), 2013. 4: p. 35.
73. Atasoy, D., et al., Deconstruction of a neural circuit for hunger. Nature, 2012. 488(7410): p. 172-7. 74. Klockars, A., A.S. Levine, and P.K. Olszewski, Central oxytocin and food intake: focus on
macronutrient-driven reward. Front Endocrinol (Lausanne), 2015. 6: p. 65.
75. Ott, V., et al., Oxytocin reduces reward-driven food intake in humans. Diabetes, 2013. 62(10): p. 3418-25.
76. Herisson, F.M., et al., Oxytocin Acting in the Nucleus Accumbens Core Decreases Food Intake. J Neuroendocrinol, 2016. 28(4).
77. Song, Z., et al., Supraoptic oxytocin and vasopressin neurons function as glucose and metabolic
sensors. Am J Physiol Regul Integr Comp Physiol, 2014. 306(7): p. R447-56.
78. Altszuler, N. and A.R. Fuchs, Oxytocin secretion is stimulated by changes in glucose metabolism. Proc Soc Exp Biol Med, 1994. 207(1): p. 38-42.
79. Bjorkstrand, E., M. Eriksson, and K. Uvnas-Moberg, Evidence of a peripheral and a central effect of
oxytocin on pancreatic hormone release in rats. Neuroendocrinology, 1996. 63(4): p. 377-83.
80. Chaves, V.E., et al., Role of oxytocin in energy metabolism. Peptides, 2013. 45: p. 9-14.
82. Blevins, J.E., et al., Chronic CNS oxytocin signaling preferentially induces fat loss in high-fat diet-fed
rats by enhancing satiety responses and increasing lipid utilization. Am J Physiol Regul Integr Comp
Physiol, 2016. 310(7): p. R640-58.
83. Zhang, H., et al., Treatment of obesity and diabetes using oxytocin or analogs in patients and mouse
models. PLoS One, 2013. 8(5): p. e61477.
84. Balazova, L., et al., Metabolic effects of subchronic peripheral oxytocin administration in lean and
obese zucker rats. J Physiol Pharmacol, 2016. 67(4): p. 531-541.
85. Hossain, P., B. Kawar, and M. El Nahas, Obesity and diabetes in the developing world--a growing
challenge. N Engl J Med, 2007. 356: p. 213-5.
86. Garcia-Toro, M., et al., Obesity, metabolic syndrome and Mediterranean diet: Impact on depression
outcome. J Affect Disord, 2016. 194: p. 105-8.
87. Clarke, T.K., et al., Investigating shared aetiology between type 2 diabetes and major depressive
disorder in a population based cohort. Am J Med Genet B Neuropsychiatr Genet, 2016.
88. Golden, S.A., et al., A standardized protocol for repeated social defeat stress in mice. Nat Protoc, 2011. 6(8): p. 1183-91.
89. Huang, Y.R., et al., [123I]Epidepride neuroimaging of dopamine D2/D3 receptor in chronic
研究方法:
Research principles and methods
The housing for control conditions in both chow and HFD groups were two mice in one cage. The mice received social defeats were further divided into social isolation (SI, one mouse in a cage) and social support (SS, two mice in a cage) conditions.
Chronic social defeat stress (SD) mice model: Eight-week-old male C57BL/6 mice from the animal center
of National Cheng Kung University Medical College will be housed in plastic cages in a temperature- and humidity-controlled colony room on a 12-h light/dark cycle with lights on at 06:00. Food and water were provided ad libitum. All experiments were performed during the light cycle. This study was complied with the National Institutes of Health Guide for the Care and Use of Laboratory Animals (NIH Publication No. 80-23) revised in 1996. The local Animal Care Committee at National Cheng Kung University College of Medicine would approve all procedures.
A modified protocol for repeated social defeat stress in mice will be followed {Golden, 2011 #98}. CD-1 male mice, selected on the basis of their attack latency (shorter than 600s) and bouts of attack per 10 min (more than 3 bouts of attack per 10 min on 3 consecutive screening tests), will be used as aggressor. C57BL/6 mice will be exposed to a different unfamiliar CD-1 aggressor each day for 10 min full interaction in CD-1 mice home cage for 10 days. During this exposure all C57BL/6 mice show signs of subordination (i.e., sideways, upright postures, fleeing, or freezing). After the 10 min, C57BL/6 mice would be separated from the aggressor by a Plexiglas divider perforated with small holes to allow sensory contact. The mice are housed in this way for the next 24 hours, with food and water provide ad libitum.
High fat diet-induced obesity mice models: Eight-week-old C57BL/6 male mice from the animal center of National Cheng Kung University Medical College will be housed in a temperature (25 ± 1 °C) and humidity (60 ± 5%) controlled room, and kept on a 12:12 light-dark cycle (light on at 06:00). Type 2 diabetes will be induced in mice by feeding with a high fat-diet containing 34.9% fat (wt/wt) (58Y1; TestDiet, Richmond, IN, USA) or a standard chow (5001; LabDiet, St. Louis, MO, USA) for 8 weeks.
Behavioral tests: Video tracking software (Ethovision, Noldus, The Netherlands) will be used for automatic recording and analysis.
Social Interaction: Mice are separated and housed individually the night before the experiment to enhance later social interactions. The apparatus is a white plastic box (50x40x40cm). Mice are matched in term of their gender and weight. After a 60-min habituation period in the room, pairs of either treated or control rats are put into the apparatus over a period of 20 min. The percentage of time spent following, mounting, grooming each other, and sniffing of any body part will be considered as indicators of social engagement.
Open field test (OF): To allow quantitative spontaneous activity in novel environment. The mice are inserted for 15 minutes in a white plastic box (50x40x40cm). The percentage of time spent in the central zone (25% of the surface area) and the total distance (cm) moved will be measured.
Radiolabeling
[123I] epidepride was prepared from tin precursor by oxidative iododestannylation with [123I] NH4I.
(S)-Bu3Sn-epidepride was first dissolved completely in methanol in a reaction vial and mixed well with [123I] NH4I. Five percent H2O2 mixture (injection water: freshly prepared 30%H2O2:1 N acetic acid = 7:2:3) was then added into the above reaction vial and incubated at RT for 10 min. The reaction was quenched by adding 39% sodium hydrogen sulfite followed by injecting saturated Na2HPO4 immediately. Finally, [123I] epidepride was eluted by 100% ethanol through the C18 column. The radiochemical purity of the product, determined by TLC (TLC condition solvent, chloroform: methanol = 9:1) and analytical HPLC, ranged from 91% to 98% {Huang, 2012 #99}.
Ex vivo autoradiography
Rats were intraperitoneally injected 0.5 ml potassium iodide 10 min prior to the intravenous injection of 185 MBq of [123I]-epidepride solution and sacrificed 30 min after tracer injection. Coronal brain slices (20-μm thickness) were then taken by a cryostat and mounted on silane-coated glass slides. Slices were kept in contact with imaging plates (BAS-SR2040, Fujifilm, Japan) for 5 days. The exposed plates were scanned with Fujifilm FLA-5100 Image Analyzer.
Measurement of peripheral metabolic regulators:
Glucose and insulin tolerance tests: Glucose and insulin tolerance tests will be performed on mice after an 8-h fast by intraperitoneal injection of 1.0 g/kg glucose, or 1.0 U/kg insulin, respectively. Blood samples will be collected from the retro-orbital sinus of the mice at 0, 30, 60, 90, and 120 min after injection of glucose or insulin for blood glucose determination by a commercial glucose assay kit (Biosystems, Barcelona, Spain).
Western blotting analysis: Animals are sacrificed and brains are quickly removed from the skull and homogenized in ice-cold RIPA buffer (150 mM sodium chloride, 1% Triton X-100, 0.5% sodium deoxycholate, 0.1% SDS, 50 mM Tris, pH 8.0). Protein concentration is determined with Bradford protein assay (Biorad) and equal amounts of protein (50 ug per sample) are subjected to 10% SDS-PAGE and transferred to nitrocellulose membranes. The membranes are blocked with 5% nonfat milk and 0.05% Tween in PBS for 1 hour at room temperature. The membranes are incubated with first antibody overnight at 4 °C and then with peroxidase-conjugated secondary antibody (Santa Cruz, CA) for 2 h at room temperature. Specific bands are detected on ECL system (Bioman Scientific Co. Ltd., Taiwan) and analyzed by LAS3000 digital imaging system (Fujifilm, Tokyo, Japan).
Immunohistochemistry: Mice are deeply anesthetized with sodium pentobarbital and transcardially perfused with PBS (Sigma), followed by a fixative solution containing 4% paraformaldehyde. Brain is carefully removed from the skull and transferred to 30% sucrose at 4°C overnight. Cryosections at 20μm in the coronal plane. After rinsing with cold PBS (0.1 M, pH 7.4), the sections are heated in citrate buffer for 20 min at 90°C for antigen retrieval. Sections are treated with primary antibodies overnight at 4°C. Microglia is labeled with Iba-1, CD11b and OX-6. The Images are acquired using a confocal spectral microscope (Leica TCS-SP2, Heidelberg, Germany) connected to digital camera and computer; montages are created and analyzed using Image-ProPlus 5.0 (Media Cybernetics Inc., Silver Spring, MD). The areas occupied by the stained tissues will be highlighted and measured for each section.
Statistics:
Repeated measure was used considering three-way interaction effect, two between factors (food (chow vs. HFD) and SD_SI (no vs. SD vs. SD+SI)) and within subject factor (weekly data), on body weight. After splitting the samples according within subject factor (weekly data), analysis of variance (ANOVA) was used to test the two-way interaction effect of two between subject factors, food (chow vs. HFD) and SD_SI (no vs. SD vs. SD+SI), on 8-16 weeks’ data of body weight. Independent t test was used when performing the post-hoc analyses by further splitting the samples according to either food or SD_SI. Mann-Whitney U test was also used to test the robustness of results.
SD vs. SD+SI) on the other week 16’s data. Independent t test was used when performing the post-hoc analyses by splitting the samples according to either food or SD or SD_SI. Mann-Whitney U test was also used to test the robustness of results.
Sample size, mean, standard deviation (SD), standard error of mean (SEM) were shown. The threshold for statistical significance was set as p < 0.05, which were analyzed using Statistical Package for Social Science software version 17 (SPSS Inc., Chicago, IL, USA).
結果與討論(含結論與建議):
1. HFD alter SD induced emotional and social behaviors 1.1 Week 9
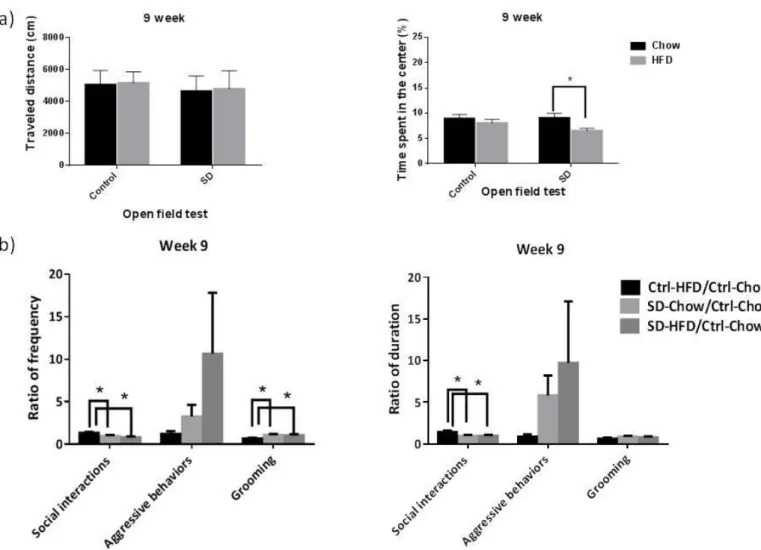
After 10 days of social defeat, the behavioral experiments, OF data did not showed the interaction effect of between diet (chow vs. HFD) and between SD (control vs. SD) (distance: (F(1, 160)= 0.15, p=0.90; time: (F(1, 160)= 1.20, p=0.28). However, OF data showed that SD had a main effect on distance (F(1, 160)= 6.26, p=0.01) and diet had a main effect on time (F(1, 160)= 5.45, p=0.02). Post-hoc analyses showed that in the SD group, if the subjects were feed with HFD, the time would be shorter than ones feed with chow (t(93)= 2.58, p=0.01) (Figure 1(a)). Social interaction data showed that there are group differences in frequency of social interactions (F(2, 63)= 5.17, p=0.008), frequency of grooming (F(2, 63)= 3.44, p=0.04), and duration of social interactions (F(2, 63)= 3.86, p=0.03). Post-hoc analyses showed that Ctrl-HFD group has higher frequency of social interactions (p=0.027 and p=0.003), lower frequency of grooming (p=0.017 and p=0.039), and higher duration of social interactions (p=0.015 and p=0.021) than SD-chow group and SD-HFD group (Figure 1(b)).
Figure 1. HFD and social stress effects on open field test and social interaction data at week 9. (a) Travel distance and time spend in the center in the open field test (b) ratio of frequency and duration in social interaction data. Open field test: Chow, n=36; SD-chow, n=49; HFD, n=33; SD-HFD, n=46. Social interaction data: Ctrl-Chow, n=36; SD-Chow, n=24; Ctrl-HFD, n=20; SD-HFD, n=22.
1.2. Week 16, social isolation group
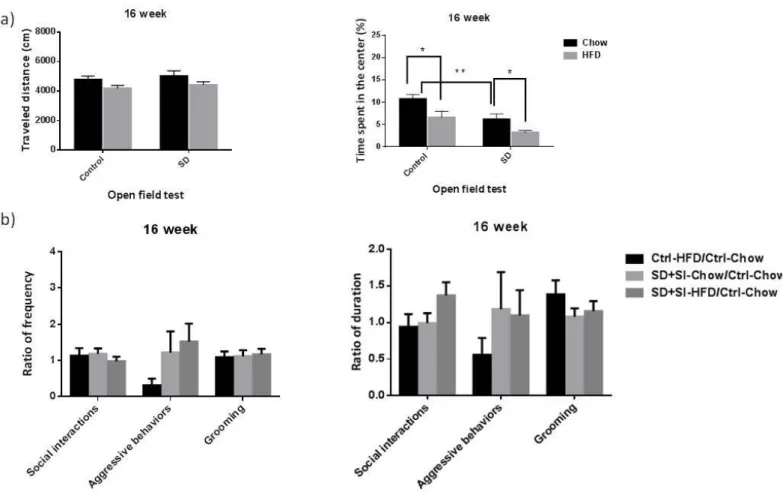
At week 16, the interaction effect between diet (chow vs. HFD) and between SD+SI (control vs. SD+SI) on the OF was still not significant (distance: (F(1, 98)= 0.10, p=0.76; time: (F(1, 98)= 0.31, p=0.58). OF data showed that both of diet and SD+SI had main effects on time (diet: F(1, 98)= 10.12, p=0.002; SD+SI: F(1, 98)= 13.43, p<0.001). Post-hoc analyses showed that in the chow group, if the subjects were been SD+SI, the time would be shorter than ones been control (t(50)= 3.19, p=0.002). And in the both of control and SD+SI groups, if the subjects were feed with HFD, the time would be shorter than ones feed with chow (control: t(57)= 2.48, p=0.02; SD+SI: t(41)= 2.41, p=0.02) (Figure 2(a)). Social interaction data showed no significant group difference among SD-chow, Ctrl-HFD, and SD-HFD group (F(2, 60)< 2.02, p>0.14). Post-hoc analyses showed no significant group difference, too (p>0.08) (Figure 2(b)).
Figure 2. Social isolation group: HFD and social stress effects on open field test and social interaction data at week 16. (a) Travel distance and time spend in the center in the open field test (b) ratio of frequency and duration in social interaction data. Open field test: Chow, n=30; SD+SI-chow, n=22; HFD, n=29; SD+SI-HFD, n=21. Social interaction data: Ctrl-Chow, n=30; SD+SI-Chow, n=26, Ctrl-HFD, n=22; SD+SI-HFD, n=19. (SD, social defeat; SI, one B6 mouse in one cage; SS, two B6 mice in one cage).
1.3. Week 16, social support group
At week 16, the interaction effect between diet (chow vs. HFD) and between SD+SS (control vs. SD+SS) on the OF was still not significant (distance: (F(1, 102)= 0.01, p=0.94; time: (F(1, 102)= 0.25, p=0.62). OF data still showed that diet had a main effect on time (F(1, 102)= 12.00, p=0.001), but SD+SS main effect on distance is disappeared (F(1, 102)= 2.02, p=0.16). Post-hoc analyses showed that in the both of groups, if the subjects were feed with HFD, the time would be shorter than ones feed with chow (control: t(57)= 2.48, p=0.02; SD+SS: t(45)= 2.39, p=0.02) (Figure 3(a)). Social interaction data showed that there are group
differences in frequency of aggressive behaviors (F(2, 42)= 5.82, p=0.006). Post-hoc analyses showed that SD+SS-HFD group has higher frequency of aggressive behaviors (p=0.005 and p=0.003) than Ctrl-HFD group and SD+SS-Chow group (Figure 3(b)).
Figure 3. Social support group: HFD and social stress effects on open field test and social interaction data at week 16. (a) Travel distance and time spend in the center in the open field test (b) ratio of frequency and duration in social interaction data. Open field test: Chow, n=30; SD+SS-chow, n=24; HFD, n=29; SD+SS-HFD, n=22. Social interaction data: Ctrl-Chow, n=30; SD+SS-Chow, n=16; Ctrl-HFD, n=22; SD+SS-HFD, n=11.(SD, social defeat; SI, one B6 mouse in one cage; SS, two B6 mice in one cage).
2. SD alter HFD modulate body weight curves and feeding behavior
The energy intake measurements were the average value of each cage. The body weight and calories intake were first measured 2 days before social defeat experiment at week 8.
In the case of body weight, three-way interaction effect, two between factors (diet (chow vs. HFD) and SD+SI (control vs. SD+SI) and within subject factor (8~16 weekly data) is not significant on body weight (F(8, 904)=1.68, p=0.10) (Figure 4(a)). At week 16, the two-way interaction effect between diet and SD+SI factors is not significant (F(1, 113)=0.98, p=0.32). However, diet had a main effect on weight (F(1, 113)= 134.17, p<0.001) but SD+SI did not (F(1, 113)= 0.36, p=0.55). Post-hoc analyses showed that in the chow group, SD+SI group was heavier than control group (t(57)= 2.01, p=0.049). In either control or SD+SI group, subjects feed with HFD were heavier than subjects feed with chow (control: t(70)= 10.04, p<0.001; SD+SI: t(43)= 6.86, p<0.001) (Figure 4(b)).
In the case of calories intake, three-way interaction effect, two between factors (diet (chow vs. HFD) and SD+SI (control vs. SD+SI) and within subject factor (8~16 weekly data) is significant on calories intake (F(8,
SD+SI factors is not significant (F(1, 95)=3.34, p=0.07). However, diet had a main effect on weight (F(1, 95)= 24.09, p<0.001) and SD+SI did, too (F(1, 95)= 8.57, p<0.001). Post-hoc analyses showed that in the HFD group, SD+SI group had lower total calories intake than control group (t(47)= 2.62, p=0.012). In control group, subjects feed with HFD had higher total calories intake than subjects feed with chow (t(58)= 5.32, p<0.001) (Figure 4(d)).
There were significant changes of feeding behavior during and after the social defeat period in chow group (SD group eat less during the social defeat period but more after the social defeat period), but this was not the case in HFD group. Moreover, the addictive like effect of HFD feeding was not observed in SD conditions.
Figure 4. The body weight and calories intake measurements. (a) body weight; (B) body weight at week 16; (C) calories intake per week; and (d) total calories intake during the feeding period in chow and HFD groups. Chow, n=36; SD+SI-chow, n=23; HFD, n=36; SD+SI-HFD, n=22. (SD, social defeat; SI, one B6 mouse in one cage; SS, two B6 mice in one cage).
3. SD and HFD modulate glucose tolerance and oxytocin levels
We then found significant interaction effect of between diet (chow vs. HFD) and SD_SI (control vs. SD vs. SD+SI) on glucose levels measured at week 16 (F(2, 57)=4.11, p=0.021). Post-hoc analyses showed that if the subjects were feed with HFD or been SD+SI, the glucose level was significant higher then controls. Besides, the main effect of diet on insulin level (F(1, 106)=29.53, p<0.001) and HOMA-IR (F(1, 53)=13.42, p=0.001) was significant, which showed that the HFD group has higher insulin level and HOMA-IR then chow group.
effect on oxytocin level, indicating significant changes of oxytocin levels in animals exposed to a HFD (F(1, 117)= 6.73, p=0.011), and SD (F(2, 117)= 28.12, p<0.001) when compared with controls. HFD group has a higher level of oxytocin then chow group. Post-hoc analyses showed that SD+SS group had highest oxytocin level, control group had central oxytocin level, and the SD+SI group had lowest oxytocin level.
Figure 5. The glucose tolerance test (IPGTT) and fasting glucose levels. (a) Plasma glucose
concentration curve during IPGTT and (b) fasting glucose level for chow and HFD groups. Data were analyzed with 2 way ANOVA. Values are mean ± standard error of the mean,*p < 0.05. chow, n=4; HFD, n=3; SD-chow, n=7; SD-HFD, n=7.
Figure 6. The glucose level and HOMA-IR index in chow or high fat diet (HFD) fed B6 mice in either socially isolated or non-isolated conditions. Eight-week-old C57BL/6 male mice fed with 8 weeks normal
chow or HFD after social defeat. (a) the glucose levels of all groups. C how group: ctrl, n=13, SD+SI, n=7, SD+SS, n=12. HFD group: ctrl, n=14; SD+SI, n=8; SD+SS, n=9. (b) the HOMA-IR index of all groups. C how group: ctrl, n=13, SD+SI, n=6, SD+SS, n=9. HFD group: ctrl, n=12; SD+SI, n=8; SD+SS, n=9. Values are mean ± standard error of the mean,*p < 0.05, **p < 0.01.
Figure 7. The effects of social defeat on peripheral oxytocin levels in chow or high fat diet (HFD) fed B6 mice in either socially isolated or non-isolated conditions. Eight-week-old C57BL/6 male mice fed with 8
weeks normal chow or HFD after social defeat. (a) the oxytocin levels of chow group. (ctrl, n=21, SD+SI, n=13, SD+SS, n=16). (b) the oxytocin levels of HFD group. (ctrl, n=21; SD+SI, n=12; SD+SS, n=13) (c) The oxytocin levels of all groups.*p < 0.05, **p < 0.01 vs group-ctrl; #p <0.05, ## <0.01, vs chow-ctrl; ▲▲
p < 0.01, vs group SD+SI, ★p<0.05, vs chow-SD+SI.
SD and HFD alter brain dopaminergic activity
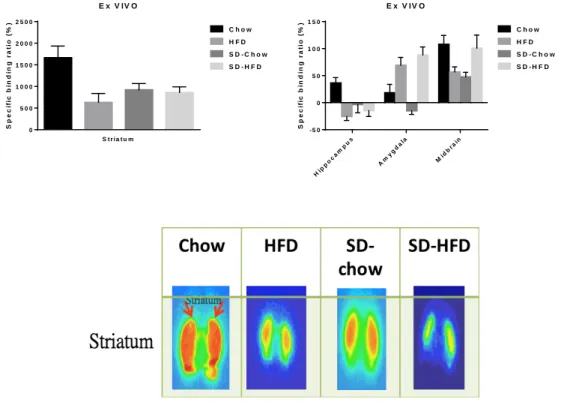
At week 16, the interaction effects between diet and between SD (control vs. SD) on the dopamine D2 receptor specific binding ratio (SBR) at striatum and midbrain were significant (striatum: F(1, 11)=6.62, p= 0.026; midbrain: F(1, 11)=10.05, p= 0.009) and were marginally significant at hippocampus (F(1, 11)=4.68, p= 0.053) and at amygdala (F(1, 11)=3.77, p= 0.078). Post-hoc analyses showed a tendency that if the subjects were feed with HFD or been SD, the SBRs at striatum, hippocampus, and midbrain were lower than controls. However, although the SD effect in amygdala was same as others regions, the diet effect was opposite. Namely, if the subjects were feed with HFD, the SBR at amygdala was higher than controls.
Figure 8. Ex vivo autoradiography in brain from mice administered the I-123 Epidepride, a radio-ligand
with high affinity for D2 receptors. The specific binding ratio in (a) striatum; (b) hippocampus, amygdala
and midbrain. Chow control, n=3; SD-chow, n=4; HFD, n=4; SD-HFD, n=4.
E x V IV O S p e c if ic b in d in g r a ti o ( % ) S t r i a t u m 0 5 0 0 1 0 0 0 1 5 0 0 2 0 0 0 2 5 0 0 C h o w H F D S D - C h o w S D - H F D E x V IV O S p e c if ic b in d in g r a ti o ( % ) Hip po ca mp us Am ygd ala Mid bra in - 5 0 0 5 0 1 0 0 1 5 0 C h o w H F D S D - C h o w S D - H F D
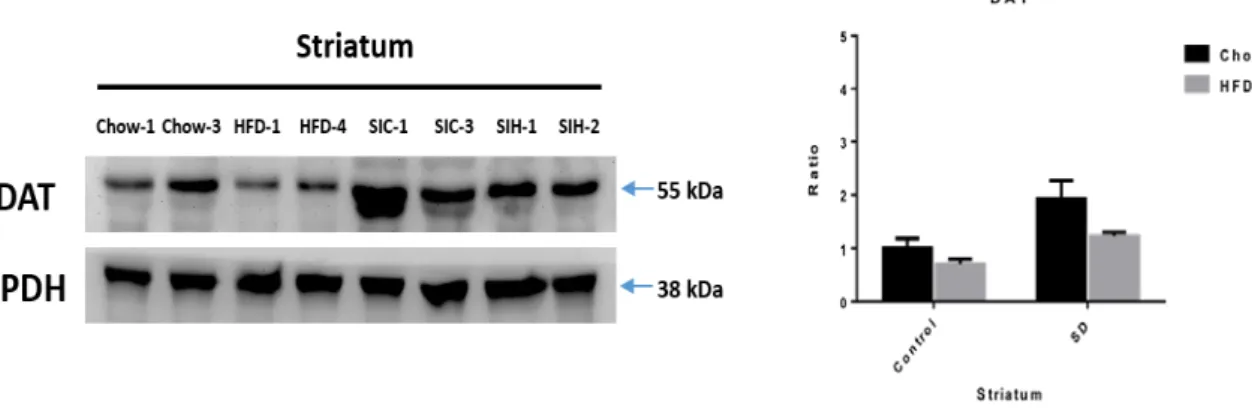
Figure 9. The effects of social stress and HFD feeding on dopamine transporter (DAT) expression levels.
(a) Representative western blots of DAT levels in striatum of control chow, HFD, SD-chow, and SD-HFD mice. (b) Quantification of DAT normalized by GAPDH levels in striatum. Control chow, n=2; HFD, n=2; SD-chow, n=2; SD-HFD, n=2.
Fig 10. The positron emission tomography (PET) with 18F-labeled fluoro-2-deoxyglcose (18F-FDG) scan
in striatum. (a) The cumulative curve of 18F-FDG uptake in striatum throughout a 3000-second scanning
course. (b) The peak of 18F-FDG uptake at 180 second in striatum of control chow, SD-chow, and SD-HFD mice. Values are mean ± standard error of the mean,*p < 0.05 compared to control chow group. Control chow, n=3; SD-chow, n=3; SD-HFD, n=3. STR Time (sec) S U V b w ( g /m l) 30 60 90120150180210240270300600901200015001800210024003000 0.0000 0.0005 0.0010 0.0015 Control (n=3) SD-Chow (n=3) SD-HFD (n=3) striatum Con trol SD-C how SD -HFD 0.0000 0.0002 0.0004 0.0006 0.0008 0.0010 Control SD-Chow SD-HFD S U V b w ( g /m l) a t 1 8 0 s *
Results from human studies:
The manuscript has been published in Clinical Psychopharmacology and Neuroscience 2019 Nov; 17(4): 487-494.
The Interaction of Oxytocin and Social Support, Loneliness, and Cortisol Level in Major Depression Tsung-Yu Tsai 1, Huai-Hsuan Tseng 1, Mei Hung Chi 1, Hui Hua Chang 1, Cheng-Kuan Wu 1, Yen Kuang Yang 1, Po See Chen 1*
1Department of Psychiatry, National Cheng Kung University Hospital, College of Medicine, National Cheng
Kung University, Tainan, Taiwan, 1Department of Psychiatry, National Cheng Kung University Hospital,
College of Medicine, National Cheng Kung University, Tainan, Taiwan
Objective: Loneliness is a specific risk factor for depressive symptoms and suicidal behavior. The present
study examined whether the serum oxytocin level would interact with social support and buffers loneliness and HPA-axis activity in drug-naïve patients with major depressive disorder (MDD).
Methods: Twenty-six (M:F=3:23, age: 45.54±12.97) patients with MDD were recruited. The 17-item
Hamilton depression rating scale, UCLA Loneliness Scale and self-reported Measurement of Support Function questionnaire were administered. Serum oxytocin and cortisol levels were assessed using a commercial immunoassay kits.
Results: In MDD patients, a negative association was found between degrees of social support and
loneliness (β =-0.39, p=0.04). The interaction between social support and serum oxytocin level was negatively associated with loneliness (β=−0.50, p=0.017) and serum cortisol level (β=−0.52, p=0.020) after adjusting for age. Follow-up analyses showed that the association between higher social support and lower loneliness was observed only in the higher-oxytocin group (r = −0.75, p = 0.003) but not in the lower group (r = −0.19, p = 0.53). The significance remained after further adjusting for sex and depression severity.
Conclusion: Low oxytocin level is a vulnerability factor for the buffering effect of social support for
loneliness and aberrant hypothalamic-pituitary-adrenal (HPA)-axis activity in MDD patients.
The manuscript has been published in Diabetes Metabolic Syndrome and Obesity 2019 Dec 19;12:2707-2713.
The OXTR Polymorphism Stratified the Correlation of Oxytocin and Glucose Homeostasis in Non-diabetic Subjects
Hui Hua Chang1,2,3a, Wei Hung Chang4,a, Mei Hung Chi4, Yi Chin Peng1, Chih-Chun Huang4, Yen Kuang
Yang4,5,6, Po See Chen4,5*
1Institute of Clinical Pharmacy and Pharmaceutical Sciences, College of Medicine, National Cheng Kung
University, Tainan, Taiwan
2School of Pharmacy, College of Medicine, National Cheng Kung University, Tainan, Taiwan
3 Department of Pharmacy, National Cheng Kung University Hospital, Dou-Liou Branch, Yunlin, Taiwan 4Department of Psychiatry, National Cheng Kung University Hospital, College of Medicine, National Cheng
Kung University, Tainan, Taiwan
5Institute of Behavioral Medicine, College of Medicine, National Cheng Kung University, Tainan, Taiwan 6Department of Psychiatry, National Cheng Kung University Hospital, Dou-Liou Branch, Yunlin, Taiwan
a These authors contributed equally to the study
Objective: Previous animal studies have shown that the oxytocin system might affect glucose homeostasis through the hypothalamus–pituitary–adrenal (HPA) axis and peripheral organs. Moreover, whether the effect is stratified by the polymorphism of oxytocin receptor gene (OXTR) remains unclear.
Methods: In this study, we recruited 89 non-diabetic participants. Their plasma oxytocin and serum insulin profiles were obtained, and the polymorphism of OXTR rs53576 was genotyped.
Results: There were significant correlations between the oxytocin level and fasting glucose level (r = –0.29, P <0.01), insulin level (r = –0.26, P = 0.01), and homeostasis model assessment-estimated insulin resistance (HOMA-IR) (r = –0.25, P = 0.01), when adjusted for age, gender, and body mass index (BMI). When further considering the stratification effects of OXTR variation, we found that the oxytocin level was significantly correlated with the fasting glucose level (r = –0.25, P = 0.04), insulin level (r = –0.35, P = 0.03), and HOMA-IR (r = –0.35, P < 0.01) in subjects with the OXTR A allele adjustment for age, gender, and BMI. In addition, the oxytocin level in those with the GG genotype of OXTR was significantly negatively correlated with the leptin level (r = –0.66, P = 0.02).
Conclusion: The results demonstrated that the polymorphism of OXTR plays an important role in individual differences in the correlation of oxytocin and glucose homeostasis in non-diabetic subjects.
The manuscript has been published in Translational Psychiatry 2020 Aug;10:281~1-281~8.
Dysregulation of oxytocin and dopamine in the corticostriatal circuitry in bipolar II disorder
Shyh-Yuh Wei a, Huai-Hsuan Tseng a,b, Hui Hua Chang c,d,e,f, Tsung-Hua Lu a, Wei Hung Chang a,g, Nan Tsing Chiu h, Yen Kuang Yang a,b,i, Po See Chen a,b,g*
a Department of Psychiatry, National Cheng Kung University Hospital, College of Medicine, National Cheng
Kung University, Tainan, Taiwan
b Institute of Behavioral Medicine, College of Medicine, National Cheng Kung University, Tainan, Taiwan c Institute of Clinical Pharmacy and Pharmaceutical Sciences, College of Medicine, National Cheng Kung
University, Tainan, Taiwan
d School of Pharmacy, College of Medicine, National Cheng Kung University, Tainan, Taiwan
e Department of Pharmacy, National Cheng Kung University Hospital, College of Medicine, National Cheng
Kung University, Tainan, Taiwan
f Department of Pharmacy, National Cheng Kung University Hospital, Dou-Liou Branch, Yunlin, Taiwan g Department of Psychiatry, National Cheng Kung University Hospital, Dou-Liou Branch, Yunlin, Taiwan h Department of Nuclear Medicine, National Cheng Kung University Hospital, College of Medicine, National
Cheng Kung University, Tainan, Taiwan
i Department of Psychiatry, Tainan Hospital, Ministry of Health and Welfare, Tainan, Taiwan
*Corresponding author: Po See Chen
Department of Psychiatry, National Cheng Kung University Hospital, 138 Sheng Li Road, North Dist., Tainan 70403, Taiwan.
Tel.: +886 6 2353535 x5189; fax: +886 6 2759259. Email: [email protected]
The oxytocin (OXT) and dopamine systems synergistically facilitate striatal reactivity. Abnormal striatal activation has repeatedly been observed in patients with bipolar disorder (BD); however, such abnormality remains unclear in BD II. Here we aimed to investigate whether the corticostriatal connectivity was altered and the possible relationships among corticostriatal connectivity, OXT, and dopamine systems in BD II. Twenty-five BD II patients, as defined by the DSM-V, and 29 healthy controls (HC) were enrolled in this study. Plasma OXT was measured and striatal dopamine transporter (DAT) availability was assessed using
[99mTc]TRODAT-1 single-photon emission computed tomography (SPECT). Brain network functional
connectivity (FC) was measured during the resting-state using functional magnetic resonance imaging, and the dorsal caudate (DC) was selected as the seed region. The results showed that the OXT level was significantly lower in the BD II patients, while the striatal DAT availability was not significantly different between the BD II and HC groups. The BD II patients exhibited significantly lower FC between the DC and the executive control network (dorsolateral prefrontal, anterior cingulate cortex, and posterior parietal cortex) as compared with the HC. Only observed in HC, the DC-posterior parietal cortex FC was negatively correlated with the OXT level and striatal DAT availability. Our findings in the HC support a model in which the OXT and dopamine systems act in tandem to regulate corticostriatal circuitry, while the synergistic interaction was perturbed in BD II. Taken together, these results implied a maladaptive neuroplasticity in BD II.