College of Management
I-Shou University
Master Thesis
“Measuring Service Quality and its Effect on Customer
Satisfaction and Loyalty: The Case of Vietjet Air”
Advisor:
Dr. Ying Maw Teng
Dr.
Hsiu-Ling
Lee
Graduate Student: Truong Viet Trinh (Ami)
August 2017
II
Acknowledgements
I would like to express my profound gratitude to professor Ying Maw Teng for his exemplary guidance, constant encouragement and valuable feedback throughout the duration of this project. I also don’t want to pass on expressing my heart gratitude for passengers who took the time to cooperate and participate in this research, without them this research would not be completed at this point of time.
Finally, I thank all my friends whom I have met over my years at I-Shou university and also all the lecturers who have taught me throughout the years at the university. I have learnt a great deal from each of you and for that I am grateful.
III
Abstract
In a highly competitive environment of the airline industry, the achievement of possessing customers’ satisfaction and loyalty can assure the sustainable competitive advantages as well as profit of any airline company. The new appearances of new budget airlines increase the substitution force of the industry, that requires any company to further develop its service quality in order to gain new customers, together with to keep the old ones.
Vietjet Air, Vietnamese only private budget airline, which has only been in action since 2011, has become the leading low-cost carrier in Vietnam. Vietjet is also evaluated to surpass state-owned Vietnam Airlines this year as the country’s biggest domestic carrier by The Capa Centre for Aviation (CAPA).
The main purpose of this study is to measure Vietjet Air’s service quality and to provide a better understanding of customer satisfaction and loyalty towards airline service quality in order to help Vietjet Air’s managers in developing better future strategies to satisfy customers and enhance their loyalty. This research was used quantitative research design and target respondents was selected by utilizing convenience sampling. A total of 250 questionnaires were self-administered to air travelers having experienced with Vietjet Air in the past 12 months at Noi Bai International Airport in Hanoi and 238 questionnaires were returned. Finally, the result of this study shows that all the proposed hypotheses was resulted in statistically significant.
Keywords: Service quality, AIRQUAL, SEVQUAL, airline industry, customer
V
Table of Contents
CHAPTER 1: INTRODUCTION ... 1
1.1 Research background ... 1
1.1.1 Aviation industry in Vietnam ... 1
1.1.2 Vietjet Air ... 1
1.2
Research objectives ... 2
1.3
Research questions ... 2
1.4
Research significance ... 2
CHAPTER 2: LITERATURE REVIEW ... 4
2.1.
Service quality ... 4
2.1.1. Definitions of service quality ... 4
2.1.2. Importance of service quality ... 4
2.1.3. Importance of service quality ... 4
2.2.
Measuring airline service quality ... 5
2.2.1. SERVQUAL model ... 5
2.2.2. AIRQUAL model... 6
2.3.
Customer satisfaction ... 6
2.4.
Customer loyalty ... 7
2.5.
Service quality and customer satisfaction ... 7
2.6.
Service quality and customer loyalty ... 8
2.7.
Customer satisfaction and customer loyalty ... 8
VI
2.9.
Research framework and hypotheses... 9
CHAPTER 3: METHODOLOGY ... 11
3.1
Research design ... 11
3.2
Population and Sampling ... 11
3.3
Data collection ... 12
3.4
Questionnaire development ... 12
3.5
Data analysis ... 12
CHAPTER 4 RESULTS AND ANALYSIS ... 14
4.1.
Demographics results ... 14
4.2.
Attributes of service quality ... 15
4.3.
Reliability results ... 18
4.4.
Pearson’s Correlation Coefficient ... 18
4.5.
Regression analysis ... 19
4.5.1. Relationship between service quality and customer satisfaction ... 19
4.5.2. Relationship between service quality and customer loyalty ... 21
4.5.3. Relationship between customer satisfaction and customer loyalty ... 23
4.5.4. Relationship between service quality, customer satisfaction and customer loyalty 24
CHAPTER 5 CONCLUSIONS ... 27
5.1 Conclusions and recommendation ... 27
5.2 Practical implications ... 29
5.3. Limitations and directions for future research ... 29
REFERENCES ... 30
VII
List of Tables
Table 4.1. Passengers profiles ... 14
Table 4.2. Flight information ... 15
Table 4.3. Attributes of service quality ... 15
Table 4.4. Reliability results ... 18
Table 4.5 Means, Standard deviations (SD), and correlations ... 18
Table 4.6 Regression analysis of relationship between service quality and customer satisfaction ... 20
Table 4.7 Regression analysis of relationship between service quality and customer loyalty. 21 Table 4.8 Regression analysis of relationship between customer satisfaction and customer loyalty. ... 23
Table 4.9. Regression analysis of relationship between service quality, customer satisfaction and customer loyalty. ... 24
VIII
List of Figure
Figure 2. 1 The proposed conceptual framework………..… 10 Figure 3. 1 The proposed methodology………...11
1
CHAPTER 1: INTRODUCTION
1.1 Research background
1.1.1 Aviation industry in Vietnam
Aviation industry is one of the major developing industries in the world. Coinciding with the explosive growth of the economic sector, the airline industry is becoming most important part in the economic development of a country. It plays an important role in transporting a lot of people and goods by air from one place to another, it makes the world a smaller place and brings nations as well as people closer to one another. According to the International Air Transport Association (IATA), everyday about 100,000 flights bring people and goods to their destination. In 2016, the world’s airlines carried +6.0% more passengers in 2016 to reach a total of 3.7 billion, according to the International Civil Aviation Organization (ICAO). Growth slowed from the +7.1% rate recorded in 2015.
In Vietnam, the aviation industry plays an important part due to the length of the country and the large distances between many of the country's tourist destinations. Vietnam is 1,650 kilometers in length and it has poor road and rail infrastructure. It is also within a few hours of Asia countries. Vietnam is one of developing country with a population of around 90 million people, it is expected to be one of the fastest developing aviation markets in Southeast Asia over the next 10-20 years. In 2016, Vietnam aviation market is one of the world's fastest-growing markets as it ranked third in the region and seventh in the world.
Particularly, with the ASEAN Open Skies policy coming into effect in 2015, and with Vietnam signing a number of free trade agreements, the airline industry in Vietnam will have more opportunities to grow. The growing of the airline industry will increase demand for the airline services. When there is high demand, the market is more competitive. It is required any airline company to focus on delivering high quality service to compete with other companies.
1.1.2
Vietjet Air
Vietjet Air (Vietjet) was created in 2011 in Vietnam as a private low-cost carrier. It first intention was to compete with state owned Vietnam Airlines to offer better prices and services to customers. Nowadays it is the leading domestic air carrier in Vietnam with 60 available routes including domestic and international routes across Asia. In 2016, the airline carried 14.05 million passengers with increase of 50.9% compare to 2015, with revenue of VND 27.499 billion (USD 1.209956 million), increases of 38.6% compared to the previous
2
year. According to the Vietnam Aviation Business Association, budget airlines are rapidly increasing their market shares with an annual growth rate of 15-20 percent. Vietjet now is the dominant player in the low-cost market held a 41.5% aviation market share after Vietnam Airlines with 42.5% and will likely surpass state-owned Vietnam Airlines in the next few years as Vietnam’s largest domestic carrier. It is very dynamic with an increasingly high number of air routes which helps revenue increase sharply.
Many people tend to think that low-cost means low quality. However, with the rapid growth of many budget carriers, these airline companies have started to compete not only price but also service quality with others, it requires any company to further develop its service quality in order to gain new customers, together with to keep the old ones.
Thus, this research is aim to measure service quality for Vietjet. This research also provides a better understanding of customer satisfaction and loyalty towards airline service quality in order to help Vietjet’s managers in developing better service quality to satisfy customers and enhance their loyalty.
1.2
Research objectives
The overall purpose is to measure the airline service quality of Vietjet and to examine its influence on customer satisfaction and loyalty. The specific objectives are:
1) To identify and measure the main dimensions of airline service quality. 2) To explore the impact of airline service quality on customer satisfaction. 3) To explore the impact of airline service quality on customer loyalty.
4) To explore the impact of customer satisfaction on loyalty in aviation industry. 5) To examine the mediating role of customer satisfaction on airline service
quality and customer loyalty.
6) To offer valuable suggestions for the company to better off its service quality.
1.3
Research questions
There are four main purposes have been conducted in this study. Firstly, exploring the impact of service quality on customer satisfaction. Secondly, examining the impact of customer satisfaction on loyalty. Thirdly, assessing the effect of service quality on passenger loyalty. Lastly, the researcher would like to explore the mediating role of customer
3
satisfaction on airline service quality and customer loyalty. From these purposes, the questions to be addressed in this study are the following: “
1) What is the impact of airline service quality on customer satisfaction? 2) What is the impact of airline service quality on customer loyalty?
3) What is the impact of customer satisfaction on loyalty in the aviation industry? 4) What influence does the airline service quality have on customer satisfaction and
loyalty?”
1.4
Research
significance
Aviation industry plays a crucial part in the economy of a country. It is the center of globalization for other industries (Suhartanto and Noor, 2012). According to Archana and Subha (2012), as delivering service quality is vital for airline companies to survive in this fiercely competitive environment, the interest of researchers in service quality and satisfaction in aviation industry has been increasing. There are numerous past studies examine the effect of service quality on customer satisfaction and loyalty in the aviation industry. However, there is no prior study has been conducted on Vietjet yet. Therefore, this research is of special significance to Vietjet with the purpose is to assess how the service quality provided by Vietjet affects the level of customer satisfaction and loyalty.
Additionally, this research will provide practical contribution to Vietjet’s marketers in giving a better understanding of customer satisfaction and loyalty towards airline service quality. Therefrom, the marketers can develop and deliver better service quality to attain customers’ satisfaction and loyalty.
4
CHAPTER 2: LITERATURE REVIEW
2.1.
Service quality
2.1.1. Definitions of service quality
Service quality is a concept which is interested and debated by many researchers over the years. Although there are many different concepts of service quality, all of them are commonly framed from the customer perspective. Service quality is defined as a comparison of the expected service and the perceived service by the customer (Gronroos, 1984; Parasuraman et al.,1988) or the extent to which services meet the needs and expectations of the customer (Asubonteng, McCleary, and Swan., 1996). Similarly, service quality is defined as “a measure of how well the service delivered matches customer expectations. Delivering service quality means conforming to customer expectations on a consistent basis” by Lewis and Booms (1983). Briefly, “a good service quality is considered as one which meets or exceeds consumer’s expectation of the service” (Parasuraman et al., 1985).
2.1.2. Importance of service quality
Nowadays, service quality has become the most vital factor for the success and survival of many industries. Providing high quality services to customers is the key strategy for survival in today’s competitive service industries such as air transport services (Zeithaml et al., 1996). Nadiri, Hussain, Ekiz, and Erdogan (2008) states that due to high competition, the management in the aviation industry must find ways to better their service by understanding their customers’ needs and then meeting or exceeding these needs. Parasuraman et al. (1991) argue that providing high quality of service is considered as the most effective way to ensure that the company's services are uniquely positioned in a market with the same competitive services.
Since service quality becomes an important factor for aviation industry, there always exists a big question: how should aviation service quality be measured? To answer this question, firstly, it is necessary to identify dimensions of this service.
2.1.3. Dimensions of service quality
“
For decades, the dimensions of service quality as well as airline service quality have been discussed in many research papers. Gronroos (1984) develops the first model of service
5
quality with three dimensions: technical quality, functional quality, and corporate image. In 1990, the six dimensions of service quality were classified by Gronroos including professionalism and skills; attitude and behavior; accessibility and flexibility; reliability and trustworthiness; recovery; and finally reputation and credibility. Rust and Oliver (1994) propose a model that included three dimensions: service product, service delivery, and service environment. Park, Robertson, and Cheng-Lung (2005) reveal that airline service quality can be classified into three dimensions: reliability and customer service, convenience and accessibility and inflight service. In 1988, in order to measure customer perception of service quality in service and retailing organizations, Parasuraman et al. developed a scale with five dimensions (reliability, responsiveness, assurance, tangibles, and empathy), named SERVQUAL.”
Since the appearance of SERVQUAL scale, many studies have used the dimensions of SERVQUAL to measure the airline service quality. For instance, Bari et al. (2001) develop the AIRQUAL instrument with five dimensions (airline tangibles, terminal tangibles, personnel, empathy, and image) based on SERVQUAL.
2.2. Measuring airline service quality
2.2.1. SERVQUAL model
The SERVQUAL model has been widely used for measuring service quality across industries for many years (Ali, Omar, and Amin, 2013; Wu and Ko, 2013). Parasuraman et al. (1985) propose a model with ten dimensions, including tangibles, reliability, responsiveness, understanding the customers, access, communication, credibility, security, competence and courtesy. In 1988, this model was modified and called the SERVQUAL model, which consists of five dimensions: tangibles, reliability, responsiveness, assurance and empathy.
Since the SERVQUAL scale has received considerable recognition in service marketing, numerous previous studies have applied this scale to measure the service quality
6
in many industries (Crompton and Mackay, 1989; Fick and Ritchie, 1991; Finn and Lamb, 1991; Johnson, Michael, and Dunlap, 1988). In aviation industry, most of previous studies used the SERVQUAL model to assess airline service quality (Chiang, Liang, and Yahalom, 2003; Li and Chen, 1998; Park et al., 2005). After that, however, there are many criticisms of this model have been mentioned. One of these criticisms relates to the inapplicability of this scale to all service industries (Bekhet & Al-alak, 2011; Finn & Lamb, 1991). Park et al., (2005) state that, SERVQUAL scale is inappropriate for measuring all features of airline service quality because the airline service quality includes both tangible and intangible aspects, it is different from other service industries.
Generally, SERVQUAL model composes the ground and basis for service quality measurements. To effectively evaluate service quality in different industries, it is needed to improve this scale in their specific environment.
2.2.2. AIRQUAL model
Considering the limitations of SERVQUAL model; Bari, Bitner, Bavik, Ekiz, Hussain, & Toner (2001) develop a new measurement scale based on SERVQUAL model, namely, AIRQUAL. By using AIRQUAL to measure service quality in Northern Cyprus, both studies of Ekiz et al. (2006) and Nadiri et al. (2008) found that service quality has a statistically significant effect on customer satisfaction. In addition, Nadiri et al. (2008) also found a significant positive influence of service quality on customer loyalty.
Nevertheless, AIRQUAL model is utilized to measure airline service industry in Northern Cyprus but this scale is lack of validity because it does not follow all the necessary steps needed to validate an instrument. Because of this problem the AIRQUAL cannot be applied in other countries. In order to address this problem, a study by Alotaibi (2015) validated the AIRQUAL by following all the steps proposed by Parasuraman et al. (1988). This hybrid scale provides a more accurate evaluation of the customer perception of service quality in practice. Accordingly, the airline service quality in this research is measured by using AIRQUAL model based on SERVQUAL model.
2.3. Customer
satisfaction
“Satisfaction is an overall customer attitude towards a service provider” (Levesque & McDougall, 1996) or the customers’ emotional response to the difference between what they expect and what they receive (Zineldin, 2000). According to Kotler (2000), “satisfaction is a
7
person’s feeling of pleasure or disappointment resulting from comparing a product’s perceived performance (or outcome) in relation to his or her expectations”.
Shin and Elliot (2001) assert that no business can exist without customers. Therefore, if a company wants to be successful and profitable, it must satisfy its customers. Angelova and Zekiri (2011) claim that “satisfied customers form the foundation of any successful business because customer satisfaction leads to repeat purchases, brand loyalty, and positive word of mouth”. In a highly competitive environment, customer satisfaction in the transportation services has an important influence to the long-term survival of the carrier (Rhea and Shrock, 1987), thus airline companies should distinguish how their service meets their customers’ expectations.
2.4. Customer
loyalty
Jacoby and Chestnut (1978) define loyalty as a repeat buying behavior and/or the expression of a favorable attitude towards such behavior. Pearson (1996) comes close by saying that customer loyalty as “the mindset of the customers who hold favorable attitude toward a firm, commit to repurchase the company’s product or service, and spread word-of-mouth recommendations to others”.
Customer loyalty is the key to the success and profitability of organizations because “those consumers that demonstrate the greatest levels of loyalty toward the product or service activity tend to repurchase more often, and spend more money” (Dehghan and Shahin, 2011). Newman and Werbel (1973) suggest that loyal customers who have purchased a brand or service repeatedly considered only the same brand and they do not attempt to search for the relevant information of other brands. For airline companies, customer loyalty has become a key factor in their strategies in the competitive environment (Forgas et al., 2010). Further, Gomez et al. (2006) say that loyal customers are highly attractive to companies because they are less price sensitive and require less effort to contact with.
2.5.
Service quality and customer satisfaction
According to Ghylin et al., (2008), defining service quality empowers companies to deliver higher service quality resulting in increased customer satisfaction. Cheng and Rashid (2013) state that managing service quality means that service providers have to match the service performance with the perceived services for customer satisfaction to be achieved. In the same vein, Kotler and Keller (2012) highlight service quality expectations play an
8
important role in creating customer satisfaction. Companies achieve acceptable levels of satisfaction by providing services that not only meet customer expectations but also exceed them. In aviation industry, Saha and Theingi (2009) find that service quality has a significant effect on passenger satisfaction in the airline industry; it means that the higher the perceived service quality, the higher is the passenger satisfaction. Likewise, Clemes (2008) states that as service quality improves, the probability of customer satisfaction increases. On the contrary, when customers are not satisfied, they are more likely to switch to other airlines and to not recommend the airline to others (Abdullah et al., 2007).
Hence, the first research hypothesis is:
H1: Airline service quality has a significant effect on customer satisfaction.
2.6.
Service quality and customer loyalty
Service quality is vital for an organization's success because it has significant impact on customers' loyalty to service companies (Lin et al., 2009). Chang & Yeh (2002) assert that high level of service quality is crucial in the acquisition and retention loyal customers. Ostrowski et al. (1993) observe that when all airlines have comparable fares and matching regular flyer programs, the airline with better perceived services will attract passengers from other airlines. Many previous studies found that service quality has a positive influence on consumer loyalty (Roberts et al., 2003; Wong & Soha, 2003).
Thus, the second research hypothesis is:
H2: Airline service quality has a significant effect on customer Loyalty.
2.7.
Customer satisfaction and customer loyalty
There are many empirical studies reveals the relationship between customer satisfaction and customer loyalty. Satisfaction is widely known as a predictor of customer loyalty (Gures et al., 2014; Cheng & Rashid, 2013; Wong & Sohal, 2003; Eggert & Ulaga, 2002). Bearden and Teal (1983) assert that consumer satisfaction is essential to marketers because, it is considered as an important determinant of repeat sales, positive word of mouth and consumer loyalty. Many previous research papers prove that satisfaction positively and significantly affect customer loyalty (Amin, Leila, and Zahra, 2014; Naureen and Sahiwal, 2013). In addition, Chandrashekaran et al. (2007) conclude that satisfaction strength is a key driver in translating satisfaction into loyalty and argue that satisfaction translated into loyalty when it is strongly held, while weakly held satisfaction makes customers vulnerable to defection. Fornell (1992) also finds that high customer satisfaction would increase loyalty
9
to the company and that customers would be less prone to overtures from competition. Jan et al. (2013) highlight that a number of studies carried out in the airline context provide evidence of a positive correlation between customer satisfaction and loyalty.
Consequently, the third hypothesis is proposed: “
H3: Customer satisfaction has a significant effect on customer loyalty in aviation industry.
2.8.
Service quality, customer satisfaction, and
customer loyalty
According to Gremler and Brown (1998) and Cronin and Taylor (1992), customer satisfaction and service quality are the prerequisites of loyalty. Danaher and Mattsson (1998) also agree that high customer satisfaction and service quality result in higher customer loyalty and willingness to recommend the service to others. Archana and Subha (2012) state that airline service quality dimensions - i.e., in-flight services, in-flight digital services, and airline back-office operations - are significant predictors of passengers' satisfaction and that this satisfaction influences their loyalty and the airline's image. Similarly, Lovelock and Wirtz (2010) state that service quality is a key input in satisfying customers and that satisfaction forms the basis for developing a loyal customer base. Thus, customer satisfaction can strengthen or weaken the influence given by the quality of service on customer loyalty (Caruana et al., 2000). For that reason, it is expected that customer satisfaction mediates the relationship between service quality and customer loyalty.
H4: Customer satisfaction mediates the relationship between service quality and customer loyalty.”
2.9.
Research framework and hypotheses
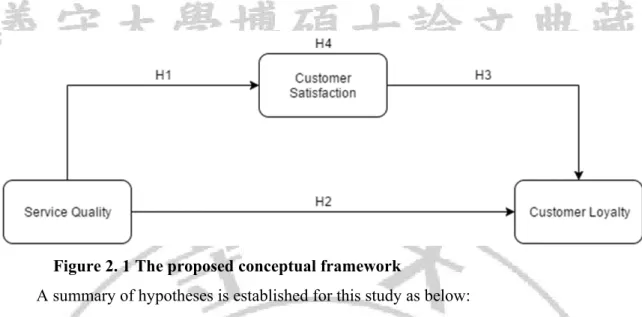
This research proposes a conceptual framework that investigates the effects of airline service quality on passenger satisfaction and loyalty.
10
Figure 2. 1 The proposed conceptual framework
A summary of hypotheses is established for this study as below:
H1: Airline service quality has a significant effect on customer satisfaction. H2: Airline service quality has a significant effect on customer loyalty.
H3: Customer satisfaction has a significant effect on customer loyalty in aviation industry.
H4: Customer satisfaction mediates the relationship between airline service quality and customer loyalty.
11
CHAPTER 3: METHODOLOGY
3.1
Research design
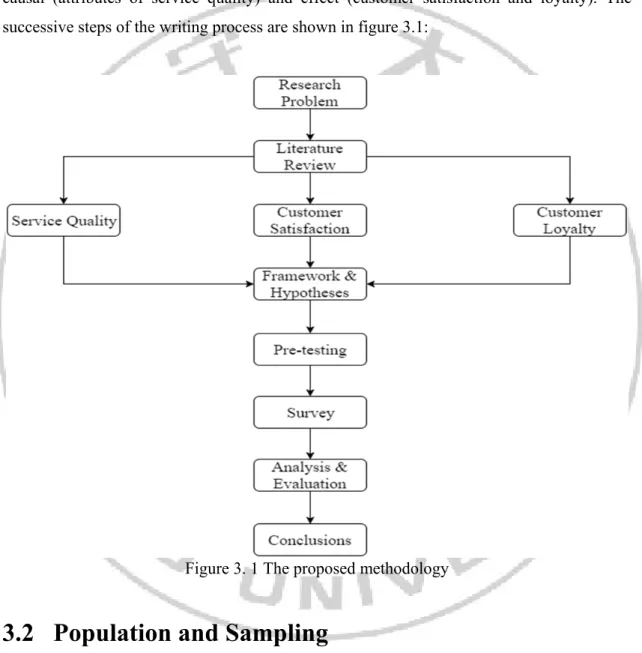
This study uses quantitative research technique, and conducting survey is main methodology. This research has been explanatory as it is focused on attempting to test a causal (attributes of service quality) and effect (customer satisfaction and loyalty). The successive steps of the writing process are shown in figure 3.1:
Figure 3. 1 The proposed methodology
3.2 Population and Sampling
The target population of this study consists of all airline passengers that have traveled with Vietjet in the past twelve months. The sample covers a sample size of 250 passengers. They are selected based on convenience sampling method. According to Marshall (1996) convenience sampling is an ideal method to approach the sample and it is less costly to the researchers, with regard to time, effort and money. In addition, convenience sampling
12
method has been found appropriate to conduct survey in the case of airlines customers (Aydina and Yildirimb, 2012).
3.3 Data collection
For this study, the questionnaire is used as instrument for collecting data. An administered questionnaire which includes 50 questions is passed directly to the passengers who are waiting for departure or just arrived at the Noi Bai International Airport in February 2017. Noi Bai International Airport is located in the capital city of Hanoi, it is the biggest airport in northern Vietnam. With a total of 15 million passengers were served in 2015, the airport is the main hub of Vietjet.
3.4 Questionnaire development
The questionnaire is categorized into four parts. The first part of the questionnaire consists of issues related to respondents’ demographic. The second part relates to measure airline service quality; the third part deals with customer satisfaction; and the fourth part includes a scale to measure customer loyalty. Accordingly, the first part includes nominal scales, while the three parts later will use a five-point Likert scale, ranging from “strongly disagree” (1) to “strongly agree” (5).
The 30 questions relating to five dimensions of service quality are adopted from the SERVQUAL and AIRQUAL scale from the studies of Alotaibi (2015), Bari et al. (2001) and Parasuraman et al. (1989). The 30 items of the instrument are categorized into five dimensions (Tangibles, Reliability, Responsiveness, Assurance and Empathy). These dimensions have seven, six, five, five and seven items, respectively. The 8 questions related to customer satisfaction and the 6 questions related to customer loyalty are adopted from the studies of Westbrook and Oliver (1991) and Baumann, Elliott, & Hamin (2011).
3.5 Data analysis
This study use SPSS 22.0 as analysis tool. First of all, a descriptive analysis is carried out to provide the respondents' demographics data and attributions of service quality. Second, Cronbach’s Alpha analysis is used to test the internal consistency of the questionnaire. Third, Pearson's correlation coefficient analysis is utilized to verify the degree of correlation between control variables, service quality, customer satisfaction, and customer
13
loyalty. Finally, the relationship between service quality, customer satisfaction, and customer loyalty has been determined using linear regressions.
14
CHAPTER 4: RESULTS AND ANALYSIS
4.1. Demographics results
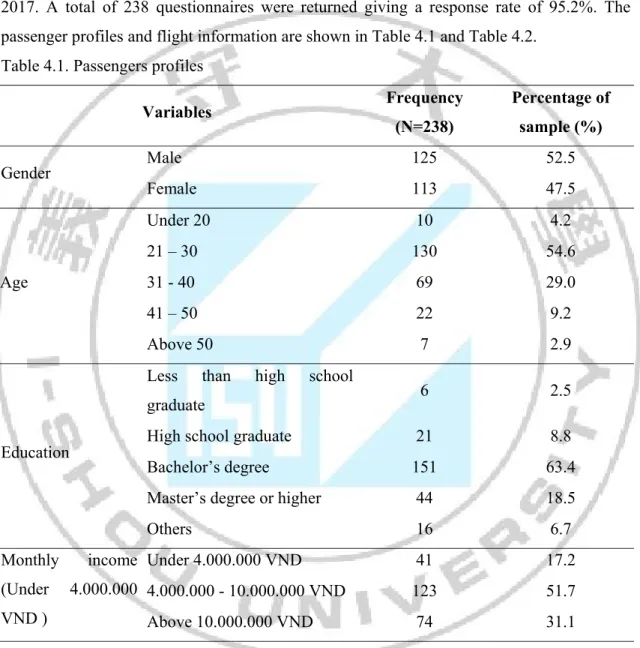
In this study, 250 questionnaires were distributed to passengers of Vietjet in February 2017. A total of 238 questionnaires were returned giving a response rate of 95.2%. The passenger profiles and flight information are shown in Table 4.1 and Table 4.2.
Table 4.1. Passengers profiles
Variables Frequency (N=238) Percentage of sample (%) Gender Male 125 52.5 Female 113 47.5 Age Under 20 10 4.2 21 – 30 130 54.6 31 - 40 69 29.0 41 – 50 22 9.2 Above 50 7 2.9 Education
Less than high school
graduate 6 2.5
High school graduate 21 8.8
Bachelor’s degree 151 63.4
Master’s degree or higher 44 18.5
Others 16 6.7 Monthly income (Under 4.000.000 VND ) Under 4.000.000 VND 41 17.2 4.000.000 - 10.000.000 VND 123 51.7 Above 10.000.000 VND 74 31.1
According to table 4.1, there are 125 male participants as representing for 52.5 %, 113 female participants as representing for 47.5%. The male respondent ratio is 5% higher than female respondent ratio, approximately similar. With regard to age, the majority of respondents are of the age of 21 and 30 years old (54.6%), followed by the respondents fell into the category of between 31 to 40 at 29%. In term of education, the majority of
15
respondents (63.4%) have a bachelor’s degree and 18.5% have a master’s degree or higher. This may indicate that most of the respondents have a good educational background. For the income, the highest number of the participants earned 4.000.000 – 10.000.000 VND monthly (51.7%), followed by those with a monthly income of above 10.000.000 VND (31.1%) and of under 4.000.000 VND monthly is the lowest (17.2%).
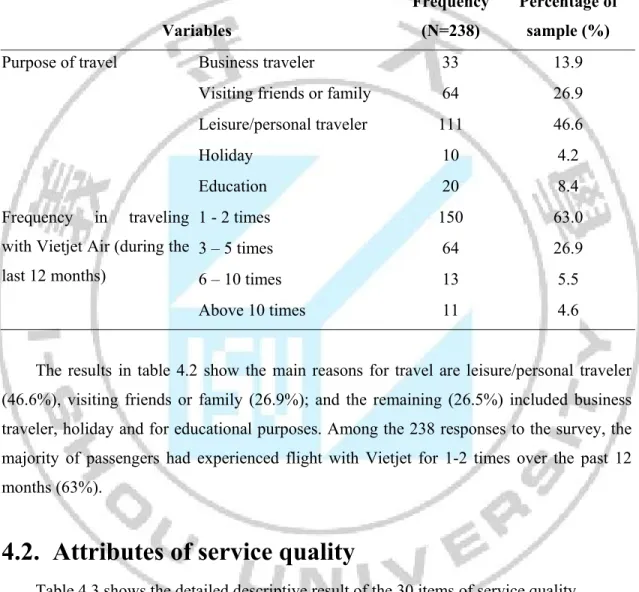
Table 4.2. Flight information
Variables
Frequency (N=238)
Percentage of sample (%)
Purpose of travel Business traveler 33 13.9
Visiting friends or family 64 26.9 Leisure/personal traveler 111 46.6
Holiday 10 4.2
Education 20 8.4
Frequency in traveling with Vietjet Air (during the last 12 months)
1 - 2 times 150 63.0
3 – 5 times 64 26.9
6 – 10 times 13 5.5
Above 10 times 11 4.6
The results in table 4.2 show the main reasons for travel are leisure/personal traveler (46.6%), visiting friends or family (26.9%); and the remaining (26.5%) included business traveler, holiday and for educational purposes. Among the 238 responses to the survey, the majority of passengers had experienced flight with Vietjet for 1-2 times over the past 12 months (63%).
4.2. Attributes of service quality
Table 4.3 shows the detailed descriptive result of the 30 items of service quality. Table 4.3. Attributes of service quality “
Service quality N Mean Std.
Deviation
Tangibility
The airline provides passengers with new, modern and
16
Food and drink served on the aircraft during the flight
are of high quality and sufficiently varied. 238 2.8992 1.00543 Toilets on board the aircraft are clean and easy to use. 238 3.5168 .82019 There are daily newspapers and current magazines to
read in the aircraft. 238 2.9664 1.12833
Personnel working for the airline company are neatly
dressed. 238 3.9916 .89061
The airline provides passengers with allocated seats. 238 3.8908 .93040 The airline provides entertainment for passenger on
board the aircraft. 238 2.5672 1.18433
Reliability
Passengers' luggage is handled with care and attention. 238 3.1807 .96178 When airline company promises to do something by a
certain time, it does so. 238 3.1134 1.07117
When you have problems, the airline shows sincere
interest in solving it. 238 3.2605 .99757
The airline performs the service right the first time. 238 3.2395 .93083 The airline provides its services at the time it promises
to do so. 238 3.2437 1.07888
The airline maintains error-free records. 238 2.9580 1.02620 Employees of the airline tell you exactly when services
will be performed. 238 3.2605 .92743
Responsiveness
Employees of the airline give you prompt service. 238 3.5294 .76112 Employees of the airline are always willing to help
customers. 238 3.7353 .95979
Employees of the airline are never too busy to respond
to your requests. 238 3.4832 1.02177
The airline provides its services for customers promptly. 238 3.3866 .99881
Assurance
The airline personnel are experienced and well trained. 238 3.6261 .93619 The behaviour of employees of the airline instills
17
You feel safe in your transactions with the airline. 238 3.4622 1.01291 Employees of the airline are consistently courteous with
you. 238 3.8151 .94101
Employees of the airline have the knowledge to answer
your questions. 238 3.6050 .95660
Empathy
Passengers are compensated sufficiently by the airline company for any damages arising in the shortest time possible.
238 3.2605 .93648
Personnel working for the airline put themselves in the
place of the passengers when providing service. 238 3.2227 .91679 The airline gives you individual attention. 238 3.0000 1.08305 The airline has employees who give you personal
attention. 238 3.0462 1.09947
Employees of the airline understand your specific
needs. 238 2.9958 .97867
The airline has your best interests at heart. 238 3.1471 .93198 The airline has operating hours convenient to all its
customers. 238 3.2983 .95427
Average score 238 3.3199 .97848
As revealed in above table, the average score resulted with a mean of 3.3199 and the standard deviation (SD) is 0.989, indicating that the majority of respondents was inclined positively toward Vietjet’s service quality.
The highest mean value for service quality was for item “Personnel working for the airline are neatly dressed” with the mean score of 3.9916 and the SD is .89061. The second highest mean value was for item “The airline provides passengers with allocated seats” (mean = 3.8908; SD = .93040).”
The lowest mean value was for, “The airline provides entertainment for passenger on board the aircraft” (mean = 2.5672), followed by “Food and drink served on the aircraft during the flight are of high quality and sufficiently varied” (mean = 2.8992). Interestingly, both the highest and lowest mean value for service quality are from the dimension named “tangibility”.
18
4.3. Reliability results
Cronbach’s Alpha analysis is used to check the internal consistency of items in a survey instrument. Sekaran and Bougie (2011) state that, the Cronbach’s Alpha values should be equal to or more than 0.7. Higher values show greater scale reliability.
Table 4.4. Reliability results
Variables Dimensions Cronbach’s
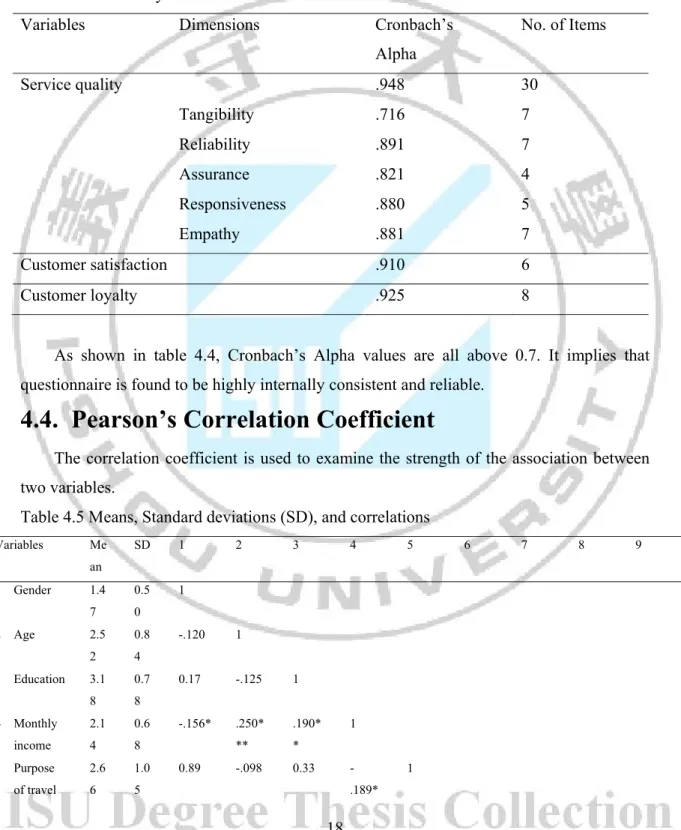
Alpha No. of Items Service quality .948 30 Tangibility .716 7 Reliability .891 7 Assurance .821 4 Responsiveness .880 5 Empathy .881 7 Customer satisfaction .910 6 Customer loyalty .925 8
As shown in table 4.4, Cronbach’s Alpha values are all above 0.7. It implies that questionnaire is found to be highly internally consistent and reliable.
4.4. Pearson’s Correlation Coefficient
The correlation coefficient is used to examine the strength of the association between two variables.
Table 4.5 Means, Standard deviations (SD), and correlations
Variables Me an SD 1 2 3 4 5 6 7 8 9 1 Gender 1.4 7 0.5 0 1 2 Age 2.5 2 0.8 4 -.120 1 3 Education 3.1 8 0.7 8 0.17 -.125 1 4 Monthly income 2.1 4 0.6 8 -.156* .250* ** .190* * 1 5 Purpose of travel 2.6 6 1.0 5 0.89 .098 0.33 -.189* 1
19 * 6 Frequency in travel with Vietjet 1.5 2 0.8 0 -.068 -.007 0.12 .108 .037 1 7 Service quality 3.3 2 0.6 2 -.072 -.020 -.069 -.070 -.076 .119 1 8 Customer satisfactio n 3.4 0 0.7 9 -.035 -.007 -.047 .010 -.135* .233* ** .751* ** 1 9 Customer loyalty 3.4 0 0.7 5 -0.55 -0.28 .021 -.054 -.067 .159* .638* ** .761* ** 1 *p<.05. **p<.01. ***p<.001.
Take a look at control variables in table 4.5, we can see that monthly income has a negative relationship with gender (r=-.156, p<.05) and a positive relationship with age and education (r=.250, p<.001; r=.190, p<.01). Purpose of travel correlates negatively with monthly income and customer satisfaction (r=-.189, p<.01; r=-.135, p<.05). Frequency in travel with Vietjet has a positive relationship with customer satisfaction and customer loyalty (r=.233, p<.001; r=.159, p<.05).
This table also shows that the links between each of three main variables is statistically significant. There is a positive relationship between service quality and customer satisfaction; service quality and customer loyalty (r=.751, p<.001; r=.638, p<.001). Besides, customer satisfaction has a positive relationship with customer loyalty (r=.761, p<.001).
Moreover, according to Hair et al. (2014), when two independent variables are highly correlated, for example r = 0.90, or higher multi-collinearity problem may occur in regression analysis. As be seen from the above table, the highest coefficient value is lower than 0.90 (0.761) meaning that service quality, customer satisfaction, and customer loyalty are not highly correlated to each other. Therefore, multi-collinearity problem does not exist in this research.
4.5. Regression analysis
4.5.1. Relationship between service quality and customer
satisfaction
In order to identify the impact of service quality on customer satisfaction; control variables (gender, age, education, monthly income, purpose of travel, and frequency in
20
travel with Vietjet), service quality, and customer satisfaction were analyzed. In addition to the control valuables, five dimensions of the service quality (tangibility, reliability, assurance, responsiveness, and empathy) were put into independent valuable and the customer satisfaction was organized as dependent valuable. The regression results are shown in table below.
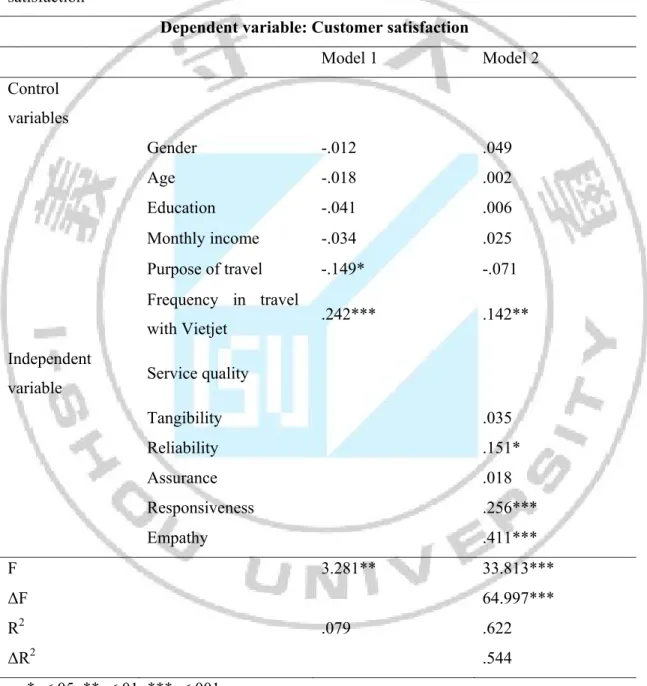
Table 4.6 Regression analysis of relationship between service quality and customer satisfaction
Dependent variable: Customer satisfaction
Model 1 Model 2 Control variables Gender -.012 .049 Age -.018 .002 Education -.041 .006 Monthly income -.034 .025 Purpose of travel -.149* -.071 Frequency in travel with Vietjet .242*** .142** Independent
variable Service quality
Tangibility .035 Reliability .151* Assurance .018 Responsiveness .256*** Empathy .411*** F 3.281** 33.813*** ΔF 64.997*** R2 .079 .622 ΔR2 .544 *p<.05. **p<.01. ***p<.001.
As shown in above table, the R square value (R2) indicates how much of the total variation in the dependent variable, customer satisfaction, can be explained by the independent variable, service quality. F value implies whether the model and data are well
21
fit or not in explaining customer satisfaction. From the analysis of model 1, R2 = .079, it implies that 7.9% of the dependent variable changes is explained by the model, which is significant (F=3.281, p <.01). In addition, the results showed customer satisfaction is effected by purpose of travel with β = -.149 (p <.05), it can be explained that customers with business travel purposes tend to have more satisfied with Vietjet’s service quality. Besides, frequency in travel with Vietjet has a strong impact on customer satisfaction with β = .242 (p <.001), it means that the more frequently customers fly with Vietjet, the more satisfied they are with the service delivered by Vietjet.
In model 2, the R2 value is .622 which means that 62.2% of the variation in customer satisfaction can be explained by 5 dimensions of service quality (tangibility, reliability, assurance, responsiveness, and empathy); which is significant (F=33.813, p<.001). It can be seen on the above table that of the five dimensions above; reliability, responsiveness, and empathy have positive effect on customer satisfaction with the β value is .151, .256, .411, respectively (p <.05, p <.001, p <.001). In addition, purpose of travel does not affect customer satisfaction but frequency in travel with Vietjet still does with β = .142 (p <.01).
In conclusion; reliability, responsiveness, and empathy have positive effect on customer satisfaction. Hence, hypothesis 1 is partially supported.
4.5.2. Relationship between service quality and customer
loyalty
To explore the relationship between service quality and customer loyalty, control variables (gender, age, education, monthly income, purpose of travel, and frequency in travel with Vietjet), service quality, and customer loyalty were analyzed. In the table below, the dependent variable is customer loyalty whereas service quality is independent variable. Table 4.7 Regression analysis of relationship between service quality and customer loyalty.
Dependent variable: Customer loyalty
Model 1 Model 2 Control variables Gender -.054 -.001 Age -.012 .013 Education .040 .081
22 Monthly income -.102 -.037 Purpose of travel -.091 -.010 Frequency in travel with Vietjet .169** .102* Independent
variable Service quality
Tangibility .002 Reliability .209* Assurance -.062 Responsiveness .130 Empathy .460*** F 1.714 18.060*** Δ F 36.114*** R2 .043 .468 ΔR2 .425 *p<.05. **p<.01. ***p<.001.
From the model 1 of the regression analysis in above table, the R2 value of the model is .043. It implied that 4.3% of the variation in customer loyalty is explained service quality. F-statistic is 1.714 but it is not significant because p >.05. In addition, the β value of frequency in travel with Vietjet is .169 (p<.01), it means that the more frequently customers fly with Vietjet, the more satisfied they are with the quality of service provided by this airline.
The model 2 shows that R2 is .468. This indicates that the five dimensions of service quality explain 46.8% of the variation in customer loyalty, which is significant (F=18.064, p <.001). Of the five dimensions above; tangibility, assurance, and responsiveness do not have effect on customer loyalty whereas reliability and empathy have positive effect on customer loyalty with the β value of reliability is .209 (p <.05) and the β value of empathy is .460 (p <.001). In addition, frequency in travel with Vietjet still has effect on customer loyalty but the influence is slightly reduced from the β value of .169 (p <.01) to .102 (p <.05).
In conclusion, among five dimensions of service quality; reliability and empathy have positive effect on customer loyalty. Therefore, hypothesis 2 is partially supported.
23
4.5.3. Relationship between customer satisfaction and customer
loyalty
In order to identify the impact of customer satisfaction on customer loyalty; control variables (gender, age, education, monthly income, purpose of travel, and frequency in travel with Vietjet), customer satisfaction and customer loyalty were analyzed. In the table below, the dependent variable is customer loyalty whereas customer satisfaction is independent variable.
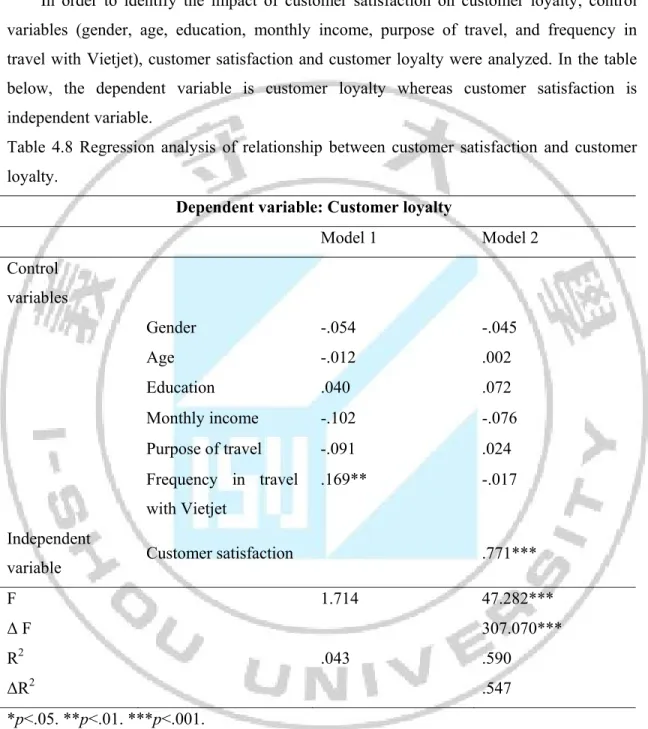
Table 4.8 Regression analysis of relationship between customer satisfaction and customer loyalty.
Dependent variable: Customer loyalty
Model 1 Model 2 Control variables Gender -.054 -.045 Age -.012 .002 Education .040 .072 Monthly income -.102 -.076 Purpose of travel -.091 .024 Frequency in travel with Vietjet .169** -.017 Independent
variable Customer satisfaction .771***
F 1.714 47.282***
Δ F 307.070***
R2 .043 .590
ΔR2 .547
*p<.05. **p<.01. ***p<.001.
In model 1, the R2 value is .043 and it shows that 4.3% of customer loyalty can be explained by customer satisfaction. F-statistic is 1.714 but it is not significant because p >.05. In addition, the β value of frequency in travel with Vietjet is .169 (p<.01), it means that the more frequently customers fly with Vietjet, the more satisfied they are with the service delivered by this airline.
24
It is observed from the model 2 that the R2 value is .590. It implied that 59% of customer loyalty changes is explained by customer satisfaction, which is significant (F=47.282, p<.001). In addition, all the control valuables have no effect on customer loyalty.
Consequently, customer satisfaction has a significant effect on customer loyalty in aviation industry. Hence, hypothesis 3 is supported.
4.5.4. Relationship between service quality, customer
satisfaction and customer loyalty
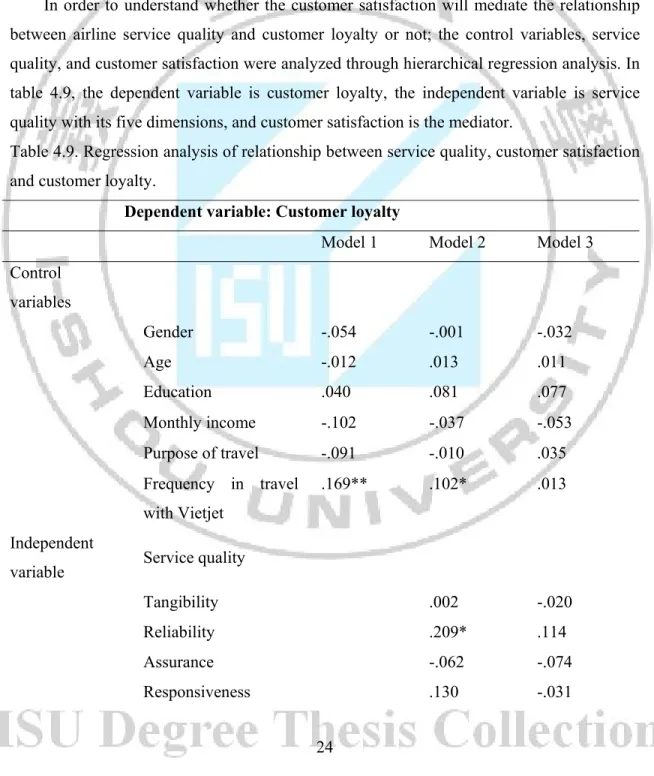
In order to understand whether the customer satisfaction will mediate the relationship between airline service quality and customer loyalty or not; the control variables, service quality, and customer satisfaction were analyzed through hierarchical regression analysis. In table 4.9, the dependent variable is customer loyalty, the independent variable is service quality with its five dimensions, and customer satisfaction is the mediator.
Table 4.9. Regression analysis of relationship between service quality, customer satisfaction and customer loyalty.
Dependent variable: Customer loyalty
Model 1 Model 2 Model 3 Control variables Gender -.054 -.001 -.032 Age -.012 .013 .011 Education .040 .081 .077 Monthly income -.102 -.037 -.053 Purpose of travel -.091 -.010 .035 Frequency in travel with Vietjet .169** .102* .013 Independent
variable Service quality
Tangibility .002 -.020
Reliability .209* .114
Assurance -.062 -.074
25
Empathy .460*** .202**
Mediator Customer satisfaction .628***
F 1.714 18.060*** 30.163***
Δ F 36.114*** 87.371***
R2 .043 .468 .617
ΔR2 .425 .149
*p<.05. **p<.01. *** p<.05
As can be observed from model 1, the R2 value is .043. It can be implied that 4.3% of the variation in customer loyalty can be explained by five dimensions of service quality. F-statistic is 1.714 but it is not significant because p >.05. In addition, the β value of frequency in travel with Vietjet is .169 (p<.01), it means that the more frequently customers fly with Vietjet, the more satisfied they are with the service delivered by this airline.
In the regression model 3, the R2 value is .617 which indicated that 61.7% changes in customer loyalty can be explained by service quality and satisfaction. The F value is 30.163 and is significant (p<.001). Besides, all the control valuables do not affect customer loyalty. In addition, as can be seen from model 2 on table 4.7, reliability and empathy have a positive and significant relationship with customer loyalty with the R2 value of reliability is .209 (p<.05) and the R2 of empathy is .460 (p<.001). However, when customer satisfaction appears as mediator variable, reliability is not significant for customer loyalty whereas empathy still shows a positive and significant relationship with customer loyalty but the influence is reduced from the β value of .460 (p <.001) to .202 (p <.01). Moreover, comparing customer satisfaction between table 4.9 and table 4.8 we can see that, it still has a positive and significant relationship with customer loyalty but the R2 value is slightly reduced from .771(p <.001) to .628 (p <.001).
Baron and Kenny’s (1986) conditions for mediation is utilized to examine the mediating role of customer satisfaction. Consequently, it can be concluded that customer satisfaction fully mediates the relationship between reliability and customer loyalty; and customer satisfaction partially mediates the relationship between empathy and customer loyalty.
26 Table 4.10. Summary of regression result
27
CHAPTER 5: CONCLUSIONS
5.1. Conclusions and recommendation
5.1.1. Airline service quality has a significant effect on customer
satisfaction.
Based on the hierarchical regressions’ result, it shows that airline service quality significantly affects customer satisfaction, meaning that if airlines attempt to better their quality of services, it will make their customers more satisfied. The result is in line with prior studies conducted by Parasuraman et al. (1988) and Cronin and Taylor (1992).
The result of the study also shows that three dimensions of service quality; reliability, responsiveness and empathy have an effect on customer satisfaction and loyalty. Reliability refer to ability to perform the promised service dependably and accurately. The study of Parasuraman et al. (1985), reliability has been repeatedly shown to be above all other dimensions. It implies that if the airline performs the service right the first time as well as delivering the services at the promised time, customers will be more satisfied with the company. Empathy is caring individualized attention the firm provides its customers. Studies of Ali et al. (2013) and Prayag (2007) also states that empathy significantly influences passengers’ satisfaction with airline service quality. By putting themselves in the shoes of a customer, employees of the airline will make their customer more satisfied. Responsiveness is the willingness to help customers and provide prompt service. It means that, if employees of the airline are quickly and promptly respond to the customers’ requests, they will be more satisfied with the company.
In sum, Vietjet’s managers should focus on these three dimensions of their services. Some recommendations may be offered as; they should offer consistent services and perform service right the first time, also they should take special care when dealing with customers. It also recommends that the staffs should not be too busy and always be available in case the customer requests.
5.1.2. Airline service quality has a significant effect on customer
loyalty
It can be observed from the findings that service quality has a positive effect on customer loyalty and is in line with prior research papers, including Mesay (2012), Wong
28
and Sohal (2003), Parasuraman et al. (1988). It states that airline companies must concentrate on their quality of service to build customer loyalty.
The result of the study reveals that, reliability and empathy have an effect on customer loyalty. It implies that customers will stay loyal if services delivered are reliable at all times. Additionally, if employees of the airline understand customers’ specific needs, they are more likely to be loyal. Therefore, it is suggested that Vietjet should pay intention on providing the service efficiently as promised and putting themselves in the shoes of the customers when providing service.
5.1.3. Customer satisfaction has a significant effect on customer
loyalty in aviation industry
Findings of this study concluded that customer satisfaction has a positive significant effect on customer loyalty. It means that when a customer feels satisfied then definitely he/she will also be loyal to the services. In addition, the loyalty which is generated will be followed by action of re-purchase or re-use airline services. Hence, customers will recommend positively about the services provided by airlines to the others. The result is similar with previous studies conducted by Amin, Leila, and Zahra (2014); Pi and Huang (2011) which found that customer satisfaction and customer loyalty are positively related. In addition, customer loyalty can be built not only by satisfying customer but also by providing high quality of service. Thus, this study recommends more emphasize on providing a good quality of service in the aviation industry.
5.1.4. Customer satisfaction mediates the relationship between
airline service quality and customer loyalty
The result shows that, satisfaction plays the mediating role on service quality and customer loyalty. This finding is in line with previous studies provided by Lam et al. (2006) and Butcher et al. (2001). The result also supports the theory advanced by Caruana et al. (2000) that customer satisfaction can strengthen or weaken the effect of service quality on customer loyalty.
Additionally, the result also shows that, customer satisfaction fully mediates the relationship between reliability and customer loyalty. It implies that if the airline delivers the service right the first time as well as offering the services at the promised time, customers will perceive more satisfaction. More satisfied the customer, the more loyal they are. “
29
Besides, customer satisfaction partially mediates the relationship between empathy and customer loyalty. It implies that taking special care about customers not only improves the level of satisfaction but also directly enhance their loyalty.”
5.2. Practical implications
This research aimed to examine Vietjet’s service quality that significantly affect customer satisfaction and loyalty. This study can be used as a reference in satisfying customers and enhancing greater customer loyalty in aviation sector.
Furthermore, the airline companies can focus on the service quality which positively affects customer satisfaction and loyalty, for example providing services as promised, enjoyable facilities, and hiring employees who have knowledge and carefulness. Delivering high quality of service will help satisfy customer and also generate customer loyalty in aviation industry.
Finally, this research gives the managers a better knowledge of satisfaction on the customer loyalty. It will help them improve their products and their standard of service to meet customers’ needs. By satisfying customer, the managers can improve customer loyalty in order to increase revenue and profitability.
5.3. Limitations and directions for future research
This research was conducted under some constraints, which should be addressed for future research. First of all, due to time and resource constraints, all of the questionnaires were administered to users from Vietjet in Noi Bai international airport in Hanoi. Thus, the result of this study is inadequate to represent the population of the airline customers in Vietnam. It is suggested that future research may be broadened to other big airports such as Tan Son Nhat international airport and Vinh international airport. Secondly, the study also confines itself to only target economy class passengers. The impact of service quality might have differences between first class, business class and economy class passengers. Thus, future research could be conducted to explore the effect of service quality between different passenger classes. Finally, this research only focused on Vietjet Air – a low-cost carrier. Future research may contemplate generating comparison between low-cost and full-service airlines to examine the difference of service quality levels between these two airline carrier typologies.
30
REFERENCES
Abdullah, K., Manaf, N. H. A., and Noor, K. M. (2007), Measuring The Service Quality of Airline Services in Malaysia, IIUM Journal of Economics and Management, 15(1), 1-29.
Ali, F., Omar, R., and Amin, M., (2013). “An examination of the relationships between physical environment, perceived value, image and behavioural Intentions: A SEM approach towards Malaysian resort hotels”. Journal of Hotel and Tourism Management, 27(2), 9-26.
Alotaibi, M. M. (2015). Evaluation of AIRQUAL Scale for Measuring Airline Service
Quality and its Effect on Customer Satisfaction and Loyalty (Doctoral dissertation).
Retrieved from ProQuest Dissertations and Theses. (Accession Order No. AAT 10121535).
Amin, T., Leila, R. N., & Zahra, F. (2014). Service quality, relationship quality and customer loyalty (Case study: Banking industry in Iran). Journal of Social Science, 2, 262-268.
Angelova, B. & Zekiri, J., 2011. Measuring Customer Satisfaction with Service Quality Using American Customer Satisfaction Model (ACSI Model). International Journal of
Academic Research in Business and Social Sciences, 1(3), 232-258.
Archana, R., and Subha, M. V. (2012). A Study on Service Quality and Passenger Satisfaction on Indian Airlines, International Journal of Multidisciplinary Research, 2(2), 50-63.
Asubonteng, P., McCleary, K.J. & Swan, J.E. (1996). SERVQUAL revisited: a critical review of service quality, The Journal of Services Marketing, 10(6), 62-81.
Aydin, K. & Yildirim, S. (2012). The measurement of service quality with SERVQUAL for different domestic airline firms in Turkey. Serbian Journal of Management, 7(2), 219-230. http://dx.doi.org/10.5937/sjm7-1317
Bari, S. & Bitner, M.J., Bavik, A., Ekiz, H. E., Hussain, K. and Toner, S. (2001), AIRQUAL: A Multiple-Item Scale for Measuring Service Quality, Customer Satisfaction, and Repurchase Intention, HOS-414 Graduation Project (Thesis), Gazimagusa: Eastern Mediterranean University, School of Tourism and Hospitality Management.
31
Baron, R. M. & D. Kenny (1986). Moderator-Mediator Variables Distinction in Social Psychological Research: Conceptual, Strategic, & Statistical Considerations. Journal of
Personality and Social Psychology, 51 (6), 1173-82
Baumann, C., Elliott, G., & Hamin, H. (2011). Modelling customer loyalty in financial services: A hybrid of formative and reflective constructs. International Journal of Bank
Marketing, 29(3), 247-267.
Bekhet, H. and B. Al-alak (2011). "Measuring factors affecting the adoption of E-statement in Malaysia", a paper presented at the 5th International conference on Services Management, 19-21. Gurgaon, India.
Bearden, W. & Teel, J. (1983). Selected Determinants of Consumer Satisfaction and Complaint Reports. Journal of Marketing Research, 20(1), 21-28.
http://dx.doi.org/10.2307/3151408
Butcher, Ken, Beverley Sparks, and Frances O’Callaghan. "Evaluative and Relational Influences On Service Loyalty". International Journal of Service Industry Management 12.4 (2001): 310-327. Web.
Caruana, A., M.T. Ewing and B. Ramaseshan (2000). Assessment of the Three - Column Format Servqual: An Experiment Approach. Journal of Business Research, 49: 57-65. Chandrashekaran, M., Rotte, K., Tax, S. S., & Grewal, R. (2007). Satisfaction strength and
customer loyalty. Journal of Marketing Research, 44, 153-163. http://dx.doi.org/10.1509/jmkr.44.1.153
Chang, Y.H. and Yeh, C.H. (2002). A survey analysis of service quality for domestic airlines, European Journal of Operational Research, 193, 166-177.
Cheng, B. & Rashid, Z.A., (2013). Service Quality and the Mediating Effect of Corporate Image on the Relationship between Customer Satisfaction and Customer Loyalty in the Malaysian Hotel Industry. International journal of Business, 15(2), 99-112.
Chiang, I.W.Y., Liang, G.S. and Yahalom, S.Z. (2003). The fuzzy clustering method: Applications in the air transport market in Taiwan. Database Marketing and Customer
Strategy Management, 11(2), 149-158.
Clemes, M. D., Gan, C., Kao, T. H., & Choong, M. (2008), An empirical analysis of customer satisfaction in international air travel, Innovative Marketing, 4, 49-62.
Crompton, John L., and Kelly J. Mackay (1989). "Users' Perceptions of the Relative Importance of Service Quality Dimensions in Selected Public Recreation Programs".
32
Cronin, J.J., Jr and S.A. Taylor (1992). Measuring Service Quality: A Reexamination and Extension, Journal of Marketing, 56, 53-68.
Civil Aviation Authority of Vietnam (2016). Tờ trình: Về việc phê duyệt Điều chỉnh quy hoạch phát triển giao thông vận tải hàng không giai đoạn đến năm 2030 và tầm nhìn đến năm 2050. Tờ trình, 1169, 6-18.
Dehghan, A. & Shahin, A., 2011. Customer Loyalty Assessment: A Case Study in MADDIRAN, the Distributor of LG Electronics in Iran. Journal of Business
Management and Strategy, 2(1), 1–23.
Eggert, A. & Ulaga, W., 2002. Customer perceived value: a substitute for satisfaction in business markets. Journal of Business & Industrial Marketing, 2-3(17), 107–118. Ekiz, H.E., Hussain, K. and Bavik, A. (2006), Perceptions of Service Quality in North
Cyprus National Airline.
Fick, G. & Brent Ritchie, J. (1991). Measuring Service Quality in the Travel and Tourism
Industry. Journal of Travel Research, 30(2), 2-9.
http://dx.doi.org/10.1177/004728759103000201.
Finn, D. W., & Lamb, C.W. (1991). An Evaluation of the SERVQUAL Scale in a Retail Setting, in Advances in Consumer Research, 18 (4), 483-490.
Fornell, C. (1992). "A National CustomerSatisfaction Barometer: The Swedish Experience,"
Journal of Marketing, 56, 6-12.
Forgas, S., Moliner, M. A., Sánchez, J., & Palau, R. (2010). Antecedents of airline passenger loyalty: Low-cost versus traditional airlines. Journal of Air Transport Management, 16(4), 229-233.
Ghylin, K., Green, B., Drury, C., Chen, J., Schultz, J., & Uggirala, A. et al. (2008). Clarifying the dimensions of four concepts of quality. Theoretical Issues in Ergonomics
Science, 9(1), 73-94. http://dx.doi.org/10.1080/14639220600857639.
Gomez, B.G., Arranz, A.G. and Cillan, J.G. (2006) The role of loyalty programs in behavioural and affective loyalty. Journal of Consumer Marketing, 23(7), 387-396. Gronroos, C. (1984). A service quality model and its marketing implications. European
Journal of Marketing, 18 (4), 36-44.
Groonroos, C. (1990). Service management and marketing (1st ed.). Lexington, Mass.: Lexington Books.
33
Gures, N., Arslan, S., & Yucel Tun, S. (2014). Customer Expectation, Satisfaction and Loyalty Relationship in Turkish Airline Industry. International Journal of Marketing
Studies, 6(1). http://dx.doi.org/10.5539/ijms.v6n1p66.
Hair, J., Black, W., Babin, B., & Anderson, R. (2014). Multivariate data analysis (1st ed.). Upper Saddle River, NJ: Prentice Hall.
Hyde, K. F. (2000). Recognising deductive processes in qualitative research. Qualitative Market Research: An International Journal, 3(2), 82-89.
IATA - Home. (2016). Iata.org. Retrieved 12 November 2016, from http://www.iata.org/Pages/default.aspx
Jacoby, J. & Chestnut, R. (1978). Brand loyalty (1st ed.). New York: Wiley.
Jan, M.T., Abdullah, K. and Smail, M.H. (2013). Antecedents of Loyalty in the Airline Industry of Malaysia: An Examination of Higher-Order Measurement Model.
Proceedings 3rd Asia-Pacific Business Research Conference, 1–14.
Johnson, Linda L., Michael J. Dotson, and B. J. Dunlap (1988). Service Quality Determinants and Effectiveness in the Real Estate Brokerage Industry, The Journal of
Real Estate Research, 3, 21-36.
Kotler, P. (2000). Marketing management (1st ed.). Upper Saddle River, N.J.: Prentice Hall. Kotler, P. & Keller, K. (2012). Marketing management (14th ed.). Upper Saddle River, N.J.:
Prentice Hall.
Lam, Regan, and Suzan Burton. "SME Banking Loyalty (And Disloyalty): A Qualitative Study in Hong Kong". International Journal of Bank Marketing 24.1 (2006): 37-52. Web.
Levesque, T., & McDougall, G.H.G. (1996), “Determinants of customer satisfaction in retail banking”, International Journal of Bank Marketing, 14(7), 12-20.
Lewis. R. C., & Booms, B. H. (1983). The Marketing Aspects of Service Quality. In Berry, L., Shostack, G., & Upah, G. (Eds.). Emerging Perspectives on Service Marketing. American Marketing Association Chicago, 99-107.
Lewis, B., & Mitchell, V. (1990). Defining and Measuring the Quality of Customer Service.
Marketing Intelligence & Planning, 8(6), 11-17.
http://dx.doi.org/10.1108/eum0000000001086
Li, C. (1998). Quality evaluation of domestic airline industry using modified Taguchi loss function with different weights and target values. Total Quality Management, 9(7), 645-653. http://dx.doi.org/10.1080/0954412988334.
34
Lin, S.P., Chan, Y.H., & Tsai, M.C. (2009). A transformation function corresponding to IPA and gap analysis. Total Quality Management & Business Excellence, 20(8), 829–846. Lovelock, C. and Wirtz, J. (2010). Services Marketing - People, Technology, Strategy. (7th
ed.). Prentice Hall.
Marshall, M. N. (1996). Sampling for qualitative research. Family practice, 13(6), 522-526. McDaniel, C. & Gates, R. (1999). Contemporary Marketing Research (4th ed.). South
Western University Publications: Cincinnatti.
Mesay, S. S. (2012), Measuring service quality in Ethiopian airlines. Journal of Educational
and Social Research, 2 (9), 173–180.
Muijs, D. (2004). Doing quantitative research in education with SPSS (1st ed.). London: SAGE.
Nadiri, H., Hussain, K., Ekiz, E.H and Erdogan, S. (2008). An investigation on the factors influencing passengers’ loyalty in the North Cyprus national airline. The TQM Journal. 20 (3), 265-280
Naureen, A., & Sahial, P. (2013). Impact of Customer Satisfaction and Demographic Factors on Customer’s Loyalty in Banking Sector of Pakistan. Middle-East Journal of
Scientific Research, 18(5), 721-727.
Newman, J. W., & Werbel, R. A. (1973). Multivariate analysis of brand loyalty for major household appliances. Journal of Marketing Research, 10, 404–409.
Ostrowski, P., O'Brien, T., & Gordon, G. (1993). Service Quality and Customer Loyalty in the Commercial Airline Industry. Journal of Travel Research, 32(2), 16-28. http://dx.doi.org/10.1177/004728759303200203
Pakdil, F., Aydın, O. (2007). Expectations and perceptions in airline services: An analysis using weighted servqual scores. Journal of Air Transport Management, 13(4), 229-237. Parasuraman, A., Zeithaml, V. A., & Berry, L. L. (1985). A conceptual model of service
quality and its implications for future research, Journal of Marketing, 49, 41-50.
Parasuraman, A., Zeithaml, V. A., & Berry, L. L. (1988). SERVQUAL: A multiple-item scale for measuring consumer perceptions of service quality, Journal of Retailing, 64(1), 12-40.
Parasuraman, A., Zeithaml, V. A., & Berry, L.L. (1991). Refinement and reassessment of the SERVQUAL scale. Journal of Retailing, 67(4), 420-450.
Park, J., Robertson, R. and Cheng-Lung, W. (2005). Investigating the Effects of Airline Service Quality on Airline Image and Passengers’ Future Behavioural Intentions: