國立臺灣大學生物資源暨農學院動物科學技術學系 博士論文
Department of Animal Science and Technology College of Bioresources and Agriculture
National Taiwan University Doctoral Dissertation
二十二碳六烯酸藉由血漿澱粉酶 A 蛋白與四締素 調控脂肪細胞脂質分解與堆積
Docosahexaenoic acid regulates lipolysis and lipogenesis through serum amyloid A protein and tetranectin in adipocytes
王雅青 Ya-Chin Wang
指導教授:丁詩同 博士 Advisor: Shin-Torng Ding, Ph.D.
中華民國 102 年 2 月
February, 2013
誌謝
能完成這篇論文,我要特別感謝我的指導教授丁詩同老師。謝謝口試委員-陳 洵一老師,朱有田老師,陳珠亮老師和葉秀慧老師的用心指教。謝謝永遠的聖誕老公 公 Harry Mersmann 和開心果 Flevia 在人生及研究路上的指引。也要感謝分子生物 研究室的每一位成員對我的支持與鼓勵,秉勳,郁仁,原佑,瑞婷,幼欣,陳志堅學長及 全體同仁。謝謝台大醫院外科:張金堅醫師及郭文宏醫師長年提供實驗的樣本以及 貼心幫忙聯絡的小潔及心如助理。 另外,育種研究室:鄭登貴老師、吳信志老師、
韋雄學長、淳淳;遺傳研究室;中研院陳玉如老師及台大醫院基因體核心實驗室 在研究上的協助及指點迷津。感念動科系辦的游老大及廖學姐,你們讓動科系更 有家的味道。
生活上,感謝有主的肢體,相愛住在一起,感謝台北 19、10 會所及岡山召會 中各個基督徒的愛護及成全。住了多年的姐妹之家,到許多不同的家中相調,不 少的操練及榜樣,都成為我生命長大的養份。時常體恤我研究上的辛勞,並給予 我鼓勵及加強。讓我一步步的認識這位萬有主。同時,謝謝一路相伴打氣的好友 們:榕婷,志偉,思慧,明吟,阿德,美伶,玟菁。
最後感謝我的家人,我想對父母說一句:「老爸,老媽謝謝你,尤其是老爸,
辛苦你了!」,我有個全世界最貼心的弟弟及妹妹。感謝主,遠征美國旅途中,一 場始料未的意外相遇下,也帶給我二位美好的家庭新成員-Gary and Victoria Mai Vandegriek。
感謝人生旅途中,每一位貴人。人生這場美好的仗,願一直有「主」同在。
願你喜樂!
中文摘要
脂肪代謝相關疾病,例如:胰島素阻抗、糖尿病以及心血管疾病嚴重威脅人類 健康,而 N-3 多不飽合脂肪酸,特別是 docosahexaenoic acid (DHA)被發現對這些疾病 有療效,但其中的作用機制尚未被發覺。先前的研究顯示血液澱粉酶 A (SAA)參與 DHA 在之下脂質代謝的調控,於是我們率先先設計實驗闡明其中的機制。結果顯 示,在初代培養的人類脂肪細胞(PHA), DHA 處理則增加 SAA 基因及其它相關脂 質代謝基因的表現。另外,SAA重組蛋白的處理,抑制 PPARγ 及脂質生成基因表現,
並且提升脂質分解基因的表現,例如 hormone sensitive lipase (HSL),同時伴隨甘油 自脂肪細胞釋出的提高。我們更進一步發現,SAA 的處理,降低覆膜在油滴表面 的 perilipin 基因表現。此結果說明,DHA 和 SAA 部份增加 HSL 的基因表現並透 過降低 perilipin 來影響脂解作用。在另一個研究中,利用二維電泳的技術,我們發 現一個會與 plasminogen 結合的蛋白;四締素(tetranectin ;TN),為一種自脂肪 細胞外泌的脂肪細胞激素。基因表現分析中顯示,在人類脂肪組織中,TN 的表現 量與身體質量指數(BMI)和脂質生合成呈正比。利用腺病毒大量表現 TN 在 PHA 中,
可提高脂質生成相關基因表現及油滴在脂肪細胞中堆積。同樣利用腺病毒感染 PHA,降低 TN 表現的實驗中,則無以上的現象。活體實驗中顯示,相較於對照組,
高脂餵飼的小鼠脂肪組織中有大量 TN 表現。小鼠在 DHA 的餵飼後,TN 表現則 顯著受到抑制。綜合以上結果,顯示 DHA 可調控脂解因子 SAA 表現上升及並降 低促進脂質生成的 TN 表現,進而調整脂肪組織中的脂質代謝,有益於改善肥胖。
從此成果中,可做為未來發展治療肥胖及相關疾病的方向。
關鍵字:二十二碳六烯酸、血液澱粉酶A、四締素、脂解作用、脂質生成,脂肪
細胞激素
ABSTRACT
Obesity is highly associated with insulin resistance, diaabetes and cardiovascular diseases, and thereby greatly impacts human health. n-3 polyunsaturated fatty acids, specifically docosahexaenoic acid (DHA), has beneficial effects on human health, but the underlying mechanisms remain elusive. Based on our previous studies that serum amyloid A protein (SAA) is involved in DHA’s regulation of lipid metabolisms, we then conducted a serious of studies to elucidate the underlying mechanism. Promoted SAA and lipid metabolism-associated gene expression in human adipocytes results showed that treating the primary human adipocytes (PHA) with DHA increases the gene expression of SAA and those genes associated with lipid metabolism. Moreover, addition of recombinant SAA inhibited the expression of peroxisome proliferator-activated receptor γ and lipogenic genes, but enhanced lipolytic gene expression such as hormone sensitive lipase (HSL) in PHA, in association with increased glycerol release into the medium. We also found that expression of perilipin, a lipid droplet-coating protein, was decreased by hSAA1 treatment. These results suggest that the lipolytic effects of DHA and SAA are, at least partially, mediated by upregulation of HSL and perilipin downregulation. Using 2D PAGE technique, a plasminogen -kind protein, tetranectin (TN) was identified as a secretory adipocytokin from PHA. In human adipose tissue, expression of TN is positively correlated with body mass index, as well as adipogenesis. Lentiviral overexpression of TN in PHA increased the expression of lipogenic genes and lipid accumulation, which were blocked by lentiviral knockdown of TN. Finally, we found that TN expression was elevated in the adipose tissues of mice fed with high-fat diet fed, but was diminished by DHA treatment. Taken together, our results suggest that DHA exerts beneficial effects on
obesity by up-regulating a lipolytic factor, SAA expression, yet down-regulating lipogenic TN, to modulate lipid metabolism in the adipose tissue. The results gained from the study may shed lights for future development of better therapeutic approaches in obesity and related diseases.
Key words: docosahexaenoic acid, serum amyloid A protein, tetranectin, lipolysis, lipogenesis, adipocytokines
CONTENTS
口試委員會審定書... #
誌謝 ... i
中文摘要 ... ii
ABSTRACT ... iv
List of figures... viii
Introduction ... 1
Chapter 1 Literature review ... 2
Chapter 2 Docosahexaenoic acid regulates serum amyloid A protein to promote lipolysis through down regulation of perilipin ... 9
2.1 Aims of research plan ... 9
2.2 Introduction ... 9
2.3 Materials and methods ... 10
2.4 Results ... 15
2.4.1 Effect of recombinant hSAA1 on the expression of genes related to lipid metabolism in HepG2 cells ... 15
2.5 Discussion ... 24
Chapter 3 Tetranectin promotes adipogenesis and lipogenesis and is negatively regulated by polyunsaturated fatty acids in human adipocytes ... 29
3.1 Aims of research plan ... 29
3.2 Introduction ... 29
3.3 Material and methods ... 30
3.4 Result ... 36
3.5 Discussion ... 58
Appendix... ... 64 REFERENCES ... 65
List of figures
Fig. 2-1 Effects of hSAA1 on the expression of lipid metabolism-associated genes ... 18 Fig. 2-2 Human serum amyloid protein A 1 (hSAA1) promoted lipolysis- and inhibited lipogenesis-related genes in primary human
adipocytes...20 Fig. 2-3 The effect of docosahexaenoic acid (DHA) on the expression of serum amyloid protein A 1 (SAA1) in adipocytes...22 Fig. 2-4 DHA regulates SAA to promote lipolysis through down regulation of
perilipin. in primary human adipocytes...24 Fig. 3-1 Tetranectin (TN) was a secreted cytokine from adipocytes ... 38 Fig. 3-2 Correlation of TN mRNA Expression adipogenesis ... 40 Fig. 3-3 Functional analysis of Tetranectin in human adipocytes by proteomic
analysis ... 43 Fig. 3-4 Effects of TN on lipid metabolism in primary human adipocytes ... 4 Fig. 3-5 TN regulated lipid metabolism through MMP3, TIMP1 and tPA ... 52
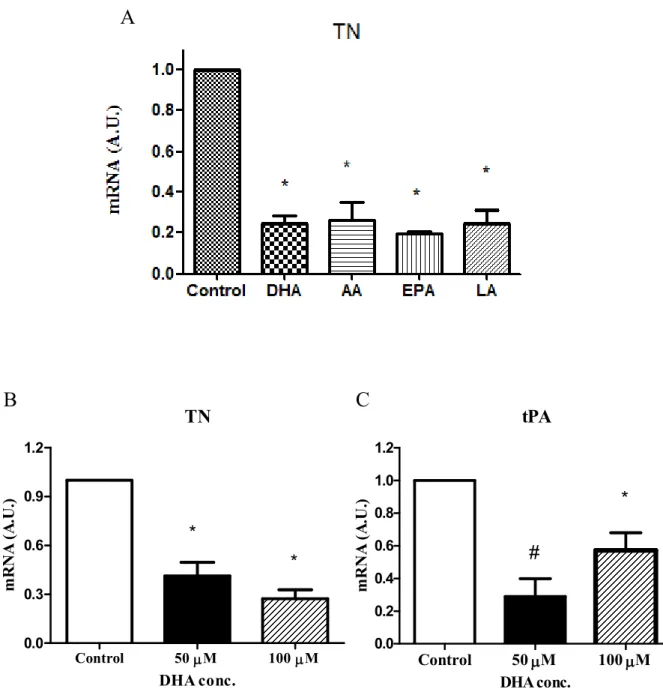
Fig. 3-6 TN expresses higher in obese mice than lean and decrease expression by DHA treatment. ... 53 Fig. 3-7 The mRNA concentration of TN in human adipocytes was significantly
inhibited by PUFA ... 56
LIST OF TABLES
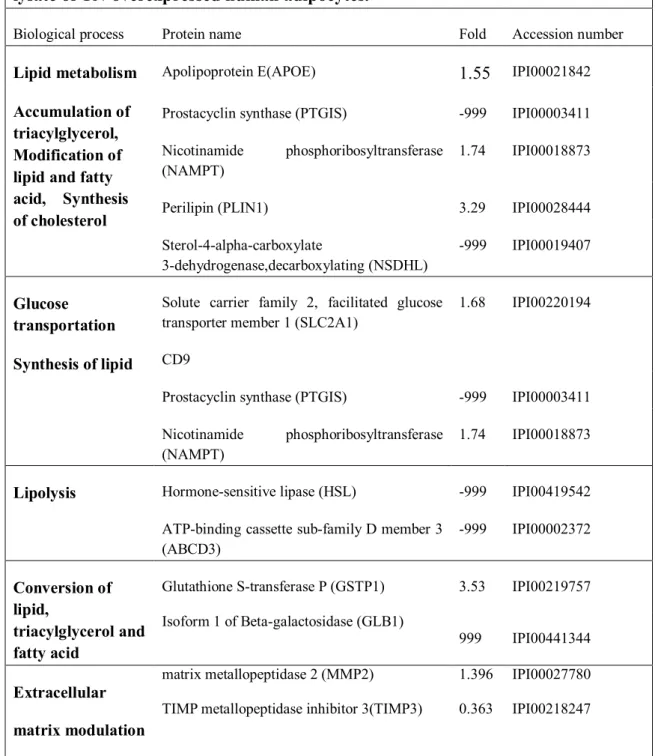
Table 2-1 List of primer sequences for real-time PCR. ... 16 Table 4-1 Examples of function analysis from large scale analysis of the total cell lysate of TN-overexpressed human adipocytes ... 47
Introduction
Obesity is a world-wide problem now. Adipogenesis, lipogenesis and lipolysis are dynamic balance to each other in adipose tissue. Adipose tissue not only acts as a organ store energy but function as an endocrine organ to play a role in the pathogenesis of obesity-related diseases1. Obesity has highly correlation with diabetes, cardiovascular diseases, immune diseases and cancer. Adipose tissue is an active endocrine organ to secret a various of cytokines into blood. These adipocyte-specific cytokines are named adipocytokines2. Some adipocytokines act in an autocrine or fashion, while others are released into the systemic circulation and exert its effect onmolecules in other tissues. Adipocytokines can modulate metabolic and immune functions and are markedly related to obesity and type Ⅱ diabetes3,4.
Polyunsaturated fatty acids (PUFAs) can regulate adipose tissue functions at a pathological and physiological aspect5. PUFA have several physiological functions on the whole-body metabolism including decreasing of lipid concentration in blood, promoting insulin sensitivity and immune modulation, and further preventing obesity, diabetes, cardiovascular disease and inflammation6,7. Several unknown cytokines found from adipose tissue some adipokines were show for multiple new functions.
We have aimed to discover novel cytokines and its role in mediating PUFAs function in adipose tissue.
We first aimed to elucidate mechanisms of DHA regulation on lipolysis through SAA in PHA was observed. Then, we tried to define a novel adipocytokine, TN and addressed its function in adipose tissue.
Through the study, we expected to provide some results related to DHA, SAA or TN for obesity therapy to further improve metabolic syndromes.
Chapter 1 Literature review
1.1 Polyunsaturated fatty acids
Polyunsaturated fatty acids (PUFAs) are fatty acids that contain more than one double bond in their backbone, and can be classified into various groups by their chemical structure:
1. Methylene-Interrupted Polyenes: These fatty acids have 2 or more cis double bonds that are separated from each other by a single methylene group. (This form is also sometimes called a divinylmethane pattern.). The essential fatty acids are all omega-3 and -6 methylene-interrupted fatty acids, such as Arachidonic acid (AA;
20:4 (n-6)), Docosadienoic acid (22:2 (n-6)), Docosapentaenoic acid (22:5 (n-6)), Docosahexaenoic acid (DHA; 22:6 (n-3)), Eicosapentaenoic acid (EPA, 20:5 (n-3)).
And Omega-9 fatty acids are mono- and polyunsaturated, including Oleic acid (18:1 (n-9)), Mead acid (20:3 (n-9)).
2. Conjugated fatty acids: Conjugated fatty acids have two or more conjugated double bonds, such as Rumenic acid (18:2 (n-7)), Punicic acid (18:3 (n-5)).
3. Other Polyunsaturates: Pinolenic acid (18:3 (n-6)), Podocarpic acid (20:3 (n-6)).
1.2 Obese epidemic
Overweight is a major concern of health issues by the public now. According to some reports health, there are around 1.46 billion adults worldwide have BMI of 25 kg/m2 or greater in 2008, of which 6 million adults (2.05 million men and 2.97 million women) were obese 8. In both developed and developing countries, obesity becomes epidemic issue across in all age groups with the increasing prevalence of obesity, a large burden on health care use and costs may impact the finance of the countries.
Weight loss can improve health and related diseases and economic benefits. Dietary
therapy, physical activity and lifestyle modification are good effective for weight loss strategies. Obese or overweight patients with concomitant obesity-related risk factors or diseases thus may need drug therapy9.
1.3 The effect and benefit of polyunsaturated fatty acids in obesity and lipid metabolism
Mice and humans exhibited lower body weight and reduced fat deposition when fed with with high PUFA diet10. PUFAs exert protective effects through direct or indirect pathways in lipid metabolism. Fish oil enriched with PUFA treated in the rats including metabolic syndrome, the blood pressure, serum insulin, cholesterol, TAG and NEFA were decreased, although there was no change in plasma TNFα concentration or fat accumulation11. Patients with metabolic syndrome have a high risk to develop cardiovascular disease and PUFA administration for at least 3 months significantly decreased serum triglycerides by 7% to 25% and is helpful to prevent cardiovascular diseases12.
1.4 Regulation of inflammation by long-chain n-3 PUFAs
Long-chain n-3 PUFA can exert anti-inflammatory effects by reducing pro-inflammatory cytokine expressions. Therefore, long-chain n-3 PUFA may provide an anti-inflammatory strategy to improve obesity-related diseases13.
Long-chain n-3 PUFA regulate gene expressions not only through transcription factors such as PPAR and NF-kappaB but also via eicosanoid production, reducing pro-inflammatory cytokine production from different types of cells including macrophages. Long-chain n-3 PUFA may therefore offer a useful anti-inflammatory strategy7.
Obesity nowadays is regarded as a to low-grade chronic inflammatory condition and characterized as inflammation with increased macrophage infiltration in the adipose tissue14. Furthermore, neutrophils and T-cells, may enter the adipose tissue first and contribute to the recruitment of microphages into adipose tissue. Obese individuals express more amount of pro-inflammatory cytokines as compared to lean ones, those pro-inflammatory molecules include interleukin 6 (IL-6), tumor necrosis factor alpha (TNFα), C-reactive protein, soluble intercellular adhesion molecules, inducible NO synthase, transforming growth factor b1, monocyte chemotactic protein (MCP)-1, tissue factor and factor VII, plasminogen activator inhibitor type 12,15,16. Recent reports suggest that stromal vascular cells, which contain endothelial cells, immune cells and pre-adipocytes also produce pro-inflammatory molecules into the richest adipose tissue. The evidences support that increased infiltration of macrophages into the adipose tissue elute adipose tissue into low-grade inflammation status. Adipose tissue with enhanced adiposity are constantly stimulated by pro-inflammatory molecules that are only from adipocytes, but derived from microphages 17. Those pro-inflammation cytokine in adipose tissue, for example, IL-1b, TNFα and IL-6 have been considered in promoting the development insulin resistance and obesity17.
Many reports have shown move macrophages infiltration into adipose tissue by HFD treatment in the mouse model for type 2 diabetes and in genetically diabetic db/db mice18. Dietary induction of LC n-3 PUFA reduces
macrophage infiltration into adipose tissue and suppresses inflammatory gene expression and c-Jun N-terminal kinase phosphorylation in HFD induced dialectics mice without changes of body weight18.
1.5 Regulation of transcription factors and cytokines by long-chain n-3 PUFAs PUFA also expresses expression of same lipid accumulation-related genes including cytokines and transcription factors in the adipose tissue. Past studies suggested that serum IL-6 can significantly reduced and TNFα has trend-wise reduction by 4 g/day n3-PUFA12. PUFA also regulates extensively the lipid metabolism by cytokines through transcription factors in adipose tissue19. The major fatty acids in PUFA are DHA and EPA, DHA is implicated in modulating homeostasis and lipid metabolism through transcription factors and protein kinase20, such as PPAR, liver X receptors and sterol regulatory element binding protein-l(SREBP1) adipocyte determination and differentiation dependent factor 1. These transcription factors regulate fatty acid metabolism and expression of various cytokines. including leptin, adiponectin, resistin21, TNFα, IL-6 and etc. 7,22.
PUFAs inhibit expression of SREBP1 in porcine adipocytes. SREBP1 is a transcription factor that stimulates expression of genes involved in lipogenesis. Our group reported that porcine primary adipocytes treated with DHA, expression of steady-state transcription factor SREBP1 mRNA and lipogenesis related genes and cytokines were decreased through a mechanism related to fatty acid peroxidation in adipocytes and liver 23-25.
The metabolic products from PUFAs could be PPAR activators, docosahexaenoic acid and particularly eicosapentaenoic acid can activate PPARγ in porcine. and then induce gene expressions responsible for fatty acid oxidation such as hormone sensitive lipase, acyl-CoA oxidase, hydoxymethylglutaryl-CoA synthase and fatty
acyl-CoA synthetase26,27. Also, when PPARγ+/+ transgenic mice were treated with diet enriched with fish oil, expressions of adipogenic and glucose uptake genes, such as Glut4 are increased in the muscle. These results indicate that the glucose uptake in vivo may be regulated by PUFAs as a natural regulator through PPARγ activation
16.
Various adipocyte-derived hormones (adipocytokines) have been described capable to affect insulin sensitivity, inflammation, and stress, and thereby are potentially linked to obesity, diabetes and cardiovascular diseases 28,29. The relationship between PUFA and cytokines related to obesity and inflammation are discussed below.
1.6 Regulation of adipocytokine, SAA by long-chain n-3 PUFAs
Serum amyloid A (SAA) is a family of apolipoproteins associated with high-density lipoprotein and primarily produced from the liver. SAA is also an acute-phase protein induced by inflammation and obesity. SAA1 responds to tissue damage and inflammation. In the acute-phase stage, SAA is induced primarily by IL-1, TNF α , and IL-6 through the down-regulation of NF-κB, CCAAT/enhancer-binding protein (C/EBP) family30.
Polyunsaturated fatty acids (PUFA) have been showed to decrease lipid concentration in blood, promote insulin sensitivity and immune responses. They also reduce expression of adipogenesis-related genes and lipid accumulation.
Docosahexaenoic acid (DHA), one of n-3 PUFA, downregulates hepatic lipogenic genes in the liver of pigs. Using the suppression subtractive hybridization technique31. We demonstrated that hepatic SAA mRNA concentration was promoted by dietary DHA in pigs. Thus, DHA may regulate lipid metabolism through increased SAA
expression. When porcine primary hepatic cell was treated with DHA, the expression of SAA mRNA was induced. SAA treatment also reduced the express of genes related to lipid metabolism, including PPARγ and lipoprotein lipase (LPL). SAA mRNA aboudance also significantly correlated with inflammatory and adiposity markers, including interleukin 6 (IL6) and tumor necrosis factor α (TNFα) 32. Since SAA1 is correlated significantly with the degree of obesity and the risk of cardiovascular disease, therefore SAA1 is considered as a marker for obesity and cardiovascular disease . Both of in the procine and human adipocytes studies, we discovered the effect of SAA1 in lipid metabolism and suggest that SAA1 is a mediator to reduce fat deposition1,33.
1.7 Introduction of TN
TN also named Clec3B, is a homotrimeric C-type superfamily lectin, also called C-type lectin domain family 3, member B (CLEC3B). Tetranectin binds to plasminogen at the presence of calcium to form tetranectin-plasminogen complex with tissue-type plasminogen activator (tPA) 34. The tetranectin-plasminogen complex, as an inducer, drives fibrinolysis. The tPA-catalyzed plasminogen is activated in fibrinolysis and participates in thrombus dissolution 35,36. Tetranectin is reduced in serum after clotting of plasma, and tetranectin is presence in clot lysates 35. These results suggested that tetranectin is associated with clotlysisclinical research, when stroke patients were treated with recombinant tPA (rtPA) and a low-dose of argatroban (a direct thrombin inhibitor), 43% patients with clot in brain artery were completely broken 37. Acute myocardial infarction (AIM) patients have significant lower plasma TN as compared to healthy subjects. When AIM patients underwent thrombolytic treatment with rtPA, the plasma tetranectin increased at the end of rtPA
infusion and some patients established early blood vessel recanalization. Tetranectin returned to the baseline levels 12 h after rtPA treatment 38. Because tetranectin is involved in the dissolution of fibrin clot and vascular homeostasis, it may exert a protective role against cardiovascular disease.
If human TN gene is consisted by three exons which encodes specific functional domains. The heparin binding site is encoded in first exon 1 of TN. The second exon encodes an a helix domain, which conducts the trimerisation of TN monomers by assembling them into a triple helical coiled structural element. The 3th exon encodes a C-type lectin-like domain, which is homologous to the carbohydrate recognition domains of calcium dependent animal lectins. Moreover, TN has O linked glycosylation at threonine39,40.
In addition, many reports suggested indicated that serum TN concentrations in patients with malignant tumors correlate with disease stage and survival and TN expression correlate well with tumor histological grading41 . In human breast cancer, TN play a possible role in the invasiveness and metastatic spread as a cancer marker42.
Chapter 2 Docosahexaenoic acid regulates serum amyloid A protein to promote lipolysis through
down regulation of perilipin
2.1 Aims of research plan
Since docosahexanoic acid (DHA) increases lipolysis and decreases lipogenesis through several pathways, we hypothesized that DHA may regulate the expression of serum amyloid A protein (SAA) to affect lipid metabolism. The aim of this study is to demonstrate whether DHA and SAA exert similar effects to increase lipolysis and decrease lipogenesis in human adipocytes.
2.2 Introduction
Docosahexaenoic acid (DHA) can increase lipolysis and decreases lipogenesis through several pathways. DHA also enhances the expression of serum amyloid A protein (SAA), a possible regulator of lipid metabolism. Thus hearses a question whether DHA affects lipid metabolism and increase lipolysis in human adipocytes through regulate. We designed experiments to determine the role of SAA in regulating lipid metabolism in HepG2 cells using microarray technology. In human hepatocytes, recombinant human SAA1 (hSAA1) inhibited the expression of genes related to lipogenesis and promoted the expression of those genes involved in lipolysis. When human breast adipocytes were treated with hSAA1 or DHA in vitro, the expression of peroxisome proliferator-activated receptor γ and other lipogenic genes were decreased whereas the expression of several lipolytic genes were increased. Glycerol release was also increased by both SAA or DHA treatment,
suggesting an increased lipolytic activity in human adipocytes. Expression of perilipin, a lipid droplet-protective protein, was decreased and hormone sensitive lipase was increased by both of hSAA1 and DHA treatment. We speculated that the mechanism of lipolysis by DHA or SAA is at least partially mediated by increased expression of hormone sensitive lipase and decreased expression of perilipin. Since DHA treatment increased expression of hSAA1 in human adipocytes, the reduced in expression of lipogenesis genes and enhancement of lipolysis by DHA is very likely mediated through the activity of SAA1.
2.3 Materials and methods
2.3.1 HepG2 cell culture
HepG2 cells (hepatocellular carcinoma, ATCC no. CRL-11997) were cultured in Dulbecco’s Modified Eagle Medium (DMEM; Invitrogen, New York) in 6-well plates.
When cells had proliferated to approximately 80% confluence, they were treated with DMEM containing hSAA1 (Acris, Hiddenhausen, Germany) diluted into 5 mM Tris in PBS, pH=7.6. The hSAA1 final concentration in the medium was 2 μM. The Control medium was hSAA1-free Tris added in DMEM. Human adipocytes were cultured with hSAA1 and control medium for 72 h at 37ºC in an atmosphere of 5%
CO2 in air. Total RNA was extracted for gene expression profile analysis.
2.3.2 Human adipose tissue
Adipose tissues were obtained from the breast tissue of 5 women undergoing mastectomy. The subjects were 33-51 yr of age (mean = 43.6, SD = 6.18) with a BMI
of 16-29 kg/m2 (mean = 21.5, SD = 4.50). All participants gave permission in writing and the study was approved by the Ethics Committee of National Taiwan University Hospital.
2.3.3 Isolation of human stromal/vascular (S/V) cells and differentiation
Human breast adipose tissues were dissected under sterile condition and immediately transferred to sterile transport buffer (0.9% NaCl, 56 mM glucose, 25 mM HEPES, penicillin 100 U/mL, streptomycin 100 μg/mL, pH = 7.4) for transportation to the laboratory (approximately 30 to 35 minutes at 37ºC). Tissues were minced into small pieces and 13 g tissue was digested with 6000 unit collagenase (C6885, collagenase from clostridium histolyticum, type II, Sigma-Aldrich, St. Louis, MI) in 15 ml KRBG buffer (121 mM NaCl, 4.85 mM KCl, 1.2 mM KH2PO4, 1.2 mM MgSO4, 25 mM NaHCO3, 30 mM glucose, 1.25 mM CaCl2, penicillin 100 U/mL, streptomycin 100 μg/mL) at 37ºC for 50 minutes. The released stromal/vascular (S/V) cells or preadipocytes were centrifuged at 800 g for 10 minutes at room temperature. Collected S/V cells were washed 3 times with DMEM/F12 medium. The cells were plated in DMEM/F12 with 10% fetal bovine serum at 8 × 10⁴ cell/cm225.
2.3.4 Incubation of human primary adipocytes with recombinant hSAA1 or DHA
When the S/V cells were grown approximately confluent, medium was removed and replaced with serum-free, hormone-supplemented differentiation medium (DMEM/F12 containing 14.2 mM sodium bicarbonate, 2 mM L-glutamine, 10 mg/ml transferrin, 33 μM biotin, 17 μM pantothenate, 0.5 μM insulin, 1 μM dexamethasone,
1 nM triiodothyronine, 1 μM rosiglitazone, 0.25 mM 3-isobutyl-methylxanthine, 100 U penicillin/mL, 100 mg streptomycin/mL and 1.5 μg/mL amphotericin B) for 3 d to induce adipogenesis. The medium was then replaced with maintenance differentiation medium, the same medium without rosiglitazone and 3-isobutyl-methylxanthine 25. At the 13th day, when approximately 70% of cells were differentiated (visual appraisal of cells with lipid droplets), cells then were treated with only DMEM/F12 for 24 h, then the medium was replaced with DMEM/F12 containing 0 μM, 0.2 μM, or 1 μM of hSAA1 (Acris, Hiddenhausen, Germany) (Physiological concentration of SAA is ranged from 590 nM to 740 nM ) or 0 μM, 50 μM, or 100 μM DHA (Nu-Check, Elysian, MN) complexed to 1% BSA (The physiological concentration of DHA is 82 μM to 91 μM ). After 24 h, culture medium was collected to determine the glycerol concentration by Free Glycerol Assay Kit (BioVision, Mountain View, CA) according to the manufacturer’s procedure.
2.3.5 Total RNA extraction and RNA amplification
Total RNA was extracted from cells using the TRI Reagent (Ambion, Foster City, CA). The mRNA for microarray analysis was amplified by MessageAmp II aRNA amplification reagent kit (Ambion, Foster City, CA). Amplified aRNA was quantified at 260 nm using the Nano Drop Spectrophotometer (Nano Drop Technologies, Wilmington, DE). The quality of RNA was also monitored by the 260/280 nm absorbance.
2.3.6 Microarray analysis for gene expression
The aRNA was fluorescence-labelled using the ULS Labeling Kit (Kreatech,
Amsterdam, Netherlands) according to the manufacturer’s procedure. The efficiency of fluorescence labeling achieved > 2.0%. The CustomArray metabolism 12K microarray (CombiMatrix, Mukilteo, WA) for gene expression analysis was used.
Four μg fluorescence-labeled aRNA were used for hybridization for 16 h. The fluorescent images of the chips were scanned by GenePix 4000B microarray chip scanner (Molecular Devices, Sunnyvale, CA). The data was analyzed by the on-line software (Microarray Imager, CombiMatrix). Several differentially expressing genes identified by microarray analysis were confirmed using real time PCR.
2.3.7 Quantitative real-time PCR (qPCR) analysis
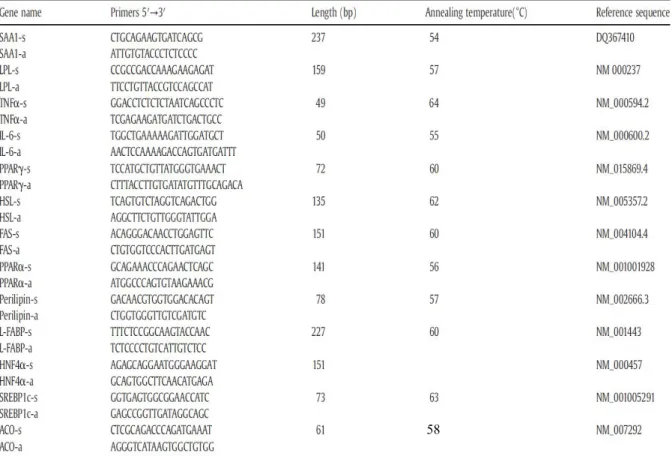
For qPCR, 5 μg RNA was digested with DNase I (Epicentre, Madison, WI) and then three μg RNA were reverse transcribed into cDNA using a High Capacity cDNA Reverse Transcription Kit (Applied Biosystems, Foster City, CA) with random primer scheme for initiating cDNA synthesis. The cDNA for various genes was amplified using the DyNAmo Flash SYBR Green Kit (Finnzymes, Espoo, Finland) with paired sense and antisense primers designed from human gene sequences. The primer pairs and optimized annealing temperature for individual genes were listed in Supplemental Table 1. The conditions for PCR were denature at 95ºC for 10 s (7 min in the first cycle), annealing at the optimized annealing temperature for 15 s, and extension at 74ºC for 5 s. The qPCR reaction was carried out for 40 cycles. Melting curve analysis was routinely performed by increasing the temperature from 55 to 95 ºC, and signals were detected every 0.5 ºC. The mRNA concentration of each gene was normalized to the β-actin mRNA concentration in the same sample. Amplification of specific transcripts was further confirmed by melting curve profile analysis and agarose gel electrophoresis. Primer efficiency was calculated using the formula [10 (-1/slope)]-1 43.
Threshold cycle (Ct) values were obtained and relative gene expression ratio was calculated using the formula (1+Efficiency of target gene) △Ct of target (β-actin – target gene)
/(1+Efficiency of β-actin) △Ct of β-actin (β-actin – target gene)43
.
2.3.8 Statistic analysis
For each replicate, the control value for a variable was set to one with other variables expressed relative to the control. Homogeneity of the variance was determined and the treatment effects were analyzed using ANOVA to determine the effects of DHA or hSAA1 at different concentrations. Tukey’s test was used to evaluate differences among means (SAS Inst. Inc., Cary, NC), except Fig. 1 which was analyzed by t-test. A significant difference indicates that the P value was ≤ 0.05.
Table 2-1 List of primer sequences for real-time PCR
58
2.4 Results
2.4.1 Effect of recombinant hSAA1 on the expression of genes related to lipid metabolism in HepG2 cells
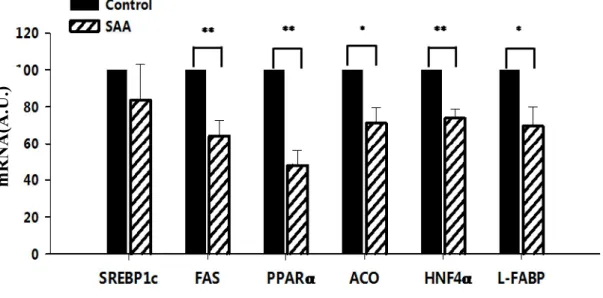
The microarray analysis as a preliminary screening tool allowed us to examine the effect of hSAA on overall gene expressions. Only one pooled sample from each treatment was used in the analysis, so the results were only used to pick up target genes for further analysis and confirmation. Results showed that 2 μM hSAA1 clearly affected the expression of genes related to lipid metabolism in HepG2 cells. Using qPCR, we confirmed that treatment with 2 μM hSAA1 for 72 h significantly decreased the mRNA concentrations (Fig. 2-1) approximately 30% for lipogenic gene, fatty acid synthase (FAS); 50% for peroxisome proliferator-activated receptorα (PPARα) and 30% for acyl-CoA oxidase (ACO), involved with fatty acid oxidation and 30% for hepatocyte nuclear factor 4α (HNFα) and liver fatty acid binding protein (L-FABP), which are genes involved with cytoplasmic fatty acid transport. Sterol regulatory element-binding protein lc (SREBP1c) was not affected by hSAA1 (Fig.
2-1).
Fig. 2-1 Effects of hSAA1 on the expression of lipid metabolism-associated genes. Quantification of lipid metabolism-associated genes by real-time PCR in HepG2 cells treated with 2 μM hSAA1 for 72 h. The mRNA concentrations of individual genes were determined by real-time PCR and normalized to β-actin. Data were expressed as means ± SEM (n = 3). *, P ≤ 0.05, **, P ≤0.01. (SREBP1c: Sterol regulatory element-binding protein lc; FAS: fatty acid synthase; PPARα: peroxisome proliferator-activated receptor α; ACO: acyl-CoA oxidase; HNFα: hepatocyte nuclear factor 4α; L-FABP: liver fatty acid binding protein)
mRNA(A.U.)
2.4.2 Effects of hSAA1 on human adipocytes
Treatment fully differentiated primary human preadipocytes with 1 μM hSAA1 protein 24 hr significantly increased the release of glycerol into the culture medium (Fig. 2-2A). Results indicate that recombinant hSAA1 increased lipolysis in these cells. hSAA1 treatment at 1 μM also promoted HSL mRNA expression (Fig. 2-2B).
The expression of perilipin mRNA was reduced about 60% by incubation with either 0.2 μM or 1 μM hSAA1 (Fig. 2-2C), suggesting that the lipolytic effect by incubation with hSAA1 may result from increased expression of HSL coupled with decreased expression of perilipin.
Treatment with hSAA1 also reduced in the expression of mRNA for the transcription factors PPARγ and PPARα mRNA by 30% and 50% (Fig. 2-2B &C).
The expression of lipogenesis-related genes LPL and FAS was decreased by either 0.2 μM or 1 μM hSAA1 treatment to approximately 50% for both LPL and FAS (Fig 2-2C).
In human adipocytes, the expression of IL-6 and tumor necrosis factorα (TNFα) were also increased by both 0.2 μM and 1 μM hSAA1 treatments for 24 h. The IL-6 mRNA was increased 4 to 8 folds (Fig. 2-2B) and the TNFα mRNA was increased 2 to 4 folds (Fig. 2-2B) compared to the control group.
Glycerol release nmole/ml
perilipin PPAR LPL FAS
0.0 0.3 0.6 0.9
1.2 Control
0.2 M hSAA1 1 M hSAA1
b
a a b
a a
b
a a
b
a a
C
mRNA (A.U.)
HSL PPAR IL-6 TNFa
0 1 2 3 4 5 6 7 109 1112
13 Control
0.2 M hSAA1 1 M hSAA1
b a a a ab
b
a b
b
a b
b
B
b
mRNA (A.U.)
Fig. 2-2 Human serum amyloid protein A 1 (hSAA1) promoted lipolysis and inhibited lipogenesis-related genes in primary human adipocytes.
Cell culture medium of human breast adipocytes were collected for glycerol cocentraion measurement (A). Quantification of lipolysi- (B) and inhibited lipogenesis-related (C) genes by real-time PCR in huamn breast preadipocytes treated with 0.2 μM or 1 μM hSAA1 for 24 h were conducted. The mRNA concentrations of individual genes were determined by real-time PCR and normalized to β-actin.
Lipolysis related genes were induced by hSAA1, include hormone sense lipase (HSL), peroxisome proliferator-activated receptorα(PPAR α), interleukin 6 (IL-6) and tumor necrosis factor α(TNFα) mRNA (B); lipogenesis related genes were inhibited by hSAA1 treatment, such as perilipin, peroxisome proliferator-activated receptor γ (PPARγ), lipoprotein lipase (LPL), fatty acid synthase (FAS) (C). Data are expressed as mean ± SEM, n=4 independent experiments. Different superscripts indicate a statistical significance (P<0.05).
2.4.3 Regulation of SAA mRNA by DHA in human adipocytes
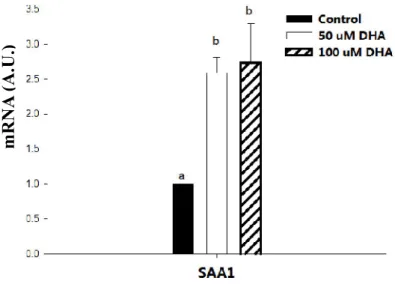
Both 50 μM or 100 μM DHA treatment increased SAA1 transcript abundance as compared with the control group (Fig. 3). The increments ranged from 2.5 to 2.7-fold.
Fig 2-3. The effect of DHA on the expression of SAA1 in primary human adipocytes. Quantification of mRNA level of SAA1 in human breast adipocytes under 0, 50 μM or 100 μM DHA treatment for 24 h was performed by real time PCR.
Results were normalized related to the β-actin mRNA concentration in the same sample. Results were expressed as means ± SEM (n=5). Different superscripts indicate a statistical significance (P<0.05).
mRNA (A.U.)
2.4.4 Effects of DHA on human adipocytes
Expression of TNFα mRNA was increased by DHA treatments (Fig. 2-4B).
The expression of the IL-6 mRNA was increased 6 and 10 times compared with the control group by 50 μM and 100 μM DHA, respectively (Fig. 2-4B). Treatment of human adipocytes with DHA increased the release of glycerol (Fig. 2-4A). Treatment of 100 μM DHA treatment doubled the expression of HSL mRNA but decreased perilipin mRNA to 60% (Fig. 2-5C). The PPARγ mRNA abundance was reduced by 50 μM or 100 μM DHA treatment (Fig. 2-4C). The expression of PPARα mRNA was also increased by DHA treatment (Fig. 2-4B). The FAS and LPL mRNAs were significantly decreased by DHA treatments (Fig. 2-4C).
Glycerol release nmole/ml
HSL PPAR IL-6 TNF
0 5 10
15 Control
50 M DHA
b
a a
a
b b
a
b b b b
b
ab
B
100 M DHA
mRNA (A.U.)
perilipin PPAR LPL FAS
0.0 0.2 0.4 0.6 0.8 1.0
1.2 Control
50 M DHA 100 M DHA
b
a
a b
b
a
c
b
a b
a a
C
mRNA (A.U.)
Fig. 2-4 DHA regulates SAA to promote lipolysis through down regulation of perilipin. in primary human adipocytes. Measure the glycerol conc. in the culture medium of human breast adipocyte treated with with 50μM and 100 μM DHA for 24h (A). Quantification of lipolysi-(B) and lipogenesis-related (C) genes in human breast adipocytes with 50μM and 100 μM DHA for 24h by real-time PCR. The mRNA concentrations of individual genes were determined by real-time PCR and normalized to β-actin.; lipolysis related genes were induced by DHA, include hormone sense lipase (HSL), peroxisome proliferator-activated receptorα (PPAR α), interleukin 6 (IL-6) and tumor necrosis factor α(TNFα) mRNA; lipogenesis related genes were inhibited by DHA treatment, such as perilipin, peroxisome proliferator-activated receptor γ (PPARγ), lipoprotein lipase (LPL), fatty acid synthase (FAS). Data are expressed as mean ± SEM, n=4 independent experiments. Different superscripts indicate a statistical significance (P<0.05).
2.5 Discussion
Before we found that. hepatic SAA mRNA is induced by dietary DHA in pigs 31, we wanted to know that whether human hepatic SAA is induced by DHA too.
Therefore, we chosen the human hepatocarcinoma cell line, HepG2 cell, to study the effect of human SAA on human hepatic gene expression. Hepatic SREBP1c and FAS are involved in lipogenesis 44,45 and SREBP1c up-regulates FAS expression 46. Expression of FAS is also regulated by PPARα because the addition of PPARα ligands was shown to FAS expression in wild type mice, but not in PPARα-/- mice 47. In our experiments, SAA down regulated the expression of PPARα which may then reduce FAS mRNA expression. The SAA treatment had no effect on SREBP1c transcription, suggesting that there is no role of this transcription factor in the SAA regulation of FAS. PPARα can regulate fatty acid oxidation by binding to the PPAR response element (PPRE) of the ACO promoter to increase the expression of ACO 48, a key enzyme in the β-oxidation of fatty acids in peroxisomes. We found that ACO expression was down-regulated by hSAA1 treatment, speculatively from the SAA-decreased PPARα. HNFα and L-FABP, two proteins that participate in lipid transport within the cytoplasm, were decreased by hSAA1 treatment. Thus, SAA1 may decrease the transportation of fatty acids in cytoplasm and consequently decrease the utilization of fatty acids in adipocytes. L-FABP is a target gene of PPARα which suggests that the fatty acid transport ability is affected by regulation of PPARα
49.
Since DHA has been shown to increase SAA1 expression in porcine liver 31 and hepatic cells 44 then we treated 50 and 100 μM DHA in human preadipocytes to study the gene expression patterns in contract to SAA effects. DHA increased expression of SAA, TNFα and IL-6, three genes considered as proinflammatory elements. However,
the DHA-induced SAA expression was about two folds in human adipocytes and four folds in porcine hepatocytes 44. These effects are much lower those is observed in inflammatory responses (15 to 250 times) in animal studies 50-52. When human monocytes were infected with bacteria, the concentrations of IL-6 and TNFα are increased to 30 and 80 times, respectively 53. And by murine cytomegalovirus infection, TNFα and IL-6 are increased to 150 and 1500 times, respectively 54. These are acute phase inflammatory responses. The lower SAA1, IL-6 and TNFα responses induced by DHA compared to true inflammatory responses may represent distinctive physiological responses. IL-6 has been shown to inhibit lipopolysacharide-induced TNFα production in both human monocytes and human monocytic line U937 55,56. Therefore, IL-6 is a likely anti-inflammatory cytokine that can stimulate the expression of other anti-inflammatory cytokines and factors, for example, IL-10, IL-1 receptor antagonist, soluable TNFα receptor and cortisol during acute inflammation in normal subjects 57-59. It has also been reported that the administration of recombinant IL-6 to IL-6-/- mice suppressed the expression of TNFα 60, suggesting an anti-inflammatory effect of IL-6. Other reports also indicate that DHA treatment decreases IL-2 and interferon gamma production (both are regarded as inflammation cytokines), whereas the production of IL-10 was increased in Jurkat T cells 61,62. Furthermore, the definition of inflammation should include several clinical signs;
such as the inflammation-related cytokine expressions, elevation of macrophage or polymorphonuclear leukocyte infiltration, increase of white blood cell accumulation, the increased expression of cyclooxygenase, eicosanoids, leukotrienes and reactive oxygen species. According to these signs, we cannot define whether DHA induces inflammation in the system, based only on the increased expression of IL-6 and TNFα.
The expression of PPARγ occurs primarily in adipocytes and PPARγ participates in the transcriptional activation of numerous adipogenic genes, including FAS, SREBP1c and LPL 63,64. We demonstrated that PPARα, FAS and LPL expressions were decreased by hSAA1 treatment in human adipocytes, indicating that SAA1 can reduce adipogenic and lipogenic activitiess and potentially decrease accumulation of triacylglycerol in adipocytes. Moreover, DHA increased the expression of SAA and decreased PPARα, LPL and FAS mRNA. Since, DHA and SAA treatments had similar effects on adipogenic and lipogenic genes in human adipocytes. The data suggest that the mechanism for the DHA effects may be through an increase in SAA.
The direct evidence for this hypothesis has not yet been shown.
The function of perilipin protein is to prevent untimely lipid mobilization and maintain the structure of lipid droplets. When energy is needed, the PKA-phosphorylated perilipin allows PKA-activated (phosphorylated) HSL to hydrolyze triacylglycerols and release free fatty acids and glycerol 65,66. There is no glycerol kinase to metabolize glycerol in adipocytes so glycerol is released into the circulation in vivo or into the culture medium in vitro. Hence, glycerol release is an indication of lipolysis. In the current study, both hSAA1 and DHA treatments increased the glycerol concentration in culture medium, indicating elevated lipolysis.
Because IL-6 increases the release of glycerol 67 and stimulates fatty acid oxidation 67,68 in human adipocytes, our finding that hSAA1 and DHA treatments increased the expression of IL-6 suggest that at least part of the effect was mediated by IL-6. In 3T3L1 adipocytes, TNFα down-regulates the expression of LPL and increases glycerol release 69,70. TNFα also can inhibit the activity of perilipin by phosphorylation though mitogen activated protein kinases 70 and activate PKA to phosphorylate perilipin 71 to promote lipolysis. The current study found that hSAA1
and DHA treatments increased the expression of TNFα so we speculate that hSAA1- and DHA-induced TNFα reduced the expression of perilipin. Moreover, perilipin expression can be stimulated by PPARγ to accumulate lipid 72. Our current study showed that both DHA and hSAA1 treatments reduced the expression of PPARα mRNA to potentially reduce expression of perilipin. The combined mechanisms to reduce perilipin and increase HSL expression coupled with accentuated phosphorylation potential may all work in concert to stimulate lipolysis.
DHA may inhibit or increase TNFα and IL-6 expression or concentration depending on the cell type or culture medium conditions. Dietary DHA-rich fish oil supplementation up-regulates serum IL-6 and TNFα concentrations in human leukocytes 73. Treatment with DHA increases the production of TNFα and IL-6 in macrophages 74. In contrast, 50 or 500 μM of DHA had no effect on TNFα in murine 3T3-L1 adipocytes 75. Furthermore, TNFα and IL-6 secretion by human mononuclear cells is inhibited by dietary fish-oil supplementation 76. In the current study, we demonstrated that DHA increased the expression of TNFα and IL-6. These increments may then modify the cellular function of human adipocytes.
The DHA treatment promotes PPARα mRNA expression 77,78. The PUFA are natural PPARα ligands, with simultaneous stimulation of fatty acid oxidation and inhibition of fatty acid synthesis 79. Incubation of human adipocytes with DHA increased the expression of PPARα whereas incubation with hSAA1 decreased the expression of PPARα so that the effects of DHA and SAA were opposite. Which regulatory mechanisms are associated with these divergent effects of DHA and SAA are not clear now. In liver cells (HepG2), SAA reduced both PPARα and ACO mRNAs suggesting inhibition of fatty acid oxidation.
Although conjugated linoleic acid (CLA) and DHA are different in the position
and number of double bonds, they have similar effects on alleviating obesity and the expression of lipid metabolism related genes 80. Microarray profiling of white adipose tissue (WAT) of mice fed trans-10, cis-12 CLA indicated that CLA reduced the expression of genes involved in lipogenesis and adipogenesis such as LPL, FAS, fatty acid binding protein 4 and PPARγ81. In the current study, DHA treatment also reduced LPL, FAS and PPARγ in human adipocytes and increased transcript levels for IL-6, TNFα. Similar to our findings, CLA reduces the expression of lipid synthesis genes, such as FAS,HSL, LPL 82, and perilipin 83. Moreover, CLA increases the gene expression of IL-6 in human adipose tissue 83. DHA treatment reduces body weight and energy intake in human subjects 21,84 and promotes gene expression of TNFα and reduces PPARγ. However, CLA has no effect on these genes and body weight in humans 83. Although there are similar effects between CLA and DHA on prevention or improvement of obesity, the role and function of different fatty acids can be very different.
In conclusion, we have demonstrated that DHA increases the expression of SAA1 in human adipocytes and that the effects of SAA1 and DHA on expression of the lipolytic genes, TNFα, IL-6, HSL and perilipin in human adipocytes are parallel.
In contrast, PPARγ, LPL, FAS mRNAs were decreased by the SAA1 and DHA treatments, suggesting that DHA and SAA1 also inhibit adipogenesis in human adipocytes. These results suggest that DHA may enhance lipolytic activity and decrease lipogenic and adipogenic activity by regulating the expression of SAA1.
Such DHA function will be useful for developing new approaches to reduce body fat deposition.
Chapter 3 Tetranectin promotes adipogenesis and lipogenesis and is negatively regulated by polyunsaturated fatty acids in human adipocytes
3.1 Aims of research plan
Docosahexanoic acid (DHA) increases lipolysis and decreases lipogenesis through several pathways. We discovered DHA may regulate the expression of tetranectin (TN) to affect lipid metabolism. The aim of this study is to demonstrate the relationship between DHA and TN has create opposite effects on increasing lipolysis and decrease lipogenesis.in human adipocytes. Second, study the gene function of TN in human adipocytes.
3.2 Introduction
Adipose tissues secrets factors, or adipocytokines, regulate body energy homeostasis.
To search for novel adipocytokines, we employed 2-D protein gel electropherosis and LC-MS/MS to analyze human primary adipocyte culture medium. We found that the mRNA expression of TN is positively correlated with the differentiation and lipid accumulation of human preadipocytes, as well as the body mass index. Overexpression and knockdown of TN in human primary adipocytes by lentivirus prove that TN increases the expression of adipogenic and lipogenic genes, such as peroxisome proliferator-activated receptor gamma, lipoprotein lipase fatty acid synthesis and fatty acid binding protein 4, but decreases those related to lipolysis, including peroxisome proliferator-activated receptor α, hormone sensitive lipase, interleukin 6, tumor necrosis
factor α and serum amyloid A along with altered profiles of proteins responsible primarily for lipid metabolism, as analyzed by quantitative proteomic analysis and quantitative real-time PCR. Taken together, our data suggest that not only TN potentially serves as a novel adipocytokine contributing to the regulation of energy homeostasis and lipid metabolism, but also components of the TN-associated signaling pathways the therapeutic targets for treating obesity and associated metabolic diseases.
3.3 Material and methods
3.3.1 Human adipose tissue
Adipose tissues were obtained from the breast of 8 women undergoing mastectomy.
The subjects were 33-51 yr of age (mean = 43.6, SD = 6.18) with a BMI of 16-29 kg/m2 (mean = 21.5, SD = 4.50). All participants gave permission in writing and the study was approved by the Ethics Committee of National Taiwan University Hospital.
3.3.2 Protein separation by 2D-PAGE
Proteins were separated using first dimension by IEF, using immobilized pH gradient strips of 13 cm, with a linear pH range of 4-7. A total of 150 mg of total protein was dissolved in 250 μl of rehydration buffer containing 8 M urea, 2.5 M thiourea, 2% IPG Buffer or 0.5% ampholytes (pH 4-7, Sigma), 2%
CHAPS, 0.5 or 0.002% bromophenol blue and 100 mM DTT prior to the application on to the IPG strips. IPG strips were actively rehydrated at 50 V for 12 hr and subjected to 100 V for 2 hr, 500 V for 1 hr, 1,000 V for 2 hr and 8,000 V for 4 hr to achieve 40,000 volt-hr at a temperature maintained at 20℃.
Upon completion of IEF, IPG strips were equilibrated in a buffer containing 6
M urea, 30% glycerol, 2% SDS, 50 mM Tris (pH 8.8) reduced with 100 mM DTT and 0.003% bromophenol blue for 15 min. Equilibrated IPG strips were subsequently applied to 10% resolving SDS-PAGE gels. Protein was separated using a Hoefer SE 600 system (GE Health Care/Amersham Biosciences, Piscataway, NJ) with 60 mA for 4–5 hr until the end of the run (Narayanan et al., 2006).
3.3.3 MALDI-TOF analysis and identification of protein
The protein spots from 2D gels stained with zinc stain were used for trypsin digestion and to carry out theMALDI-TOF analysis. MS analysis was carried out in collaboration with PerkinElmer (Boston, MA). The protein spots of interest based on molecular weight and pH range were excised from 2D PAGE gels and were subjected to in-gel digestion as per the manufacturer’s protocol (PerkinElmer, Boston, MA). The samples were allowed to air-dry and then analyzed on the prOTOF 2000 and Orthogonal MALDI- TOF instrument using TOFWorks software (PerkinElmer/SCIEX, Concord, ON, Canada). The peaks were picked using the MoverZ peak-picking algorithm. The peak lists generated were submitted through TOFworks to the PROFOUND search engine. Proteins were identified by searching in the publicly available database NCBInr/ SWISS-PROT using the ProFound software. Accuracy of peptide mass measurements averaged approximately 5 ppm, resulting in high confidence protein identifications matching the estimated Mr and pI values obtained from image analysis (Narayanan et al., 2006).
3.3.4 Isolation of human stromal/vascular (S/V) cells and differentiation The tissue was dissected under sterile conditions and immediately transferred to sterile transport buffer (0.9% NaCl, 56 mM glucose, 25 mM HEPES, penicillin 100 U/mL, streptomycin 100 μg/mL, pH = 7.4) for transportation to the laboratory. Transfer to the laboratory took approximately 30 to 35 minutes and the tissue was maintained at 37 ºC. The tissue was minced into small pieces and 13 g tissue was digested with 6000 unit collagenase (C6885, collagenase from clostridium histolyticum, type II, Sigma-Aldrich, St. Louis, MI) in 15 ml KRBG buffer (121 mM NaCl, 4.85 mM KCl, 1.2 mM KH2PO4, 1.2 mM MgSO4, 25 mM NaHCO3, 30 mM glucose, 1.25 mM CaCl2, penicillin 100 U/mL, streptomycin 100 μg/mL) at 37ºC for 50 minutes. The released stromal/vascular (S/V) cells or preadipocytes were centrifuged at 800 g for 10 minutes at room temperature. The S/V cells were washed 3 times with DMEM/F12 medium followed by centrifugation. The cells were plated in DMEM/F12 with 10% fetal bovine serum at a density of 8 × 10⁴ cell/cm2 (Liu et al., 2005).
3.3.5 Proteomic analysis by LC-MS-MS and Data Processing and Analysis Protein pellet was resuspended in 125 mM ABC. The suspension was first thermally denatured at 90 °C for 20 min, cooled on ice, and diluted by adding 100% methanol to produce a sample solution containing 60% (v/v) methanol.
The final concentration of protein solution was 0.5 μg/μl. Tryptic digestion was performed at 37 °C for 5 h (protein: trypsin= 30:1, g/g). The suspension was
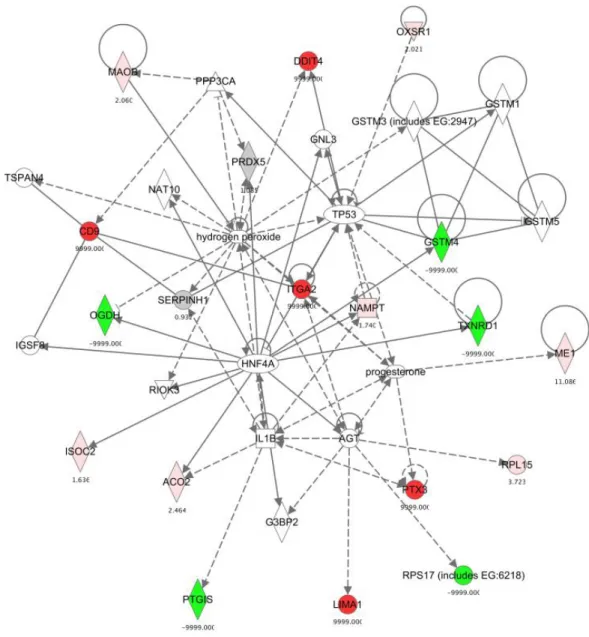
saved, and the remainingpellet was subjected to digestion with trypsin (protein:trypsin= 50:1,g/g) for another 5 h. The supernatants of these two digestions were combined and concentrated by SpeedVac. Protein samples were reconstituted in 6 μl of elution buffer A (0.1% (v/v) FA in H2O) and analyzed by μLC-MS/MS. Protein identification which is the data fromμLC-MS/MS was proceeded by Ingenuity Pathway Analysis database (IPA) (Ingenuity System Inc, USA). IPA was used to interpret the human adipocytes protein data in the context of biological processes, pathways and networks.
3.3.6 Plasmid constructions for TN overexpressed and knockdown virus To construct the TN overexpression plasmid pSIN-TN, full-length human TN cDNA was amplified by reverse transcription (RT)-PCR from human adipocytes cDNA and cloned into the pSIN-α plasmid. TN knockdown plasmid pLKO.1-puro-hTN and pLKO.1-puro-null was from National RNAi core facility of Taiwan Academia Sinica (TRCN0000062475, TRCN0000119435) for producing knockdown human TN and control virus separately.
3.3.7 Treatment of human primary adipocytes with DHA
When the S/V cells were approximately confluent, medium was removed and replaced with serum-free, hormone-supplemented differentiation medium.
At the 13th day, the cells were differentiated. The cells then were treated with only DMEM/F12 for 24 h, then treated with DHA for 24h. The culture medium
was collected to determine the glycerol concentration and RNA was extracted from the cells.
3.3.8 Quantitative real-time PCR (qPCR) analysis
For qPCR, 5 μg RNA was digested with DNase I (Epicentre, Madison, WI) and then three μg RNA were reverse transcribed into cDNA using a High Capacity cDNA Reverse Transcription Kit (Applied Biosystems, Foster City, CA) which uses the random primer scheme for initiating cDNA synthesis. The cDNA for various genes was amplified using the DyNAmo Flash SYBR Green Kit (Finnzymes, Espoo, Finland) with paired sense and antisense primers designed from human gene sequences. The primer pairs and optimized annealing temperature for individual genes were listed in Supplemental Table 1. The conditions for PCR were denature at 95ºC for 10 s (7 min in the first cycle), annealing at the optimized annealing temperature for 15 s, and extension at 74ºC for 5 s. The qPCR reaction was carried out for 40 cycles. Melting curve analysis was routinely performed by increasing the temperature from 55 to 95 ºC, and detecting signals every 0.5 ºC. The mRNA concentration of each gene was normalized to the β-actin mRNA concentration in the same sample.
Amplification of specific transcripts was further confirmed by melting curve profile analysis and agarose gel electrophoresis. Primer efficiency was calculated using the formula [10 (-1/slope)]-1 (Pfaffl, 2001). Threshold cycle (Ct) values were obtained and relative gene expression ratio was calculated using the formula (1+Efficiency of target gene) △Ct of target (β-actin – target gene) /(1+Efficiency of β-actin) △Ct of β-actin (β-actin – target gene) (Pfaffl, 2001). The cDNA for various genes was amplified using the DyNAmo Flash SYBR Green Kit (Finnzymes, Espoo, Finland) with paired sense and antisense primers designed from human gene sequences.
3.3.9 Animals and diets
Male C57BL/6 mice (4 weeks of age) were purchased from the National Taiwan University Animal Center and the animal protocol was approved by the Animal Care and Use Committee of National Taiwan University. Mice were divided into three groups. HFD group of mice is fed with HFD (35.5% of fat, Bioserve #F3282, Frenchtown, NJ, USA) for 18 weeks to induce the obesity. Body weight was measured every week and blood samples were collected every month. DHA group mice were fed with HFD diet for 16 weeks and had 1% DHA oil for 2 weeks. The chow group mice were fed regular chow (RC, 4.5% of fat, Labdiet #5001, St Louis, MO, USA) (n = 5 in each group). At the end of the experiment, mice were sacrificed by exposure to carbon dioxide and the liver, gonadal white adipose tissues and blood samples (from the cheek) were collected. Portions of white adipose tissues were fixed in formalin for immune histochemical staining and other portions were snap-frozen in liquid nitrogen and stored at -80 oC for future analysis.
3.3.10 Statistical analysis
For each replicate, the control value for a variable was set to one with other variables expressed relative to the control. Homogeneity of the variance was determined and the treatment effects were analyzed using ANOVA to determine the effects at different concentrations. Tukey’s test was used to evaluate differences among means (SAS Inst. Inc., Cary, NC). A significant difference indicates that the P value was ≤ 0.05.
3.4 Result
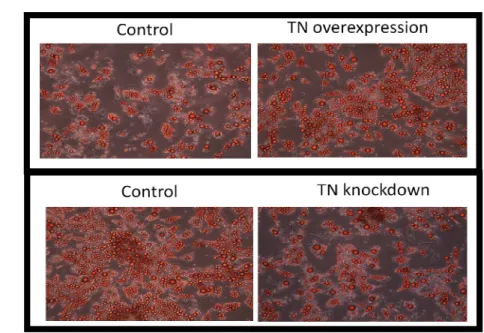
3.4.1 TN is secreted from human adipocytes and expressed in the adipose tissues of the mice.
To identify protein factors secreted from adipocytes, we analyzed the culture medium of human primary adipocytes by 2-D PAGE. As expected, there is at least 80 spots found on the gels (Fig. 3-1), among which three prominent ones are further characterized by mass spectrometry (LC-MS/MS) and found to be TN (with pI = 5.3 and, M.W. = 22 kDa, Fig. 3-1), retinal binding protein 4 (RBP4) and cysteine sulfinic acid decarboxylase (data not indicated), respectively. We later confirmed that they are indeed expressed in adipocytes and were previouly considered to be serum proteins 85,86 with RBP4 defined as an adipocytokine, which regulates insulin signaling pathways and plays a role in the development of insulin resistance 87. Interestingly, TN was a novel scecretory protein identified in the adipocyte culture medium in the current study.
B A
Fig 3-1 Tetranectin (TN) was a secreted cytokine from adipocytes. Culture medium from with primary human adipocytes (A) and without adipocytes (B) which was isolated from breast tissue and was analyzed by two-dimensional polyacrylamide gel-electrophoresis of proteins in culture medium of human primary adipocytes.
Proteins were visualized by Zinc Staining and characterized by MALDI-TOF analysis.
The red circle indicates TN with pI = 5.5 and Mr. = 22 kDa, respectively.