行政院國家科學委員會專題研究計畫 期末報告
動脈內血流流動與心血管疾病關係之數值研究 - 以先天性 肺動脈疾病與冠狀動脈粥樣硬化為例
計 畫 類 別 : 個別型
計 畫 編 號 : NSC 100-2221-E-011-163-
執 行 期 間 : 100 年 08 月 01 日至 101 年 09 月 30 日 執 行 單 位 : 國立臺灣科技大學機械工程系
計 畫 主 持 人 : 陳明志 共 同 主 持 人 : 吳銘庭
計畫參與人員: 碩士班研究生-兼任助理人員:徐徫城 博士班研究生-兼任助理人員:Syamsuri
報 告 附 件 : 出席國際會議研究心得報告及發表論文
公 開 資 訊 : 本計畫可公開查詢
中 華 民 國 101 年 11 月 02 日
中 文 摘 要 : 肺動脈倒流, 法洛式四重症, 分歧角, 肺動脈, 醫學影像 中文關鍵詞: 肺動脈血液倒流是一種法洛式四重症手術後常見的現象,而
且臨床上發現通常左邊的肺動脈的倒流量比右邊來得多。這 與肺動脈內的血液流動方式有很大的關係。因此瞭解血液的 流動為探討此一術後後遺症的必要工作。本研究首先利用磁 振造影取得法洛式四重症術後病患之肺動脈影像,之後利用 此影像建立三維電腦外形檔,進一步產生網格,最後再以計 算流體力學的技術進行肺動脈內部血液流動的模擬。 計算 結果顯示血液流動受到分岐角角度與動脈外形影響。 而且在 一個心跳週期內倒流現象通常先發生在左肺動脈,本數值模 式並計算主肺脈、右肺動脈、及左肺動脈之倒流率。此結果 並與臨床量測結果相比,有良好之一致性。
英 文 摘 要 : Pulmonary regurgitation (PR) is a common phenomenon in pulmonary arteries in patients after
repair of tetralogy of Fallot (TOF). The
regurgitation fraction of left pulmonary artery (LPA) is
usually greater than right pulmonary artery (RPA) according to clinic data. It may be related to blood flow in pulmonary arteries. Therefore,
understanding hemodynamics in pulmonary arteries helps to comprehend the reason. The aim of this study is to use 3-D reconstructed pulmonary artery
models from magnetic resonance imaging (MRI) and to use numerical approaches for simulation
of flow variations in pulmonary arteries after repair of TOF.
From the numerical results, the blood flow is influence by the bifurcation angles and geometry
of pulmonary artery. The regurgitation happens first in LPA after repair of TOF due to the
small angle between LPA and main pulmonary artery (MPA).
Numerical data including regurgitation in MPA, LPA and RPA are compared with phase contrast
MR measured data. Good agreements are found between numerical results and measured data.
英文關鍵詞: pulmonary regurgitation, tetralogy of Fallot,
bifurcation angle, pulmonary artery, medical images
!"#$%&'()*+,-./0123456
789:;;7<=:>?@ABCDE/0!F!GHIJK78?@<LM 78NOPQRS
12TUVWXUY12!!!Z[\Y12 12]^VNSC 100_```a_b_caa_ade_
f!ghV!!!accijkalmacainkeal
f!opqrsV$tuv&wx'oyz{r
12|}~V•€•
‚ƒ|}~V„…†
12‡<~)Vˆ‰Š‹Syamsuri
3456TYŒ•Ž••‘’“”‘•–—VW˜™56!!Zš[56
›12œ•–3456•‹žŸ•–G ¡$=¢56V Z£$•¡¤¥/¦=¢56
Z£x§¨©¡¤¥/¦=¢56 W¡ª$«'¬*-=¢56 Z$«\®/012$•/056
¯°±²Vœ³>12q ³´µ¶•‹¢t·¸¹º»
!!!!!!!!!!!!Z¼q-½¥¾¿ÀÁÂÃÄ‹ZÅiZÆiÇȸ¹º»
É!!!Ê!!!Ë!!!$!acai!ackecl
ÌÍÅ
Nomenclatures
Latin Symbols
˙
m : mass flow rate, kg· s−1
P : pressure, Pa
Qb : backward blood flow volume in a cardiac cycle, m3 Qf : forward blood flow volume in a cardiac cycle, m3
RF : regurgitation fraction
t : time, s
u : velocity vector, m · s−1
Greek Symbols
θ : bifurcation angle,degree
µ : viscosity, kg· m−1· s−1
ν : kinematic viscosity, m2· s−1
ρ : density, kg·m−3
1 INTRODUCTION
Tetralogy of Fallot (TOF) is the most common congenital heart disease, accounting for 10% of all common congenital heart diseases. TOF is composed of (1) ventricular septal defect, (2) pulmonary stenosis, (3) right ventricular hypertrophy and (4) overriding aorta. Surgerical correction is the funda- mental treatment. However, the surgical reconstruction of TOF usually complicates with pulmonary regurgitation (PR) phenomena. PR is caused by incomplete close and deformity of the pulmonary valve after surgical reconstruction of the right ventricular outflow track in repaired ToF. It causes complex blood flow in pulmonary arteries, which is related to right ventricular dysfunction. Phase Contrast Magnetic Resonance (PC-MR) technology is an established non-invasive technique to estimate blood flow in the vessels and has been used to investigate the PR phenomena in repaired TOF patients.
According to Kang et al.’s [2] PC-MR measurements of of repaired TOF, it was found the regurgitation fraction (RF, i.e. backward flow volume / forward flow volume) of PR in left pulmonary artery (LPA) is higher than right pulmonary artery (RPA) in repaired TOF. The reason causing this discrepancy of RF is still not clear. We hypothesize that the surgically created structure-fluid dynamical interaction is one of possible reasons. In this study, we utilize numerical modeling to investigate the relation between the structure, fluid dynamic and PR in repaired TOF.
Ho et al. [1] reported that many complications in 21 TOF patients after surgery according to their cardiac MR measurements, e.g. severe pulmonay regurgitation (PR), right ventricular dilatation, right ventricular outflow obstruction, ventricular septal defect patch leakage and arrhythmias. Kang et al. [2] disscussed the difference of PR between left and right pulmonary arteries from PC-MRI measurements for 22 patients after repaired TOF surgery. They found that the regurgitant fraction in LPA is greater than that in RPA and MPA in most of repaired TOF patients. Meanwhile, Kang et al.
[2] also indicated that the relationship between the regurgitant fraction and fraction of regurgitant flow duration in MPA and RPA is linear. Wu et al. [3] investigated the effect of pulmonary regurgitation
on perfusion of the lungs in 43 patients after repair TOF using PC-MRI. They calculated forward flow volume, backward flow volume, net flow volume and regurgitation fraction in the left and right pulmonary arteries. Comparsion of the perfusion between the left lung (L%) (L%=left lung/left + right lung) was provided in their PC-MRI measurements. In terms of the comparsion, they also found that the PR phnomenon of LPA is higher than RPA in repaired TOF patients.
Helbing et al. [4] explored the abnormalities in right ventricular (RV) diastolic function with 19 children after repair of TOF and 12 healthy volunteers by PC-MR technique. They found that right ventricular end-diastolic volume (RV EDV) of repaired TOF patients is larger than a healthy person’s.
Furthermore, it was revealed that right ventricular ejection fraction of repaired TOF is lower than healthy children. Frigiola et al. [5] demonstrated that RV systolic function in 124 patients with surgically treated TOF is affected by PR. In all patients, right ventricular systolic function of repaired TOF patients is poorer than healthy children. RV isovolumic acceleration is inversely proportional to PR in Friginla et al.’s results. van den Berg et al. [6] indicated that some risk factors including RV abnormal dilation, long QRS duration and severe PR are associated with RV dysfunction in terms of PC-MRI measurements and electrocardiogram (ECG) of 59 patients after repair of TOF. Grothoff et al. [7] described that PR is an important factor influencing prolongation of QRS duriation in ECG measurements for 67 patients after repair of TOF. They indicated that PR phenomena usually accompany QRS prolongation.
Pulmonary valve replacement (PVR) has been shown to improve ventricular function, stabilize QRS duration, and reduce atrial and ventricular arrhythmias in the foloowing studies. For instance, Vliegen et al. [8] confirmed that PVR can reduce regurgitation and shunting defects in 26 patients after repair TOF using MRI. Their results showed that the mean preoperative PR was 46±10%. 80% patients had no residual PR after PVR. They also found that right ventricular end-diastolic volume decreased from 305±87 to 210±62 mL and RV end-systolic volume also decreased from 181±67 to 121±58 mL. van
Huysduynen et al. [9] showed that PVR can reduce QRS duration from 150 to 140 ms according to their cardiac MR and ECG measurements for 26 patients after repair of TOF. Sung et al. [10] used particle flow visualization experiment to investigate the effects of varing degree of pulmonary valvular stenosis in transparent glass models. Porcine pulmonary arteries and valve were considered to fabricate those glass models. Dilatation existed in MPA and LPA of the galss models. They found that significant secondary flows appear in MPA due to its dilatation. They also observed that strength of the secondary flows in the LPA and RPA increased as the degree of valvular stenosis increased. Their results proved that the geometry of MPA with dilatation and pulmonary valvular stenosis have remarkable effects on the pulmonary artery hemodynamics.
The variation of blood flow with pulmonary regurgitation in pulmonary arteries is an important factor for evaluation of TOF defects. Computational fluid dynamics (CFD) is a useful and non-invasive method to calculate blood flow in arteries. In recent years, CFD is commonly applied to simulate cardiovascular complex flow. It provides numerical solutions for accurate assessment of congenital heart disease treatments. In addition, applications of CFD on simulations of blood flow in pulmonary arteries can be found in several technical papers. For example, Tang et al. [11] used CFD to compare flow phenomena of two various pulmonary artery models with spiral and Lecompte (nonspiral) which are usually used in arterial switch operation. They explained that the spiral method is better than the Lecompte method in terms of numerical results which reveals that the spiral method has more uniform velocity distribution, wall shear stress and less power loss ratio than the Lecompte model. Corno et al.
[12] compared two different pulmonary artery models, circular and elliptical models, of distal conduit anastomosis by CFD. Their study proved that the anastomosis cross-sectional area has a great impact on blood flow distribution in pulmonary artery. They suggested that the elliptical anastomosis may be useful to improve the morbidity and degree of distal stenosis at clinical applications. Chern et al. [13]
established in vitro pulmonary artery models after repair of TOF and observed the flow patterns with
varing PR in pulmonary ateries after repair of TOF patients by CFD simulations. They also confirmed that the PR fraction in LPA is higher than in RPA and in LPA. Also, they found that vortices move toward the pulmonary valve during regurgitation in numerical results. The vortex motion may damage the pulmonary valve.
Recently, many studies applied medical images to reconstruct 3-D arterial peripheral models for undertaking accurate CFD simulations. Redaelli et al. [14] detailed reconstruction of 3D vascular numerical models from magnetic resonance images and performed CFD simulations using the recon- structed vascular models. Moreover, Tang et al. [15] combined MRI and CFD to analyze bllod flow in normal pulmonary arteries under resting and exercise states. They reported wall shear stress (WSS), oscillatory shear index (OSI), and the variation of energy efficientcy due to exercise in pulmonary ar- teries. They found the low mean WSS regions in the distal pulmonaary arteries no matter in rest or exercise conditions. High OSI values occurred in those low mean WSS regions and branching locations where swirling fow and separation flow were observed. They discoverd the energy efficiency average decrease of 10 % between rest and exercise conditions. They concluded that this approach is useful for investigation of the disease development and applications of surgical planning. Das et al. [16] calculated the total energy of the MPA to assess the RV performance between after repaired TOF and normal pulmonary arteries using MRI and CFD. Their results indicated that the repaired TOF RV has lower stroke work than the normal one. They also computed the net energy transferred at the MPA that normal case has higher net energy than repaired TOF case.
CFD has been applied to surgical planning for pulmonary arteries as well (see [17] -[18]). For example, Hsia et al. [19] studied that the influence of various inferior vena cavas connected to pulmonary arteries on blood flow using CFD simulations. They considered four basic TCPC geometries which were reconstructed from angiographic measurements. They demonstrated that the anastomosis in which extracardiac conduit is connected with left pulmonary artery has the lowest energy loss among four
various TCPC cases. They also compared energy dissipation in five graft extracardic conduits with various diameters (10∼30 mm) by CFD. They found that the least energy dissipation occurs in the conduit of diameter 20 mm. They confirmed that the geometry of the surgically created pathway in the TCPC is very important in terms of energy dissipation. Sun et al. [20] investigated the influence of antegrade pulmonary blood flow on bidirectional cavopulmonary anastomosis using CFD. They considered four mean flow rates (0.5 L/min, 1 L/min, 1.5 L/min and 2 L/min) of MPA. They found the flow raio of LPA/RPA increased when the amount of antegrade pulmonary blood flow increased.
Increasing antegrade pulmonary blood flow may cause significant different blood flows to two lungs.
They also observed that blood flow into LPA from MPA is larger than into RPA because the angle between MPA-LPA is larger than between MPA and RPA.
Furthermore, Pekkan et al. [21] showed that the flow patterns at the normal fetal aortic arch and pulmonary artery, which were obtained by CFD and in vitro experiment methods were similar to each other. They found the swirling flow at the pulmonary artery during the deceleration phase of a cardiac cycle both in the numerical results and in the experimental flow visualization. Wang et al. [22] utilized CFD technique and flow visualization experiments to compare two types of TCPC including intra-atrial connection and extra-cardiac inferior vena cava (IVC)-to-MPA connection. Their results showed that more complex unsteady flow structures occurs in intra-atrial connection model in experimental and computational results.
According to those studies mentioned above, we know the PR always happens in a repaierd TOF patient and the blood flow in LPA is less than in RPA from MRI statistical analysis. It is found that the blood flow distribution highly depends on the geomety of vascular vessels. Nevertheless, variation of blood flow in real pulmonary arteries after repair of TOF is not clear. Meanwhile, numerical prediction on blood flow becomes popular in investigating the relationship between hemodynamics and cardiovascular diseases as mentioned in previous paragraphes. Hence, the aim of this study is to
observe the blood flow distribution and to discuss the effect of geometry on PR in pulmonary arteries by CFD simulation coupled with 3D reconstructed MRI pulmonary artery models. Futhermore, to find the reason to cause higher PR in LPA than in RPA, numerical simulations are performed to provide distribution of pressure, mass flow rate, regurgitation fraction and blood flow streamlines in pulmonary arteries after repair of TOF.
2 MATHEMATICAL FORMULAE AND NUMERICAL MODEL
In this study, the branching pulmonary artery geometry obtained by MRI is utilized to establish a numerical model in computational fluid dynamics. The pulmonary artery is a Y shape bifurcate vessel including LPA and RPA. Various pulmonary arteries after repair of TOF are measured by MRI and considered to observe regurgitation phenomena. First of all, MRI measurements of pulmonary arteries after repair of TOF are reconstructed as CAD models. Subsequently, mesh generation is undertaken in those reconstructed CAD models. Blood flows are then simulated using a flow solver in those numerical models of pulmonary arteries. Details are demonstrated in the following sections.
2.1 MRI and Grid Generation
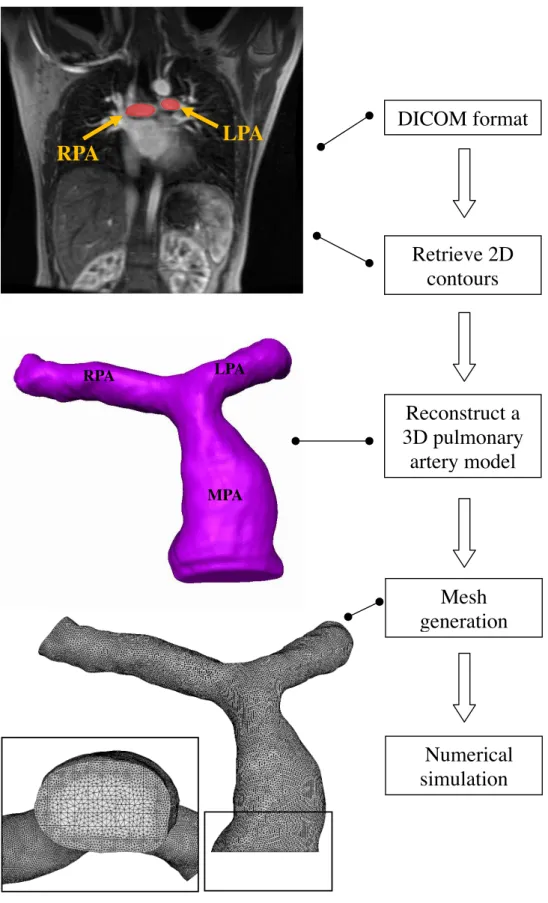
In order to establish a realistic 3-D numerical model of pulmoary artery, MRI measurements are utilized to obtain peropheries of pulmonary arteries after repair of TOF and a healthy person. Regions of the branching pulmonary arteries are remarked in slice planes of MR images based on DICOM format.
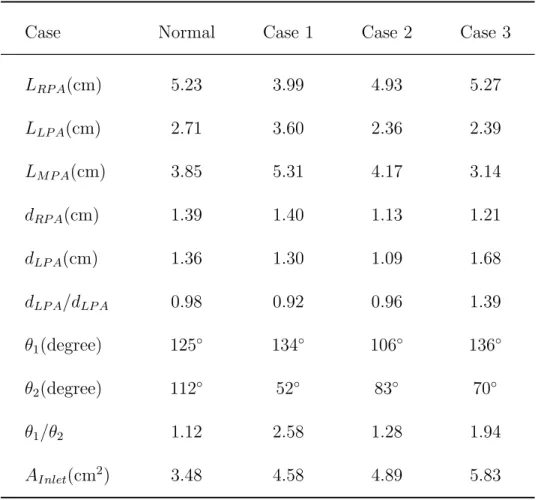
Every slice thickness of Cases 1-3 were 3.6 mm, 4.4 mm and 4.4 mm, respectively. The normal one was 4 mm. Those 2-D remarked regions are connected together be a complete 3-D CAD pulmonary artery model. Thoes features of four pulmonary models are listed in Table 1. We found that the MPA dilation phenomenon and an acute angle between LPA and MPA appear in all reconstructed CAD models of pulmonary arteries after repair of TOF.
Subsequently, computational grids are generated inside those reconstructed CAD models using ICEM-CFDTM software. Since peripheries of the pulmonary arteries are too complicated to generate structured grids, unstructured grids are used in the numerical models. Fig. 1 presents the procedure to reconstruct CAD models from MRI measurements and mesh generation.
2.2 Governing Equations
Blood flow obeies mass and momentum conservation. In this study, few assumptions are used to simplify equations for mass and momentum conservation. Mathematical formulae of mass and momentum are denoted as
Continuity equation:
∇ · u= 0 , (1)
and momentum equation (Navier-Stokes equation)
∂u
∂t + ∇ · (uu) = −1
ρ∇P + ∇ · (ν∇u) , (2)
where u represents a velocity vector of flow, P is pressure, t is time, ρ is density of blood, and ν is kinematic viscosity of blood. The density of blood, ρ, is set as 1060 kg·m−3. The dynamic viscosity (µ) of blood is set a constant as 0.004 kg·m−1·s−1. Although blood is non-Newtonian, viscosity of blood varies with respect to shear rate and vessel diameter. Given that shear rate is greater than 100 s−1, the blood viscosity can be regarded as a constant like a Newtonian fluid in accordance with Pedley et al. [23] and Berger et al. [24]. Because a pulmonary artery is a large vessel, the non-Newtonain effect is not strong. Hence, blood in pulmoary artery is considered as Newtonian fluid for simplify equations.
According to Singh et al. [25], the wall of vessles is regarded as a rigid tube. That is, compliance of pulmonary artery is not considered.
2.3 Boundary Conditions
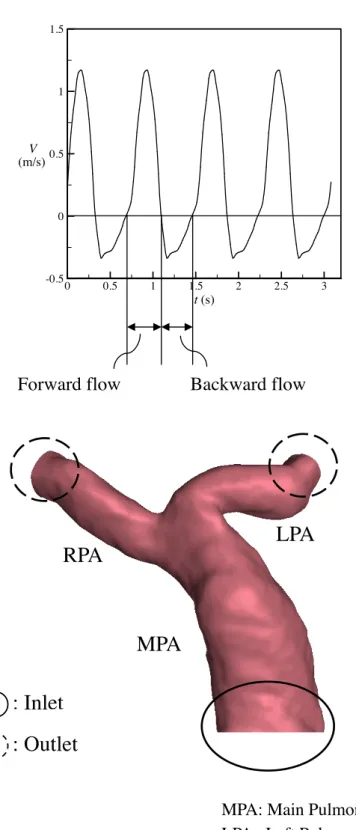
Regurgitation occurs in the pulsatile blood flow of pulmonary arteries after repair of TOF. Regurgitation fraction, RF, is defined as the ratio of backward blood volume to forward blood volume in a cardiac cycle. A health person’s RF is usually without regurgitation or very low. High RF indicates that abnormal blood flow behavior occurs in pulmonary arteries. That is, low RF means that most blood flows into lungs to exchange oxygen. RF is defin as
RF = Backward volume in a cardiac cycle, Qb
Forward volume in a cardiac cycle, Qf , (3) where Qb and Qf refer to backward and forward blood flow volume in a cardiac cycle, respectively.
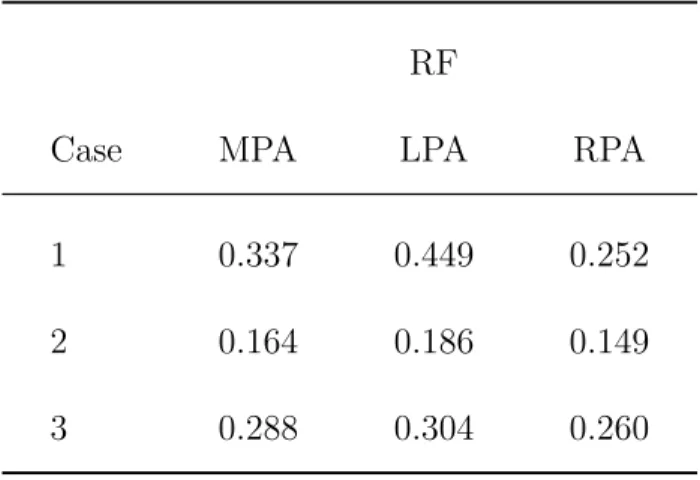
To solve those equations, appropriate boundary conditions are required. Fig. 2 shows boundary conditions used in the proposed numerical model. Blood flow velocity profiles of individual patients were measured by phase contract MRI at the inlet boundary of the MPA entrance. The PC-MR image matrix was 256 pixels×256 pixels. The image voxel size of Cases 1-3 were 0.141×0.141, 0.078×0.078 and 0.082×0.082, repectively. The normal case was 0.0625×0.0625. The measured non-uniform flow is provided for the inlet condition. The interpolation method is used to map the inlet velocity profile to inlet grid points. Also, RF of Cases 1-3 are 0.337, 0.164, and 0.288 as shown in Table 2, repectively.
The atmospheric pressure is imposed at the exits of the RPA and LPA as the outlet boundary condition. The vessel wall is regarded as a rigid object. Non-slip boundary conditions are imposed in vessel wall. That is, velocity is zero in the wall. For the initial conditions of the pulmonary artery, velocity is set as zero.
2.4 Parameters Setting
The software, CFD-ACE+, based on a finit volume method that is used to calculate the blood flow in a pulmonary artery. The finite volume method has been applied to solving the Navier-Stokes equations in many engineering applications. For example, Georgioa and Ioannis [27] used the finite volume method
in computation of radiative heat transfer. Kabinejadian and Ghista [28] employed the method to solve the Navier Stokes equations for simulations of blood flow in a coronary arterial bypass graft. Details of the finite volume method for solving the Navier-Stokes equations can be found in Versteeg and Malalasekera [26]. Computational grids mentioned in Sec. 2.1 are utilized to discretize the Navier- Stokes equations. As a result, a set of simultaneous algebraic equations for velocity and pressure are obtained and solved implicitly. To observe complex blood flow patterns in pulmonary artery, transient simulations are undertaken. The second order Crank Nicholson scheme is employed to undertake the time marching procedure. The time step size range from 0.01 to 0.015 s. Four cardiac cycles are conducted in each numerical simulation. The total simulation time is different in each case because of the duration of a cardic cycle is different in each person. The mass residual tolerance for numerical solutions is set to 10−4 at each time step. The SIMPLEC scheme proposed by van Doormal and Raithby [29] is used to obtain pressure solutions. The Window-based PC cluster is utilized to perform numerical simulations in this study. The average total calculation time for each case is about 1∼2 months.
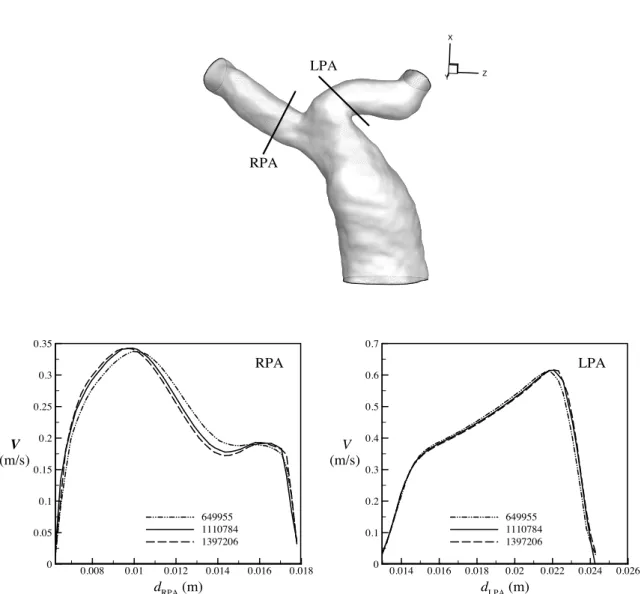
2.5 Grid Independence
To ensure that the numerical solutions do not vary with the grids, the grid-independence tests must be performed. For example, Fig. 3 shows that the velocity profiles obtained by various computational cells are close to each other in Case 1 when the number of the cells exceeds 1110784. Therefore, we adopt 1110784 cells to conduct the following numerical simulations in Case 1. Moreover, we chose the 1168920 and 1035407 cells for Cases 2 and 3 according to results of grid independence tests, respectively.
1079490 cells are used in the healthy case.
3 RESULTS AND DISCUSSION
3.1 Influences of Bifurcation Angles and Geometry of Pulmonary Artery on Blood Flow
Pulmonary regurgitation is a common phenomenon in patients after repair of TOF, but its effect on pulmonary arteries is not clear. The established numerical pulmonary artery models include one health and three pulmonary arteries after repair of TOF. Table 1 shows that Cases 1-3 have smaller angles between LPA and MPA than a healthy one. θ2 indicating the angle between LPA and MPA are 52◦, 83◦ and 70◦ in Cases 1-3, respectively. Nevertheless, θ2 in a normal pulmonary branch is 112◦. On the other hand, angles between RPA and MPA in Cases 1-3 are larger than the normal one. θ1 indicating the angle between RPA and MPA in Cases 1-3 are 134◦, 106◦ and 136◦, respectively. The angle of the normal one is 125◦.
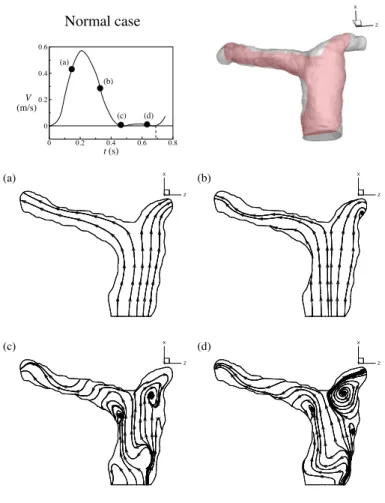
Fig. 4 desctibes streamlines of the healthy case in a central vertical sectional plane within a cardiac cycle. There is no regurgitation in healthy pulmonary arteries. Fig. 4 (a) shows the flow pattern in the acceleration of systole. A smooth forward flow pattern is found in this stage. Subsequently, two recirculations occur in LPA and RPA due to the deceleration of the forward flow in Fig. 4 (b). Those two vortices grow and stay in entrances of LPA and RPA in diastole of a cardiac cycle as shown in Figs.
4 (c) and (d).
Since vortices are found in MPA of Cases 1-3 in regurgitation, it is interesting to investigate the flow structure in specified cross sections. Fig. 5 shows flow patterns of the healthy one and Cases 1-3 in specified cross sections of MPA, LPA and RPA in diastole. According to Perry and Steiner’s [31]
definitions of larger vortex in 3-D flow, a stable node is found in the cross section a-a’ of the healthy MPA. Sable focuses appear in cross sections b-b’ and c-c’ of healthy RPA and LPA. The stable node in healthy does not occur in Cases 1-3. One or more one focus are found in MPA of Cases 1-3. A unstable
bifurcation line, a saddle point and a stable focus happen in the cross section d-d’ of MPA of Case 1. A stable focus and another unstable focus are observed in the cross section i-i’of MPA of Case 2. In Case 3, there are a saddle point and a stable focus prsenting in the cross section q-q’ of MPA. In addition, the focus appearing in the healthy RPA is found in Cases 1-3. It is stable in the healthy one and Cases 1 and 3, but it is unstable in Case 2. The focus in healthy LPA does not appear in all Cases 1-3. The flow pattern in LPA of Case 1 shows a very strong and smooth and reversed flow. In Cases 2 and 3, the focus shrinks because of the strong reversed flow.
In order to know whether regurgitation happens first in LPA or not, Fig. 6 exhibits the time of inception of regurgitation in RPA and LPA in Cases 1-3. Figs. 6 (a), (c) and (e) present that regurgitaion first occurs in LPA of Cases 1-3. Also, an obvious recirculation appears in LPA of Cases 1-3. In terms of Figs. 6 (b), (d) and (f), it turns out that the time of inception of regurgitation in RPA is nearly 0.03 seconds behind that in LPA of Cases 1-3.
In clinical cases, there is no dilation in MPA before repair of TOF. The dilation often occurs in MPA after repair of TOF. In terms of numerical results, it is found that 3-D strong vortex motion appears in dilation of MPA in regurgitation. Therefore, the dilation causes abnormal flow distribution in MPA during regurgitaion period in a cardiac cycle. Apparently, the dilation in MPA is an important factor to influence variation of blood flow in diastole.
3.2 Analysis of Pressure Distribution
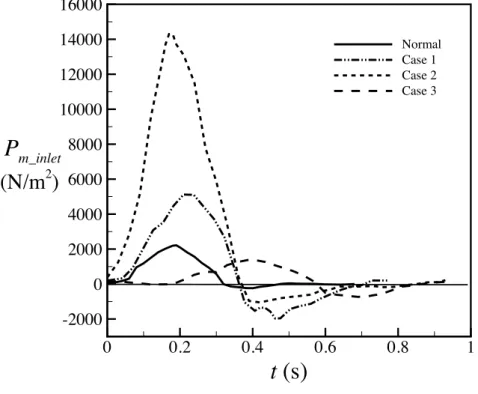
In our models, the dilation occurs in MPA of all repaired TOF cases. However, the reason causing dilation is not clear. Therefore, it is necessery to investigate the dilated area. Fig. 7 presents time histories of inlet pressure of MPA of Cases 1-3 and the healthy one in a cardic cycle. The solid curve presents the inlet pressure of the healthy one. The peak value of pressure is around 2000 N/m2 in systole. Very low negative pressure occurs in diastole. Dashed curves present pressure variations of
Cases 1-3. It is found that the peak values of pressure of Cases 1 and 2 are higher than the healthy one in systole. Moreover, negative pressure happens in Cases 1 and 2 in the diastole since regurgitation happens. It is found that the extreme prssure variation exists at the inlet of MPA of Cases 1 and 2.
The cardiac cycle of Case 3 is longer than other cases, so the systole period of Case 3 is longer than other cases as well. Due to the larger inlet cross section of Case 3 than other cases as shwon in Table 3, the peak value of inlet pressure of Case 3 is not so large as Cases 1 and 2. However, obvious negative pressure due to regurgitation exists in Case 3 in diastole. It is known that the damage of the semilunar valve is one of complications in patients after repaired TOF. Large inlet pressure variations shown in Cases 1 and 2 may be one of reasons to induce dysfunction of the pulmonary valve.
3.3 Mass Flow Rate and Regurgitation
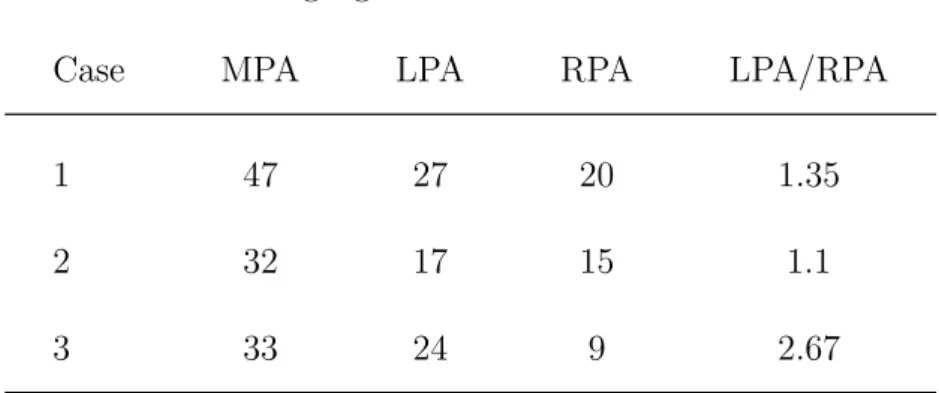
The pulmonary artery geometry effects the mass flow rate distributions in MPA, LPA and RPA. Fig. 8 shows time histories of mass flow rates in LPA and RPA of Cases 1-3 in a cardiac cycle. Solid and dashed curves representing mass flow rates in RPA and LPA, respectively. Red curves shows the variations of mass flow rates in the healthy one. The mass flow rates in LPA and RPA are very close in the healthy one. There is no regurgitation in LPA and RPA. Blue, black and green curves represent mass flow rates in Cases 1-3. Serious regurgitation is found in RPA and LPA of Cases 1-3 in diastole. Also, it is found that regurgutation always appears in LPA first in three cases. The forward flow amount of LPA is less than RPA in Cases 1 and 2. The phenomenon does not happen in Case 3. It may be because the diameter of LPA is larger than that of RPA as shown in Table 3. Meanwhile, the amount of reversed flow in LPA is larger than RPA in Cases 1-3. Table 3 presents regurgitation volumes of RPA and LPA of Cases 1-3 in a cardiac cycle. The ratio of regurgitation of LPA to RPA is always higher than 1.
Diameters of RPA and LPA of Caes 1 and 2 are close to each other (see Table 1). Nevertheless, the ratio of θ1 to θ2 of Case 1 is larger than that of Case 2. As a result, the ratio of regurgitation of LPA
to RPA in Case 1 is higher than Case 2.
3.4 Comparison between Numerical Results and Clinical PC MR Mea- surement Data
Clinical PC MR measurement data from 34 patients after repair of TOF were provided by Kaohsiung Veterans General Hospital. Regurgitation in MPA, LPA and RPA were determined in PC MR mea- surements. Subsequently, the numerical results are compared with those measurement data. Fig. 9 shows RF of MPA varies from 0.1 to 0.6. Measurement data and Numerical results are denoted as black hollow and color symbols, respectively. The ratio of LPA RF to RPA RF decreases as RF of MPA increases in measurement data. It is found that numerical results are close to measurement data.
Figure 10 shows the relationship between regurgitation of RPA and MPA. Essentially, The regurgita- tion of RPA is proportional to that of MPA in measurement data. The numerical results also show the trend in Figure 10. Figure 11 reveals the relationship between LPA RF and MPA RF. Measurement data are scattered in the figure. Predicted results are within measurement data as shown in the figure.
Consequently, the numerical computational values are acceptable based on RF analysis with clinical measurement values as shown in Figures 9-11.
4 Conclusions
We utilize peripheric data of pulmonary arteries measured by MRI to reconstruct 3-D models of pul- monary arteries of healthy person and patients after repair of TOF. Those reconstructed models of three real pulmonary arteries are used to simulate blood flow motion. The degree of pulmonary regurgitation and geometry of pulmonary artery have significant effects on the blood flow variation.
Flow patterns are visualized by streamlines and velocity magnitude in numerical results. The
recirculation region is found in LPA of all pulmonary arteries after repair of TOF in acceleration of systole. It obstructs the blood flow toward to the left lung. The strong vortices are found in the dilation area of MPA in repaired pulmonary arteries during diastole of a cardiac cycle. Nevertheless, there is no such vortex in healthy MPA in diastole. In the ends of systole and diastole, 3-D complex vortices motion appears in repaired TOF pulmonary arteries. The blood flow of the health one is smoother than those. According to numerical results, it is found that the dilation causes abnormal flow distribution in MPA during regurgitation period in a cardiac cycle.
The comparison of the flow patterns and regurgitation proves that regurgitation happens first in LPA. The amount of regurgitation in LPA is larger than RPA in numerical results. The effect of predicted pressure distribution is also discussed. The dilation has extreme pressure change in a cardiac cycle. Nevertheless, the health MPA does not have such extreme pressure variation. The high pressure is one of the important factors to generate pulmonary arteries dilation.
We could understand the influnce of pulmonary regurgitation and the blood flow patterns through this study. The results will be a useful refernce for medical doctors before they perform operations for TOF patients.
References
[1] Ho, K.W., Tan, R.S., Wong, K.Y., Tan, T.H., Shankar, S. and Tan, J.L., 2007, Late complications following Tetralogy of Fallot repair: The need for long-term follow-up. Annals Academy of Medicine 36, 947-953.
[2] Kang, I.S., Redington, A.N., Benson, L.N., Macgowan, C., Valsangiacomo, E.R., Roman, K., Kellenberger, C.J. and Yoo, S.J., 2003, Differential regurgitation in branch pulmonary arteries after repair of Tetralogy of Fallot: A phase-contrast cine magnetic resonance study. Circulation 107, 2938-2943.
[3] Wu, M.T., Huang, Y.L., Hsieh, K.S., Huang, J.T., Peng, N.J., Pan, J.Y., Huang, J.S. and Yang, T.L., 2007, Influence of pulmonary regurgitation inequality on differential perfusion of the lungs in Tetralogy of Fallot after repair: A phase-contrast magnetic resonance imaging and perfusion scintigraphy study. Journal of the American College of Cardiology 49, 1880-1886.
[4] Helbing, W.A., Niezen, R.A., Cessie, S.L., van der Geest, R.J., Ottenkamp, J. and de Roos, A., 1996, Right ventricular diastolic function in children with pulmonary regurgitation after repair of Tetralogy of Fallot: Volumetric evaluation by magnetic resonance velocity mapping. Journal of the American College of Cardiology 28, 1827-1835.
[5] Frigiola, A., Redington, A.N., Cullen, S. and Vogel, M., 2004, Pulmonary regurgitation is an im- portant determinant of right ventricular contractile dysfunction in patients with surgically repaired Tetralogy of Fallot. Circulation 110, 153-157.
[6] van den Berg, J., Hop, W.C., Strengers, J.L.M., de Jongste, J.C., van Osch-Gevers, L., Meijboom, F.J., Pattynama, P.M.T., Bogers, A.J.J.C. and Helbing, W.A., 2007, Clinical condition at mid-to- late follow-up after transatrial-transpulmonary repair of tetralogy of Fallot. Journal of Thoracic and Cardiovascular Surgery 133, 470-477.
[7] Grothoff, M., Spors, B., Abdul-Khaliq, H., Abd El Rahman, M., Alexi-Meskishvili, V., Lange, P., Felix, R. and Gutberlet, M., 2006, Pulmonary regurgitation is a powerful factor influencing QRS duration in patients after surgical repair of tetralogy of Fallot: A Magnetic Resonance Imaging (MRI) study. Clinical Research in Cardiology 95, 643-649.
[8] Vliegen, H.W., van Straten, A., de Roos, A., Roest, A.A.W., Schoof, P.H., Zwinderman, A.H., Ot- tenkamp, J., van der Wall, E.E. and Hazekamp, M.G., 2002, Magnetic resonance imaging to assess the hemodynamic effects of pulmonary valve replacement in adults late after repair of Tetralogy of Fallot. Circulation 106, 1703-1707.
[9] van Huysduynen, B.H., van Straten, A., Swenne, C.A., Maan, A.C., Ritsema van Eck, H.J., Schalij, M.J., van der Wall, E.E., de Roos, A., Hazekamp, M.G. and Vliegen, H.W., 2005, Reduction of QRS duration after pulmonary valve replacement in adult Fallot patients is related to reduction of right ventricular volume. European Heart Journal 26, 928-932.
[10] Sung, H.W., Hsu, T.L., Hsu, C.H. and Hsu, J.C., 1998, Pulmonary artery hemodynamics with varying degrees of valvular stenosis: An in vitro study. Journal of Biomechanics 31, 1153-1161.
[11] Tang, T., Chiu, I.S., Chen, H.C., Cheng, K.Y. and Chen, S.J., 2001, Comparison of pulmonary arterial flow phenomena in spiral and Lecompte models by computational fluid dynamics. Journal of Thoracic and Cardiovascular Surgery 122, 529-534.
[12] Corno, A.F. and Mickaily-Huber, E.S., 2008, Comparative computational fluid dynamic study of two distal Contegra conduit anastomoses. Interactive Cardio Vascular and Thoracic Surgery 7, 1-5.
[13] Chern, M.J., Wu, M.T., Wang, H.L., 2008, Numerical investigation of regurgitation phenomena in pulmonary arteries of Tetralogy of Fallot patients after repair. Journal of Biomechanics 41, 3002-3009.
[14] Redaelli, A., Rizzo, G., Arrigoni, S., Di Martino, E., Origgi, D., Fazio, F. and Montevecchi, F., 2002, An assisted automated procedure for vessel geometry reconstruction and hemodynamic simulations from clinical imaging. Computerized Medical Imaging and Graphics 26, 143-152.
[15] Tang, B.T., Fonte, T.A., Chan, F.P., Tsao, P.S., Feinstein, J.A. and Taylor, C.A., 2010, Three- dimensional hemodynamics in the human pulmonary arteries under resting and exercise conditions.
Annals of Biomedical Engineering 39, 347-358. DOI: 10.1007/s10439-010-0124-1. [Epub ahead of print]
[16] Das, A., Banerjee, R.K. and Gottliebson, W.M., 2010, Right ventricular inefficiency in repaired Tetralogy of Fallot: Proof of concept for energy calculations from cardiac MRI data. Annals of Biomedical Engineering 38, 3674-3687.
[17] Whitehead, K.K., Pekkan, K., Kitajima, H.D., Paridon, S.M., Yoganathan, A.P. and Fogel, M.A., 2007, Nonlinear power loss during exercise in single-ventricle patients after the Fontan. Circulation 116, 165-171.
[18] Pekkan, K., Kitajima, H.D., de Zelicourt, D., Forbess, J.M., Parks, W.J., Fogel, M.A., Sharma, S., Kanter, K.R., Frakes, D. and Yoganathan, A.P., 2005, Total cavopulmonary connection flow with functional left pulmonary artery stenosis: Angioplasty and fenestration in vitro. Circulation 112, 3264-3271.
[19] Hsia, T.Y., Migliavacca, F., Pittaccio, S., Radaelli, A., Dubini, G., Pennati, G. and de Leval, M., 2004, Computational fluid dynamic study of flow optimization in realistic models of the total cavopulmonary connections. Journal of Surgical Research 116, 305-313.
[20] Sun, Q., Wan, D., Liu, J., Liu, Y., Zhu, M., Hong, H., Sun, Y. and Wang, Q., 2009, Influence of antegrade pulmonary blood flow on the hemodynamic performance of bidirectional cavopulmonary anastomosis: A numerical study. Medical Engineering & Physics 31, 227-233.
[21] Pekkan, K., Dasi, L.P., Nourparvar, P., Yerneni, S., Tobita, K., Fogel, M.A., Keller, B. and Yoganathanb, A., 2008, In vitro hemodynamic investigation of the embryonic aortic arch at late gestation. Journal of Biomechanics 41, 1697-1706.
[22] Wang, C., Pekkan, K., de Z´elicourt, D., Horner, M., Parihar, A., Kulkarni, A. and Yoganathan, A.P., 2007, Progress in the CFD modeling of flow instabilities in anatomical total cavopulmonary connections. Annals of Biomedical Engineering 35, 1840-1856.
[23] Pedley, T.J., 1980. The fluid mechanics of large blood vessels. Cambridge University Press. Cam- bridge, U.K., ISBN 0521226260.
[24] Berger, S.A. and Jou, L.D., 2000. Flows in stenotic vessels. Annual Reviews of Fluid Mechanics 32, 347-382.
[25] Singh, M.P. and Sinha P.C., 1978, Flow in the entrance of the aorta. Journal of Fluid Mechanics 87, part 1, 97-120.
[26] Versteeg, H.K. and Malalasekera, W. 1995 An Introduction to Computational Fluid Dynamics: the Finite Volume Method. Addison Wesley Longman, Essex, England.
[27] Georgios, N.L. and Ioannis, K.N. 2012 Using the finite volume method and hybrid unstructured meshes to compute radiative heat transfer in 3-D geometries. Numerical Heat Transfer, Part B 62, 289-314.
[28] Kabinejadian, F. and Ghista, D.N. 2012 Compliant model of a coupled sequential coronary arterial bypass graft: Effects of vessel wall elasticity and non-Newtonian rheology on blood flow regime and hemodynamic parameters distribution. Medical Engineering & Physics 34, 860-872.
[29] Van Doormal, J.P. and Raithby, G.D. 1984 Enhancements of the SIMPLE method for predicting incompressible fluid flow. Numerical Heat Transfer 7, 147-163.
[30] Zhu, H., Warner, J.J., Gehrig, T.R. and Friedman, M.H., 2002, Comparison of coronary artery dynamics pre- and post-stenting. Journal of Biomechanics 36, 689-697.
[31] Perry, A.E. and Steiner, T.R., 1987, Large-scal vortex structures in turbulent wakes behind bluff bodies. Part 1. Vortex formation process. Journal of Fluid Mechanics 174, 233-270.
Table 1: Parameters of pulmonary arteries.
Case Normal Case 1 Case 2 Case 3
LRP A(cm) 5.23 3.99 4.93 5.27
LLP A(cm) 2.71 3.60 2.36 2.39
LM P A(cm) 3.85 5.31 4.17 3.14
dRP A(cm) 1.39 1.40 1.13 1.21
dLP A(cm) 1.36 1.30 1.09 1.68
dLP A/dLP A 0.98 0.92 0.96 1.39
θ1(degree) 125◦ 134◦ 106◦ 136◦
θ2(degree) 112◦ 52◦ 83◦ 70◦
θ1/θ2 1.12 2.58 1.28 1.94
AInlet(cm2) 3.48 4.58 4.89 5.83
Normal case
Case1
Case2 Case3
1
2
dLPA
dRPA
LMPA
LLPA
LRPA
19
Table 2: The measured regurgitation fraction (RF).
RF
Case MPA LPA RPA
1 0.337 0.449 0.252
2 0.164 0.186 0.149
3 0.288 0.304 0.260
Table 3: Regurgitaion volume (cm3) in a cardiac cycle.
Regurgitation volume
Case MPA LPA RPA LPA/RPA
1 47 27 20 1.35
2 32 17 15 1.1
3 33 24 9 2.67
DICOM format
Retrieve 2D contours
Reconstruct a 3D pulmonary
artery model
Mesh generation
Numerical simulation RPA LPA
RPA LPA
MPA
Figure 1: Flow chart of the reconstructed pulmonary artery model.
t (s)
0 0.5 1 1.5 2 2.5 3
-0.5 0 0.5 1 1.5
V (m/s)
RPA LPA
MPA : Inlet
: Outlet
MPA: Main Pulmonary Artery LPA : Left Pulmonary Artery RPA : Right Pulmonary Artery Forward flow Backward flow
Figure 2: Boundary conditions
dLPA(m)
0.014 0.016 0.018 0.02 0.022 0.024 0.026 0
0.1 0.2 0.3 0.4 0.5 0.6 0.7
649955 1110784 1397206
V (m/s)
LPA
X
Y Z
LPA
RPA
dRPA(m)
0.008 0.01 0.012 0.014 0.016 0.018 0
0.05 0.1 0.15 0.2 0.25 0.3 0.35
649955 1110784 1397206
V (m/s)
RPA
Figure 3: Grid independence test
X
Z Y
(a)
X
Z Y
(c)
X
Z Y
(b)
X
Z Y
(d) t (s)
0 0.2 0.4 0.6 0.8
0 0.2 0.4 0.6
V (m/s)
(a) (b)
(c) (d)
Normal case
Figure 4: Evolution of streamlines in healthy pulmonary arteries within a cardiac cycle.
Normal case
a a’
b b’ c c’
Case 1
d d’
e e’ f f’
Case 3
q r r’ q’
s s’
Case 2
i i’
j j’ k k’
Case 1
X Y
Z
d d’
Z X
Y
f f’
Normal case X
Y Z
b b’
X
Z Y
c c’
t (s)
0 0.2 0.4 0.6 0.8
0 0.2 0.4 0.6
V (m/s)
X Y
Z
a a’
t (s)
0 0.2 0.4 0.6 0.8
-0.5 0 0.5 1 1.5
V (m/s)
Y X Z
e e’
Case 3
X Y
Z
q q’
X Y
Z
s s’
Case 2
X
Y Z
r r’
X
Y Z
j j’
Z X
Y
k k’
t (s)
0 0.2 0.4 0.6 0.8 1
0 0.5 1 1.5
V (m/s)
t (s)
0 0.2 0.4 0.6 0.8 1
-0.4 -0.2 0 0.2 0.4
(m/s)V
X Y
Z
i i’ VelocityMagnitude
0.70 0.63 0.56 0.48 0.41 0.34 0.27 0.19 0.12 0.05
Figure 5: Flow patterns and velocity distribution in minimum of a cardiac cycle.
Case 1
(a) Case 1
Case 2 (c)
Case 2
X
Y Z
X
Y Z
(f)
t (s)
0 0.2 0.4 0.6 0.8
-0.5 0 0.5 1 1.5
(m/s)V t = 0.4371 s
X
Y Z
X (b)
Y Z
Case 3 (e)
t (s)
0 0.2 0.4 0.6 0.8 1
-0.4 -0.2 0 0.2 0.4
V (m/s)
t = 0.6305 s
Case 3
t (s)
0 0.2 0.4 0.6 0.8 1
-0.4 -0.2 0 0.2 0.4
V (m/s)
t = 0.6605 s t (s)
0 0.2 0.4 0.6 0.8 1
0 0.5 1 1.5
(m/s)V t = 0.427 s
t (s)
0 0.2 0.4 0.6 0.8 1
0 0.5 1 1.5
(m/s)V t = 0.467 s t (s)
0 0.2 0.4 0.6 0.8
-0.5 0 0.5 1 1.5
(m/s)V t = 0.4091 s
X
Y Z
X
Y Z
(d)
Figure 6: First time of regurgtiaton happening in LPA and RPA.
t (s)
0 0.2 0.4 0.6 0.8 1
-2000 0 2000 4000 6000 8000 10000 12000 14000 16000
Normal Case 1 Case 2 Case 3
Pm_inlet (N/m2)
Figure 7: Time histories of inlet pressure of MPA in a cardiac cycle.
t (s)
0 0.2 0.4 0.6 0.8 1
-0.2 -0.1 0 0.1 0.2 0.3 0.4 0.5
Normal_LPA Normal_RPA Case 1_LPA Case 1_RPA Case 2_LPA Case 2_RPA Case 3_LPA Case 3_RPA
m .
(kg/s)
Figure 8: Time histories of mass flow rate in a cardic cycle.
MPA RF
L/RFlowRF
0 0.1 0.2 0.3 0.4 0.5 0.6 0.7 0.8 0
2 4 6 8 10 12
14 measure value
TOF case1_RF = 0.337 TOF case2_RF = 0.164 TOF case3_RF = 0.288
Figure 9: Comparing the L/R RF and MPA RF relationship between medical measurement and nu- merical computational values.
MPA (RF)
RPA(RF)
0 0.1 0.2 0.3 0.4 0.5 0.6 0.7 0.8 0
0.1 0.2 0.3 0.4 0.5 0.6 0.7 0.8
measure value TOF case1_RF = 0.337 TOF case2_RF = 0.164 TOF case3_RF = 0.252
Figure 10: Comparing the RPA RF and MPA RF relationship between medical measurement and numerical computational values.
MPA (RF)
LPA(RF)
0 0.1 0.2 0.3 0.4 0.5 0.6 0.7 0.8 0
0.1 0.2 0.3 0.4 0.5 0.6 0.7 0.8
measure value TOF case1_RF = 0.337 TOF case2_RF = 0.164 TOF case3_RF = 0.288
Figure 11: Comparing the LPA RF and MPA RF relationship between medical measurement and numerical computational values.
1
國科會補助專題研究計畫項下出席國際學術會議心得報告
日期:101 年 10月31日
一、參加會議經過
主持人受邀於2012 國際計算熱傳進展論壇發表學術論文. 會議於英國巴斯大學舉行.
本次主題共有8個sessions與11個邀請演講. 主持人的演講安排於會議第一天下午的 第一場計算方法與邊界層流場的論壇時間. 主持人主要發表一篇有關於沉浸邊界法 預測含移動物體之流場與熱傳模式. 演講完畢後收到數個問題,並與與會者交流約 一個多小時。主持人除本身演講外並參加數個重要演講, 其中包括大渦法在空氣動 力學上的應用, level-set方法與多相流模擬的應用等重要議題及研究結果發表. 對於目 前計算熱傳學與前端發展有深刻之瞭解. 會中並與來自英國Brighton大學教授
Yakovenko, 京都大學教授Yoshida,與英國巴斯大學主辦人Rees教授之學者進行研究 意見交換.
二、與會心得
本次會議參與人數眾多,約有兩百多位來自學界與產業界。此會議的討論交流踴 躍,本人第一次參加此會議(本次為第十二屆),但感覺在會場中會眾積極參與討 論的情形比本人之前參加的會議要好很多,所以本人收獲良多。有機會會建議臺灣 從事計算熱傳之同仁一起參與下一屆之會議。
三、考察參觀活動(無是項活動者略) 無此項活動
四、建議本次參加之會議參與者廣泛,且皆為各國最好的研究機構之人員。建議將來對計算 熱傳有興趣之學者可以參與此項會議。
五、攜回資料名稱及內容
2012 國際計算熱傳進展論壇論文集一本 六、其他
計畫編號 NSC 100-2221-E-011-163-NSC 100-2221-E-011-163-NSC 100-2221-E-011-163-
計畫名稱 動脈內血流流動與心血管疾病關係之數值研究 - 以先天性肺動脈疾病與 冠狀動脈粥樣硬化為例
動脈內血流流動與心血管疾病關係之數值研究 - 以先天性肺動脈疾病與 冠狀動脈粥樣硬化為例
動脈內血流流動與心血管疾病關係之數值研究 - 以先天性肺動脈疾病與 冠狀動脈粥樣硬化為例
出國人員姓名 陳明志 服務機構
及職稱 台灣科技大學機械系教授 會議時間 100年7月1日至
100年7月6日 會議地點 英國巴斯 會議名稱 (中文)國際計算熱傳進展論壇
(英文) ICHMT International Symposium on Advances in Computational Heat Transfer (CHT-12)
(中文)國際計算熱傳進展論壇
(英文) ICHMT International Symposium on Advances in Computational Heat Transfer (CHT-12)
(中文)國際計算熱傳進展論壇
(英文) ICHMT International Symposium on Advances in Computational Heat Transfer (CHT-12)
發表論文題目
(中文)使用沉浸邊界法求解含移動物體之流場與熱傳
(英文) An immersed boundary method to solve flow and heat transfer problems involving a moving object
(中文)使用沉浸邊界法求解含移動物體之流場與熱傳
(英文) An immersed boundary method to solve flow and heat transfer problems involving a moving object
(中文)使用沉浸邊界法求解含移動物體之流場與熱傳
(英文) An immersed boundary method to solve flow and heat transfer problems involving a moving object
附件四
以海報加口頭報告與參加者交流
與俄羅斯學者交流
3
專題演講: 劍橋大學渦輪機實驗室Tucker教授講演大渦法於航太工程之應用
同上
邀請演講: 阿布達比大學葉教授講述level-set 方法在多相流運用
與英國學者交流
5
與巴斯大學主辦教授Prof. A. Rees合影
Proceedings of CHT-12 ICHMT International Symposium on Advances in Computational Heat Transfer July 1-6, 2012, Bath, England CHT-12-CM09
AN IMMERSED BOUNDARY METHOD TO SOLVE FLOW AND HEAT TRANSFER PROBLEMS INVOLVING A MOVING OBJECT
Ming-Jyh Chern*,§, Dedy Zulhidayat Noor* and Tzyy-Leng Horng**
* Department of Mechanical Engineering, National Taiwan University of Science and Technology, Taipei, Taiwan
** Department of Applied Mathematics, Feng Chia University, Taichung, Taiwan
§Correspondence author. Fax: +886-2-27376460 Email: [email protected]
ABSTRACT
A direct-forcing immerse boundary method with both virtual force and heat source is developed here to solve Navier-Stokes and the associated energy transport equations to study some thermal flow problems caused by a moving rigid solid object within. The key point of this novel numerical method is that the solid object, stationary or moving, is first treated as fluid governed by Navier-Stokes equations for velocity and pressure, and by energy transport equation for temperature in every time step. An additional virtual force term is then introduced on the right hand side of momentum equations in the solid object region to make it act exactly as if it were a solid rigid body immersed in the fluid. Likewise, an additional virtual heat source term is applied to the right hand side of energy equation at the solid object region to maintain the solid object at the prescribed temperature all the time. The current method was validated by some benchmark forced and natural convection problems such as a uniform flow past a heated circular cylinder, and a heated circular cylinder inside a square enclosure. We further demonstrated this method by studying a mixed convection problem involving a heated circular cylinder moving inside a square enclosure. Our current method avoids the otherwise requested dynamic grid generation in traditional method and shows great efficiency in the computation of thermal and flow fields caused by fluid-structure interaction.
NOMENCLATURE
dimensionless amplitude dimensionless displacement dimensionless diameter virtual force
total force acting on a solid body total heat transfer over body surface dimensionless length