doi:10.6342/NTU201803315
國立臺灣大學醫學院藥學研究所
碩士論文
Graduate Institute of Pharmaceutical Sciences College of Medicine
National Taiwan University Master Thesis
第一部份:以液相層析質譜儀結合柱後注入內標法定量採血卡 上的新型抗凝血藥物
第二部分:建立液相層析質譜儀結合柱後注入內標法定量磷脂 醯乙醇胺以測量採血卡上的血比容
Part I: Using the Postcolumn Infused-Internal Standard Method to Quantify Novel Oral Anticoagulants in Dried Blood Spots by
LC-ESI-MS
Part II: Development of a Postcolumn Infused-Internal Standard Method to Quantify Phosphatidylethanolamine for the Estimation
of Hematocrit in Dried Blood Spots by LC-ESI-MS
張人祥 Ren-Shiang Jhang 指導教授﹕郭錦樺 博士 Advisor: Ching-Hua Kuo, Ph.D.
中華民國 107 年 7 月 July, 2018
doi:10.6342/NTU201803315
I
致謝
在大學時先修高等分析化學的研究所課程和在中研院學醣分析實驗感到很 有興趣後申請藥學研所,去年的我很期待又興奮的來到藥物分析實驗室,過去接 受台大藥學六年制的臨床訓練從沒想過會在這個環境到這一天,一開始的心態和 思考邏輯轉換很不習慣,需要操作沒用過的質譜儀們及點無數個採血卡血點,過 程中多次憂鬱想停止學習,心想這真的是自己想要的嗎?還是其實自己還是適合臨 床?又或者我只適合念書不適合做實驗?
最最最感謝的是指導老師鼓勵我留下來,讓我一直思考當初申請的初衷,
後來轉變心態,實驗漸入佳境,今年畢業典禮比去年還感觸很多,讓我成為第一 位六年制後又一年藥學研究畢業。這一年內每天都督促自己要進步,要用一年完 成兩年的實驗和分析的思考邏輯訓練,不能讓旁人覺得只是混混而已,這一年中 做了兩次海報、一次分析技術研討會口頭報告、兩篇題目的論文、分析 700 多個 臨床檢體及協助老師完成藥廠計畫案。
感謝口試委員湯頌君醫師在每次開會討論中給予寶貴建議和想法,還有依琳 學姊在很多實驗設計上的幫忙,分享了過去有關採血卡實驗的經驗與注意事項,
讓我受益良多,實驗上順利進行。
在研究所學業的這一年,很感謝實驗室的學長姐,是讓我持續努力下去的動 力,謝謝曉偉學長在一開始實驗設計的教學,作為我分析採血卡相關實驗的開端。
謝謝錫鈞學長在分析血漿濃度的幫忙,讓我開始有組織性的分析大批量臨床檢體
doi:10.6342/NTU201803315
II
及整理實驗數據。謝謝京樺提供脂肪分析的相關經驗、亞葶學姊協助我處理大量 的檢體及心靈慰問,使我過程中的焦慮能夠漸漸放下。謝謝宗恒學長、翰駿學長、
Divya、嘉琪學姊、秀卿、若馨學姊在諸多事情的幫忙,讓我在這一年可以順利完 成題目。
感謝我的超級好麻吉們一直聽我發牢騷,給我繼續奮鬥的動力,波波、咪咪、
阿楨、治宇把把、小龜、達達、品皓等等,還有壁球好夥伴在過程中的出遊讓我 好舒壓。另外莞曾老師在 seminar 上給予我的肯定讓我更有信心及系辦助教和輔導 老師的心靈慰問讓我減少憂鬱的情緒
最後感謝我的爸爸、媽媽,分別都北上來參加學士班和碩士班畢業典禮,一 路上支持我的夢想及對我的照顧和關心。覺得在一年內完成兩個實驗的題目,要 堅持到最後不容易,有了這麼人的支持和幫助,讓我知道這個路途上我不是一個 人。
doi:10.6342/NTU201803315
III
中文摘要
採血卡取樣技術在疾病篩檢上已有著悠久的歷史。由於個人化醫療的觀念 亦趨重要,此採樣方法用作為一個普遍的醫療評估工具已於現今得到很高的重 視。儘管採血卡取樣技術有很多的優點,但將其應用在臨床上例行的生物檢測仍 然存在很多挑戰。本論文中所建立的分析方法為運用液相層析串聯式質譜儀並結 合管柱後灌注內標法以分析採血卡上的化合物。
本論文第一部分,我們執行方法開發及確效以定量採血卡上三種新型口服 抗凝血藥物,包括 dabigatran、rivaroxaban、apixaban。利用管柱後灌注內標法校正 在質譜儀內的基質效應和估計採血卡上的血液體積。在最佳化的分析條件下,此 方法能在 4 分鐘內完成三種抗凝血藥物的定量分析。當使用 0.1%甲酸並搭配乙腈
(3:7 v/v)作為萃取液時,三個藥物萃取率可高達 90%以上。選用[13C6]-rivaroxaban 作為管柱後灌注法的內標準品,其估計體積的準確度介於 87.1-119.8% (n=7). 此 外,三個藥物沒有顯著受到 5 個不同血比溶的影響。在全部測試濃度的確效結果 均顯示準確度介在 88.9-104.3%,且同日內之重覆性及異日間之再現性精密度的相 對標準差皆小於 10.0%。本分析方法所使用的三種藥物在採血卡檢體建立線性的相
關係數皆大於 0.99,定量極限皆小於 0.6 ng mL-1。三種藥物在採血卡檢體內於室
溫、4°C 及-20°C 的條件下存放一個月後的安定性良好(91.0-111.4%)。我們成功地 將管柱後灌注內標法用於定量採血卡中三種新型口服抗凝血藥物,研究結果指出 此方法可以有效地用在測量採血卡上的藥物濃度。
doi:10.6342/NTU201803315
IV
第二部分我們進一步評估本實驗室先前找到的兩種磷脂醯乙醇胺用來估計 血比容的準確度。先使用水浸潤並搭配 Folch 萃取法,結果顯示磷脂醯乙醇胺
16:0/20:4 及 16:0/18:1 在採血卡檢體的萃取率分別是 84.6%及 93.4%。我們選擇外 生性的磷脂醯乙醇胺 17:1 作為管柱後灌注法的內標準品以校正基質效應,並在質 譜端使用負離子模式以增加選擇性。在分析方法的最適化條件下,我們定量採血 卡中的兩個磷脂醯乙醇胺並發現其兩者的濃度與血比容值呈現高度線性相關性
(R2>0.98)。因此進一步使用此兩個內標估測 60 個臨床採血卡檢體的血比容值,結
果顯示全部的樣品的估計偏差皆小於 15%。帶入布蘭德-奧特曼差異分析方法後顯 示超過 90%的檢體量落在 95%信賴區間內,從山形圖可知磷脂醯乙醇胺 16:0/20:4 及 16:0/18:1 的平均偏差分別為 0.3 及-2.5。我們的結果顯示此二個磷脂醯乙醇胺極 具潛力作為估計採血卡檢體中的血比容值的標誌。
總結本研究為使用液相層析串聯式質譜儀建立方法;分別用於定量採血卡 檢體內的三種新型抗凝血藥物,及估計採血卡檢體內血比容。此兩個簡易且高效 的分析方法可提供作為療劑監測的一個新方法,以協助個人化醫療並可以更廣泛 將採血卡應用在臨床上。
關鍵字:採血卡、新型口服抗凝血藥、血液體積、血比容、柱後注入內標、質譜 儀
doi:10.6342/NTU201803315
V
Abstract
Dried blood spots (DBSs) sampling technique has had a long history in disease screening. Recently, it has gained high attention as a common medical assessment tool because of the growing importance of personalized medicine. In spite of numerous advantages respecting the DBS sampling technique, this powerful sampling tool still faces challenges in the application of routine clinical bioanalysis. In this study, we develop analytical methods for DBS analysis by a liquid chromatography-tandem mass spectrometry combined with postcolumn infused-internal standard (PCI-IS) approach.
In the first part of this thesis, we developed and validated a method for quantification of three NOACs including dabigatran, rivaroxaban and apixaban in DBS.
The PCI-IS method was adapted for correction of matrix effects in LC-ESI-MS and estimation of blood volumes on DBS cards. Under optimal conditions, three NOACs could be quantified in a single run within 5min. Over 90% of the recovery could be achieved when using 0.1% formic acid in water with acetonitrile (3:7 v/v) as the extraction solution. [13C6]-rivaroxaban was selected as the PCI-IS and the accuracy for volume estimation was between 87.1% and 119.8% (n=7). Furthermore, the result from hematocrit effect of three NOACs showed no significant variation for 5 different hematocrit (HCT) levels. Validation results demonstrated that the accuracies were among 88.9-104.3%, and intra-day and inter-day precisions were all below 10.0% for all
doi:10.6342/NTU201803315
VI
test concentrations. The calibration curves of DBS samples for the analytes had coefficients of determination higher than 0.99, and the limits of detection were all below
0.6 ng mL-1. The stability of three NOACs revealed good stability (91.0-111.4%) in the DBS samples after one months of storage at room temperature, 4 °C and -20 °C. We successfully applied the PCI-IS method for quantification of NOACs in DBS, and the result revealed PCI-IS is an effective strategy for measuring drug concentrations in DBS.
In the second part, we further evaluated the accuracies of two potential phosphatidylethanolamine (PE) markers identified in our lab for estimation of HCT values. Using water pre-rinsed in combination with Folch extraction showed good recoveries with 84.6% and 93.4% for PE 16:0/20:4 and PE 16:0/18:1, respectively. We selected the exogenous lysoPE 17:1 as the PCI-IS for correction of matrix effect, and applied negative mode LC-ESI-MS to enhance selectivity. Under the optimized condition, we quantified these two PEs in the DBS samples and found the high correlation between the concentration of PEs and the HCT values of DBS samples (R2>0.98). Thus, PE 16:0/18:1 and PE 16:0/20:4 were further applied to estimate the HCT values of 60 DBS samples obtained from patients. Finally, the results showed that all of samples were presented less than 15% estimation error. The Bland and Altman analysis showed more than 90% of DBS samples within 95% CI. The mean biases from
doi:10.6342/NTU201803315
VII
mountain plot were 0.3 and -2.5 for PE 16:0/18:1 and PE 16:0/20:4, respectively. Our results indicated that PE 16:0/18:1 and PE 16:0/20:4 exhibited high potential to serve as makers to estimate HCT values for the DBS samples.
In conclusion, we established a analytical methods for accurate quantification of NOACs in DBS samples and estimation of HCT levels by LC-ESI-MS. The developed two simple and efficient methods can offer a new strategy for routine therapeutic drug monitoring (TDM) to improve personalized medicine and expand applications of DBS technique in clinical use.
Keywords: dried blood spot (DBS), novel oral anticoagulants (NOACs), blood volume, hematocrit effect, post-column infused internal standard (PCI-IS), mass spectrometry
doi:10.6342/NTU201803315
VIII
doi:10.6342/NTU201803315
IX
Contents
中文摘要 ... I Abstract ... V Contents ... IX Figure contents ... XI Table contents ... XIII Part I: Using the Postcolumn Infused-Internal Standard Method to Quantify Novel
Oral Anticoagulants in Dried Blood Spots by LC-ESI-MS ... 1
1.1 Introduction ... 2
1.1.1 The importance of new oral anticoagulants (NOACs) concentration monitoring ... 2
1.1.2 Dried blood spot and its’ advantage... 4
1.1.3 Mass spectrometry for DBS analysis ... 6
1.1.4 Challenges of using DBS sampling technique in clinical practice ... 7
1.1.5 Exploration of a quantitative relationship between the blood and plasma ... 9
1.1.6 Current methods for quantification of NOACs in DBS ... 10
1.7 Research aims ... 12
1.2. Material and Methods ... 12
1.2.1 Chemicals and reagents ... 12
1.2.2 UHPLC-ESI-MS system ... 13
1.2.3 Standard solutions and calibration standards ... 14
1.2.4 Samples collection ... 15
1.2.5 DBS sample preparation ... 15
1.2.6 Dried blood spot extraction ... 16
1.2.7 Method validation ... 17
1.2.8 Data analysis ... 21
1.3 Results and discussion ... 21
1.3.1 Method development ... 21
1.3.2 Method validation ... 29
1.4 Conclusion ... 33
1.5 Figures ... 35
1.6 Tables ... 42
Part Ⅱ: Development of a Postcolumn Infused-Internal Standard Method to Quantify Phosphatidylethanolamine for the Estimation of Hematocrit in Dried Blood Spots by LC-ESI-MS ... 48
2.1 Introduction ... 49
2.1.1 Background of dried blood spot ... 49
doi:10.6342/NTU201803315
X
2.1.2 Current strategies for overcoming the hematocrit problem and their
limitations ... 50
2.2 Experimental section ... 52
2.2.1 Chemicals and Materials ... 52
2.2.2 The UHPLC-ESI-MS system combined with PCI-IS method ... 53
2.2.3 Standard solutions and calibration standards ... 54
2.2.4 Samples preparation ... 55
2.2.5 Preparation of artificial blood samples to study the correlation between proposed markers and HCT values ... 56
2.2.6 Linearity, limit of detections (LODs), and limit of quantifications (LLOQs) ... 56
2.2.7 Extraction recovery and stability ... 56
2.2.8 PCI-IS method combined with MNF strategy ... 58
2.2.9 Clinical sample collection ... 59
2.2.10 Data analysis ... 59
2.3 Results and discussion ... 60
2.3.1 Method development ... 60
2.3.2 Method validation ... 63
2.4 Conclusions ... 66
2.5 Figures ... 68
2.6 Tables ... 74
References ... 75
doi:10.6342/NTU201803315
XI
Figure contents
Part I: Using the Postcolumn Infused-Internal Standard Method to Quantify Novel Oral Anticoagulants on Dried Blood Spots by LC-ESI-MS
Figure 1.1 The chemical structures of the NOACs. ... 35 Figure 1.2 The instrument set up for the PCI-IS method. ... 35 Figure 1.3 The sample preparation for DBS, volume correction, hematocrits effect
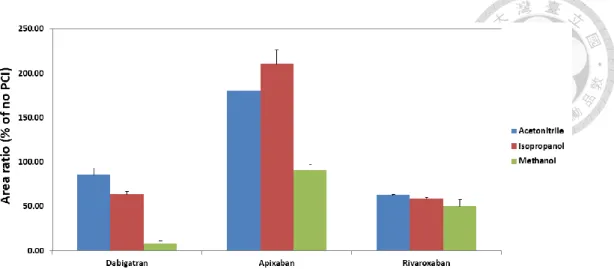
studies and the extraction procedures for DBS samples... 36 Figure 1.4 Effects of the extraction solution for NOACs on DBS samples ... 37 Figure 1.5 Analysis of phospholipids extracted from human DBS sample by precursor
ions of m/z 184. ... 37 Figure 1.6 The comparison of different solvents in PCI-IS solution. ... 38 Figure 1.7 MRM chromatograms at the LLOQ levels obtained from spiked DBS
samples after optimizing the extraction solvent and LC-MS parameters ... 38 Figure 1.8 Average % bias at low (40 ng mL-1) and high (400 ng mL-1) for NOAC
quantification obtained at different HCT levels. ... 39 Figure 1.9 Correlations of NOACs concentrations quantified in DBS and plasma patient
samples. ... 40 Figure 1.10 Bland−Altman plots for NOACs depicted the differences between estimated
plasma concentrations from DBS samples with conversion factors and
measured plasma concentrations. ... 41
Part Ⅱ: Development of a Postcolumn Infused-Internal Standard Method to Quantify Phosphatidylethanolamine for the Estimation of Hematocrit in Dried Blood Spots by LC-ESI-MS
Figure 2.1 The chemical structures of the two potential PE markers and the PCI-IS .... 68 Figure 2.2 Effects of the extraction solution for recoveries of PEs on DBS samples at 25 µgmL-1. ... 68
doi:10.6342/NTU201803315
XII
Figure 2.3 The MRM chromatograms of two PEs obtained by the DBS extract detected by positive ion mode and negative ion mode of LC-ESI-MS/MS. ... 69 Figure 2.4 The MRM chromatograms of two PEs in standard solution and DBS
samples with HCT level of 15%. ... 70 Figure 2.5 The calibration curves of HCT levels and PE corrected response, and HCT
levels and PE concentrations. ... 71 Figure 2.6 The Deming regression, the Bland-Altman plots and the Mountain plot of the
calculated HCT values by potential PE markers, and the measured HCT values.. ... 72
doi:10.6342/NTU201803315
XIII
Table contents
Part I: Using the Postcolumn Infused-Internal Standard Method to Quantify Novel Oral Anticoagulants on Dried Blood Spots by LC-ESI-MS
Table 1.1 Parameters of mass spectrometry and retention times for the target compounds and the internal standard. ... 42 Table 1.2 Comparison of 30 days stability study results obtained by with and without
0.1% formic acid pre-rinse for DBS sample extraction... 42 Table 1.3 Correlation between the reciprocal of minimum responses at the first ion
suppression zone of the PCI-IS chromatograms and the DBS blood volume for 2 tested PCI-ISs ([13C,d3]-apixaban and [13C6]-rivaroxaban) and the
estimation accuracy of the spot volume for 7 samples. ... 43 Table 1.4 Quantification accuracy and precision calculated without or with 2 tested
PCI-ISs calibration. ... 44 Table 1.5 The extraction recoveries and matrix effects for three NOACs at HCT among
5 HCT were tested with two concentrations ... 45 Table 1.6 The corrected mean response with PCI-IS and precision were tested for
individual HCT. ... 45 Table 1.7 Recovery, matrix effect and the intra- and inter-day precision and accuracy for NOACs in DBS samples. And Calibration curves, limit of detection and lower limit of quantification for NOACs in DBS samples. ... 46 Table 1.8 The stability of three NOACs in whole blood samples at room temperature for
2 and 4 hours and at 4 for 4 and 24 hours. And the Long-term stability of three NOACs in DBS samples at RT, 4 ◦C and −20 ◦C.. ... 47
doi:10.6342/NTU201803315
XIV
Part Ⅱ: Development of a Postcolumn Infused-Internal Standard Method to Quantify Phosphatidylethanolamine for the Estimation of Hematocrit in Dried Blood Spots by LC-ESI-MS
Table 2.1 Parameters of mass spectrometry and retention times for the target compounds and the internal standard ... 74 Table 2.2. The intra- and inter-day precision and accuracy for PEs in standard solution
... 74 Table 2.3 The Long-term stability of two PEs in DBS samples at RT, 4 ◦C and −20 ◦C
... 74
doi:10.6342/NTU201803315
1
Part I: Using the Postcolumn
Infused-Internal Standard Method to
Quantify Novel Oral Anticoagulants
in Dried Blood Spots by LC-ESI-MS
doi:10.6342/NTU201803315
2
1.1 Introduction
1.1.1 The importance of new oral anticoagulants (NOACs) concentration monitoring
Atrial fibrillation (AF) is the most frequently occurred cardiac arrhythmia disorder in daily clinical events threatening public health worldwide. Though AF is an asymptomatic disease, it influences 1-2% population as well as causes 2-fold increase in mortality [1, 2]. In spite of the increasing therapeutic advancements in the treatment of AF, it can trigger cardioembolic complications, and that are associated with frequent hospital admission, a 5-fold increased risk of stroke, a greater risk of death, and the development of heart failure or other cardiovascular diseases [3-5]. Hence, Physicians' Academy for Cardiovascular Education (PACE-CME) has indicated that this number grows continuously until 2060 [6].
Vitamin K antagonists (VKA) (e.g. warfarin) and heparins are traditional anticoagulants for the last 60 years, however, there are some limitations such as high bleeding rate, narrow therapeutic range, and the potentialities for drug-drug interactions and the complicated genetic effects. Nowadays, some non-vitamin K antagonists acting as the novel oral anticoagulants (NOACs) play important roles as alternatives to VKA, such as dabigatran, rivaroxaban, and apixaban, owing to the wide therapeutic index, fixed dose regimen, favorable efficacy/safety ratio, and minor drug-drug and drug-food
doi:10.6342/NTU201803315
3
interactions [2, 7]. In addition, dabigatran (Pradaxa®; Boehringer Ingelheim) is a direct thrombin inhibitor, and rivaroxaban (Xarelto®; Bayer) and apixaban (Eliquis®; Pfizer) are direct FXa inhibitors. Currently, NOACs have been licensed for preventing stroke and systemic embolism among patients with AF, preventing and treating deep vein thrombosis and pulmonary embolism [8].
Owing to numerous benefits of NOACs, they are being substituted gradually for warfarin for stroke prevention in AF [3] with a wide therapeutic index, and thus reducing the frequency of routine laboratory tests [9, 10]. However, this one-fit-for-all dosing strategy of NOACs may raise some concerns and criticism. Therefore, to determine NOACs activity is necessary in some specific populations (e.g. elderly, renal insufficiency and liver impairments) and situations (e.g. acute intoxication, prior to invasive surgery and trauma) due to the potential variations of safety and efficacy of NOACs in these above-mentioned conditions [8, 11]. In terms of pharmacokinetics, NOACs can be eliminated through kidneys (dabigatran ~80%; rivaroxaban ~30%;
apixaban ~25%), and metabolized through liver (apixaban ~75%; rivaroxaban ~30%;
dabigatran ~20%) [8]. In addition, there are no available antidotes to reverse the anticoagulation of NOACs and drug-drug interactions, and it has been reported the impact of NOACs on the elderly by influencing P-glycoprotein and CYP3A4/5 [12, 13].
Accordingly, to develop robust methods for occasional monitoring of the individualized
doi:10.6342/NTU201803315
4
pharmacological effect of NOACs is necessary.
Previous studies have suggested that some commonly used coagulation tests, such as prothrombin time (PT), activated partial thromboplastin time (aPTT), diluted Thrombin Time (dTT), and international normalized ratio (INR) are neither sensitive nor precise enough to assess the use of NOACs, and are highly influenced by endogenous substances or other coagulation inhibitors. Importantly, there is a close linear relationship between plasma levels in patients on therapy with NOACs and the coagulation tests for NOACs, such as dTT in dabigatran, and anti-factor Xa activity in apixaban and rivaroxaban [14-16]. Nevertheless, these tests are not available in routine clinical practice and less convenient than direct measurement of drug concentration [9].
Hence, the measurement of plasma NOACs concentrations is considered to be the most sensitive and direct method to reflect the amount of NOACs in the body. To date, based on the cumulative literatures, the LC-MS/MS method has shed new light for measuring plasma concentration of NOACs [17-19]. There are no common therapeutic ranges for NOACs in plasma samples, but 12-343ng mL-1 for rivaroxaban, 41-321 ng mL-1 for apixaban and 31-443ng mL-1 for dabigatran are highly cited ranges [11, 16].
1.1.2 Dried blood spot and its’ advantage
Dried blood spots (DBSs) has a long history in disease screening since Dr. Robert Guthrie applied to measure phenylalanine in newborns by the minimally-invasive
doi:10.6342/NTU201803315
5
procedure of a finger or heel prick in the early 1960s [20, 21]. In recent years, DBS sampling has gained increasing attention as a common tool in medical assessment for individuals because of the growing importance of personalized medicine in clinical need.
DBS sampling has numerous benefits compared with the conventional venous blood sampling. Comparing with venous blood sampling, only a smaller volume of blood is required and placed onto a filter paper card by the minimal invasive procedure. Then the card needs to be dried completely under ambient conditions prior to storage or transportation to laboratories. The complete drying step is necessary for reducing bacterial growth. In general, the dried blood sample can reveal great stability under ambient or refrigerated conditions for several days even up to several months for many drugs [22]. Moreover, it can enhance the stability of some labile compounds, including photosensitive compounds, and prodrugs which are not stable in fresh blood and metabolites, by circumventing the high rate of drug degradation. Because most compounds exhibit less reactivity in DBS at room temperature, the dried samples on paper cards can be transported by mail systems without special requirements or containers. Therefore, it can reduce costs and complexities when sending specimens to remote labs. Most important of all, this sampling strategy greatly benefit personalized medicine because patients can just prick the finger at home by themselves at predefined times. It is helpful to examine their therapeutic efficacy, toxicity, and prevent
doi:10.6342/NTU201803315
6
compliance-related problems. In terms of economy, instead of conventional sampling with hospital visits, DBS is a cost-effective option for sampling [20, 22-28] because sampling and storage can be conducted at home [29]. Additionally, the other advantage of DBS technique is the reduction of infectious possibilities, for instance, human immunodeficiency virus, hepatitis B virus, and other blood-borne viruses. Also, it is easier for lab manipulators in dealing with the unknown specimens, and it also lessens exposure to blood during storage or shipment [23, 30, 31].
1.1.3 Mass spectrometry for DBS analysis
Due to the small sampling volume (approximately 15±5µL per spot) and the matrix complexity, low assay sensitivity and specificity are the analytical challenges for the DBS technique [32]. In the past, immunoassays and other methods have been used for determining small molecules in DBS samples. However, high performance liquid chromatography (HPLC) coupled with UV or fluorescence detection provided favorable separation and better sensitivity for quantification [20]. Besides relative lower sensitivity and specificity of UV detector, mass spectrometry (MS) is considered as an impressive analytical tool to quantify compounds in DBS samples [26]. Mee, Korth and Halpern are the first researchers to employ chemical ionization (CI) for quantitation of free fatty acids on the DBS in 1976 [33]. Gas chromatography coupled with MS (GC-MS) is sensitive, but it has some drawbacks such as complicated sample
doi:10.6342/NTU201803315
7
preparation procedures especially in derivatization steps [20]. Nowadays, liquid chromatography/tandem mass spectrometry (LC–MS/MS) has been considered as the gold standard method for the highly sensitive and selective quantitation of drugs concentrations of patients’ specimen [16]. Moreover, it has been proven that the strategy of liquid chromatography electrospray ionization mass spectrometry (LC-ESI-MS) combined with DBS is an effective and efficient platform for quantitation of therapeutic d r u g m o n i t o r i n g ( T D M ) a n d p h a r m a c o k i n e t i c s s t u d i e s [ 3 4 - 3 6 ] . 1.1.4 Challenges of using DBS sampling technique in clinical practice
In spite of many advantages by using DBS sampling technique, its clinical utility is still relatively low in general practice. Analytical challenges including sensitivity, blood volume variation and hematocrit (HCT)-based assay bias (citation).
Small-volume blood samples on DBS device leads to the reduction of sensitivity of detection. Hence, using LC-MS/MS incorporated with multiple reaction monitoring (MRM) or selective reaction monitoring (SRM) technique can increase sensitivity and selectivity and ameliorate detection problems [37, 38]. HCT, defined as volume proportion (vol%) of erythrocytes in blood sample, is variable within different age, race, gender, physical status, and nutritional condition [39, 40]. It has been reported that the HCT level can cause bias while using DBS for quantitation of drugs in blood samples [40]. The HCT different may affect blood viscosity and resulting in different spot size
doi:10.6342/NTU201803315
8
on cellulose-based paper substrates. Other HCT caused bias includes fluctuating extraction recovery, matrix effects, and blood-to-plasma concentration ratio of the drug [32, 41, 42]. Currently, two ways were used to cut down DBS cards; one is called the center punch method by punching a fixed dimeter center, and the other is called whole spot extraction [32, 43, 44]. Although the center punch method can control the same volume of whole blood on cards, the divergent HCT values may cause assay bias due to non-homogeneity and non-dispersion characteristics of the drug on the DBS card. Naiyu Zheng et al. had demonstrated whole spot extraction can considerably reduce HCT deviation among each samples spots, and minimized spot spreading differences caused errors [45]. Despite the elimination of HCT-related bias by using whole spot extraction, the issue of controlling spotted blood volume remains to be a dilemma because of no specified blood volume between individuals. In some laboratories, using pipet or special skills, such as Mitra micro sampling devices or pre-cut dried blood spot (PCDBS), have been performed to fix blood volume [26, 46]. However, these methods for controlling the blood volume on every DBS seem to be in conflict with the advantages of the DBS sampling (i.e., cost-effective, self-get at home, and easy collection, etc.), and may not be high-throughput for clinical use [26].
In clinical perspective, the reference ranges for TDM generally are plasma or serum concentrations ; on the contrary, drug concentrations obtained from DBS
doi:10.6342/NTU201803315
9
sampling represent whole blood concentrations. Therefore, investigating the concentration relationship between DBS and plasma samples is important for interpreting the drug concentrations from DBS. However, the lack of well-designed studies for bridging these two sampling ways is another urgent problem for widening application of DBS technique in clinical practice. The relationship between DBS and plasma or serum concentration could be constant, but there are still some factors (i.e.
HCT value, type of cards, percentage of free form drugs, etc.) to alter slope, or intercept of the regression analysis. Thus, for conquering this problems, to explore the translation ratio (deviation %) between the concentrations obtained from DBS and plasma or serum in patients is especially important [42, 47-49].
1.1.5 Exploration of a quantitative relationship between the blood and plasma DBS samples are small volumes of whole blood from capillary vascular composed of erythrocytes, serum, platelets, white blood cells, intracellular and interstitial fluids, and the composition is quite different from plasma samples [49, 50].
Therefore, the inevitable biological discrepancies could have a great influence on measuring drug concentrations. It has been suggested that patient-related factors (i.e., HCT value and blood spot volume, etc.) and variabilities between whole blood and plasma (i.e., matrix effect and distributed ratio of drug concentration between these two compartments, etc.) are main sources that lead to discrepancies between plasma and
doi:10.6342/NTU201803315
10
DBS concentrations [50]. Moreover, Emmons and Rowland proposed a decision tree to interpret drug concentrations upon measuring the samples using DBS or plasma, and the considered parameters acting as the bridging strategies on the basis of blood-to-plasma drug concentration ratio, HCT constant, and unbound drug fraction in plasma [48].
Nowadays, there are several bridging studies being carried to establish the relationship of drug concentrations between DBS sample and plasma or serum, such as antiepileptic drugs, antibiotics, as well as antidepressants and anticancer drugs [25, 42, 49]. Nevertheless, the lack of NOACs data from those former studies may restrict the development of DBS in clinical monitoring. In sum, it is important to investigate the conversion factors (deviation %) and individual affecting parameters for translating DBS to plasma or serum concentrations for NOACs [42, 47-49].
1.1.6 Current methods for quantification of NOACs in DBS
The applications of DBS to analyze drug concentrations have been reported for many clinical drugs [26]. One study reported an LC-MS method for measuring the concentration of apixaban from the DBS card [45], however, using DBS sampling for TDM in clinical has not been addressed specifically in that study. The study used a pipette or a Tecan liquid handing robot to control blood volume on the DBS card. They indicated the whole spot extraction could eliminate the effect of HCT in the analysis of apixaban more effectively than the center punch method. In addition, they used
doi:10.6342/NTU201803315
11
liquid-liquid extraction (LLE) method to minimize the matrix effect from the phospholipid in blood. Moreover, their results showed the normalized accuracy was not affected by different HCT levels when using whole spot extraction.
The other study discussed the clinical validation of four NOACs (dabigatran, apixaban, rivaroxaban and endoxaban) in DBS card by LC−MS assay [51]. The study spotted 30 μL of whole blood by a pipette and punched the fixed size for LC-MS analysis. Although this study indicated there was no concentration differences between different DBS sites, previous study reported the accuracy of apixaban would be affected by HCT values. Their sample preparation method included a 40mins extraction by 95%
methanol followed by solid-phase extraction (SPE). The extraction recoveries for four NOACs were in the range of 24-81%. They declared no HCT effect to the quantification accuracies for four drugs. In the clinical application, they used 33 paired plasma and DBS samples collected from patients under regular NOAC therapy to obtain the DBS-to-plasma conversion factors for four drugs. The result showed high correlation between two sampling methods and the predicted and measured plasma concentrations r e v e a l e d m i n i m a l d i f f e r e n c e s ( < 2 0 % ) . The previous method used an additional equipment to control blood volume on DBS card, and used LLE combined with SPE which will increase the cost, complexity and uncertainty of the measurement. Therefore, it is critical to develop a method with
doi:10.6342/NTU201803315
12
simple sample preparation procedure for simultaneously estimating blood volume, correcting matrix effect and measuring drug concentrations on DBS cards.
So far there is only one study that investigates DBS and plasma concentration correlation for NOACs, but their sample number is relatively small which restricts the applications of using DBS sampling technique in clinical practice. The establishment of an effective DBS analytical method for NOACs combining with the relationship of concentrations between DBS and plasma can significantly facilitate the use of DBS in clinical assessment and fulfill NOACs therapy in personalized medicine.
1.7 Research aims
The purpose of this research is to develop a simple and accurate LC-ESI-MS coupled with postcolumn infused-internal standard (PCI-IS) method for quantification of NOACs in DBS samples. The developed method was further validated and then applied to assess the relationship between plasma and DBS samples of NOACs.
1.2. Material and Methods
1.2.1 Chemicals and reagents
Dabigatran (purity 95%), apixaban (purity 98%), [13C, D3]-apixaban (purity 98.3%) and rivaroxaban (purity 99.5%) were purchased from Toronto Research Chemicals (Toronto, ON, Canada). [13C6]-dabigatran (purity 97%) and [13C6]-rivaroxaban (purity
doi:10.6342/NTU201803315
13
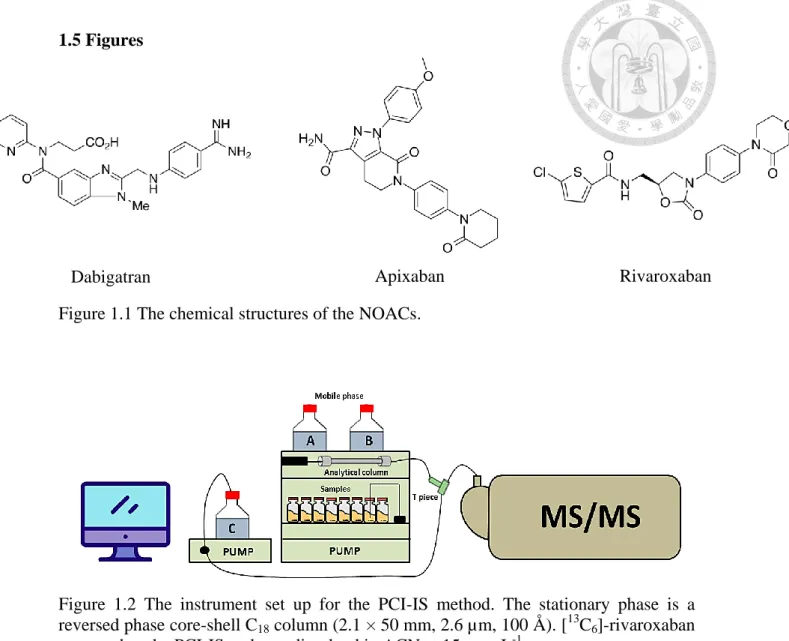
98%) were purchased from Alsachim (IllkirchGraffenstaden, France). Their chemical structures are shown in Figure 1.1 (p.35). LC-MS- grade acetonitrile (ACN) were obtained from J.T. Baker (Phillipsburg, NJ, USA). Mass-grade methanol was purchased from ScharlauChemie (Sentmenat, Barcelona, Spain). MS-grade formic acid solution (99%) was obtained from Sigma-Aldrich (St. Louis, MO, USA). Whatman 903 Protein Saver Cards (Maidstone, UK) were used for DBS sampling, and the paper is manufactured by 100% pure cotton liners without wet-strength additives. The 6 mm puncher, zip-lock bags and desiccants were purchased from local store.
1.2.2 UHPLC-ESI-MS system
The LC separations were performed using an Agilent 1290 UHPLC system coupled to a binary solvent pump, an autosampler, a sample reservoir, a column oven, and an Agilent 1260 quaternary solvent pump was used for the postcolumn infusion of the PCI-IS (Figure 1.2, p.35). The mass spectrometer was an Agilent 6460 triple quadrupole system (Agilent Technologies, Waldbronn, Germany). A Kinetex reversed phase core-shell C18 column (2.1 × 50 mm, 2.6 µm, 100 Å , Phenomenex, Torrance, CA, USA) was used for the separation. The mobile phase consisted of 0.1% formic acid in water (solvent A) and 0.1% formic acid in acetonitrile (solvent B). The flow rate was set at 0.35 min/mL. The gradient profile started with 1% B for 0.5 min, then changed to 15% B in 0.1 min and remained for 0.9 min, then increased to 100%B in 0.6 min and
doi:10.6342/NTU201803315
14
stayed for 1.4 min. Finally, the column was re-equilibrated to 1% for 1.5 min until the next injection. The total run time was 5 min. The temperature of sample reservoir was maintained at 4 , and the column oven was set at 40 . The injection volume was 3 µL.
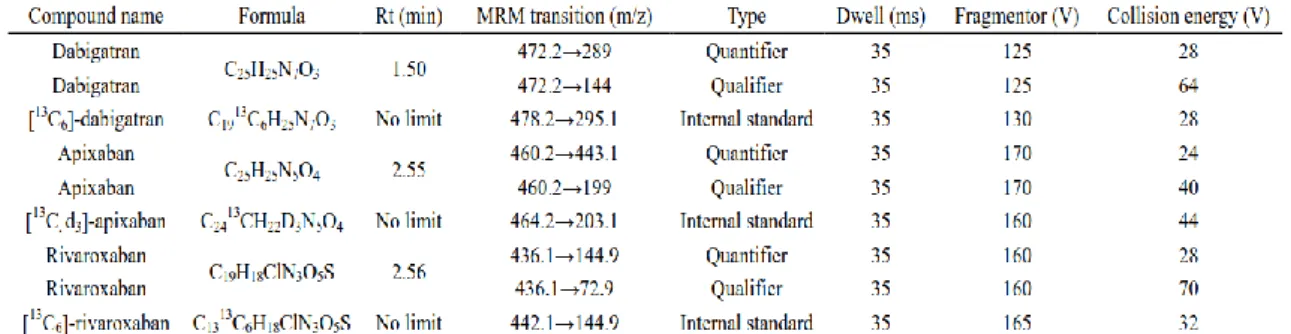
The positive electrospray ionization mode was utilized with the following parameters: 350°C dry gas temperature, 10 L min−1 dry gas flow rate, 45 psi nebulizer pressure, 350°C sheath gas temperature, 11 L min−1 sheath gas flow rate, 3500 V capillary voltage, and 500 V nozzle voltage. The MS acquisition was executed using the multiple reaction monitoring (MRM) mode and the optimized parameters for dabigatran, apixaban, rivaroxaban and the internal standards were summarized in Table 1.1 (p.42).
Two transitions were selected for each compound as quantifier and qualifier.
[13C6]-dabigatran, [13C, D3]-apixaban and [13C6]-rivaroxaban used as the PCI-IS were all dissolved in ACN at 15 ng mL-1and introduced into the ESI interface at a rate of 0.1 mL min-1.
1.2.3 Standard solutions and calibration standards
Stock solutions of dabigatran,[13C6]-dabigatran each at 1.00 mg/mL were prepared in methanol/water(9:1) containing 0.1% formic acid. Apixaban and [13C, D3]-apixaban were prepared in methanol at 1.00 mg/mL and 0.5 mg/mL, respectively.
Rivaroxaban and [13C6]-rivaroxaban were prepared in acetonitrile/water (9:1) at 1.00
doi:10.6342/NTU201803315
15
mg/mL and 0.1 mg/mL, respectively. The mix working solution of dabigatran, apixaban and rivaroxaban were prepared at 100 µg/mL by dilution of the stock solution with methanol. Calibration standards were prepared by diluting working solutions with methanol in sequence at the following concentrations:0.125, 0.5, 0.625, 1.25, 2.5, 10, 20 µg/mL for rivaroxaban and 0.25, 0.5, 1.25, 2.5, 10, 20 µg/mL for dabigatran and apixaban respectively. All of the solutions were stored at -20 .
1.2.4 Samples collection
The collections of human DBS and plasma samples were approved by the Research Ethics Committee of National Taiwan University Hospital (NTUH REC No:
201706110RIFB). The fixed 15 µL whole blood was spotted onto DBS card just after collecting the blood in EDTA-tubes. The rest of the blood sample was centrifuged to obtain plasma and then stored at -80°C until analysis. The DBS cards were dried at room temperature in the dark for 2 hours followed by placing in double-layers zip lock bag with a lime desiccant and then stored in sealed box at −20 °C until analysis.
1.2.5 DBS sample preparation
The working solution containing dabigatran, apixaban and rivaroxaban was prepared fresh on the day of analysis by dilution the stock solution with methanol. The blood samples were obtained through peripheral vein via syringe collection with EDTA tubes to prevent coagulation. To prepare spiked blood for DBS samples, 4 μL of
doi:10.6342/NTU201803315
16
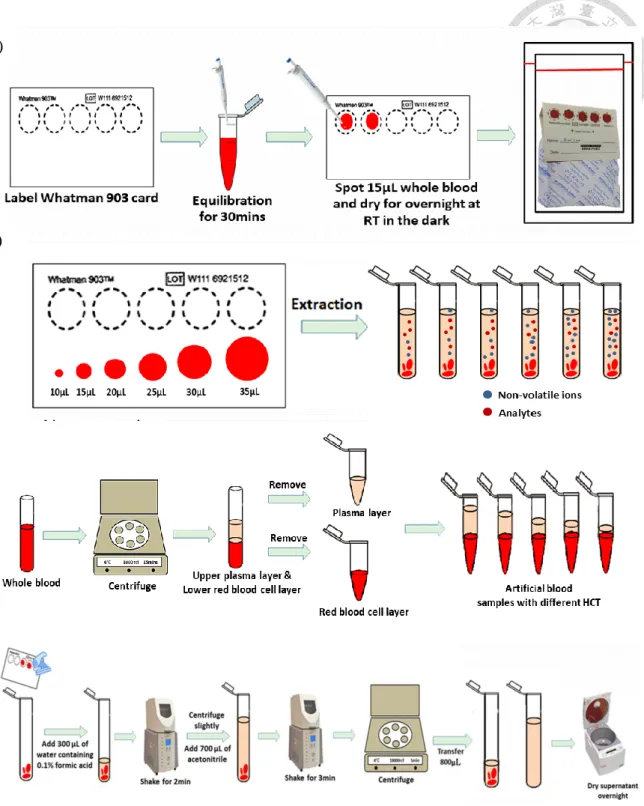
corresponding concentrations of NOACs working solution was spiked into 196 μL of whole blood and then allowed to equilibrate for 30 min at RT on the bench before spotting onto DBS cards [52]. Fifteen microliters of spiked whole blood were spotted accurately onto a Whatman 903 card by a pipette and dried at room temperature in the dark overnight (Figure 1.3 (A), p.36) [53, 54].
For the volume experiment, seven different volumes of blood samples were spotted onto DBS cards by pipetting with different blood volumes (10, 15, 20, 25, 30, 35μL) to test method accuracy (Figure 1.3 (B), p.36).
In terms of preparing samples with different hematocrit concentration levels, the whole blood samples were centrifuged at 15000 rcf for 10 min at 4 to separate the plasma from the red blood cells. The upper plasma layer and the lower red blood cell layer were then mixed or removed with different amounts to obtain artificial blood samples with specific hematocrit values (25, 35, 45, 55, 65%) (Figure 1.3 (C), p.36).
1.2.6 Dried blood spot extraction
The 6-mm diameter puncher was cleaned with 75% alcohol before utilization.
After drying, each DBS card was manually cut by puncher for several times and transferred into a clean 2.0 mL Eppendorf tube. 300 L of water containing 0.1% formic
acid was added to each tube and then shacked with a Geno/Grinder 2010 (SPEX® Sample Prep, Metuchen, NJ) for 2 min at 1000 rpm. A 700 µL aliquot of acetonitrile
doi:10.6342/NTU201803315
17
was added into the water extracted then extracted with Geno/Grinder 2010 for another 3 min. After centrifugation at 18000 rcf for 5 min, 800μL of supernatant was removed to another 2.0 mL Eppendorf tube and evaporated by using EYELA CVE-200D Centrifugal Evaporator (TOKYO RIKAKIKAI CO., Tokyo, JP) until dryness. The residue was reconstituted with methanol followed by shaking with Geno/Grinder for 2 min at 1000 rpm and sonicating for 10 min. Finally, the supernatant was filtered through a 0.2-μm PP membrane filter (RC-4, Sartorius, Göttingen, Germany) after centrifugation at 18000rcf for 5 min at 4℃ and then analyzed by UHPLC-ESI-MS (Figure 1.3 (D), p.36).
1.2.7 Method validation
Method validation was implemented according to the USFDA guidelines (Guidance for Industry: Bioanalytical Method Validation). The validation included selectivity, range of calibration curves, lower limit of quantification (LLOQ), lower limit of detection (LOD), accuracy, precision, recovery, matrix effect, carryover effect, and stability. In addition, DBS-specific parameters such as hematocrit were investigated according to the European Bioanalytical Forum (EBF).
1.2.7.1. Calibrators, LLOQ and LOD
The working solutions containing dabigatran, apixaban and rivaroxaban for preparing calibration curves were generated by series dilution of the stock solution
doi:10.6342/NTU201803315
18
(100μg mL−1) with methanol. Aliquot of working solution ranging from 20 to 0.125 μg
mL−1 was spiked to blank whole blood and then spotted on DBS cards to generate the calibration curve and each concentration was analyzed for five replicates. Calibration curves for dabigatran and apixaban were assessed with six-point levels at following concentrations : 10, 20, 50, 100, 400 and 800 ng mL−1. Calibration curves for rivaroxaban was assessed with seven-point levels at following concentrations:5, 20, 25, 50, 100, 400 and 800 ng mL −1.The three calibration curves were plotted by using linear regression of the area ratio of target analytes to PCI-IS versus the target analyte concentration and only apixaban was obtained with 1/x weighting factor. The limit of detection (LOD) and lower limits of quantification (LLOQ) were defined as the signal to noise (S/N) ratio of 3:1 and 10:1, respectively.
1.2.7.2. Extraction recovery and matrix effect
Recoveries and matrix effects were measured in triplicate for three NOACs at lower limit of quantification, low, medium, and high levels mentioned in section 2.7.1.
Recoveries were calculated by comparing the peak areas of the pre-spiked samples (NOACs were added to blank whole blood before extraction) with the peak area of the
post-spiked samples (NOACs were added to the processed blank samples). The matrix effect was measured by dividing the peak area of the post-spiked sample by the peak
area of the pure standard solution at low, medium, and high NOACs concentrations (n=
doi:10.6342/NTU201803315
19
6).
1.2.7.3. Selectivity
Selectivity was determined by analyzing blank DBS samples from seven different drug-free whole bloods under the optimized UHPLC-MS/MS conditions and extraction conditions.
1.2.7.4. Accuracy and precision
To evaluate accuracy and precision of the developed method, four concentrations of NOACs were spiked into whole blood to obtain LLOQ, low, medium, and high concentrations and then spotted to DBS cards. Concentrations for dabigatran and apixaban were 10, 25, 200, and 600ng mL−1. Concentrations for rivaroxaban were 5, 10, 200, and 600ng mL−1. Intra-day precision was determined by analyzing the spiked DBS samples for five times within the same day. For inter-day precision, three different samples per concentration were analyzed at three separate days. The results for intra-day and inter-day precision were showed as RSD (%). Intra- and inter-day accuracies were evaluated by calculating the recoveries at the four concentrations. The acceptance levels for precision and accuracy were ≤15% and 85–115% respectively, expect for the LLOQ level. The acceptance levels for precision and accuracy at LLOQ
doi:10.6342/NTU201803315
20
were ≤20% within 80–120%, respectively.
1.2.7.5. Stability
The stabilities test concentrations were 25 and 600ng mL−1for dabigatran and apixaban, and they were 10 and 600ng mL−1 for rivaroxaban. Aliquots of working solutions were added into the whole blood for preparing DBS samples. After drying overnight at room temperature in the dark, the dried DBS samples were stored in
double-layers zip lock bags with a desiccant [20, 54]. The long term stabilities were evaluated at 25 ◦C, 4 ◦C and −20 ◦C for 7 and 30 days. Fresh prepared DBS and stability samples were extracted and calculated for the recoveries. Three replicates of low and high concentration QC samples were tested and the acceptance criteria at each level should be within 15%.
1.2.7.6. Clinical application
269 DBS and plasma paired-samples for three NOACs were collected from the National Taiwan University Hospital, and these samples were used to establish the correlation for NOACs between DBS and plasma concentrations. This study was approved by the Research Ethics Committee of the National Taiwan University Hospital (registration number, 201706110RIFB), and all patients participated in this study signed informed consent prior to enrollment. To prepare paired DBS and plasma samples, fifteen microliters of blood samples were spotted on DBS cards and the rest of the blood
doi:10.6342/NTU201803315
21
samples were centrifuged at 3000 rcf for 15 min to obtain plasma samples. The DBS samples were stored at -20°C and the plasma samples were stored at −80 °C until use.
1.2.8 Data analysis
The Deming regression was generated by sigmaPlot software version 13 and statistical parameters were calculated using Excel 2010. Data obtained from the Agilent triple quadruple were converted into xls format, and processed by R software. Medcalc software version 12.3.0.0 (http:// www.medcalc.org) was used for Bland and Altman comparison plot.
1.3 Results and discussion 1.3.1 Method development
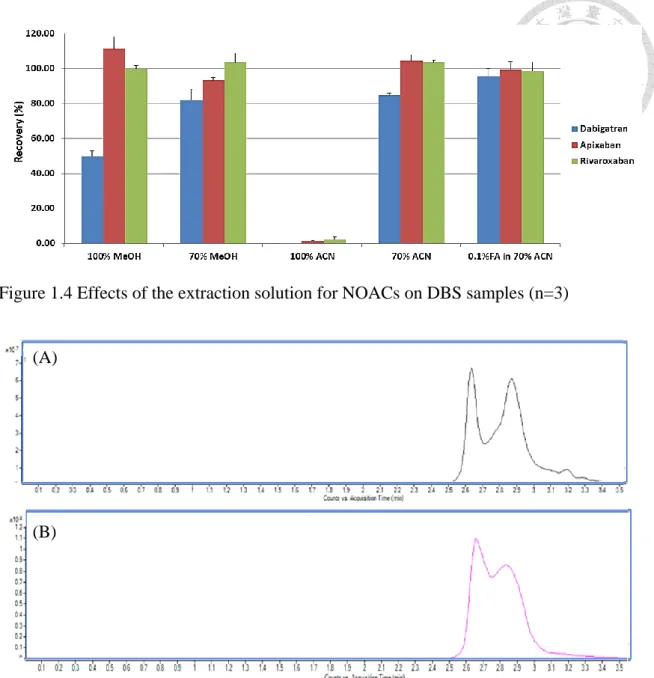
1.3.1.1 Optimization of the extraction solvent
We selected 15µL whole blood as the sampling volume due to its universality in clinical use. In addition, whole spot-cut DBS approach was performed to effectively eliminate the effects in the analysis of NOACs from different HCT levels, spot volume, and different punch sites on the same spot. To optimize the extraction recovery and develop a simple analytical method, the extraction solvent types and extraction time were discussed below. On the basis of previous studies, methanol and acetonitrile were considered as the ideal solvent to extract plasma because our target drugs are among
doi:10.6342/NTU201803315
22
low to medium lipophilicity (logP -2.4 to 2.71). We firstly compared the two water-miscible organic solvents to extract the DBS samples [18, 55-57]. The result showed that the aqueous solution was necessary for extraction, but extraction efficiency of dabigatran was only about 80% owing to its high polarity, and thus resulting in powerful bonding between hydrogen bond of dabigatran and cellulose in a DBS card.
Although a higher aqueous proportion of extraction solvent could improve recoveries for all compounds in our preliminary tests, using high percentage of water is a significant disadvantage of denaturing the protein completely. Comparing with other organic solvents, ACN (70%) was selected as the organic component because of its less viscosity for operating easily. Furthermore, formic acid was added in 70% ACN to a final concentration of 0.1% due to its ability of breaking the hydrogen bond, and also contributing to protonation on the compounds for improving mass sensitivity. Figure 1.4 (p.37) indicated the recovery of dabigatran significantly increased with the addition of 0.1% formic acid. From a previous study, sonication has been used for extracting the apixaban in the DBS sample for 10min [45], on the contrary, we applied a Geno grinder for up-down agitation vigorously at 1000 rpm to speed up the extraction process. In our preliminary study, we found that performing agitation for 3 or 5min showed similar extraction yields for three compounds. It has been reported that higher HCT levels may cause the difficulty for extraction, therefore, we finally chose 5min as the extraction
doi:10.6342/NTU201803315
23
time [26, 58]. Also, the volume of extraction solvent was investigated, and the volume of 1mL was the optimal choice because of easy operation and immersing the DBS disks thoroughly.
Interestingly, we found the increasing of storage time significantly decreased the extraction efficiency of NOACs form the DBS cards especially for dabigatran which tends to form hydrogen bond with the DBS cards (Table 1.2, p.42). The extraction recovery was improved after pre-rinsing the card by 0.1% formic acid solution before extracting by acetonitrile.
1.3.1.2 Development of UHPLC-ESI-MS combined with PCI-IS method
UHPLC-ESI-MS is considered as a favorable analytical system for quantifying the drugs in the DBSs. According to previous studies of quantification of NOACs in plasma [18, 19], a 50mm-Kinetex C18 column was selected as the analytical column. The composition of sample solution showed significant effect on peak shape and signal intensity. We found that more water in the sample solution led to a decrease in signal intensity and ACN caused double peaks due to its relatively high strength, and thus we finally selected methanol as the sample solution. This study used the first ion suppression zone to estimate blood volume on DBS spot [38], and the initial elution strength was adjusted to separate polar small-molecule components from salts in plasma.
We observed that the initial 1% ACN provided an ideal separation for salts and
doi:10.6342/NTU201803315
24
dabigatran. The remaining 0.9mins of 15% ACN was found to improve the peak shapes and separation for apixaban and rivaroxaban. Apixaban and rivaroxaban are high lipophilic compounds, and they are co-eluted at 100% ACN with phospholipids in plasma as shown in Figure 1.5 (p.37) using precursor ions of m/z 184 [59]. The co-elution with phospholipid resulted in significant matrix effect caused signal changes.
To eliminate the effect of residual phospholipids, the procedures of solid-phase extraction (SPE) or liquid-liquid extraction (LLE) have been considered as sample pre-treatment following the solvent extraction step [45, 60], however, these procedures increased cost and method complexity. This study used PCI-IS to correct the signal changes caused by the matrix effect and the PCI-IS strategy was additionally used to estimate and adjust blood volume on DBS cards. The solvent type of PCI-IS was also assessed for enhancing the sensitivity for analyzing three NOAC drugs. It was interesting that ACN was beneficial for analyzing these three compounds, and the intensity of apixaban could be even enhanced when using ACN as the PCI-IS solvent (Figure 1.6, p.38). The mass parameters were optimized for additionally improving method sensitivity. Figure 1.7 (p.38) showed the chromatograms obtained under optimal conditions. Three NOAC drugs showed good peak shape and the sensitivity could reach sub-ppb level. The high sensitivity facilitated its application in clinical analysis of NOAC drugs on DBS.
doi:10.6342/NTU201803315
25
1.3.1.3 Selection of the optimal PCI-IS
In this study, we used PCI-IS strategy to estimate blood volume and calibrate matrix effect cased signal changes in ESI. Ideal PCI-ISs for calibrating matrix effect are the structural analogs of the target compounds possessing the same hydrophilicity, lipophilicity and ionization ability as target analytes [61]. Isotopically labeled internal standards (SIL-ISs) of dabigatran, apixaban and rivaroxaban were used as the PCI-ISs for comparison their blood volume estimation and matrix effect calibration performances. Firstly, the infusion rate and concentration of the PCI-IS were optimized to acquire an appropriate sensitivity and could clearly revealed the matrix effect. We found that the sensitivity of analytes was decreased while increasing the flow rate.
Finally, we selected the concentration and flow rate of the PCI-IS as 15 ngmL−1 and 0.1 mLmin−1, respectively.
1.3.1.3.1 Using the different PCI-IS to estimate Blood Volume on DBSs
The PCI-IS was firstly evaluated for its performance in estimation blood volume.
Using PCI-IS method, we measured the extend of ion suppression and built a linear correlation between the blood volume from DBSs (X axis) and the reciprocal of the minimum responses at the first ion suppression zone (Y axis). The ion suppression zone in high aqueous phase was mainly caused by nonvolatile salts including sodium, potassium, and the chloride ion in the blood, so we could estimate the blood volume by
doi:10.6342/NTU201803315
26
salts-induced ion suppression on the PCI-IS chromatogram. The blood volumes on DBS cards are generally between 10 to 20µL. Therefore, we generated a linear regression from 10 to 35µL and found the high correlations of calibration curves for [13C,D3]-apixaban and [13C6]-rivaroxaban. However, using [13C6]-dabigatran as PCI-IS showed no significant salts-induced ion suppression along with differential blood volumes. To prove its universality estimation performance, seven DBS samples obtained from different individuals were used to calculate the blood volume estimation accuracy by the pre-constructed calibration curves. Our results showed that the accuracies of [13C, D3]-apixaban and [13C6]-rivaroxaban for volume estimation were within 80.3% to 123.8% and within 87.1% to 119.8%, respectively (Table 1.3, p.43).
Hence, we chose these two PCI-ISs to further evaluate their correction performances for matrix effect caused signal changes.
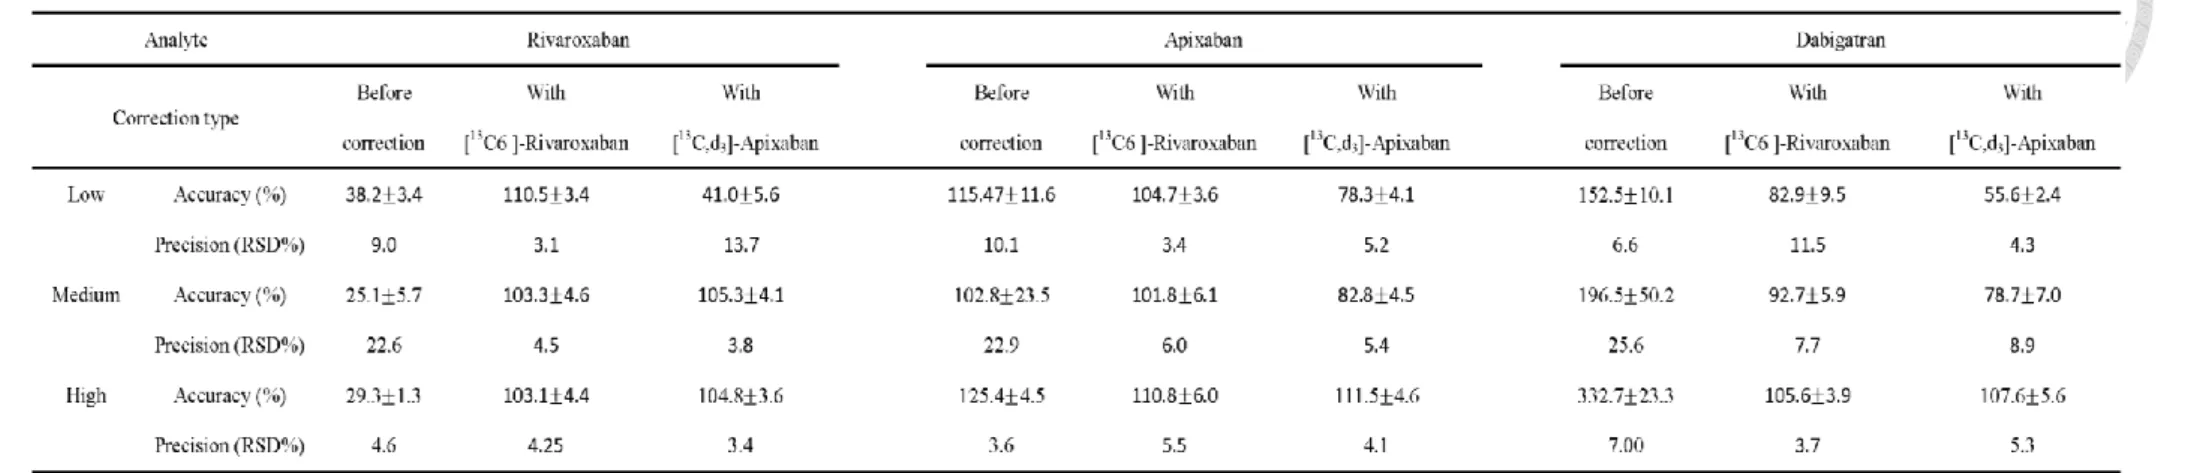
1.3.1.3.2 Selection of the PCI-IS for improving quantification accuracy
We compared the quantitative accuracy and precision (RSD%) of target
compounds with and without correction by PCI-ISs using three DBS samples. The
correction efficiency was evaluated at three concentrations, and the comparison of
correction performances is presented in Table 1.4 (p.44). Prior to PCI-IS correction, we
found that the precisions for all analytes were higher than 20% at medium
concentrations, and the accuracies of rivaroxaban and dabigatran at three concentrations
doi:10.6342/NTU201803315
27
were lower than 40% and higher than 150%, respectively. While applying [13C, D3]-apixaban as PCI-IS for correction, the accuracies for rivaroxaban and dabigatran were not noticeably improved at low concentration. On the other hand, using
[13C6]-rivaroxaban as PCI-IS for correction significantly improved the accuracies for all of the NOACs to approximately 83-110% and RSD was less than 12%. On the basis of
the above accuracy and precision results, [13C6]-rivaroxaban was considered as an effective PCI-IS to correct the matrix effects for three NOACs and estimate blood
volumes on DBSs simultaneously.
1.3.1.4 Evaluation of the HCT effect
It has been reported that different HCT levels could affect spot volume on the filter paper as well as the drug distribution between blood and plasma. In addition, the extraction efficiency of examined drugs would generate potential assay bias with varying HCT values. Accordingly, Youhnovski et al. reported the recovery of naproxen depending on HCT values [58], and Kosteret al. indicated that different HCT affected the recovery of sirolimus and everolimus [62]. Although many studies demonstrated that the internal standard could be spotted or sprayed before extraction, these procedures were more complicated to carry out for clinical use [32, 63].
To investigate the influence of the HCT in quantitative analysis, HCT levels
between 25%, to 65% were manually prepared according to the procedures described in
doi:10.6342/NTU201803315
28
the method section.
To study the effect of HCT on the extraction recovery, we used our optimized extraction method to test whether the recovery would fluctuate with varying HCT values. Our results revealed that the overall recoveries were ranged from 81-102% at two tested concentrations. We also observed that the matrix effect of rivaroxaban slightly decreased with increasing the HCT values (Table 1.5, p.45).
Before studying the effect of HCT on quantification of drug concentration, we
evaluated the quality of our method in preparing samples with different HCT values.
Firstly, using our DBS sample preparation method, the overall percentage RSD of drugs
distribution in the whole blood. Table 1.6 (p.45) showed the % RSD of response ratios
of three drugs at all HCT levels were all less than 15% indicating that this method was valid for the following experiments. After confirming the preparation method, the HCT
of 45% was set as the standard HCT values to compare with other HCT values because it is close to the population mean [40, 64] and the biases were acceptable within 15%
[65, 66].
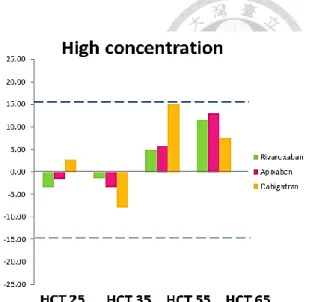
HCT effect on quantification accuracy was evaluated at two concentrations.
Figure 1.8 showed dabigatran with HCT level of 55% was observed a highest deviation
of 14.98%. Apixaban and rivaroxaban showed the highest deviation of 11.63% and
12.91%, respectively (Figure 1.8, p.39) at HCT of 65%. Nevertheless, the overall bias
doi:10.6342/NTU201803315
29
data was within acceptable limit of 15% bias, and the RSD values of corrected mean
peak area among different HCTs were lower than 9% (Table 1.6, p.45). Therefore, we
concluded that HCT range among 25%-65% showed no significant HCT effect on
NOAC quantification.
Some studies reported that the distributive phenomenon of drugs depends on its permeability [50, 67], for example, the highly protein-bound drugs located only a low percentage in erythrocytes. Moreover, immunosuppressive drugs were predominantly distributed in erythrocytes (>70 % for all) through immunophilins, a specific proteins in RBCs [68]. On the other hand, Emmons and Rowland proposed some underlying factors might affect the blood-to-plasma distribution including saturable protein binding or blood composition change [48]. And these characters would influence the design of bridging studies. Previous studies indicated apixaban and dabigatran showed no specific distribution in erythrocytes [45], and our results are similar to the previous observations.
1.3.2 Method validation 1.3.2.1 Selectivity
Selectivity of this method was assessed by analyzing six blank DBS from different sources. Under optimized method, no endogenous interferences in extracts overlapped significantly with the target analytes and internal standards at the same retention time.
doi:10.6342/NTU201803315
30
1.3.2.2 Recovery, matrix effect, precision, and accuracy
The developed method was validated by extracting the mixture of NOACs on the
DBS samples at LLOQ, low, medium, and high concentrations. The results were summarized in Table 1.7(A) (p.46). For the recovery of the extraction procedures, the results were ranged between 95.5 1.5 and 114.0 6.9%. However, the matrix effects were between 22.5 4.4 and 86.8 12.3 % indicating a significant ion suppression.
Apixaban and rivaroxaban were co-eluted with blood lipids and were suffered from significant MEs. The MEs for apixaban and rivaroxaban at three concentrations were ranged among 22.0-36.37% and 23.5-25.0%, respectively.
The precision and accuracy were evaluated at LLOQ, low, medium, and high concentrations. The within-run and between-run accuracies of three NOACs in DBS were ranged within 88.9-104.3%. The RSD values of repeatability and intermediate precision were all below 10%. According to the results, we concluded that our method can provide accurate quantification for measuring dabigatran, apixaban and rivaroxaban in DBS samples within the concentration range shown in this study.
1.3.2.3 Linearity, LLOQ and LOD
The mixture of NOACs-spiked DBS samples was used to build calibration curves and the linear rage was designed according to the therapeutic range in human plasma [11, 16]. The linear regression data was showed in Table 1.7(B) (p.46). The coefficients
doi:10.6342/NTU201803315
31
of determination (R2) values were greater than 0.99 for all the calibration curves. From these three analytes in DBS samples, the LLOQ were 0.3 ng mL−1 for rivaroxaban, and 0.6 ng mL−1 for both dabigatran and apixaban. The LLOQ was sufficient for therapeutic concentrations of the three NOACs. LOD was 0.03 ng mL−1 for rivaroxaban and 0.015 ng mL−1 for both dabigatran and apixaban.
1.3.2.4 Stability
Previous studies reported that the stabilities for three NOACs in whole blood were stable within acceptable range, but the concentration of dabigatran slightly decreased after 2 hours storage at 25 °C (near 80%) [69]. And the freeze-thaw stability of NOACs in plasma showed significant decreased in concentration for dabigatran and apixaban.
The stability study of NOAC in whole blood showed only low concentration of dabigatran slightly decreased (~85%) after 4 hours storage at RT (Table 1.8(A), p.47).
The long-term stability of low and high concentration of NOACs in DBS samples revealed all compounds were stable after one month storage at all studying temperature (Table 1.8(B), p.47). We therefore could conclude DBS sampling strategy could improve the stability of NOAC in blood samples.
1.3.2.5 Clinical sample analysis
In order to find the conversion factors and establish the relationships between
doi:10.6342/NTU201803315
32
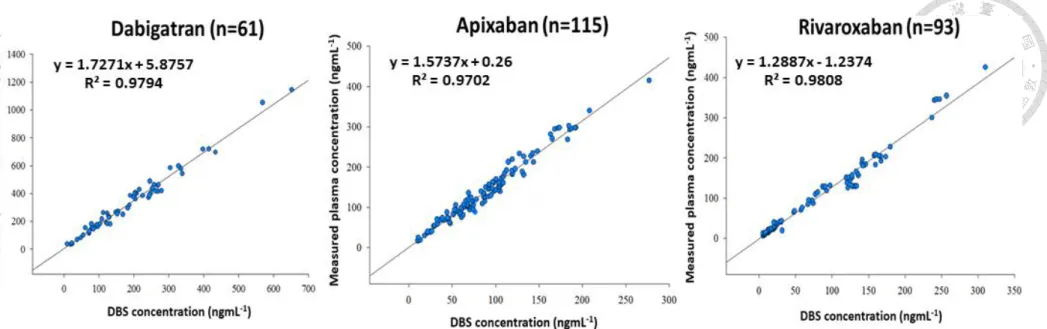
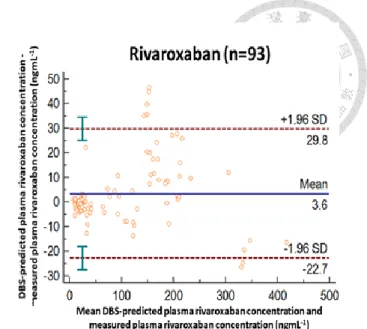
NOACs concentrations in DBS and plasma samples, we collected the paired plasma and DBS samples (n=269) from patients undergoing NOACs treatment. The correlation plots for dabigatran (n=61), apixaban (n=115) and rivaroxaban (n=93) in DBS and plasma were shown in Figure 1.9 (p.40). The correlation analysis revealed three NOACs showed good linear relationship between DBS and plasma concentrations with the Pearson correlation coefficient (R2) being 0.979, 0.970 and 0.981 for dabigatran, apixaban, and rivaroxaban. The slopes of three calibration curves were within 1.3-1.7 which indicated the drug concentrations in DBS samples were lower than their respective paired plasma samples. The conversion factors were therefore incorporated for translation DBS concentrations to plasma concentrations [70, 71]. Conversion factors calculated from the ratios between plasma and DBS concentrations of dabigatran, apixaban and rivaroxaban were 1.81, 1.59 and 1.31, respectively. Figure 1.10 (p.41) shows the Bland Altman plots for three drugs. The mean differences between DBS and plasma concentrations for dabigatran, apixaban and rivaroxaban were 10.7, -6.1 and 3.6 ngmL-1 respectively. Moreover, over 90% of the calculated concentrations were within the 95% confidence interval (CI) of bias. Emmons and Rowland have indicated most high plasma protein binding drugs were predominantly distributed in plasma and the erythrocytes were served as the diluent in DBS samples [48, 67]. Our observation showed agreement with their study that apixaban and rivaroxaban which present
![Table 1.3 Correlation between the reciprocal of minimum responses at the first ion suppression zone of the PCI-IS chromatograms and the DBS blood volume for 2 tested PCI-ISs ([ 13 C , d 3 ]-apixaban and [ 13 C 6 ]-rivaroxaban) and the estimation accuracy](https://thumb-ap.123doks.com/thumbv2/9libinfo/9599078.628582/58.1262.469.1135.263.425/correlation-reciprocal-responses-suppression-chromatograms-apixaban-rivaroxaban-estimation.webp)