含鉻酵母
、
膳食纖維配方對於第2型
糖尿病患營養及生理狀況的影響
台北醫學大學保健營養學系
李依連、陳君婷、楊淑惠
#研究動機
討論
研究結果
材料與方法
近年來糖尿病的盛行率已逐漸提高,飲食控制對於
糖尿病的治療上非常重要。研究指出膳食纖維可延
緩血糖並改善血脂肪,鉻酵母也與調節血糖有關。
本研究目的第2型糖尿病患的飲食中,以含有鉻酵
母的配方,了解其生理狀況的變化。
受試者進行6個月的飲食介入,以3天之24小時飲食
回憶紀錄評估受試者飲食。
研究共分為2個部份。第一部份,測量實驗配方的
昇醣指數和第二部份,為期6個月的飲食介入實
驗。
昇醣指數實驗中,受試者攝取相當於50公克醣類的
葡萄糖水、白吐司、試驗配方,測量血糖及其含鉻
配方之昇醣指數。第二部份共有受試者30名,每天
持續服用藥物且不改變藥量,以每日攝取50公克共
177大卡的含鉻營養品取代一般飲食熱量,其中含
鉻200微克、膳食纖維7.2公克,為期24週,並於第
0、1、3、6、7個月收集血液樣本分析,項目包括
空腹血糖、糖化血色素、三酸甘油酯、總膽固醇、
低密度脂蛋白膽固醇、高密度脂蛋白膽固醇、及營
養狀況分析。
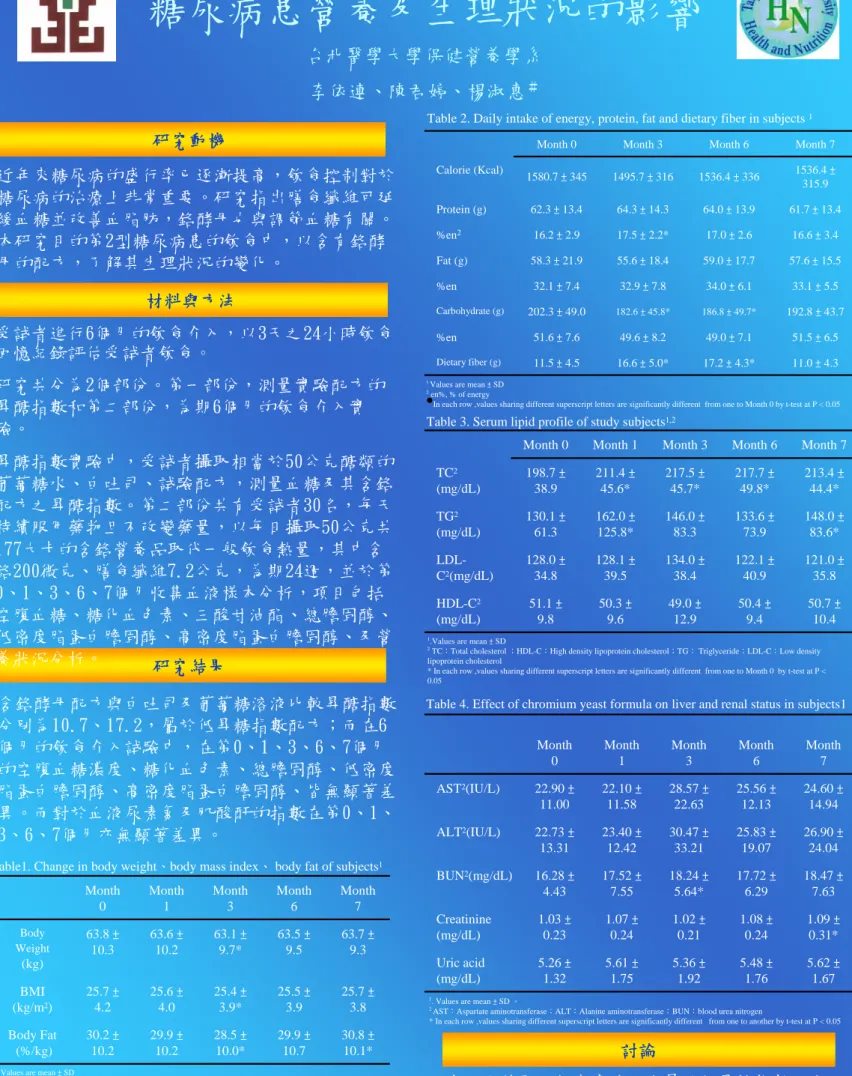
含鉻酵母配方與白吐司及葡萄糖溶液比較昇醣指數
分別為10.7、17.2,屬於低昇糖指數配方;而在6
個月的飲食介入試驗中,在第0、1、3、6、7個月
的空腹血糖濃度、糖化血色素、總膽固醇、低密度
脂蛋白膽固醇、高密度脂蛋白膽固醇、皆無顯著差
異。而對於血液尿素氮及肌酸酐的指數在第0、1、
3、6、7個月亦無顯著差異。
Table 2. Daily intake of energy, protein, fat and dietary fiber in subjects 1
11.0 ± 4.3 17.2 ± 4.3* 16.6 ± 5.0* 11.5 ± 4.5 Dietary fiber (g) 51.5 ± 6.5 49.0 ± 7.1 49.6 ± 8.2 51.6 ± 7.6 %en 192.8 ± 43.7 186.8 ± 49.7* 182.6 ± 45.8* 202.3 ± 49.0 Carbohydrate (g) 33.1 ± 5.5 34.0 ± 6.1 32.9 ± 7.8 32.1 ± 7.4 %en 57.6 ± 15.5 59.0 ± 17.7 55.6 ± 18.4 58.3 ± 21.9 Fat (g) 16.6 ± 3.4 17.0 ± 2.6 17.5 ± 2.2* 16.2 ± 2.9 %en2 61.7 ± 13.4 64.0 ± 13.9 64.3 ± 14.3 62.3 ± 13.4 Protein (g) 1536.4 ± 315.9 1536.4 ± 336 1495.7 ± 316 1580.7 ± 345 Calorie (Kcal) Month 7 Month 6 Month 3 Month 0
1 Values are mean ± SD 2en%, % of energy
•
In each row ,values sharing different superscript letters are significantly different from one to Month 0 by t-test at P < 0.05Table1. Change in body weight、body mass index、 body fat of subjects1
30.8 ± 10.1* 29.9 ± 10.7 28.5 ± 10.0* 29.9 ± 10.2 30.2 ± 10.2 Body Fat (%/kg) 25.7 ± 3.8 25.5 ± 3.9 25.4 ± 3.9* 25.6 ± 4.0 25.7 ± 4.2 BMI (kg/m2) 63.7 ± 9.3 63.5 ± 9.5 63.1 ± 9.7* 63.6 ± 10.2 63.8 ± 10.3 Body Weight (kg) Month 7 Month 6 Month 3 Month 1 Month 0 1.
Values are mean ± SD
* In each row, values sharing different superscript letters are significantly different from one to Month 0 by t-test at p < 0.05
Table 3. Serum lipid profile of study subjects1,2
50.7 ± 10.4 50.4 ± 9.4 49.0 ± 12.9 50.3 ± 9.6 51.1 ± 9.8 HDL-C2 (mg/dL) 121.0 ± 35.8 122.1 ± 40.9 134.0 ± 38.4 128.1 ± 39.5 128.0 ± 34.8 LDL-C2(mg/dL) 148.0 ± 83.6* 133.6 ± 73.9 146.0 ± 83.3 162.0 ± 125.8* 130.1 ± 61.3 TG2 (mg/dL) 213.4 ± 44.4* 217.7 ± 49.8* 217.5 ± 45.7* 211.4 ± 45.6* 198.7 ± 38.9 TC2 (mg/dL) Month 7 Month 6 Month 3 Month 1 Month 0
1.Values are mean ± SD
2TC:Total cholesterol ;HDL-C:High density lipoprotein cholesterol;TG: Triglyceride;LDL-C:Low density
lipoprotein cholesterol
* In each row ,values sharing different superscript letters are significantly different from one to Month 0 by t-test at P < 0.05
Table 4. Effect of chromium yeast formula on liver and renal status in subjects1
5.62 ± 1.67 5.48 ± 1.76 5.36 ± 1.92 5.61 ± 1.75 5.26 ± 1.32 Uric acid (mg/dL) 1.09 ± 0.31* 1.08 ± 0.24 1.02 ± 0.21 1.07 ± 0.24 1.03 ± 0.23 Creatinine (mg/dL) 18.47 ± 7.63 17.72 ± 6.29 18.24 ± 5.64* 17.52 ± 7.55 16.28 ± 4.43 BUN2(mg/dL) 26.90 ± 24.04 25.83 ± 19.07 30.47 ± 33.21 23.40 ± 12.42 22.73 ± 13.31 ALT2(IU/L) 24.60 ± 14.94 25.56 ± 12.13 28.57 ± 22.63 22.10 ± 11.58 22.90 ± 11.00 AST2(IU/L) Month 7 Month 6 Month 3 Month 1 Month 0
1. Values are mean ± SD 。
2 AST:Aspartate aminotransferase;ALT:Alanine aminotransferase;BUN:blood urea nitrogen
* In each row ,values sharing different superscript letters are significantly different from one to another by t-test at P < 0.05