國立交通大學
顯示科技研究所
碩士論文
藉由相對敏感度作為評估色分離現象之指標
Color Break-up Evaluation
by Relative Contrast Sensitivity Index
研究生:易宛徵
指導教授:謝漢萍 教授
、
黃乙白 助理教授
藉由相對敏感度作為評估色分離現象之指標
Color Break-up Evaluation
by Relative Contrast Sensitivity Index
研究生:易宛徵 Student : Wan-Cheng Yi
指導教授:謝漢萍
Advisor : Han-Ping D. Shieh
黃乙白 Yi-Pai Huang
國立交通大學
顯示科技研究所
碩士論文
A Thesis
Submitted to College of Electrical and Computer Engineering
National Chiao Tung University
in partial Fulfillment of the Requirements
for the Degree of
Master
in
Display Institute
June 2008
Hsinchu, Taiwan
Republic of China
中華民國九十七年六月
藉由相對敏感度作為評估色分離現象之指標
碩士研究生:易宛徵 指導教授:謝漢萍、黃乙白
國立交通大學 顯示科技研究所
中文摘要
色序法成像原理是利用多原色場在人眼視覺暫留的時間內所提
供的光刺激累加而合成彩色的圖像。雖然色序法成像具有比目前其他
的顯示技術具有更好的顯色特性,卻存在著一個潛在的色分離(CBU),
會降低顯示影像的品質,是一個不可忽視的現象。
目前許多色分離的研究偏重於形成機制與解決方法,較少著墨於
色分離程度之量化,故此,本研究提出相對對比敏感度(RCS)評估色
分離效應的感知。藉由視覺的對比敏感函數計算合成的色分離影像之
相對對比敏感度,在高關係係數下證明相對對比敏感度可作為色分離
之量化指標。最後利用液晶顯示器特性與色分離基礎,將此指標應用
在色序法液晶顯示器上以抑制色分離,提升影像品質。
Color Break-up Evaluation
by Relative Contrast Sensitivity Index
Student: Wan-Cheng Yi
Advisors: Prof. Han-Ping D. Shieh and Prof. Yi-Pai Huang
Display Institute
National Chiao Tung University
Abstract
Field-sequential-color (FSC) image formation mechanism, which displays
multi-primary color fields in temporal sequence to form a full-color image. However,
color break-up (CBU) or rainbow effect, is a latent artifact in FSC-type displays to
degrade visual quality, and has been investigated in the past decades.
Many researches of CBU attributed to formation mechanism and resolution. A
suitable methodology or an index for quantifying CBU, however, was not
well-developed yet. In order to describe CBU, the relative contrast sensitivity (RCS)
was proposed to evaluate the sensibility of CBU. RCSs of synthesized CBU images
were computed using means of vision-based contrast sensitivity function (CSF). High
correlation coefficient between the calculated RCSs and the psychophysical
experiment results, that RCS was an applicable candidate as a CBU index. Finally,
RCS could be incorporated in the development of CBU suppression methods as a
Acknowledgement
In my two-year graduate life, I am especially grateful to my advisor- Professor Han‐ Ping David Shieh, who gave me many valuable advices and abundant resources. After this two-year research, I am very interested in this research field of display technology. Besides, I also appreciate Professor Yi-Pai Huang, who gave me many useful feedbacks and valuable suggestions when I had problems.
Besides, my senior classmates, Yu-Kuo Cheng and Fang-Cheng Lin also spent much time discussing the design of experiment with me. All my classmates helped me a lot in my life and all my junior classmates helped me a lot in my experiments. Our secretaries, particularly Vivian Ni, also aided me a lot in administration affairs. I also thank engineers and managers in CPT.
Finally, I owe a great deal to my parents and my younger brother for their support during these days. Without these people, this thesis would never have been finished.
Table of Contents
Chapter 1 Introduction ... 1
1.1 Field-Sequential-Color Liquid Crystal Display (FSC LCD) ... 1
1.2 Color Break-up Phenomenon ... 3
1.3 Motivation and Objective ... 4
1.4 Organization ... 5
Chapter 2 Principle ... 6
2.1 Human Color Vision ... 6
2.1.1 Opponent-Color Theory ... 6
2.1.2 Spatial and Temporal Properties of Color Vision ... 7
2.2 Categories of Eye Movement ... 10
2.2.1 Saccade ... 10
2.2.2 Smooth Pursuit ... 11
2.3 Mechanism of Color Break-up ... 12
2.3.1 Stationary Image (Static CBU) ... 13
2.3.2 Moving Image (Dynamic CBU) ... 13
2.4 Qualitative and Quantitative Analysis Methods of CBU... 14
2.4.1 Subjective Evaluation ... 14
2.4.2 Analysis Dynamic CBU using △E ... 15
2.4.3 Precise Recording ... 16
2.5 CBU Suppression Methods ... 17
2.5.1 Field Rate Increasing ... 17
2.5.2 Multi-primary Color Fields ... 19
2.5.3 Motion Compensation ... 20
Chapter 3 Proposed CBU Evaluation Index... 23
3.1 Relative Contrast Sensitivity (RCS) Index ... 23
3.1.1 Device Independent and Opponent Color Transformation ... 24
3.1.2 Spatial Filtering via Frequency Modulation ... 27
3.2 The Pearson Correlation Coefficient ... 29
3.3 Modeling ... 31
3.4 Summary ... 32
Chapter 4 Psychophysical Experiments ... 33
4.1 One-Dimensional Psychophysical Evaluation ... 33
4.2 One-Dimensional Experimental Results and Analyses Using RCS Index ... 35
4.3 Two-Dimensional Psychophysical Evaluation ... 38
4.4 Two-Dimensional Experimental Results and Analyses Using RCS Index ... 40
4.5 Summary ... 45
Chapter 5 Relative Contrast Sensitivity (RCS) Index Verifications... 47
5.1 Relative Contrast Sensitivity (RCS) Verifications on Various Multi-primary Color Fields ... 47
5.2 Relative Contrast Sensitivity (RCS) Verifications on Various Color Sequences ... 50
5.3 Relative Contrast Sensitivity (RCS) Verifications on Complex images .. 52
5.4 Summary ... 54
Chapter 6 Conclusions and Future Works ... 55
6.1 Conclusions ... 55
6.2 Future Works ... 56
List of Tables
Table 1 Parameters for chrominance CSFs. ... 28 Table 2 Interpretation of the correlation coefficient. ... 30 Table 3 Mean Opinion Score (MOS) method used for subjective evaluation. ... 31 Table 4 Characteristics of each subject using one-dimensional psychophysical
evaluation for static images. ... 35 Table 5 The correlation coefficient between RCS and InD-CBUA, and between
RCS and MOS, respectively, as a function of object luminance, Lt (nits). ... 38 Table 6 Characteristics of each subject using two-dimensional psychophysical
evaluation for static images. ... 40 Table 7 The correlation coefficient between RCS and InD-CBUA, as a function of
object luminance, Lt (nits), shifted direction and viewing distance (the multiple of diagonal screen size). ... 45 Table 8 The gray level of each color ... 48 Table 9 The relationship between RCS and RMOS with various multi-primary color
fields and testing image. ... 49 Table 10 The correlation coefficient between RCS and RMOS, as a function of
colors for testing images. ... 52 Table 11 The relationship between RCS and moving velocity with various complex
Figure Captions
Fig. 1 The features of (a) color TFT LCD and (b) color FSC LCD. ... 2 Fig. 2 Timing chart in the FSC LCD with TFT addressing. ... 3 Fig. 3 (a) A stationary image and (b) the perceived image with CBU due to relative
motion in the FSC display... 4 Fig. 4 The encoding of cone signals into opponent-colors signals in the human
visual system. ... 7 Fig. 5 Spatial contrast sensitivity functions for luminance and chromatic contrast. .. 8 Fig. 6 Temporal contrast sensitivity functions for luminance and chromatic contrast.
... 9 Fig. 7 An example of saccadic eye movement. ... 11 Fig. 8 Diagram of smooth pursuit. ... 12 Fig. 9 (a) The path of a saccade on a FSC LCD and (b) observed CBU during or
after the saccade. ... 13 Fig. 10 (a) Moving image along the moving direction and (b) the mechanism of CBU.
... 14 Fig. 11 (a) Normal color transition and (b) Color Break-up transition. ... 15 Fig. 12 Color variation route in L*u*v* color space ... 16 Fig. 13 Target virtual display, the two-axis tilting mirror and the 90° deflecting
C-mount optics. ... 17 Fig. 14 Relation between the time and the location of moving image on single field
rate... 18 Fig. 15 Relation between the time and the location of moving image on double field
rate... 18 Fig. 16 Simulation results on white or whitish magenta solid rectangles moving
towards right on a black background. ... 20
Fig. 17 Schematic plot of motion compensation. ... 21
Fig. 18 A crossing object is moving from left to right at speed S and the observer’s eye is tracing from right to left at speed M. ... 21
Fig. 19 Flow chart of computing relative contrast sensitivity (RCS). ... 23
Fig. 20 The effect of correlation coefficient with different weights of achromatic channel. ... 24
Fig. 21 The Electro-Optical Transfer Function of a 32-inch FSC LCD. ... 25
Fig. 22 AC1C2 opponent response functions... 26
Fig. 23 AC1C2 Representation of Image (Pseudo-Color). ... 26
Fig. 24 Frequency filter for luminance channel, approximating the human contrast sensitivity function (CSF). ... 28
Fig. 25 Normalized Opponent Color Contrast Sensitivity. ... 29
Fig. 26 2D Chrominance Filters for (a) Red-Green channel and (b) Blue-Yellow channel. ... 29
Fig. 27 Schematic plot of CBUA. ... 32
Fig. 28 Schematic of the one-dimensional psychophysical experiment apparatus for saccade. ... 34
Fig. 29 Threshold distance of psychophysical evaluation with dark environment on a 32-inch FSC LCD. ... 35
Fig. 30 InD-CBUA of psychophysical evaluation with dark environment on a 32-inch FSC LCD. ... 36
Fig. 31 The relationship between RCS and MOS with various target luminance. ... 37
Fig. 32 The relationship between RCS and InD-CBUA with various target luminance. ... 37 Fig. 33 Schematic of the two-dimensional psychophysical experiment apparatus for
saccade. ... 39 Fig. 34 Schematic plot for 2D representation. ... 39 Fig. 35 Schematic plot of InD-CBUA distribution. CBU shifted in the x-direction
with target luminance at (a) 100 and (b) 400 nits on a 32-inch FSC LCD. ... 41 Fig. 36 Schematic plot of InD-CBUA distribution. CBU was shifted in the
y-direction with target luminance at (a) 100 and (b) 400 nits on a 32-inch FSC LCD... 42 Fig. 37 Schematic plot of RCS distribution. CBU was shifted in the x-direction with target luminance at (a) 100 and (b) 400 nits on a 32-inch FSC LCD. ... 43 Fig. 38 Schematic plot of RCS distribution. CBU was shifted in y-direction with
target luminance at (a) 100 and (b) 400 nits on a 32-inch FSC LCD. ... 44 Fig. 39 The relationship between RCS and RMOS with various testing images for
Chapter 1 Introduction
1.1
Field-Sequential-Color Liquid Crystal Display (FSC LCD)
Liquid Crystal Display (LCD) has been globally popularized for displaying various kinds of information, because it is thinner and lighter than the Cathode Ray Tube (CRT) display. Furthermore, the power consumption of LCD is also lower than that of CRT. The
configuration of conventional LCD using spatial color formation mechanism, as shown in Fig.
1(a), to represent color has been developed using a combination of Liquid Crystal (LC) cell,
Color Filter (CF), and Cold Cathode Fluorescent Lamp (CCFL) backlight. A single pixel consists of three sub-pixels, red (R), green (G), and blue (B) in conventional LCDs. Under suitable viewing conditions, each sub-pixel is indistinguishable and the light from each sub-pixel is seen as emitting form a single pixel. However, conventional LCDs have some drawbacks in regards light efficiency. Conventional LCD is only one third of the total light transmittance from backlights. Additional high power light sources must be used in order to increase system luminance.
However, images have become higher quality and higher resolution, thus LCDs require higher resolution to maintain image quality. In the Field-Sequential-Color (FSC) LCD, when using three-fields, each frame is temporally divided into R, G, and B. By sequentially displaying R, G, and B fields fast enough, a full color image can be perceived. Therefore, the temporal color formation mechanism is widely used in all kinds of information displays to
(a) (b)
Fig. 1 The features of (a) color TFT LCD and (b) color FSC LCD.
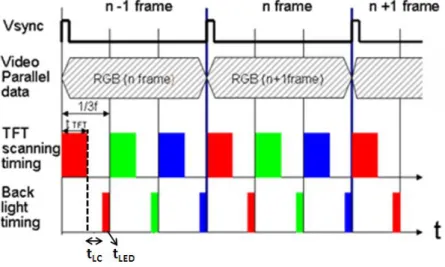
Unfortunately, FSC LCDs are required to have a much faster response time for LC molecules and backlight than in the conventional LCDs. Therefore, in order to drive FSC displays, a driving schedule for scanning data, LC response, and backlight flashing time are
important. The timing chart is shown in Fig. 2. FSC display has a data loading time (tTFT) and
an illumination time (tBL) for each of color field. An additional setting time (tLC) related to the
characteristic response time of liquid crystal is also required. As shown in Eq. (1), scanning
the whole panel, LC response, and the backlight flash must be completed within one field time 1/3f.
1
3f = tTFT + tLC + tBL (1)
where f is the frame frequency, tTFT is the scanning time for the whole panel, and tLC is LC
Fig. 2 Timing chart in the FSC LCD with TFT addressing.
However, the fluorescent lamp is normally difficult to use for pulse operations, because mercury vapor pressure drops during the blanking duration and light output is decreased as a result. The fluorescence decay times for R and G phosphors used in a conventional fluorescent tube are not fast enough for the FSC display. Therefore, LEDs are used in FSC LCDs because they satisfy faster response times for color sequential operation. In addition, the emission spectra of LEDs are suitable for displaying color purity.
Using the current FSC platform, a color-filter-less LCD with R, G, and B LEDs as light
sources was developed [4]. Optical Compensation Band (OCB) mode LC was proposed to
achieve a field rate of 180Hz for a fast response. The 32-inch screen with resolution 1366*768 pixels and LEDs were used in 20*12 array layout. Finally, the maximum brightness was 407.78 cd/m2 and the color gamut was 125% compared with the NTSC standard.
1.2 Color Break-up Phenomenon
Color Break-up (CBU), or the rainbow effect, is known as a latent artifact in FSC LCDs
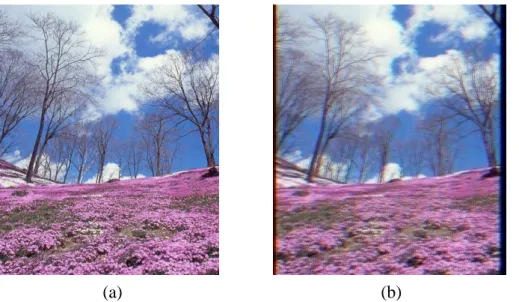
in degrading visual quality [5-9]. An illustration of CBU is shown in Fig. 3. CBU occurs
when there is a difference in the relative motion between the object within the image and the observer’s eyes.
(a) (b)
Fig. 3 (a) A stationary image and (b) the perceived image with CBU due to relative motion in the FSC display.
1.3 Motivation and Objective
Since CBU is an intrinsic visual artifact, it degrades the image quality and causes visual discomfort. Therefore, topics related to CBU in FSC displays have been an important research themes in both the academic and industrial communities. The major subjects of CBU phenomenon can be classified into formation mechanism, quantitative analysis, and resolution. While formation mechanism and resolution have gained numerous results, a methodology or an index for defining CBU quantitatively has not been commonly acknowledged.
Using either the CIELAB color difference or the CIEDE2000 value, as a trial metric for
quantifying CBU [9-10], is regarded inadequate for two reasons. Firstly, both color difference
formulas are fitted based on data sets from color-patch samples, not complex images. Moreover, the linearity of perception difference is merely effective in small range differences
[11]. That is, large difference values, due to large hue difference from separate R, G, and B
fields, may fail to reflect perceptions moderately.
The difficulty in quantifying CBU is at least two-fold. First, no physical and identical stimuli of CBU can be controlled for repeated analysis. Second, the human visual system has
methodology that can simulate CBU stimuli correctly and derive an index matching that of psychometric evaluation.
1.4 Organization
This thesis is organized as following. In Chapter 2, the properties of the human color vision will be introduced. Then, the prior arts of CBU quantification methods will be briefly summarized. In Chapter 3, the proposed methodology will be presented. Then, the proposed model for psychophysical evaluation of stationary images will be described in Chapter 4. Moreover, the sensitivity of the CBU fringe will be computed by using the proposed model. After that, psychophysical evaluations of stationary images will be described. In Chapter 5, the proposed index will be verified in other multi-primary color fields, and the application will be presented. Finally, conclusions and future works will be summarized in Chapter 6.
Chapter 2 Principle
The response of Human Visual System (HVS) for luminance, color, temporal-spatial frequency, and eye movement depending on the characteristics of light stimulus will be introduced. There are several features of HVS have been developed to describe the visual match between the scene and the display. The mechanisms were focused on two major issues in realistic human perceptual process. One is the properties of the human color vision that the perceived images match our perception of scenes, and the other is the movement of eyeball. Hence, the mechanism of CBU can be described. Finally, the prior arts for CBU quantification will be illustrated in the last part.
2.1 Human Color Vision
2.1.1 Opponent-Color Theory
The receptors for the first stage of color vision are indeed L, M, and S cones [13-14].
The three color-separation images are not transmitted directly to the brain. Instead the neurons of the retina encode the color into opponent signals. The outputs of all three cone types are summed (L+M+S) to produce an achromatic response that matches the CIE V(λ) curve as long as the summation is taken in proportion to the relative populations of the three cone types. Differencing of the cone signals allows construction of red-green (L-M+S) and yellow-blue (L+M-S) opponent signals. The transformation from LMS signals to the opponent signals serves to decorrelate the color information carried in the three channels, thus
allowing more efficient signal transmission, as shown in Fig. 4. The three opponent pathways
appearance.
Fig. 4 The encoding of cone signals into opponent-colors signals in the human visual system
[13].
2.1.2
Spatial and Temporal Properties of Color Vision
The color appearance of a stimulus is not independent of its spatial and temporal characteristics. In general, the spatial and temporal characteristics of the HVS are typically explored through measurement of Contrast Sensitivity Functions (CSFs). A contrast sensitivity function is defined by the threshold response to contrast (sensitivity is the inverse of threshold) as a function of spatial or temporal frequency. Contrast is typically defined as the difference between maximum and minimum luminance in a stimulus divided by the sum of the maximum and minimum luminance.
The typical spatial contrast sensitivity functions for luminance (black-white) and
chromatic (red-green and yellow-blue at constant luminance) contrast are shown in Fig. 5. The
luminance contrast sensitivity function is band-pass in natural, with peak sensitivity around 5 cycles per degree. However, the band-pass contrast sensitivity correlates with the concept of center-surround antagonistic receptive fields that would be the most sensitive to an intermediate range of spatial frequency. In contrast, the chromatic mechanisms are low-pass in natural and have significantly lower cutoff frequencies. This indicates the reduced availability of chromatic information for fine details that are often taking advantage of an image coding and compression schemes.
Fig. 5 Spatial contrast sensitivity functions for luminance and chromatic contrast [13].
The low-pass characteristics of the chromatic mechanisms also imply that edge detection/enhancement does not occurs along these dimensions. The yellow-blue chromatic CSF has a lower cutoff frequency than the red-green one due to the scarcity of S cones in the retina. It is also noted that the luminance CSF is significantly higher than the chromatic CSFs, indicating that the visual system is more sensitive to small changes in luminance contrast compared with chromatic contrast. The spatial CSFs for luminance and chromatic contrast are not directly incorporated in color appearance models although there is significant interest in
doing so. Therefore, an interesting technique for incorporating these types of responses into the
CIELAB color space calculations was proposed [15]. Then, a more recent implementation of
the model was presented [16].
In contrast to the spatial properties, the typical temporal contrast sensitivity functions for
luminance and chromatic contrast conceptually are illustrated in Fig. 6. The luminance
temporal CSF is higher in both sensitivity and cutoff frequency than the chromatic temporal CSFs that shows the band-pass characteristics, suggesting the enhancement of temporal transients in the HVS. However, the dimensions of human visual perception cannot be examined independently. The spatial and temporal CSFs interact with one another. A spatial CSF is measured at different temporal frequencies will vary tremendously and the same is true for a temporal CSF is measured at various spatial frequencies. Furthermore, CSFs also depend on other variables such as luminance level, stimulus size, and retinal locus.
Fig. 6 Temporal contrast sensitivity functions for luminance and chromatic contrast [13].
The spatial and temporal CSFs are closely linked to the study of eye movements. A static spatial pattern becomes a temporally varying pattern when observers move their eyes across the stimulus. Noting that both the spatial and temporal luminance CSFs approach zeros as either form of frequency variation approaches zero, it follows that a completely static stimulus is
invisible. This is the case indeed. If the retinal image can be fixed using a video feedback system attached to an eye tracker, the stimulus does disappear after a few seconds. To avoid this rather unpleasant phenomenon in typical viewing, our eyes are constantly moving. The detail mechanisms of eye movements will be describe clearly below.
2.2 Categories of Eye Movement
The most important structural area on the retina is the fovea where we have the best spatial and color vision. When we look at an image in our visual field, our eyes move volitionally or spontaneously such that the image falls on the fovea.
In generally, eye movements can be classified into several types, like Vestibular-Ocular Reflex (VOR), Opto-Kinetic Nystagmus (OKN), fixation, smooth pursuit, saccade and so on. However, the human eyes perceived CBU can be categorized into two types; saccade and
smooth pursuit [17].
2.2.1 Saccade
Saccadic eye movements are conjunctive, consciously or unconsciously evoked eye movements that orientate the fovea towards a point of special interest. Normally, when we look at a scene or read a text, we perform 2-4 saccades per second. Saccades are very fast, the velocity of eye movement up to 900 degrees/sec, and ballistic. Usually, saccades have duration between 10 to 100ms. Saccadic amplitude, velocity, and duration are strongly related with each other. While the amplitude and direction can be changed voluntarily, the velocity is determined by the distance of the saccadic target from the fovea and cannot be changed
voluntarily [18]. The time between the appearance of a saccadic target and the actual onset of
eye movement is called saccadic latency. Normally saccadic latencies vary between 140 and 200ms. Saccadic latency is influenced by factors such as attention and visual tiredness.
Saccadic eye movements are very fast jumps from one position to another as illustrated in Fig. 7. The lines were shown the path of saccadic eye movement for stimulus, and the white dots are the fixation locations. After few cycles, a full image can be perceived clearly.
Fig. 7 An example of saccadic eye movement [17].
2.2.2 Smooth Pursuit
The function of smooth pursuit is to keep the moving image projected on fovea continuously so that the image can be perceived clearly. The purpose of smooth pursuit, partly, is to stabilize the moving objects on the retina thereby enabling human eyes to perceive the moving object in detail. The velocity of smooth pursuit has been recorded at 100 degrees/sec
[19]. Human eyes move conjunctively if the target is moving at a constant velocity to form the
subject and at a speed that matches the velocity of the moving target. The diagram of smooth
Fig. 8 Diagram of smooth pursuit [19].
In the human retina, the high-resolution fovea encompasses less than 0.1% of the visual field visible at any moment, and the effective resolution falls by an order of magnitude within a few degrees from the fovea. This variable-resolution on retina reduces bandwidth sufficiently, but is not an acceptable solution alone. Unless the point of interest at any moment happened to fall in the exact center of visual field, the stimulus would be relegated to the low-resolution periphery. The “fovea compromise” was made feasible by the evolution of a complementary mechanism for eye movement. In order to ensure the useful vision, human eyes must be moved rapidly about the scene. Human eyes observed trichromatic separation on FSC LCD, this phenomenon may cause discomfort and visual fatigue in the observer. We will describe this phenomenon in the following sections.
2.3 Mechanism of Color Break-up
As above mentioned, FSC display, has at least three color fields constituted a full color image. While the field rate is high enough, and the three color fields will be projected onto the retina in the same position, thus human eyes will perceive a complete full color image.
FSC LCD. The details of CBU mechanisms are described in the following.
2.3.1 Stationary Image (Static CBU)
For a stationary image, eyeball will perform saccadic eye movement and then perceive CBU along the motion direction. The path of a saccade, the CBU during or after the saccade
is shown in Fig. 9. For example, the gray line indicates the path of a saccade with three static
white bars as shown in Fig. 9 (a). If eyeball moves from left to right, the original image seems
to break up into three color fields alone, and the motion direction at the moment of saccade, as
shown in Fig. 9 (b). The static CBU is strongly related to the color sequential operating
frequency of the display. The amount of static CBU can be suppressed by increasing the operating frequency of LCDs.
(a) (b)
Fig. 9 (a) The path of a saccade on a FSC LCD and (b) observed CBU during or after the
saccade [20].
2.3.2 Moving Image (Dynamic CBU)
In contrast to the dynamic image, the CBU is perceived when the human eyes are always
tracking a moving image, as illustrated in Fig. 10 (a). For instance, different color fields can be
perceived separately on the edge by smooth pursuit eye movement and temporal integration in the visual system. The illustration about the mechanism of CBU generation during eye tracking
movement is shown in Fig. 10 (b).
Fig. 10 (a) Moving image along the moving direction and (b) the mechanism of CBU [21].
2.4 Qualitative and Quantitative Analysis Methods of CBU
2.4.1 Subjective Evaluation
A psychophysical evaluation is a direct method to quantify CBU at the outset. To investigate CBU on FSC LCD, X. Zhang and J. E. Farrell conducted a psychophysical evaluation using subjective evaluation to quantify the visibility of these human visual artifacts
for different speed, target luminance, and target size [11]. A sequential color projector was
placed behind a projection screen to simulate a normal desktop display. Saccadic eye movement was induced using subject to recognize targets displayed at two different screen locations in rapid succession. The speed of saccadic movements was varied by manipulating the distance between the two target locations.
A white bar, either with or without a yellow and red color fringe on the right edge, was displayed as subjects. The two versions of white bar will not be distinguishable if CBU is present, thus performance of this task can be used to measure CBU. The visibility of sequential CBU decreases with background intensity and size of the white target, and increases with saccadic velocity.
2.4.2 Analysis Dynamic CBU using △E
In studying CBU, there are two things about the quantification of CBU must be considered.
One is the brightness of CBU and the other is the CBU width. In L*u*v* space, the amount of
CBU could be quantified using color difference metric which is known as delta E (ΔE) [9-10].
For example, the two different color transitions are shown in Fig. 11. Blue and white
mixed color might be seen in transition region but this is not an unexpected color caused by
CBU as shown in Fig. 11 (a). And then, the typical CBU that magentish color should not be
seen in transition region in normal displays, as shown in Fig. 11 (b).
(a) (b)
Fig. 11 (a) Normal color transition and (b) Color Break-up transition [9].
L*u*v* space is chosen to analyze CBU as plotted in Fig. 12. The color difference
between source color and objective color should be accumulated along the off-route CBU line. The number of points on the off-route line indicates the CBU width. The algorithm considered the amount of chromaticity deviation, lightness, and CBU width here. Therefore, the CBU level can be analyzed.
Fig. 12 Color variation route in L*u*v* color space [9].
2.4.3 Precise Recording
A unique device for measuring CBU on stationary system has been presented in 2004 [10]
[20]. In this CBU measurement system, a monochrome camera is capable of taking more than
10,000 images per second, which is used for the whole range of available target displays, as
shown in Fig. 13. The view of the camera is moved with a two-axis tilting mirror to simulate
the smooth pursuit movement, thus a smooth pursuit canbe made between any two points in the
display. Besides, the camera is synchronized with the display and an image is captured from
every sub-frame using a photodiode.Therefore, the captured image can be used in the study of
Fig. 13 Target virtual display, the two-axis tilting mirror and the 90° deflecting C-mount
optics [20].
2.5 CBU Suppression Methods
If the CBU can be well suppressed at a practical level, FSC LCD will become a very promising display. At CBU suppression, many researches and experiments were reported recently to optimize the driving method for CBU suppression. These proposals could be
categorized as (1) field rate increasing [21-22], (2) multi-primary color fields [23-24], and (3)
motion compensation [25]. The following section will describe these methods in detail.
2.5.1 Field Rate Increasing
CBU can be perceived in relative motion between the image and observer’s eyes. However, the refresh frequency of R, G, and B fields is the main issue causing CBU in FSC displays. Thus, CBU in FSC displays is suppressed by increasing the refresh frequency with
the decreasing of flashing time [26]. Some researchers have performed experiments in which
observers adjusted the refresh frequency of FSC displays until CBU was just invisible. The threshold of refresh frequency is proposed as 1200Hz in order to avoid the perception of CBU
[27-30]. This threshold is extrapolated from measurements and derived using mathematical models. CBU was measured as a function of the stimulus’s luminance, contrast, and retinal velocity. A nonlinear regression equation that describes the observer’s mean threshold refresh frequency, so that the equation constitutes design rules that can be used to evaluate the adequacy of FSC LCD field rate for specific applications.
The CBU width can be influenced by changing field rate. The relation between the time
and the location of moving image on single frame is shown in Fig. 14. Double field rate
repeats a set of RGB color fields in a frame. Compare the double field rate with the single field rate, the CBU width of double field rate becomes almost a half of the single field rate as
shown in Fig. 15.
Fig. 14 Relation between the time and the location of moving image on single field rate
[26].
Fig. 15 Relation between the time and the location of moving image on double field rate
[26].
CBU phenomenon. However, these methods require fast scanning time of TFT and fast response time of LC, which is not practical in conventional LCD.
2.5.2 Multi-primary Color Fields
Color sequential projection displays also exhibit the phenomenon of CBU. It is considered a distributing artifact with negative marketing impact. Therefore, D. Eliav et al. perform a psychophysical experiment to compare the visibility of CBU in a three-primary (RGB) projection display, which operating at a higher frame rate, and five-primary (RGBCY)
displays operating at lower frame frequency [31]. They assumed that green in the RGB
display and yellow in the RGBCY display is the brightest color field. The RGB color fields are transformed into three opponent color channels, i.e. Achromatic, Red-Green, and Yellow-Blue channels. Each of them is filtered spatially with the corresponding response. For RGBCY display, they measured the XYZ tristimulus values to estimate the opponent signals. For the RGB display, they use the same chromaticity as the RGB components, and adjust the relative luminance to obtain the equal white points at equal brightness. Subsequently, they integrate the opponent color signals of all fields to mimic a low-pass temporal response. The results show a strong modulation in the Red-Green channel, with a weak Yellow-Blue modulation on the edges of the white strip in the RGB displays, and then the mostly Yellow-Blue modulation is seen in the RGBCY displays. That is consistent with the observation that red and green fringes are seen in the RGB displays, the blue and yellow fringes in the RGBCY displays. The modulation pattern is determined by the order of primary colors and the tracking of the brightest field. An optimization of color order may suppress the CBU. According to the experimental results, the RGBCY displays produce less CBU than RGB displays, even RGBCY displays at lower frame rates. The simulation results on white or whitish magenta solid rectangles moving towards right on a black background are shown in
However, these color fields still require the fast scanning of TFT and fast response time of LC, which are not practical.
Fig. 16 Simulation results on white or whitish magenta solid rectangles moving towards
right on a black background [31].
2.5.3 Motion Compensation
CBU are varied with colors of object, background, and moving direction. This means dynamic CBU can be anticipated by knowing above conditions. The method called Adjust of
Color Element on the Eves (ACE) has been developed by N. Koma and T. Huchida [32] to
suppress the negative effects of CBU with moving objects. The schematic plot of motion
compensation is shown in Fig. 17. RGB images are displayed at different points, which have
the same moving speed using velocity method. When the eyes always track the moving object, RGB sub-images are focused on the same point on the retina, hence CBU will not be perceived.
Fig. 17 Schematic plot of motion compensation [32].
However, this driving method is only effective in particular cases. That is motion
compensation, which has a problem with the eye tracing in opposite direction as shown in Fig.
18 and two moving objects are displayed at the same time [33]. Moreover, most of video
contents are too complex for taking into account all motion vectors in a real situation.
Fig. 18 A crossing object is moving from left to right at speed S and the observer’s eye is
tracing from right to left at speed M [33].
2.6 Summary
The mechanism of human color vision and the principle of CBU were presented. Due to the CBU artifact exists in FSC displays, several prior arts, classifications and improvements
have mentioned in the past decade. However, all of them were only focused on the improvement of CBU. Hence, we would like to build up a methodology to analyze CBU phenomenon. First, psychophysical experiments were performed to define the threshold perceptibility of CBU under various parameters. Next, the proposed method was used to compute these experimental results and the correlation coefficients were also computed. Finally, the methodology was applied to other multi-primary color fields in order to verify the applicability.
Chapter 3 Proposed CBU Evaluation Index
3.1 Relative Contrast Sensitivity (RCS) Index
The proposed methodology is to compute the relative contrast sensitivity (RCS) of the CBU fringe of the synthesized images. The RCS is obtained following the procedures in the
spatial extension of CIELAB (S-CIELAB) [15-16] with some modifications, as shown in Fig.
19.
First, the original image and the synthesized CBU image are transformed into the opponent color space in terms of Achromatic, Red-Green, and Blue-Yellow channels. Second, each channel image is performed Fourier transformation into angular frequency domain, and is then spatially filtered by multiplying the contrast sensitivity function of each channel, respectively. Third, the filtered channel images are performed subtraction between each channel. Finally, the subtracted result of each pair of filtered channel images are summed together in different weights since these three opponent channels have different absolute magnitudes. The weights were fitted for the correlation coefficients between psychophysical evaluations and RCS could be achieved the highest. The results of achromatic channel fitting
were shown in Fig. 20.
Fig. 20 The effect of correlation coefficient with different weights of achromatic channel.
3.1.1 Device Independent and Opponent Color Transformation
The effect of unequal response curves can be explained with Electro-Optical Transfer Function (EOTF) of the FSC LCD, that was measured by a Minolta CS-100 color photometer
as presented in Fig. 21. The gamma value of R, G, and B is 2.66, 2.621, and 1.958,
respectively. Furthermore, the primary tristimulus matrix into a product of chromaticity
Fig. 21 The Electro-Optical Transfer Function of a 32-inch FSC LCD. X Y Z = Xr,dr =max − Xr,dr =0 Yr,dr =max − Yr,dr =0 Zr,dr =max − Zr,dr =0 𝑓 dr + Xr,dr =0 Yr,dr =0 Zr,dr =0 + Xg,dg =max − Xg,dg =0 Yg,dg =max − Yg,dg =0 Zg,dg =max − Zg,dg =0 𝑓 dg + Xg,dg =0 Yg,dg =0 Zg,dg =0 + Xb,db =max − Xb,db =0 Yb,db =max − Yb,db =0 Zb,db =max − Zb,db =0 𝑓 db + Xb,db =0 Yb,db =0 Zb,db =0 =
Xr,dr =max − Xr,dr =0 Xg,dg =max − Xg,dg =0 Xb,db =max − Xb,db =0 Yr,dr =max − Yr,dr =0 Yg,dg =max − Yg,dg =0 Yb,db =max − Yb,db =0
Zr,dr =max − Zr,dr =0 Zg,dg =max − Zg,dg =0 Zb,db =max − Zb,db =0
dr dg db + Xd=0 Yd=0 Zd=0 = 142.387 67.88581.2 223 47.57913.9 4.07 22.259 239.363 dr dg db + 0.771 1.47 (2)
where dr, dg, and db are digital values for r, g, and b signal of input image, respectively.
Xr,dr=max, Yr,dr=max, and Zr,dr=max are tristimulus values for maximum value of red signal, Xr,dr=0, Yr,dr=0, and Zr,dr=0 are tristimulus values for minimum value of red signal, and so on.
The first step in using S-CIELAB is to transform the input images into a device independent space, such as CIE XYZ tristimulus values. This can be accomplished though device characterization. The filtering is performed in an opponent color space, containing one luminance and two chrominance channels. These channels were determined though a series of
psychophysical experiments testing for pattern color separability. The opponent channels,
AC1C2, are a linear transform from CIE 1931 XYZ as shown in Eq. (3) and Fig. 22. One
important note about the AC1C2 opponent color space is that the three channels are not completely orthogonal. The chrominance channels contain some luminance information, and vice versa. The “white” lighthouse contains additional chroma information in both the
red-green channel and the yellow-blue channel as shown in Fig. 23. The opponent color
transform also creates negative response for the achromatic channel at certain wavelengths. A C1 C2 = 0.297 0.72 −0.107 −0.449 0.29 −0.077 0.086 −0.59 0.501 XY Z (3)
Fig. 22 AC1C2 opponent response functions [16].
3.1.2 Spatial Filtering via Frequency Modulation
If the computational results were feasible, it might be desirable to perform the spatial filtering in the frequency domain, rather than the spatial domain. The spatial filtering in frequency domain enables more precise specification of the shape of the filter with fewer terms. Filtering in the frequency domain is performed using a simple multiplication, rather than a series of convolutions. In order to filter the image, the opponent channels must be first transformed into their respective frequency representations. This can be accomplished using a Fourier transform.
Once in frequency space, it is necessary to obtain frequency representations of the opponent spatial filters. These opponent spatial filters can be determined by taking the Fourier transform of the convolution kernels. Mathematically, the convolution operator is identical to multiplication in the frequency domain, so the results of the frequency filtering would be identical to the results from the spatial convolution. The convolution kernels used in S-CIELAB are Gaussian approximations of the human contrast sensitivity functions. Specifying the filters purely in the frequency domain allows for more precise control over the shape of the filter.
A three-parameter exponential model, described by Movshon, is a simple description of the general shape of the luminance CSF, which behaves similarly to the S-CIELAB filter.
This model is shown in Eq. (4).
𝑐𝑠𝑓𝑙𝑢𝑚 𝑓 = 𝑎 ∙ 𝑓𝑐 ∙ 𝑒−𝑏∙𝑓 (4)
The parameters, a, b, and c can be fitted to existing experimental data, if available. Alternatively values of 75, 0.2, and 0.8 for a, b, and c, respectively, fit reasonably well with
the S-CIELAB filters. Fig. 24 plots the contrast sensitivity function calculated using the above
Fig. 24 Frequency filter for luminance channel, approximating the human contrast
sensitivity function (CSF) [16].
There is considerably less available data for the chrominance channel filters. The
available data can be fitted with the sum of two Gaussian functions, as shown in Eq. (5).
𝑐𝑠𝑓𝑐ℎ𝑟𝑜𝑚 𝑓 = 𝑎1 ∙ 𝑒−𝑏1∙𝑓
𝑐1
+ 𝑎2∙ 𝑒−𝑏2∙𝑓
𝑐2
(5)
Table 1 Parameters for chrominance CSFs. Parameter Red-Green Blue-Yellow
a1 109.1413 7.0328 b1 -0.0004 0.0000 c1 3.4244 4.2582 a2 93.5971 40.6910 b2 -0.0037 -0.1039 c2 2.1677 1.6487
Table 1 shows the values of the six parameters that were fitted to the Van der Horst and Poirson data sets. These data were fitted using a Newton-Rhapson nonlinear regression technique, minimizing the sum of squares error between the model and the data. The Poirson data were first normalized so that they were on the same scale as the Van der Horst data. The
Fig. 25 Normalized Opponent Color Contrast Sensitivity [16].
The two-dimensional filters are then multiplied with the discrete Fourier transform of the
individual opponent channels as shown in Figs. 24 and 26. The filtered images are then
transformed back into the spatial domain via an inverse Fourier transform. This process can easily be extended to handle orientation-specific aspects of the human visual system using non-isotropic filters. Modulating the diagonal orientations more would be able to predict the decreased visibility of CBU images, as described by the oblique effect.
(a) (b)
Fig. 26 2D Chrominance Filters for (a) Red-Green channel and (b) Blue-Yellow channel
[16].
3.2 The Pearson Correlation Coefficient
A correlation is a number between -1 and +1 that measures the degree of association between two variables (call them X and Y). A positive value for the correlation implies a
positive association (large values of X tend to be associated with large values of Y and small values of X tend to be associated with small values of Y). A negative value for the correlation implies a negative or inverse association (large values of X tend to be associated with small values of Y and vice versa). Suppose we have two variables X and Y, with means XBAR and YBAR respectively and standard deviations SX and SY respectively. The correlation is
computed as Eq. (6).
𝑟 =
𝑛𝑖=1 𝑋𝑖−𝑋 (𝑌𝑖−𝑌 )(𝑛−1)𝑆𝑋𝑆𝑌 (6)
Suppose that an X value was above average, and that the associated Y value was also above average. Then the product would be the product of two positive numbers which would be positive. If the X value and the Y value were both below average, then the product would be above of two negative numbers, which would also be positive. Therefore, a positive correlation is evidence of a general tendency that large values of X are associated with large values of Y and small values of X are associated with small values of Y and vice versa.
The correlation coefficient was described the strength of a linear relationship between two variables. The correlation coefficient is always between -1 and +1. The closer correlation is +/-1, and it is a perfect linear relationship. The interpretation of correlations is shown in
Table 2.
Table 2 Interpretation of the correlation coefficient.
Correlation coefficient Association
-1.0 ~ -0.7 Strong negative
-0.7~ -0.3 Weak negative
-0.3~ +0.3 Little or no
+0.3~ +0.7 Weak positive
3.3 Modeling
The objective of the proposed methodology was to quantify CBU in matching the actual perceptual result under different viewing conditions and to evaluate the visibility of CBU in moving images with a fixed view.
There were two phases on the static image model. Phase one was a psychophysical evaluation using one-dimensional analysis after saccade movement. Phase two was a psychophysical evaluation using two-dimensional analysis after saccade movement. The purpose was to estimate CBU accurately and then correlate the physical stimuli with psychometric evaluations. It is worth noting that these CBU images simulate the physical stimuli on the retina but are not the resultant perception interpreted by the human visual system. Hence, psychophysical experiments were performed to correlate the sensitivity of the CBU fringe with perceptual annoyance. This was then scaled by the mean opinion score
(MOS), as shown in Table 3. Finally, the InD-CBUA was defined experimentally as the
sensitivity threshold, and the schematic plot of CBUA, as shown in Fig. 27. InD-CBUA,
determined by the psychophysical experiment, can be transformed to a CBU image by means of Eq. (7). CBUA = tan−1 T 2D+ V FD − tan −1 T 2D (7)
where T is the pattern width (mm), D is the viewing distance (mm), V is the image moving speed (mm/s), and F is the frame rate (Hz), respectively.
Table 3 Mean Opinion Score (MOS) method used for subjective evaluation.
Absolute score Evaluation result
5 Imperceptible
4 Perceptible, but not annoying
3 Slightly annoying
2 Annoying
Fig. 27 Schematic plot of CBUA.
Then, the experimental results were used as the foundation to compute the relative contrast sensitivity (RCS) of the CBU fringe of the synthesized images. Then, the correlation between the MOS, InD-CBUA and RCS were examined. The RCS was obtained using the procedures in the spatial extension of CIELAB (S-CIELAB) with some modifications, as
shown in Fig. 19. If the correlation coefficient between the MOS and the corresponding RCS
and between the InD-CBUA and the corresponding RCS are acceptable, the proposed method is applicable to quantify CBU under any panel specification and viewing conditions using moderate parameter settings. Finally, the results of this research can be applied to evaluate various CBU-suppression solutions.
3.4 Summary
The proposed methodology, relative contrast sensitivity (RCS) has been presented. In addition, the proposed correlation coefficient was used to verify that RCS as an applicable CBU index. The modeling will be examined in next chapter.
Chapter 4 Psychophysical Experiments
4.1 One-Dimensional Psychophysical Evaluation
“Method of adjustment” is the main technique which is designed to determine the smallest perceptible change in a stimulus. Threshold techniques are used to measure the observer’s sensitivity to change in a given stimulus. Absolute thresholds are defined as the smallest perceptible difference under a changing stimulus, while thresholds represent the smallest perceptible difference from a particular stimulus level greater than zero. Thresholds are presented in terms of physical units used to measure the stimulus.
To determine the absolute thresholds, a sequence of closely spaced stimuli exhibiting a signal with a known value is given. Stimuli of random values are sequentially presented to an observer. As described above, upon presentation of the stimulus, the observer is asked whether he or she perceives CBU. If CBU cannot be perceived, the next stimulus in the sequence is presented and the question is repeated. This process of presenting the sample and asking the question is repeated until the observer responds.
During this experiment, observers controlled the stimulus magnitude and adjusted it until CBU is perceptible or perceptibly different from the starting level. The threshold is determined as the average result given by one or more observers. The schematic of the one-dimensional
Fig. 28 Schematic of the one-dimensional psychophysical experiment apparatus for saccade.
In the one-dimensional psychophysical experiment, a white strip was used as the stimulus with a width of 17mm on a FSC LCD. Furthermore, we chose several critical viewing conditions such as target luminance (18, 28, 42, 56 nits), movement velocity (100, 200, 300, 400, 500, 600, 700, and 800 mm/s) and dark environment (0 lux) to minimize or maximize CBU perception.
Finally, several viewing conditions were processed by eleven different observers and the threshold distances were averaged among them. They were undergraduate and graduate students of ages ranging from 23 to 36 years. They were screened using standard definition of
normal visual acuity 20/20 on Snellen acuity pattern and normal color vision on Ishihara Test.
The observers participated in experimental studies before data collection began to judge the
Table 4 Characteristics of each subject using one-dimensional psychophysical evaluation for static images.
Observer Age Male/Female Vision acuity Color vision
WJ 23 Female 20/20 Normal FC 29 Male 20/20 Normal YB 28 Male 20/20 Normal WJ 32 Male 20/20 Normal ZB 32 Male 20/20 Normal SC 23 Male 20/20 Normal JH 31 Male 20/20 Normal ML 36 Male 20/20 Normal JW 27 Male 20/20 Normal HJ 28 Female 20/20 Normal YP 25 Female 20/20 Normal
4.2 One-Dimensional Experimental Results and Analyses Using RCS Index
The averaged threshold distance and InD-CBUA of psychophysical evaluation on
32-inch FSC LCD are shown in Figs. 29 and 30.
Fig. 29 Threshold distance of psychophysical evaluation with dark environment on a 32-inch FSC LCD. 0 100 200 300 400 500 600 700 800 900 80 120 160 200 240 280 320 360 In d is ti n g u is h a b le D is ta n c e ( c m ) Moving Speed (mm/s) 18(nits) 28(nits) 42(nits) 56(nits) Ls=0 (lux)
Fig. 30 InD-CBUA of psychophysical evaluation with dark environment on a 32-inch FSC LCD.
After the RCS of each CBU image was obtained following the aforementioned procedures, the degree of correlation between the MOS and the corresponding RCS was
evaluated. The results, as shown in Fig. 31, and the correlation coefficient, well-above
86.54%, as tabulated in Table 5, exhibit a high degree of correlation between the MOS and the
RCS.
InD-CBUA, decided by the psychophysical experiment, can be transformed to a CBU
image by means of Eq. (7). The resulting CBU image was then computed to determine the
RCS and was used to verify the degree of correlation. The threshold RCS could be deduced from the InD-CBUA, and then applied to any images under the same viewing conditions and
system settings. The results, depicted in Fig. 32 and tabulated in Table 5, confirm the
agreement between the two.
0 100 200 300 400 500 600 700 800 900 0.00 0.05 0.10 0.15 0.20 0.25 0.30 0.35 0.40 In d is ti n g u is h a b le C B U A ( d e g re e ) Moving Speed (mm/s) 18(nits) 28(nits) 42(nits) 56(nits) Ls=0 (lux)
Fig. 31 The relationship between RCS and MOS with various target luminance.
Fig. 32 The relationship between RCS and InD-CBUA with various target luminance.
0.2 0.4 0.6 0.8 1.0 1.0 1.5 2.0 2.5 3.0 3.5 4.0 4.5 5.0 5.5 M e a n O p in io n S c o re
Relative Contrast Sensitivity
Lt=18 nits Lt=28 nits Lt=42 nits Lt=56 nits Ls=0 (lux) 0.2 0.4 0.6 0.8 1.0 0.08 0.10 0.12 0.14 0.16 0.18 0.20 0.22 0.24 0.26 In D -C B U A
Relative Contrast Sensitivity
Lt=18 nits Lt=28 nits Lt=42 nits Lt=56 nits Ls=0 (lux)
Table 5 The correlation coefficient between RCS and InD-CBUA, and between RCS and MOS, respectively, as a function of object luminance, Lt (nits).
Lt (nits) 18 28
RCS vs. InD-CBUA MOS InD-CBUA MOS
Correlation Coefficient 83.60% -97.12% 89.24% -86.54%
Lt (nits) 42 56
RCS vs. InD-CBUA MOS InD-CBUA MOS
Correlation Coefficient 91.30% -95.95% 94.12% -95.67%
4.3 Two-Dimensional Psychophysical Evaluation
To determine the absolute thresholds, a sequence of closely spaced stimuli exhibiting a signal with a known value was given. Stimuli were sequentially adjusted by observers. As described above, upon presentation of the stimulus, the observers determined the quantity of CBU which they can perceive. If CBU was visible, the color break-up width (CBW) was derived and it was transformed into InD-CBUA. This process of presenting the sample and adjusting is repeated until the observer responds.
During this experiment, observers controlled the stimulus magnitude and adjusted it until CBU is perceptible or perceptibly different from the starting level. The threshold is determined as the average result given by one or more observers. The schematic of the two-dimensional
psychophysical experiment apparatus is shown in Fig. 33, and the schematic plot of
Fig. 33 Schematic of the two-dimensional psychophysical experiment apparatus for saccade.
Fig. 34 Schematic plot for 2D representation.
In the two-dimensional psychophysical experiment, the white block was used as the stimulus at approximately 2 degrees angular subtense was assumed to correspond to the visual field using the CIE1931 standard colormetric observer. Furthermore, we chose several critical viewing conditions such as target luminance (100, 200, 300, 400 nits), viewing distance (1, 1.25, 1.5, 1.75, and 2 time of diagonal screen size) and dark environment luminance (0 lux) to minimize or maximize CBU perception.
Finally, several viewing conditions processed by thirteen different observers and the threshold color break-up widths (CBW) were averaged among them. They were master students, three female and ten male observers who had an average age of 25 years. They were screened for standard definition of normal visual acuity 20/20 on Snellen acuity pattern and normal color vision on Ishihara Test. All of them had normal color vision and were familiar with the CBU phenomenon and the purpose of the study. The observers participated in experimental studies before data collection began to judge the result of CBU. The observer
background data are summarized in Table 6.
Table 6 Characteristics of each subject using two-dimensional psychophysical evaluation for static images.
Observer Age Male/Female Vision acuity Color vision
ML 25 Male 20/20 Normal RJ 25 Male 20/20 Normal JL 25 Male 20/20 Normal YC 25 Male 20/20 Normal JS 24 Male 20/20 Normal CW 24 Male 20/20 Normal YC 24 Male 20/20 Normal CE 24 Male 20/20 Normal CW 24 Male 20/20 Normal BW 24 Male 20/20 Normal ER 25 Female 20/20 Normal HW 24 Female 20/20 Normal YL 25 Female 20/20 Normal
4.4 Two-Dimensional Experimental Results and Analyses Using RCS Index
The averaged InD-CBUA from the psychophysical evaluation with CBU shifted in the
x-direction on 32-inch FSC LCD, as shown in Fig. 35. The viewing distance is equal to the
(a)
(b)
Fig. 35 Schematic plot of InD-CBUA distribution. CBU shifted in the x-direction with target luminance at (a) 100 and (b) 400 nits on a 32-inch FSC LCD.
The average InD-CBUA of psychophysical evaluation with CBU shifted in the
y-direction on a 32-inch FSC LCD, as shown in Fig. 36. The viewing distance is equal to the
(a)
(b)
Fig. 36 Schematic plot of InD-CBUA distribution. CBU was shifted in the y-direction with target luminance at (a) 100 and (b) 400 nits on a 32-inch FSC LCD.
After the RCS of each CBU image was obtained following the aforementioned procedures, the degree of correlation between the InD-CBUA and the corresponding RCS was
evaluated. The results, as shown in Figs. 37 and 38, and the correlation coefficient,
well-above 89%, as tabulated in Table 7, exhibit a high degree of correlation between the
InD-CBUA and the RCS.
The threshold RCS could be deduced from the InD-CBUA. The results confirm the agreement between the x-direction and the y-direction CBU shift. In addition, the InD-CBUA
between the x-direction and the y-direction CBU shift were unequal. Human eyes were more sensitive for CBU shift in y-direction than x-direction. Therefore, the human eyes were more sensitive to red fringe than blue fringe due to the unequal phenomenon was caused by the distance between the blue fringe and the center of FSC LCD. Finally, the results applied to the backlight with local dimming and other multi-primary color fields.
(a)
(b)
Fig. 37 Schematic plot of RCS distribution. CBU was shifted in the x-direction with target luminance at (a) 100 and (b) 400 nits on a 32-inch FSC LCD.
(a)
(b)
Fig. 38 Schematic plot of RCS distribution. CBU was shifted in y-direction with target luminance at (a) 100 and (b) 400 nits on a 32-inch FSC LCD.
The InD-CBUA was larger when increasing the distance between the center of screen and the synthesized CBU image. However, the RCS was smaller when increasing the distance between the center of screen and the synthesized CBU image. Therefore, the correlation coefficients presenting the strong negative association because of inverse proportion, as
Table 7 The correlation coefficient between RCS and InD-CBUA, as a function of object luminance, Lt (nits), shifted direction and viewing distance (the multiple of diagonal screen size).
Lt (nits) 100 200 300 400
Shifted direction 1X 1Y 1X 1Y 1X 1Y 1X 1Y
Correlation -96.65% -97.19% -96.39% -97.18% -94.02% -97.38% -97.06% -97.18%
Lt (nits) 100 200 300 400
Shifted direction 1.25X 1.25Y 1.25X 1.25Y 1.25X 1.25Y 1.25X 1.25Y Correlation -90.43% -97.44% -90.95% -97.06% -91.14% -97.82% -92.07% -97.98%
Lt (nits) 100 200 300 400
Shifted direction 1.5X 1.5Y 1.5X 1.5Y 1.5X 1.5Y 1.5X 1.5Y Correlation -97.52% -97.74% -97.72% -98.81% -97.81% -98.68% -98.34% -98.2%
Lt (nits) 100 200 300 400
Shifted direction 1.75X 1.75Y 1.75X 1.75Y 1.75X 1.75Y 1.75X 1.75Y Correlation -97.49% -94.35% -98.86% -89% -97.94% -91.98% -97.92% -94.01%
Lt (nits) 100 200 300 400
Shifted direction 2X 2Y 2X 2Y 2X 2Y 2X 2Y
Correlation -98.84% -98.74% -98.72% -97.68% -98.25% -99.12% -99.15% -98.44%
4.5 Summary
Using psychophysical experiment to quantify the visibility of CBU is a direct method. The moving velocity is the main parameter causing CBU, and that CBU is only slightly affected by target luminance. The results demonstrated that RCS was in agreement with the psychophysical rating, Mean Opinion Score (MOS) and InD-CBUA of the one-dimensional CBU images. Furthermore, that RCS was in agreement with different shifted direction, x-direction and y-direction of the two-dimensional CBU images. Hence, this methodology was built up to analyze the CBU, and the Relative Contrast Sensitivity (RCS) was derived to be the quantification index. Although only the white block was used as the testing image, the proposed method is applicable to any complex images under any panel specification and viewing conditions, with moderate parameter settings. The threshold RCS can be the design rule targeted for various FSC displays. Furthermore, the RCS could be used to evaluate
Chapter 5 Relative Contrast Sensitivity (RCS) Index
Verifications
5.1 Relative Contrast Sensitivity (RCS) Verifications on Various
Multi-primary Color Fields
A methodology that can quantify CBU in matching the actual perceptual result under various viewing conditions and evaluate the visibility of CBU in moving images with a fixed view has been established. However, the methodology must be performed by the verifications on various multi-primary color fields to demonstrate the applicability.
The subjective evaluation was performed in order to evaluate the effect of various multi-primary color fields on CBU reduction. There are four kinds of CBU-suppression methods utilized to compare their RCS with RGB color fields. These CBU-suppression
methods are five color field arrangement (5-CFA), RGBWmin [34], RGBCY, and RYGB,
respectively. The psychometric evaluations were performed to correlate the sensitivity of the CBU fringe with perceptual annoyance. The perceptual annoyance was then scaled by the relative mean opinion score (RMOS), the scale from 5 to 1 denotes the CBU phenomenon from slightest to the most serious.
A still image on the FSC LCD was used for the subjective evaluation. The colors of testing images distinguish into five kinds of variety: (1) white, (2) Asia skin, (3) Light skin, (4)
Table 8 The gray level of each color Color R G B White 255 255 255 Asia Skin 213 139 112 Light Skin 205 163 144 Strong Red 186 70 73 Sky Blue 65 75 163
The visibility of CBU can be computed according to the aforementioned procedures. It is noted that the CBW of each CBU image must be the same because higher CBW result in higher RCS. In general, observers focus on the fringes of CBU image and notice such details when CBU becomes unacceptable. In this subjective evaluation, the width of stimulus was set as width 57mm on a FSC LCD. Furthermore, the total CBW of stimulus was set as 12mm.
After the RCS of each CBU image was obtained, the degree of correlation between the
RMOS and the corresponding RCS was evaluated. The results, as tabulated in Table 9, and the
correlation coefficient, well-above 70%, exhibit a high degree of correlation between RMOS and RCS.
Table 9 The relationship between RCS and RMOS with various multi-primary color fields and testing image.
Multi-primary Color Fields
5-CFA RGBW RGBCY RYGB RGB
White RCS 0.77 0.77 0.91 0.96 1 RMOS 5 5 3 2 1 Correlation -100% Multi-primary Color Fields
5-CFA RGBCY RGBW RYGB RGB
Asia Skin RCS 0.62 0.65 0.68 0.91 1 RMOS 5 4 3 2 1 Correlation -100% Multi-primary Color Fields
5-CFA RGBCY RGBW RYGB RGB
Light Skin
RCS 0.69 0.75 0.91 0.94 1
RMOS 5 3 4 2 1
![Fig. 4 The encoding of cone signals into opponent-colors signals in the human visual system [13]](https://thumb-ap.123doks.com/thumbv2/9libinfo/8709925.199922/18.892.304.607.141.704/fig-encoding-signals-opponent-colors-signals-human-visual.webp)
![Fig. 5 Spatial contrast sensitivity functions for luminance and chromatic contrast [13]](https://thumb-ap.123doks.com/thumbv2/9libinfo/8709925.199922/19.892.298.610.470.785/fig-spatial-contrast-sensitivity-functions-luminance-chromatic-contrast.webp)
![Fig. 6 Temporal contrast sensitivity functions for luminance and chromatic contrast [13]](https://thumb-ap.123doks.com/thumbv2/9libinfo/8709925.199922/20.892.136.793.477.907/fig-temporal-contrast-sensitivity-functions-luminance-chromatic-contrast.webp)
![Fig. 12 Color variation route in L*u*v* color space [9].](https://thumb-ap.123doks.com/thumbv2/9libinfo/8709925.199922/27.892.171.787.110.728/fig-color-variation-route-in-l-color-space.webp)
![Fig. 13 Target virtual display, the two-axis tilting mirror and the 90° deflecting C-mount optics [20]](https://thumb-ap.123doks.com/thumbv2/9libinfo/8709925.199922/28.892.181.705.123.455/target-virtual-display-tilting-mirror-deflecting-mount-optics.webp)
![Fig. 14 Relation between the time and the location of moving image on single field rate [26]](https://thumb-ap.123doks.com/thumbv2/9libinfo/8709925.199922/29.892.269.643.499.712/fig-relation-time-location-moving-image-single-field.webp)
![Fig. 16 Simulation results on white or whitish magenta solid rectangles moving towards right on a black background [31]](https://thumb-ap.123doks.com/thumbv2/9libinfo/8709925.199922/31.892.170.777.184.722/simulation-results-white-whitish-magenta-rectangles-moving-background.webp)
![Fig. 18 A crossing object is moving from left to right at speed S and the observer’s eye is tracing from right to left at speed M [33]](https://thumb-ap.123doks.com/thumbv2/9libinfo/8709925.199922/32.892.244.688.575.934/crossing-object-moving-right-speed-observer-tracing-speed.webp)
