行政院國家科學委員會專題研究計畫 成果報告
探討消費者對先進旅行者資訊系統的衍生性商品之評估-以
GPS 導航手機為例
研究成果報告(精簡版)
計 畫 類 別 : 個別型 計 畫 編 號 : NSC 98-2410-H-009-007- 執 行 期 間 : 98 年 08 月 01 日至 99 年 07 月 31 日 執 行 單 位 : 國立交通大學運輸科技與管理學系(所) 計 畫 主 持 人 : 任維廉 計畫參與人員: 博士班研究生-兼任助理人員:呂明穎 報 告 附 件 : 出席國際會議研究心得報告及發表論文 處 理 方 式 : 本計畫可公開查詢中 華 民 國 99 年 08 月 10 日
一、 前言
隨著經濟的發展,經濟活動的日益頻繁,車輛的持有率居高不下,因而造成許多地區及道路的交 通不堪負荷。各界為了日益嚴重的交通問題,已漸漸轉成應用先進科技,利用資訊、通訊、控制及電 子等技術,來改善交通擁擠,甚至達到減少交通事故、降低能源消耗與減少環境污染等效益,此即為 『智慧型運輸系統 (Intelligent Transportation System, ITS)』(交通部運輸研究所 民國 93 年)。ITS 發展 領域中,先進旅行者資訊系統(Advanced Traveler Information System, ATIS)是與民眾最密切相關的系
統。導航系統即為ATIS 中重要的應用,其利用全球衛星定位系統(Global Position System,GPS)與地理
資訊系統(Geographic Information System,GIS)為基礎,提供用路者行的安全,行的方便快速,並非只 是侷限於動態定位,而是廣泛的包括定位與定位後的導引工作,導引的工作包含了最佳路徑的選取與 方向導引(Krakiwsky et al. 1987)。隨著科技的進步,以及消費者對便利性的需求上升,漸漸出現許多先 進旅行者資訊系統相關之衍生性新產品,GPS 導航手機便是其中之一。在研發改進 GPS 導航手機等 ATIS 衍生性新產品的過程,企業需要投入大量的人力與金錢(Stevens and Burley 2003),若新產品推出 後不能獲得消費者的青睞,不僅無法回收該次投資的成本,還可能對公司整體的營運與形象造成很大 的傷害。生產製造這類新產品首要面對的問題即如何讓消費者接受使用,特別是業者需要投入巨額資 金設計與研發(Stevens and Burley 2003)。因此,瞭解消費者如何評估這些新產品將成為很重要的課題。
過去研究指出,由於新產品在功能或外觀上不同於現有市場上的一般商品,導致消費者無法立即 確定新產品能帶來的幫助以及其使用方式,而對新產品評估產生困擾(Rosch and Mervis 1975, Alba and Hutchinson 1987, Chakravarti and Xie 2006)。相關文獻更進一步指出這種不確定性所產生的負面影響, 主要是因為其所衍生出的知覺風險,因此當消費者認為購買新產品的風險越高時,會降低其購買的意 願(Cox 1967, Stone and Gronhaung 1993),一般研究認為消費者會從財務面、功能面、身體面、社會面 與心理面來衡量特定事件或產品的整體風險。但在新產品特性的研究中則指出,消費者會進一步考量 學習使用新產品所帶來的困擾,像是擔心要從頭學習用該產品、學習所需花費的時間等問題。因此, 不同特性的顧客會藉由不同的學習策略來學會新產品的使用方式(Brucks 1985, Spence and Brucks 1997)。然而,過去文獻很少針對新產品特性所衍生之知覺風險進行深入分析,因此無法全面瞭解影響 消費者評估新產品的因素,而本研究認為新產品除了具有前述一般產品的五項風險外,還有消費者為 了瞭解新產品使用方式而產生的學習風險,且需要進一步探討不同風險對新產品評估所造成的影響。
此外,相關研究亦指出,市場上的資訊不對稱是導致消費者產生不確定感與知覺風險的主要因素 之一(Rosch and Mervis 1975, Chakravarti and Xie 2006)。因此企業可以透過提供產品資訊來舒緩資訊不 對稱的情況,這是因為資訊的內容是消費者作為瞭解產品功能與特性的線索,進而減少其對於新產品 所知覺的風險(Klopfenstein 1989, Van den Bulte 2000)。新產品的相關研究更進一步指出,不同資訊類型 對於新產品的評估會有不同的影響(Moreau et al. 2001, Rogers 1983, Chakravarti and Xie 2006)。然而,本 研究為了要確實瞭解資訊類型對新產品評估的影響,將從資訊內容對新產品效用(utility)的描述方式進 行探討,由於效用是由獲得的效益(benefit)與損失的成本(cost)所構成。因此,提升消費者對新產品評價 的資訊型態可分為兩類:趨利型(promotion)資訊與避害型(prevention)資訊,所謂的趨利型資訊是從增 加正面好處的觀點,強調新產品可以增加的效益,而避害型資訊則是從減少負面壞處的觀點,著重在 新產品所能減少的付出、問題或是缺點。本研究認為透過分析趨利型資訊與避害型資訊對於降低知覺 風險的影響,可以作為行銷實務上更有幫助的依據。 二、 研究目的 基於上述的研究背景與動機。主要研究目的如下: (1) 探討消費者在面對 GPS 導航手機等 ATIS 之衍生性的新產品時,可能會考量到的風險,其中 包括知覺一般風險與知覺學習風險。 (2) 探討消費者面對 ATIS 之衍生性的新產品時,知覺到的風險對產品評估的影響。依據新產品的 特性推導新產品所產生的知覺風險類型,包括知覺一般風險與知覺學習風險,並分析不同知 覺風險對新產品評估的影響。
(3) 探討 ATIS 衍生性的新產品不同的資訊內容對消費者面對產品所知覺到的風險之影響。包括資 訊是否可以降低風險,以及本研究提出的不同資訊類型(趨利型與避害型),影響知覺風險效果 的差異。 (4) 針對分析結果提出營運上與管理上的建議,提供 ATIS 衍生性產品業者在推出新產品於市場上 的參考。更深入的瞭解消費者對新產品評估的過程,以提供實務界在推廣新產品時的建議, 來提升消費者對新產品的接受度,進而轉化為企業的實質獲利。 三、 文獻探討
3.1 智慧型運輸系統(Intelligent Transportation Systems, ITS)
自1960 年代起,先進國家即開始研究應用資訊、通信及控制等技術來改善交通問題。1980 年代
中期以後,在此領域之研究便蓬勃發展。運用先進的電子、通信、資訊、車輛及控制等技術,以整合 人/貨、路、車的管理策略,提供即時的資訊,從而建立涵蓋陸、海、空領域及發揮全方位功能的交通 管理系統,此即所謂的智慧型運輸系統(交通部運輸研究所 民國 88 年)。整體而言,ITS 可以分為九個 子系統,其中先進旅行者資訊系統(Advanced Traveler Information Systems, ATIS 是提供使用者藉由先 進資訊、通訊及其他相關技術,提供旅行者必要之資訊,使其能於車內、家裡、辦公室、車站等地點 方便地取得所需之資訊,也是和民眾最直接接觸的部分。 ATIS 相關技術與應用中結合 GPS 和 GIS 技術的導航系統近年來一直受到廣泛的討論,市面上不 斷的有許多相關的產品出現,而此類的產品也不侷限於單一功能產品,漸漸的手機結合導航功能的新 產品也開始受到廠商的青徠。但這些新產品的推出,往往需要耗費相當大的資金與各方面的投入,投 入後的推廣與銷售將成為首要面對的問題。因此,對於此類科技新產品的推出後,相關的議題也廣泛 的受到各方得注意與研究討論(Davis et al. 1989; Van den Bulte and Stremersch 2004)。
3.2 新產品採用與風險 Kotler(1997)曾定義創新的概念,認為不管是實質產品、服務、概念、或是創意,只要被人們認為 是新穎的,就是創新,可稱為創新的產品。過去有許多有關新產品採用的研究,透過這些研究可幫助 學者們與管理者更深入的瞭解顧客的行為。Rogers(1983)提出創新擴散過程,認為創新擴散是新創意經 由社會特定的通路,隨著時間演進,在社會體系成員之間散播創新成果的擴散過程。Roberson(1967) 和Schiffman 和 Kanuk(1987)認為創新擴散及採用是企業在特定時間段,針對目標市場的消費者,經由 大眾傳播來使目標顧客採用創新的一種過程。Davis 等(1989)提出科技接受模式,以理性行動理論 (Theory of Reasoned Action, TRA)為基礎,認為影響使用者接受新科技的外在因素,是透過感知易用性 (perceived ease of use)與感知有用性(perceived usefulness)兩個關鍵仲介因素,對使用者之使用行為意向 產生影響,認為信念會影響態度,態度再進一步影響行為意向,再轉而影響實際行為。本研究針對新 產品評估的部分,採用科技接受模式(TAM)之感知易用性與感知有用性兩方面來衡量。 由於新產品具不確定性,消費者易產生感知風險,而感知風險的高低將影響顧客對新產品的評估, 因此瞭解感知風險將有助於進一步認識顧客對於新產品的評估。感知風險的概念,最早由Bauer(1960) 從心理學中發展而提出的,認為人們的任何選擇行為必存在著風險,人們無法確定預期選擇的結果, 因此他主張人們許多的行為,都可以用感知風險來解釋。Cox(1967) 與 Cunningham(1967)認為人們之 所以會在面對選擇行為時,感知到風險的產生,主要是來自於兩個方面:不確定性(uncertainty)與後果 性(consequence)。Jacoby and Kaplan(1972)提出了消費者行為中,感知風險為一個多構面的結構,共包 含五個層面的內容要素: 財務風險(financial risk)、功能風險(functional or performance risk)、身體風險 (physical risk)、社會風險(social risk)、心理風險(psychological risk)。迄今為止對產品感知風險研究偏重 於產品本身不確定性導向的風險,主要研究擔心使用這個產品結果的問題,這些問題在顧客接觸新產 品時也會產生。然而,顧客在面對新概念時,還有關於學習認識上的問題,像是要如何從現存的產品、 或是經由先前知識,來幫助自己聯想新產品可能樣子與表現,不確定認識或學會使用新產品所要付出 的時間、不確定此過程中可能遭遇的困難、不確定解決這些問題可能需要付出的努力等學習認識上的
相關問題。很少有研究涉及這些可能的學習風險,究竟有哪些學習風險影響顧客對於新產品的評估, 另外,不同的學習風險對於新產品評估是否也有不同的影響也未受到進一步的討論。
3.2 資訊型態
提供給消費者比較型資訊,指的是告訴消費者此新產品其相對表現優勢(relative performance)的資 訊(Rogers 1983, Chakravarti and Xie 2006),也就是此新產品與現存產品相較下,其能提供給消費者較大 價值或滿足感的地方(Roberston 1985),這種使消費者感知的產品相對優勢,可由產品的價格與品質關 係、消費者使用後所獲得的效益報酬等方面來探討,可說是產品帶來的利益(Holak 1990)。企業可經由 提供比較型資訊,使消費者衡量哪種產品才是較符合自己的需求,較能夠為自己帶來生活上或工作上 的幫助,而使他們最後能夠感到自信的選擇要使用的產品(Chakravarti and Xie 2006)。
過去研究主要將資訊分成類別型資訊或比較型資訊,而這種分法,用於探討新產品時容易造成混 淆,因為比較型資訊在提供相對於其它類似產品表現優勢訊息的同時,也提供了類別型的資訊,使用 此分類法來探討新產品評估,無法確實地瞭解不同資訊所造成的影響。本文提出更符合新產品資訊之 分類方式-趨利型資訊與避害型訊息,過去研究指出,消費者想從資訊中瞭解新產品帶來的效用,因 此,不同內容的呈現方式,對人們降低不確定感等風險是否會有所差異,值得深入探討。 四、 研究方法 4.1 研究模式構建 本研究架構分為ATIS 衍生性新產品知覺風險類型、ATIS 衍生性新產品提供之資訊的有無及內容、 與新產品評估。研究一為探索消費者在面對新產品時,會知覺到的不確定感,藉此了解消費者在面對 ATIS 衍生性新產品時感知的風險,是否除了與面對一般產品一樣,有財務、功能、身體、社會和心理 風險外,尚有額外的學習相關風險,包含學習時間、遭遇困難、解決問題等風險。其他的目的有二: (1)提供研究二之知覺風險與產品評估相關性分析所需之資料(無資訊情況下,知覺風險與產品評估的關 係)。(2)提供研究三之新產品資訊對消費者知覺風險差異影響分析,其所需的資料。本研究之架構如圖 1 所示。 圖1、研究架構 4.2 研究假設 4.2.1 新產品感知風險與評估 由於新產品具新功能,顧客需仰賴對一般產品的知識來學習使用新產品,而先前知識的多寡會影 響顧客的學習方式 (Brucks 1985)。雖然,顧客可透過不同的策略來學習使用新產品,但在未真正接觸 與使用該產品前,勢必對學習過程是否會發生問題與效果如何存在不確定感,因此本文認為在新產品 的特性下,顧客對於學習的過程與結果會產生感知風險,在本研究稱為「感知學習風險」。其中在學習 過程中,顧客需要考慮學習過程所需付出的時間,以及學習過程中是否會遭遇困難,本研究稱為「學
習時間風險」與「遭遇困難風險」,而在學習結果方面,顧客會擔心若仍無法順利使用新產品的功能時, 是否有相關資源能協助其解決面臨的學習問題,本研究稱為「解決問題風險」。 H1: 消費者對於新產品的感知風險,可分為感知一般風險、感知學習風險。(H1a)感知一般風險包 括財務風險、功能風險、身體風險、社會風險與心理風險;(H1b)感知學習風險包括學習時間 風險、遭遇困難風險與解決問題風險。 4.2.2 新產品感知風險與產品評估的關係 當顧客較能聯想商品的表現及可能帶來的幫助時,他們會較為勇敢的決定放棄替選產品,而感到 自信的選擇最後接受的產品 (Shafir and Tversky 1992;Chakravarti and Xie 2006)。因此,本文推論,在 新產品推出時,若能使顧客較為確定產品結果表現是否符合預期,帶來的價值是否符合支出,而確定 是否會造成心裡的懊悔負荷,或是是否會對自己或他人造成傷害,而得知會不會使自己在同濟中感到 難堪等問題,可讓顧客清楚地瞭解選擇此產品帶來的效益與影響,覺得此產品相對於其它商品對自己 有用、能減少完成某項特定事情或某項工作所需的時間、能幫助自己增進績效等,而感到此產品是符 合自己需求的正面看法。 H2-1: 感知一般風險與有用性評估有顯著負相關。(H2-1a)財務風險、(H2-1b)功能風險、(H2-1c)身體風 險、(H2-1d)社會風險、(H2-1e)心理風險與有用性為顯著負相關。
此外,人們面對新接觸的事物時,會擔心為了認識此事物所需付出的努力(Murphy and Ross 1994), 而感到此事物有不熟悉等負面的感覺,因此,對於這樣的事物,人們會傾向於藉由延遲購買的方式, 以降低自己感知到的負面感覺 (Yamauchi and Markman 2000)。因此,我們推論,在新產品推出時,若 能透過資訊的提供使顧客較為確定學會使用此產品所需花費的時間、學習使用此產品時可能遭遇的困 難、遭遇困難時解決問題所需付出的努力等問題,可讓顧客較為清楚的瞭解產品的定位,而感覺到這 個產品跟某種商品類似,因此容易上手,學會使用此產品,且不需付出很大程度的努力,較不會造成 負擔,而願意開始接觸認識此產品。 H2-2: 知覺學習風險與易用性評估有顯著負相關。(H2-2a)學習時間風險、(H2-2b)遭遇困難風險、(H2-2c) 解決問題風險與易用性為顯著負相關。 4.2.3 資訊內容對新產品感知風險的影響
當人們傾向趨利的目標時,他們會從未來趨勢來考慮事情 (Pennington and Roese 2003),會較集中 思考抽象願景的問題 (Keller et al. 2004)、這些有想像空間可以發揮、有趣、之後可以獲得享受的事 (Aaker and Lee 2001);相對的,若是傾向避害的目標導向,則較專注於當下的情況,考慮實在的事物、 現實具體的問題,會傾向保持現況穩定 (Liberman et al. 1999)、自己能夠控制身邊事物的狀況 (Friedman and Forster 2001)。 因此,我們推論,若能借著行銷活動中呈現或隱含趨利型資訊(本研究定義),使顧客專注於選擇此 產品得到的額外的效益(趨利型目標),進一步讓顧客著重于增加未來的、願景的、抽象的效益,從較為 長久的方向來考慮此產品。因此會覺得現在學習是有益的、值得的,而覺得學習風險較低;但另一方 面,也會擔心這樣的效益可能不切實際,而使顧客覺得這樣的產品功能不符合目前需求而感受到買了 可能覺得不值得等問題,因此容易讓人們感知此產品的功能、社會、財務等一般風險較高。相對的, 我們推論,若能借著行銷活動中呈現或隱含避害型資訊(本研究定義),使顧客專注於選擇此產品可減少 的付出或避免的問題(避害型目標),進一步集中顧客注意力於此產品可減少目前的問題,使顧客較不擔 心值不值得現在購買等一般風險;但卻會因此讓顧客較無法專注思考確認購買後學習等問題,而使顧 客感知此產品的學習風險較高。 H3 : 新產品資訊內容的不同,消費者感知風險有顯著差異。 H3-1: 知覺一般風險在避害型資訊的情況下顯著較低。避害型資訊的(H3-1a)財務風險、(H3-1b)功能 風險、(H3-1c)身體風險、(H3-1d)社會風險、(H3-1e)心理風險皆顯著較低。 H3-2: 知覺學習風險在趨利型資訊的情況下顯著較低。趨利型資訊的(H3-2a)學習時間風險、(H3-2b)
遭遇困難風險、(H3-2c)解決問題風險皆顯著較低。 4.3 構念測量
本研究的問卷皆以李克特(Likert scale)七尺度問項設計,亦即同意程度分為「非常不同意」、「不同 意」、「稍微不同意」、「普通」、「稍微同意」、「同意」、「非常同意」,從1 至 7 之計量方式編碼(coding)。 故若易用性的平均數值愈高,表示民眾感覺此新產品更為容易使用。
在感知風險的部份,本研究參考Stone and Gronhaung(1993)研究中的風險類型與研究問卷題項,來
做為本研究設計消費者感知新產品之一般風險程度問項的準則,其中財務風險是指消費者不確定購買 使用某產品後,所花的錢是否高於產品的價值,共設計 3 個問項(V01-V03);功能風險是指消費者不確 定產品的效能會不會為自己帶來幫助,共設計 4 個問項(V04-V07);身體風險是指使用產品會不會對於 自己或他人身體造成傷害的不確定性,共設計 4 個問項(V08-V11);社會風險是指其它人對消費者使用 產品評價的不確定性,共設計 4 個問項(V12-V15);心理風險是指購買某產品會不會不符合消費者的自 我價值,所造成的心理負擔,共設計4 個問項(V16-V19)。 在學習風險方面,本研究先針對30 位受訪者進行焦點團體訪談,以瞭解消費者在學習新產品過程 中可能會遭遇的問題,經過本研究的彙整分析後,初步獲得三種學習風險類別,本研究分別命名為學 習時間風險、遭遇困難風險與解決問題風險,其中學習時間風險是指消費者對於學習使用產品過程所 需花費時間的不確定性,本研究設計3 個問項(V20-V22);遭遇困難風險是指消費者對於學習使用產品 過程中可能遭遇困難的不確定性,本研究設計3 個問項(V23-V25);解決問題風險是指當消費者在學習 產品過程中必須解決問題時,所需付出努力的不確定性,本研究設計3 個問項(V26-V30)。 在產品評估的部份,本研究根據過去文獻,將其分為感知易用性與感知有用性,相關問項為根據 科技接受模式(TAM)之部分適合問項而來,並考慮新產品特性,以及與相關學者訪談後,而做了適度 的修改。其中感知易用性系指新產品容易使用的程度,包括 4 個問項(V31-V34);而感知有用性是指新 產品能夠帶來幫助的程度,包含4 個問項(V35-V38)。 五、 結果與討論 5.1 研究一:新產品感知風險類型之探索性因素分析 研究一主要之目的在分析因應新產品特性下,消費者所感知到的風險類型,根據本研究之假設可 將新產品感知風險分為 8 類,分別為財務、功能、身體、社會、心理、學習時間、遭遇困難與解決問 題風險。本次調查總共回收問卷171 份,剔除無效問卷 4 份,於有效問卷的 167 位受訪者中,男性 79 人(47.3%),女性 88 人(52.7%);年齡主要為 20-29 歲 122 人(73.0%)。受訪者針對本研究所設定的新產 品(結合手機與衛星定位導航車機),填答所設計的感知風險問項(V01-V30)。 本研究針對所收回之問捲進行探索性因素分析,根據分析結果顯示本次調查的取樣適切性量數 (Kaiser-Meyer-Olkin measure of sampling adequacy; KMO)值為 0.820,因此是適合進行因素分析。此外, 根據巴特利(Bartlett)球體檢驗顯示 χ2(df=435. n=171)=4035.204,P-value<0.001,代表母體的相關榘陣之間有 共同因素存在,所以也顯示所收集之資料是適合進行因素分析。本研究的探索性因素分析是採用主成 分分析法(principal component analysis),並使用正交轉軸法來進行因素轉軸,而因素挑選的標準則是選 取特徵值(eigenvalues)大於 1 的因素。根據上述之原則,本研究成功提取 8 個新產品感知風險的因素, 且各因素與所對應衡量變數之關係皆符合本研究之推論,因此研究假設 1 獲得支持。且各衡量變數之 因素負荷量皆大於 0.6,而各因素的信度係數也都大於 0.8,本研究所提出新產品的 8 個感知風險累積 解釋方差變動的 79.251%。因此,消費者對新產品的感知風險類型確實可以分為 8 類,且有相當高的 解釋能力,且本研究所設計對應之衡量問項具有相當好的信度與效度。 5.2 研究二:新產品資訊之操弄性檢定 根據自我規範導向理論,本研究認為可將新產品資訊區分為趨利型與避害型資訊,並對新產品感
知風險與評估有不同的影響。為驗證相關研究假設,本研究針對所設定的新產品(結合手機與衛星定位 導航車機)設計兩種不同的資訊。在趨利型資訊方面,主要在描述新產品所能帶來的正面效益與幫助, 而避害型資訊則是在說明新產品能為消費者減少的負面問題與困擾。 表1 操弄性檢驗結果與信度 資訊類型 樣本數 問項 平均數 F值 (顯著性) Cronbach’s α 問項 平均 數 F值 (顯著性) Cronbach’s α 趨利型 34 4.500 5.529 避害型 32 M01 5.750 21.000 (P<0.001) M06 4.656 (P<0.001) 13.943 趨利型 34 5.000 5.500 避害型 32 M02 5.813 14.858 (P<0.001) M07 4.500 (P<0.001) 18.035 趨利型 34 4.824 5.735 避害型 32 M03 5.875 24.079 (P<0.001) M08 4.813 (P<0.001) 15.627 趨利型 34 4.029 5.441 避害型 32 M04 5.250 18.073 (P<0.001) M09 4.438 (P<0.01) 12.32 趨利型 34 4.706 5.824 避害型 32 M05 5.844 20.304 (P<0.001) 0.818 M10 4.844 (P<0.001) 21.476 0.856 本研究希望受測者閱讀趨利型資訊後,能夠確實相信新產品可以帶來正面的效益,而閱讀避害型 的受訪者能夠相信新產品可以減少負面的困擾,因此為了確認所設計的兩種資訊內容可以有效的傳達 正確的效果,本研究在全面調查前,先針對資訊內容的有效性進行操弄性檢定(manipulation test)。本研 究分別設計 5 個問項,來衡量資訊內容在避害與趨利方面的效果。分析結果顯示,本研究所設計的操 弄性問卷具有良好的信度,兩個構面的Cronbach’s α 皆大於 0.8。此外,根據差異性檢定的結果顯示, 閱讀趨利型資訊的受訪者(相較於閱讀避害型資訊),更相信新產品能夠帶來正面的幫助,如讓處理事情 更有效率、更準確,因此閱讀趨利型的受訪者,在M6-M10的分數是顯著高於閱讀避害型資訊的受訪者; 而閱讀避害型資訊的受訪者(相較於閱讀趨利型資訊),更相信新產品能夠減少負面的困擾,如減少花費 與時間、不需額外攜帶用品,因此閱讀避害型資訊的受訪者,在 M01-M05 的分數是顯著高於閱讀趨利 型資訊的受訪者。整體而言,本研究所設計的兩種資訊是具有相當的準確性與穩定性,如表1 所示。 5.3 研究三:新產品資訊對感知風險與產品評估之影響分析 研究二總共回收問卷364 份,剔除無效問卷 9 份,於有效問卷的 355 位受訪者中,閱讀趨利型資 訊的受測者為 177 人(49.9%),閱讀避害型資訊的受測者為 178 人(50.1%);男性 168 人(47.4%),女性 187 人(52.6%);年齡主要為 20-24 歲 147 人(41.4%)、25-29 歲 62 人(17.4%);職業主要為上班族 153 人 (43.0%)、學生 137 人(38.5%)。
本研究首先進行確認性因素分析(confirmatory factor analysis),以探討本研究所設計問項的穩定性
與準確性。根據確認性因素分析結果顯示,本研究所建構包含 10 個潛在構面(包括財務風險、功能風
險、身體風險、社會風險、心理風險、學習時間風險、遭遇困難風險、解決問題風險、易用性與有用 性),與 38 個衡量變數的衡量模式,其 χ2 (df=629, N=355) =1544.632, p-value < 0.001,為具有顯著差異, X2/df=2.491,符合一般小於 5 的要求。此外,模式擬合度指標 NFI=0.877, IFI=0.923, TLI=0.912, CFI, 0.922, RMSEA=0.065,皆以符合相關研究的門檻值,因此可推論本研究的衡量模式與資料有一定程度的吻合。
在問項信度分析方面,分析結果顯示本研究的10 個潛在構面的 Cronbach’s α 介於 0.874(遭遇困難
風險)-0.939(社會風險)(需大於 0.7),而混和信度介於 0.878(遭遇困難風險)-0.940(社會風險),顯示本研 究的問項有相當良好的一致性。此外,本研究藉由計算平均變異萃取量(average variance extracted)以瞭
解各潛在構面之變異可以被衡量變數解釋的程度,分析結果顯示10 個潛在構面的平均變異萃取量值介 於0.660(解決問題風險)-0.797(社會風險),表示所設計的衡量問項皆可有效的解釋所對應的潛在構面。 在效度分析方面,由於本研究中的財務、功能、身體、社會與心理風險,以及易用性與有用性的 衡量問項接根據相關文獻所發展的量表,而本研究所提出學習風險所對應的問項,亦經過焦點團體訪 談,以及探索性因素分析(研究一),因此可以推論本研究所設計的問項具有良好的內容效度。此外,根 據確認性因素分析所獲得38 個衡量變數的標準化因素負荷量值介於 0.686(V11)-0.931(V14與V30),顯示 衡量變數與潛在構面間的高度相關,所以可以推論本研究設計的衡量問項有相當程度的收斂效度。在
區別效度分析方面, Fornell and Larcker (1981)利用構面間的相關榘陣進行區別效度分析,在此方法下 潛在構面的平均變異萃取量的均方根值,必須大於其它同構面下的相關係數。根據本研究的分析結果
皆符合上述的分析準則,所以可以推論本研究的衡量模式具有區別效度,如表2 所示。
表2 區別效度分析
FR FUNR PHYR SR PSYR LR1 LR2 LR3 EOU UF
FR .860 FUNR .734 .822 PHYR .329 .414 .870 SR .509 .543 .357 .893 PSYR .504 .563 .468 .569 .865 LR1 -.075 -.056 .067 .155 .119 .873 LR2 .067 .058 .190 .241 .370 .636 .841 LR3 .174 .225 .282 .292 .371 .426 .632 .831 EOU -.185 -.172 -.127 -.238 -.375 -.388 -.618 -.549 .889 UF -.572 -.599 -.282 -.414 -.497 .069 -.065 -.157 .412 .886 FR:財務風險;FUNR:功能風險;PHYR:身體風險;SR:社會風險;PSYR:心理風險;LR1:學習時間風險;LR2:遭遇困難風險;LR3:解決問題 風險;EOU:易用性;UF:有用性。 對角線之數值(粗體字)代表平均變異萃取量的均方根,而非對角線為各構面間的相關係數 在確認本研究所設計問項的信度與效度後,本研究針對相關研究假設進行驗證,分析結果詳見表 3。分析結果顯示當消費者感知一般風險(包括財務、功能、身體、社會與心理風險)越高時,他們會認 為新產品的易用性與有用性越低,意即感知一般風險與易用性與有用性為負相關,此部份的結果支持 H2-1(a-e)。再者,分析結果亦顯示當學習風險 (包括學習時間、遭遇困難與解決問題風險)越高時,消費 者認為新產品的易用性越低,但與有用性的評估則沒有關係,因此H2-2(a-c)獲得支持。 表3 新產品各類風險與新產品評估之相關性分析 一般風險 感知易用性 感知有用性 學習風險 感知易用性 感知有用性 財務風險 -0.136** -0.496*** 學習時間風險 -0.350*** 0.028 功能風險 -0.114** -0.469*** 遭遇困難風險 -0.507*** -0.041 身體風險 -0.112** -0.171*** 解決問題風險 -0.416*** -0.051 社會風險 -0.150** -0.270*** 心理風險 -0.338*** -0.373*** ***p<0.001; **p<0.01; *p<0.1 最後,本研究分析不同自我規範導向的資訊類型對新產品感知風險的影響,詳見表 4。根據分析 結果顯示,相較於閱讀趨利型資訊,當受訪者是閱讀避害型資訊時,他們認為此項新產品能避免一些 困擾,所以消費者感知的一般風險較低,且此結果在一般風險的 5 類風險中皆達統計的顯著水準,因 此 H3-1(a-e)獲得支持。在學習風險方面,相較於閱讀避害型資訊,當受訪者是閱讀趨利型資訊時,他們 認為此新產品能帶來較多正面的幫助,因此感知到的學習風線較低,上述的分析結果在學習風險中的 3 類風險皆達統計的顯著水準,支持 H3-2(a-c)。 表4 新產品知覺風險在不同資訊內容下的差異 一般風險 資訊類型 平均數 F 值 學習風險 資訊類型 平均數 F 值 趨利型 3.339 趨利型 5.009 財務風險 避害型 3.112 3.207 ** 學習時間風險 避害型 5.236 3.812 * 趨利型 3.725 趨利型 4.347 功能風險 避害型 3.289 14.203 *** 遭遇困難風險 避害型 4.661 7.246 ** 趨利型 4.054 趨利型 3.842 身體風險 避害型 3.819 3.099 * 解決問題風險 避害型 4.270 13.438 *** 趨利型 4.568 社會風險 避害型 4.008 19.399 *** 趨利型 3.353 心理風險 避害型 3.138 2.917 * ***p<0.001; **p<0.01; *p<0.1 5.4 結論與管理意涵 由於ATIS衍生性新產品擁有與現有市場上產品不同的功能,導致消費者對於購買這類新產品的不 確定性,進而產生感知風險,然而過去研究大多僅以購買產品時的一般風險進行探討,但本研究認為
消費者在面對ATIS相關新產品的新增功能時,還必須要進而產品使用的學習,而這個學習的過程中仍 有許多的不確定性。因此,本研究依據新產品的特性,提出兩大類新產品的感知風險:一般風險與學 習風險,其中,一般風險包含財務、功能、身體、社會、心理風險,而學習風險則包含學習時間、遭 遇困難、解決問題風險。本研究依據各構面設計適當的衡量問項,並針對一般消費者進行問卷調查, 根據所回收的資料進行探索性因素分析,研究一的分析結果顯示消費者確實可區分上述8類的感知風 險,且本研究所設計的問卷具有良好的信度與解釋能力(支援H1)。 此外,過去相關研究指出感知風險會影響消費者對產品的評估,本研究進一步探討上述兩大類新 產品感知風險對於新產品評估的影響。根據研究二的分析結果顯示,當消費者感知到購買新產品的一 般風險較高時,他們會認為購買此新產品較無法帶來幫助,故對有用性的評估較低(支持H2-1)。然而, 若消費者認為新產品在學習方面有比較多的不確定性(學習風險較高),則他們會認為此新產品在使用上 並不是很簡單,因此對於易用性的評估較低(支持H2-2)。 最後,為了能降低消費者對新產品的感知風險,本研究繼續分析不同產品資訊類型對於新產品感 知風險的影響,且為了讓資訊內容更符合實際的情況,本研究根據自我規範導向理論設計兩類新產品 的資訊:趨利型資訊與避害型資訊。而根據研究3的分析結果顯示,當資訊內容是針對新產品所能避免 的困擾進行說明時(避害型資訊),消費者對於財務、功能、身體、社會與心理方面的感知風險程度較低 (支援H3-1),然而若資訊內容主要是說明新產品能為消費者帶來的幫助時(趨利型資訊),他們對於學習 時間、遭遇困難與解決問題的感知風險較低(支持H3-2)。 本研究結果亦指出,當企業在推出GPS手機相關新產品時可針對不同特性之顧客群給予不同類型 之資訊,若企業推出新產品的主要顧客群是對學習風險較為敏感,例如年紀稍長的中高階的主管,他 們已經有相當的經濟與社會地會,因此對於一般風險的承受程度較高,但他們對新科技的瞭解程度相 對較低,這可能會導致他們有較高的學習風險,所以針對這類顧客群,企業可藉由提供趨利型資訊以 有效降低學習風險,以及提升對產品易用性的評估,進而提升購買意願。相對的,若新產品的目標顧 客群對於一般風險比較敏感,例如學生族群,他們對於新科技有較高程度的涉入,且也較願意嘗試、 學習新事物,但相對的他們沒有穩定的收入,且在意同儕之間的意見與看法,因此容易產生較高程度 的一般風險,企業對這類型顧客則可提供避害型資訊,以期能有效降低他們感知的一般風險,並提升 對產品有用性的評估。然而不論是趨利型或避害型資訊皆無法同時降低兩種新產品風險,且行銷人員 也無法立即與確實判斷顧客對一般風險或學習風險的承受程度,因此對於企業在推廣GPS等相關新產 品時,或許最佳的方式是同時包含趨利型與避害型資訊。 參考文獻 [1] 交通部運輸研究所,『台灣地區發展智慧型運輸系統網要計畫-ITS 發展領域與使用者服務之供、 需調查分析』,民國88 年 8 月。 [2] 交通部運輸研究所,『台灣地區智慧型運輸系統綱要計畫』,民國 93 年 5 月。
[3] Aaker, J. and Lee, A. (2001), “‘I’ Seek Pleasures and ‘We’ Avoid Pains: The Role of Self-Regulatory Goals in Information Processing and Persuasion,” Journal of Consumer Research, 28 (June), 33-49. [4] Alba, Joseph W. and J. Wesley Hutchinson (1987), "Dimensions of Consumer Expertise," Journal of
Consumer Research, 13 (March), 411-454.
[5] Brucks, M. (1985), “The effects of product class knowledge on information search behavior,” Journal of Consumer Research, 12, 1-16.
[6] Bauer, R. A. (1960), Consumer Behavior as Risk Taking, Dynamic Marketing for a Changing World, Chicago: American Marketing Association.
[7] Chakravarti, Amitav and Jinhong Xie (2006), “The Impact of Standards Competition on Consumers: Effectiveness of Product Information and Advertising Formats,” Journal of Marketing Research, 43(May), 224-36.
[8] Cox, D. F. (1967), Risk Taking and Information Handling in Consumer Behavior, Cambridge, MA: Harvard University Press.
[9] Cunningham, S. M. (1967), The Major Dimensions of Perceived Risk, Cambridge, MA: Harvard University Press.
[10] Davis, F.D., Bagozzi, R. P. and Warshaw, P.R. (1989), “User Acceptance of Computer Technology: A Comparison of two theoretical models”, Management Science, 35, 982-1003.
[11] Fornell, C. and Lacker, D. F. (1981), “Evaluating Structural Equations Models with Unobservable variables and measure error,” Journal of Marketing Research, 18 (February), 39-50.
[12] Friedman, R.S. and Forster, J. (2001), “The Effects of Promotion and Prevention Cues on Creativity,” Journal of Personality and Social Psychology, 81 (December), 1001-1013.
[13] Holak, Susan L. and Donald R. Lehmann (1990), “Purchase Intentions and the Dimensions of Innovation: An Exploratory Model,” Journal of Product Innovation Management , 7, 59-73.
[14] Jocaby, J. and Kaplan, L. (1972), The Components of Perceived Risk, Chicago: Association for Consumer Research.
[15] Keller, P., Lee, A. Y., and Sternthal, B. (2004), “Construing Fit to Judgment: The Effects of Regulatory Focus and Level of Construal,” Kellogg School of Management, Northwestern University.
[16] Klopfenstein, Bruce (1989), “Forecasting Consumer Adoption of Information Technology and Services: Lessons from Home Video Forecasting,” in The VCR Age: Home Video and Mass Communication, Mark R. Levy, ed. Newbury Park, CA: Sage Publications, 21-39.
[17] Kotler, P. (1997), “Analysis, Planning Implementation and Control” in Marketing Management, 9th ed. Prentice-Hall Inc.
[18] Krakiwsky, E. J., H. A. Karimi, C. Harris and J, George, 〝Researchnito Electronic Maps And
Auto-Matic Vehicle〞, AUTO-CARTO 8, Baltimore, Maryland, March 29-April 3, 1987, pp572~583. [19] Liberman, N., Idson, L.C., Camacho, C.J., and Higgins, E.T. (1999), “Promotion and Prevention Choices
Between Stability and Change,” Journal of Personality and Social Psychology, 77 (December), 1135-1145.
[20] Moreau, C. Page, Donald R. Lehmann, and Arthur B. Markman (2001), "What is it? Categorization Flexibility and Consumers’ responses to really new products," Journal of Consumer Research, 27 (March), 489-498.
[21] Murphy, George and Brian Ross (1994), "Predictions from Uncertain Categorizations," Cognitive Psychology, 27 (October), 148-193.
[22] Pennington, G.L. and Roese, N.J. (2003), “Regulatory Focus and Temporal Distance,” Journal of Experimental Social Psychology, 39 (November), 563-576.
[23] Robertson, T. S. (1967), “The process of innovation and diffusion of innovation,” Journal of Marketing, 36 (January), 15-16.
[24] Roberston, T. S. (1985), in Consumer Behavior, Illinois: Scott and Freshman.
[25] Rogers, Everett M. (1983), “Diffusion of Innovation,” in New York, 3rd ed. Free Press.
[26] Rosch, Eleanor and Carolyn B. Mervis (1975), "Family Resemblances: Studies in the Internal Structure of Categories," Cognitive Psychology, 7 (October), 573-605.
[27] Schiffman, W. L. and L. L. Kaunk (1991), “Consumer Behavior”, 7th ed., New Jersey: Prentice-Hall, p.4. [28] Shafir, Elder and Amos Tversky (1992), “Thinking through Uncertainty: Non Consequential Reasoning
and Choice,” Cognitive Psychology, 24 (October), 449-74.
[29] Spence, Mark T. and Merrie Brucks (1997), "The Moderating Effects of Problem Characteristics on Experts' and Novices' Judgments," Journal of Marketing Research, 34 (May), 233-247.
[30] Stevens, Greg A. and James Burley (2003), “Piloting the Rocket of Radical Innovation,” Research Technology Management, 46 (2), 16-26.
[31] Stone R. N. and Gronhaug, K. (1993), “Perceived Risk: Further Considerations for the Marketing Discipline,” European Journal of Marketing, 27 (3), 39-50.
[32] Van den Bulte, Christophe and Stefan Stremersch (2004), “Social Contagion and Income Heterogeneity in New Product Diffusion: A Meta-Analytic Test,” Marketing Science, 23 (Fall), 530-44.
[33] Yamauchi, Takashi and Arthur B. Markman (2000), "Inference Using Categories," Journal of Experimental Psychology: Learning, Memory, and Cognition, 26 (May), 776-795.
出席國際學術會議心得報告
計畫編號 NSC 98-2410H009-007 計畫名稱 探討消費者對先進旅行者資訊系統的衍生性商品之評估:以 GPS 導航手機 為例 出國人員姓名 服務機關及職稱 任維廉,國立交通大學運輸科技與管理學系教授 會議時間地點 2009/11/16-2009/11/19,印尼泗水 (Surabaya, Indonesia)會議名稱 8th EASTS (8th International Conference of Eastern Asia Society for Transportation Studies)
發表論文題目 From the Viewpoint of Business Customers to Explore the Antecedents of Satisfaction and Loyalty for Freight Shipping Industry in Taiwan
一、參加會議經過
由東亞運輸學會 (EASTS) 與印尼運輸學會 (Indonesia Transportation Society, ITS) 主辦 之「The 8th International Conference of the Eastern Asia Society for Transportation Studies (EASTS)」 ,全部活動於 2009 年 11 月 16 日至 19 日共四天,在印尼國泗水市進行各項論文 研討及實務參觀活動。
本次會議主題為”Enhancing Transportation Infrastructure and Services in Rapid Regional Growth”,反映出對於快速發展的亞洲來說,當前最重要的即是如何強化運輸基礎建設與服務。
開幕儀式於 11 月 11 日上午 9 點在香格里拉飯店 (Shangri-la Hotel) 舉行。首先由 EASTS 當地組織委員會主席 Chairul Djaelani,印尼運輸學會主席 Dr. Bambang Susantono,Institute of Technology Sepuluh Nopemebr 校長 Prof. Priyo Suprobo,及 EASTS 主席 Prof. Kyung Soo Chon 進行開幕致詞。首先,他們特別揭露本屆特色,係 International Scientific Committee (ISC) 所 提之 ISC’s strategic changes,包括:
1. academic and practical papers, 2. web-based paper management,
3. rationalizing review process: topic group system, 4. post-conference publication,
5. structurizing sessions: plenary, special, technical and poster sessions, 6. open recruiting ISC members.
ISC 也打算出版新的學術期刊:Asia Transportation Studies, 和學會目前出版之期刊 有所區隔,並申請 ISI.
Green Growth in East Asisn Regioin”,他準備的資料豐富,也有事先印發給與會者。 接著是大會統一場次,討論題目為 ”Huge National Disaster and Transportation”。
隨後開始一連串的學術研討活動。本次學術論文口頭報告場次共包含 421 篇論文,論文 研究主題包括 A: Transportation General,B: Transportation Economics and Policy,C: Travel Demand Analysis and Forecast,D: Logistics and Freight Transportation,E: Regional Planning and Environment,F: Public and Non-motorized Transportation,G:Highway Design and Maintenance, H: Road Traffic Engineering,I: Traffic Accident and Safety,J: Air and Water Transportation。分 別於香格里拉飯店九個會議室,各 12 個場次舉行研討,另有 78 篇 Poster (精簡壁報) 論文分 時段公開展示。論文發表與研討會議從 11 月 16 日至 19 日一連舉辦三天。
本人發表論文屬於 D04 Operation and Management in Logistics Business,發表論文場次係 18 日上午 8:30 之第二篇,同一場次另有四位學者發表論文。第一與第三篇論文皆來自台灣的 學者,第四篇是來自泰國的學者,第五篇是來自日本的學者。報告者分別為 Yih-Ching JUANG 所發表之”A Study on Success Factors of Development Strategies for Intermodal Freight Transport Systems”,Hung-Jie WANG 所發表的” A Threshold Accepting Algorithm for the Uncapacitated Single Allocation p-Hub Median Problem”,及由 Watchara SATTAYAPRASERT 所發表的”ANP Prioritization Integrating Risks and Costs of Transport for Hazardous Material Routing in Thailand”。但最後一篇由 Hossain MOINUL 所發表之”Vehicle Tracking in the Developing Countries: Prospects and Challenges” 因故並未到場報告。
經過三天的論文研討後,閉幕典禮於 18 日傍晚於會議場地舉行。並於第四天進行參訪活 動,19 日之參訪活動主要參觀 Purabaya 公車車站,Waru 與 Gubeng 地鐵車站,Kalimas 河道 船運與碼頭等。
二、與會心得
本 次 論 文 報 告 題 目 為 ”From the Viewpoint of Business Customers to Explore the Antecedents of Satisfaction and Loyalty for Freight Shipping Industry in Taiwan”。 由於貨運業競 爭日益趨烈,企業顧客對於運輸服務的要求逐漸提高,如何維持企業客戶的忠誠度與滿意度 成為貨運業管理者所重視之問題。本研究之目的在以 B2B 的觀點,探討企業顧客認知的關係 績效、服務品質與成本績效,對貨運公司滿意度與忠誠度的影響關係為何。本研究以使用國 內汽車貨運公司為貨運服務的公司為研究對象,並透過郵寄問卷的方式蒐集資料。經由結構 方程模式的分析,結果發現顧客的忠誠度受到滿意度之影響,而滿意度亦會受到服務品質與 關係績效的影響,但成本績效則對滿意度沒有顯著影響關係。 除了所報告的場次之外,亦有參與其他的會議場次,大多係與物流管理,運輸管理,大 眾運輸相關課題。雖然每篇論文的報告時間只有 12 到 15 分鐘,不足以完整瞭解其研究內涵, 但是卻可以讓拓展視野,無論是研究課題或方法論應用,可以讓研究者對當今國際上研究的 趨勢或方法有新的認識,進而有所啟發。
三、建議 參加國際學術研討會,可經由比較各國學者之研究議題與方法之選擇,了解到對於問題 的看法可以多重的觀點與角度,進而激發出新的研究想法,收穫真的很多。東亞運輸學會每 兩年辦一屆,已辦八屆,大會已議決:兩年後在韓國濟州島辦第九屆。 本屆會議有多位台灣同行參與,包括交通大學運輸系所張新立院長,馮正民,黃承傳、 汪進財教授,邱裕鈞副教授,黃寬丞助理教授。台灣大學土木所許添本教授。元智大學工管 系丁慶榮副教授。開南大學陳武正教授。明道大學管理學院藍武王院長等。大多是每屆都參 加的老面孔,大家都肯定參與這項活動大有收穫,中華民國運輸學會理事長陳武正教授積極 爭取第十屆在台北舉辦,我們也希望未來能在國內看到更多大型的國際學術研討會。 感謝國科會經費補助此次出國機票費用與研討會註冊費用,希繼續支持國際交流。此外, 在很多場次發現有些論文發表者是台灣碩博士班學生,她們能以流利的英文報告並回答問 題,實在難得,也建議國科會對於學生出國發表論文能多給予財務支持。 四、攜回資料名稱及內容 大會手冊一本,研討會光碟一份。
Proceedings of the Eastern Asia Society for Transportation Studies, Vol.7, 2009
From the Viewpoint of Business Customers to Explore the Antecedents of
Satisfaction and Loyalty for Freight Shipping Industry in Taiwan
Kai Chieh HUAssistant Professor
Department of Business Administration Soochow University
Taipei, Taiwan.
E-mail: [email protected]
William JEN Professor
Department of Transportation Technology and Management
National Chiao Tung University Hsinchu, Taiwan.
E-mail: [email protected]
Abstract: The freight shipping industry has become an important part of logistics services.
Many companies view business customers as major sources of revenue. Under fierce market competition, managers of freight shipping company must find ways to maintain customers through continuous cooperation and enhance customer loyalty and satisfaction. This study explores the effects of service quality and relational performance on customer satisfaction and loyalty in a business-to-business context. This study adopted business customers of freight shipping companies in Taiwan as its sample and collected data via a self-administered questionnaire. After applying structural equation modeling to test the theoretical model, analytical results show that customer loyalty was influenced by the level of satisfaction. Additionally, the relational performance and service quality significantly affected satisfaction. Finally, this study discusses managerial implications and offers suggestions for future research.
Key Words: Freight Shipping, Satisfaction, Service Quality, Relational Performance
1. INTRODUCTION
The freight shipping industry has become an important part of logistics services. Under fierce market competition, managers in freight shipping industry must find ways to improve their service, retain customers through continuous cooperation, and enhance customer loyalty and satisfaction (Davis and Mentzer, 2006). For freight shipping companies, business customers have to stabilize the profit over the long term. Therefore, many freight shipping companies view business customers as major sources of revenue. Meanwhile, there have been many studies investigating customer loyalty in the motor carrier industry from a business-to-business (B2B) perspective (Stank et al., 2003).
Customer loyalty is a major factor that determines the competitiveness of businesses (Gremler and Brown, 1996). Since the interaction among businesses is more complicated than that between general consumer and businesses, service quality, mutual communication, cooperation and trade relations play important roles in transactions (Wetzel et al., 2000). Generally, when a company provides good service, customer satisfaction and loyalty are significantly increased (Innis and La Londe, 1994; Dresner and Xu, 1995). However, Wetzel et al. (2000) argued that the impact of service quality on satisfaction and loyalty requires further clarification, especially in the B2B area.
Previous studies of the freight shipping industry demonstrated that business customer satisfaction and loyalty are relevant to the overall performance of a logistics service and the relationship between a company and its business customer (Sharma et al., 1995; Ellinger and
Proceedings of the Eastern Asia Society for Transportation Studies, Vol.7, 2009
Daugherty, 1997; Ellinger et al., 1999; Wilding and Juriado, 2004; Vickery et al., 2004; Panayides and So, 2005; Davis and Mentzer, 2006). Wilding and Juriado (2004) determined that when the freight shipping companies have good logistics capability and operating flexibility, business customers will be predisposed to continue purchasing the services offered by freight shipping companies. Notably, improved logistics capability is representative of enhanced operating performance and service quality (Stank et al., 2003; Davis and Mentzer, 2006). On the other hand, to maintain company operations, business customers cooperating with carrier companies focuses on price and service quality, and care about their relationships with freight shipping companies (Stank et al., 2003). Vickery et al. (2004) noted that when cooperation between a freight shipping company and business customer is good, freight shipping companies will be able to provide business customers with services that meet their demands, and thereby further enhancing efficiency (Ellinger and Daugherty, 1997; Ellinger et al., 1999). Maintaining good relations with existing business customers can improve the competitiveness and sustain profitability of a freight shipping company (Christopher et al., 1991; Leuthesser and Kohli, 1995; Scannell et al., 2000; Panayides and So, 2005; Fynes et al., 2005; Zhao et al., 2007).
Although some literatures showed positive relationships among those variables in different industries, some studies did not determine the significant effect of operational performance on customer satisfaction (Stank et al., 2003). Stank et al. (2003) thought few studies have focused on this issue and further analysis is needed. Therefore, this study builds and verifies the effects of service quality and relational performance on satisfaction and loyalty for freight shipping industry in a B2B context. This study adopted Taiwan’s freight shipping companies as the case subject and collected data from Taiwan’s enterprises. Structural equation modeling (SEM) is used to verify the fitness of the theoretical model, and the causal relationships and impacts among variables. Analytical results will provide managers in the freight shipping industry with marketing strategies and will be a foundation for future research.
2. LITERATURE REVIEW 2.1 Satisfaction and Loyalty
Oliver (1980) proposed the theory of “expectation-disconfirmation.” He believed that customer satisfaction is determined by the consistency between pre-purchase expectations and actual products or service performance after purchasing. When actual performance is equal to or exceeds expectation, that customer will be satisfied. While performance is below expectation, dissatisfaction arises (Oliver and DeSarbo, 1988). Woodruff et al. (1983) argued that customer satisfaction, which was considered an immediate emotional response, is the value of products in use in specific situations. Westbrook and Oliver (1991) proposed that satisfaction can be measured via an overall feeling and emotion-based response.
Recently, many studies have investigated customer satisfaction and loyalty in the freight transportation and logistics industry. Premeaux et al. (1993) examined the difference in perceptions between consigners and freight shipping companies, and analyzed satisfaction and loyalty in the freight industry via a questionnaire with 35 items. Additionally, they analyzed the difference in importance of the attributes between consigners and freight shipping companies. Both Innis and La Londe (1994) and Dresner and Xu (1995) determined that good customer service significantly increases customer satisfaction and loyalty. Sharma et al. (1995) developed a conceptual model of customer satisfaction that includes the
Proceedings of the Eastern Asia Society for Transportation Studies, Vol.7, 2009
purchasing process. This model demonstrated that customer satisfaction is affected by many variables, and positively impacts company profit. Ellinger et al. (1999) examined the effects of communication on customer satisfaction and loyalty in supply chain management. Loyalty in that study was composed of repurchase intention and relationship commitment.
Lu (2003) examined the impact of carrier service factors on shipper satisfaction in shipper-carrier partnering relationships, and suggested that service attributes are important to shipper satisfaction in a partnering relationship. Stank et al. (2003) developed and applied an integration model of logistics service performance to identify the antecedents of logistics service satisfaction and loyalty. In this model, market share is influenced by customer loyalty, and customer satisfaction is the antecedent of loyalty. Wilding and Juriado (2004) found that top five factors in logistics outsourcing were the abilities of third-party logistics (3PL) companies, operating flexibility, cost reduction, concentrating on core business and avoiding unnecessary investment. The principal reasons for discontinuing outsourcing are service and quality issues and trust and communication problems. Vickery et al. (2004) also determined that relational performance has a significant and positive effect on satisfaction, and satisfaction has the same effect on customer loyalty.
2.2 Service Quality
Customer service has become crucial to survival due to the intense competition in the carrier industry (Harding, 1998). Although studies by Ellinger and Daugherty (1997), Ellinger et al. (1999) and Stank et al. (2003) applied the concept of “operating performance” to present the performance result of a logistics service, many studies discovered that logistics service quality has a significant influence on customer satisfaction (Lin et al., 2005; Davis and Mentzer, 2006). Therefore, when exploring the important factors affecting customer satisfaction and loyalty, the quality of a logistics service is an important variable that cannot be ignored.
Wilding and Juriado (2004) proposed that freight shipping companies with good logistics ability, flexible operations with low prices are most likely to increase customer willingness to continue their business relationship. Additionally, good logistics capability means that freight shipping companies have good service quality and operating performance. Davis and Mentzer (2006) obtained a similar analytical result, indicting that high-quality logistics services enhance customer satisfaction. Most scholars use the series of studies published by Parasuraman, Zeithaml and Berry (PZB) as their theoretical bases. Notably, PZB developed a well-known scale called SERVQUAL to measure service quality across various service industries (Parasuraman et al., 1988). This SERVQUAL scale is composed of five dimensions and 22 items, including tangibility, reliability, responsiveness, assurance and empathy (Parasuraman et al., 1988). However, according to findings obtained by Finn and Lamb (1991), Cronin and Taylor (1992) and Triplett et al. (1994), the SERVQUAL scale will not obtain the dimensions of service quality. Thus, many researchers attempted to develop a specific service-quality scale for specific industries (Brady and Cronin, 2001). Although literature has many definitions for service quality, this study adopts “meet or exceed customer expectations,” which is the most common definition used by scholars, as the definition for service quality (Reeves and Bednar, 1994).
Brady and Cronin (2001) divided the concept of service quality into interaction quality, physical environment quality, and outcome quality based on the viewpoint of a hierarchy. Interaction quality encompasses attitude, behavior and expertise. Physical environment
Proceedings of the Eastern Asia Society for Transportation Studies, Vol.7, 2009
quality contains ambient conditions, design and social factors. Outcome quality encompasses wait time, tangibles and valence (Brady and Cronin, 2001). Menzter et al. (1999) developed a service-quality scale for the logistics industry. Their research results determined that service quality had nine dimensions—personnel contact quality, order discrepancy handling, order condition, order quality, order accuracy, timeliness, ordering release quantities, ordering procedures, and information quality. Menzter et al. (2001) argued that these nine dimensions can be considered a series of related processes when constructing a service-quality framework model of customer perception. The first stage is the perception of order placement activities, including contact quality of personnel, the cancelled amount in an order, quality of information and procedures associated with an order. The second stage is the perception of a received order. This stage can be divided into two small processes: 1) order accuracy, order condition and order quality affect 2) timeliness and order discrepancy handling. The final stage is overall satisfaction, which is influenced by factors in first and second stages. Moreover, Lu (2003) determined that timing, pricing, warehousing and sales were four important carrier service factors that impact shipper satisfaction.
2.3 Relational Performance
Relational performance is based in relational marketing. The goals of relational marketing are to maintain and improve relationships with customers. In addition to attracting new customers, the most important issue is to maintain customer loyalty. Christopher et al. (1991) noted that most companies do not focus on maintaining good relationships with their customers once a transaction is complete. Thus, if freight shipping companies can establish good relationships with their business customers, they can increase their competitiveness and ensure continued profitability.
Shani and Chalasani (1993) noted that the primary target of relational marketing is to ensure that relationships between customers and companies continue. Mohr and Spekman (1994) posited that the quality of relationships in the B2B context is based on cooperation. They also suggested that successful cooperative relationships prioritize commitment, coordination trust, communication quality and problem-solving over conflicts. Levitt (1983) proposed that relationships have an intangible value, and will impact transaction results between two businesses in the future. Keaveney (1995) noted that customers have increased willingness to continue cooperating with companies when they have good relationships with these companies. Daugherty et al. (1998) demonstrated that relational performance affects customer satisfaction and customer willingness to repurchase. Notably, relational performance encompasses communication and response. Ellinger and Daugherty (1997), Ellinger et al. (1999) and Fynes et al. (2005) proposed that good relational quality among supply chain members positively influences quality and customer satisfaction.
Stank et al. (2003) determined that good relational performance positively impacts business customer satisfaction and operation performance. Vickery et al. (2004) investigated the relationship between the relational performance of third-party logistics, customer satisfaction and customer loyalty. They found that good relational performance enhances satisfaction and loyalty. Panayides and So (2005) indicated that a company focuses on maintaining good customer relationships can improve their logistics service quality and performance. Zhao et al. (2007) also determined that good relationships between companies and customers positively impact customer satisfaction. Most studies that investigated relational performance generally measured a company’s understanding of its customer needs, and provided recommendations to improve relationships, interaction and cooperation (Stank et al., 2003; Vickery et al., 2004).
Proceedings of the Eastern Asia Society for Transportation Studies, Vol.7, 2009
3. METHOD
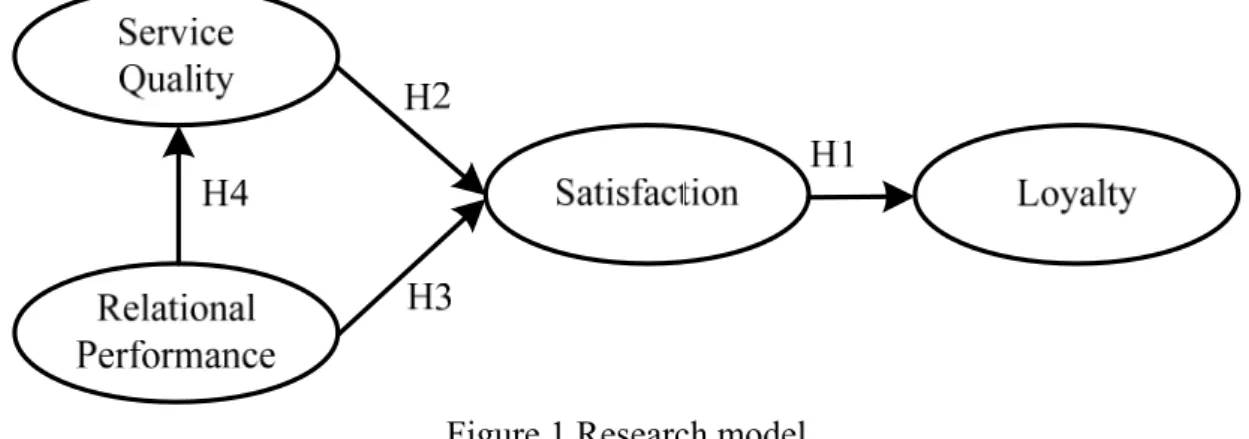
3.1 Research Model and Hypotheses
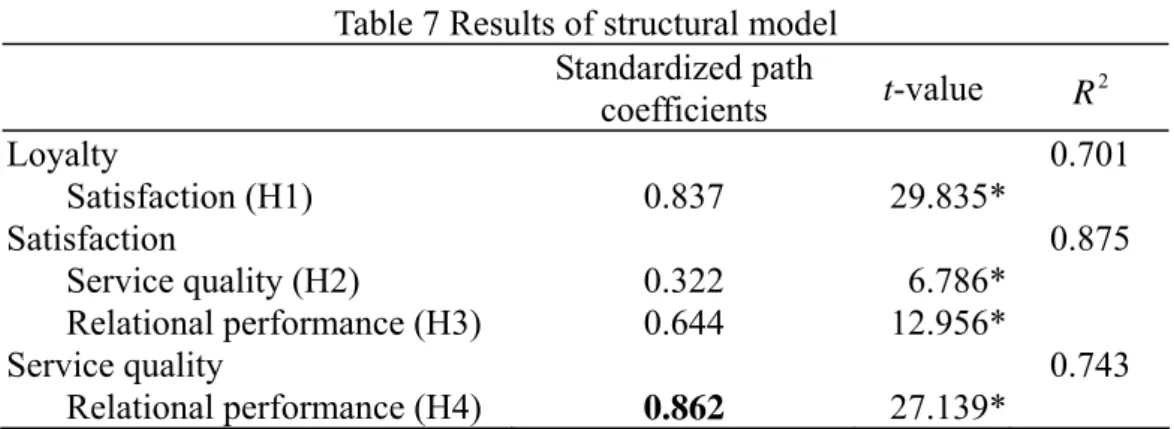
After reviewing pertinent literature, we believe that business customer satisfaction and loyalty are related to service quality, cost performance and relational performance of a freight shipping company. Thus, this study proposes the following research model (Fig. 1). First, most studies have demonstrated that business customer satisfaction positively influences loyalty (Dresner and Xu, 1995; Ellinger et al., 1999; Vickery et al., 2004; Panayides and So, 2005; Davis and Mentzer, 2006). From the perspective of a business customer, loyalty is the intention of continue a cooperative relationship (Vickery et al., 2004; Davis and Mentzer, 2006). Thus, this study proposes the first hypothesis that business customer satisfaction has a direct and positive effect on loyalty for freight shipping industry (H1). Second, previous studies demonstrated that good service quality offered by freight shipping companies can increase business customer satisfaction (Innis and La Londe, 1994; Stank et al., 1999, 2003). Additionally, if freight shipping companies improve relational performance with their business customers, they have an increased opportunity to identify customer needs and increase customer satisfaction (Ellinger and Daugherty, 1997; Ellinger et al., 1999; Stank et al., 2003; Vickery et al., 2004). Thus, we propose the following two hypotheses that service quality and relational performance have the direct and positive effects on business customer satisfaction (H2 and H3). Finally, previous studies found that relational performance and cost performance positively affect service quality (Ellinger and Daugherty, 1997; Scannell et al., 2000; Vickery et al., 2004; Panayides and So, 2005; Fynes et al., 2005). For the freight shipping industry, a good relationship and frequent interaction can enhance the cooperation process and improve the perception of service (Ellinger and Daugherty, 1997). Thus, this study proposes the hypothesis that relational performance has the direct and positive effects on service quality (H4).
Figure 1 Research model
3.2 Measurements
Based on the service-quality dimensions proposed by Brady and Cronin (2001), this study develops three dimensions of service quality which includes delivery quality, interaction quality and physical environment. The manifest variables of each dimension are designed based on the work by Mentzer et al. (1999; 2001), Stank et al. (2003) and Vickery et al. (2004). Delivery quality, which has 12 items, is the quality about the process and outcome
Proceedings of the Eastern Asia Society for Transportation Studies, Vol.7, 2009
while freight shipping company delivering the customer’s freights and goods. It relates to arrival time, order procedure, available information, freight damage or quantity error, compensation, accounting error, security, etc. Interaction quality, which has 6 items, is comprised of attitude, acts and professional ability. Physical environment is composed of tangible elements viewed by customers, such as service employees, vehicles and facilities. This study designed items of relation performance based on the work by Stank et al. (2003) and Vickery et al. (2004). These items showed good reliability and validity in these studies of Stank et al. (2003) and Vickery et al. (2004). The measurements of business satisfaction and loyalty are derived from the work by Sharma et al. (1995), Ellinger and Daugherty (1997), Ellinger et al. (1999), Stank et al. (2003) and Vickery et al. (2004). Satisfaction measures are global in nature and provide an overall assessment of the extent to which a service matches expectations (Stank et al., 2003). Furthermore, loyalty measures are customer attitudes toward a service provider and their behavioral intention for future cooperation (Peltier and Westfall, 2000).
In summary, this study utilized 14 manifest variables as multiple indicators for four constructs (or latent variables) in the research model. Among these manifest variables, three manifest variables related to service quality are operationalized via a 21-item scale. Responses to the 35 items in the questionnaire are on a five-point Likert scale. Furthermore, since business customers may use more than two carriers, respondents were asked to fill out the questionnaire for their primary carrier. Researchers also visited two business customers of one carrier in Taiwan to discuss the items and determine whether they are appropriate. The items were then modified.
3.3 Data Collection
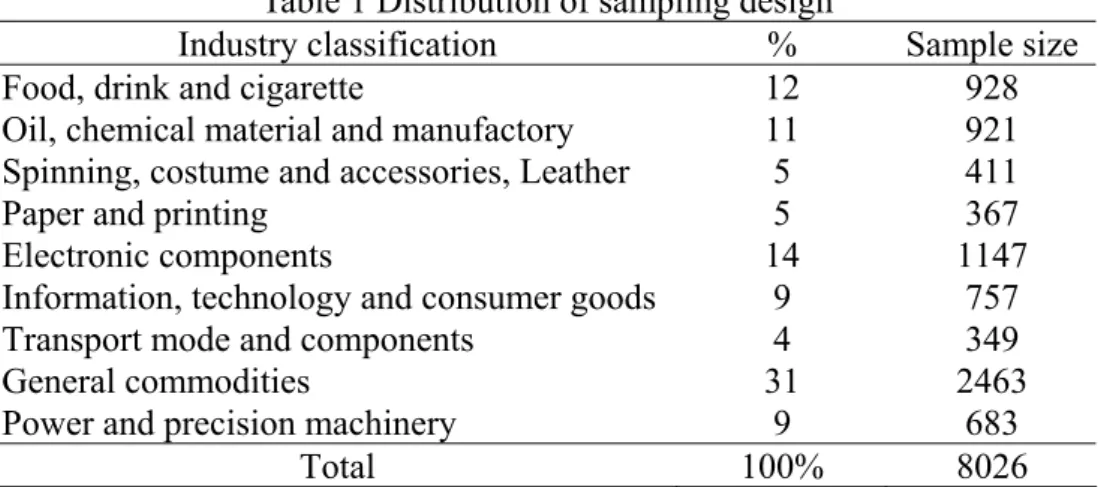
This study collected data via the questionnaire, which was mailed to businesses in different industries. Respondents were managers or decision-makers who are responsible for freight transportation and may communicate with freight shipping companies. To cover most industries using freight shipping companies in Taiwan, a stratified proportional sampling method was used. First, this study compared and integrated the information of three formal databases in Taiwan -“Standard Industrial Classification System of the R.O.C.,” “Taiwan Industry Reports, Taiwan Institute of Economic Research,” and the “Industrial Development Bureau, Ministry of Economic Affairs, Taiwan”. Then nine major industries were determined. However, there is no ready data or report could tell us the distribution of freight shipping companies’ customers for these nine major industries. Therefore, we visit two largest freight companies and used their customer databases to calculate the company percentage of each industry (see Table 1). Although we cannot compare our sample distribution with the entire population, we believe our sample distribution which is based on the data of two largest freight shipping companies could represent the entire freight industry. Besides, since the very low return rate of the mailed at 10% is quite normal, the sample size of each industry should exceed 300 to obtain a valid sample size, at least 30 respondents for each industry. Table 1 shows the sample size of each industry.
Proceedings of the Eastern Asia Society for Transportation Studies, Vol.7, 2009
Table 1 Distribution of sampling design
Industry classification % Sample size
Food, drink and cigarette 12 928
Oil, chemical material and manufactory 11 921 Spinning, costume and accessories, Leather 5 411
Paper and printing 5 367
Electronic components 14 1147
Information, technology and consumer goods 9 757
Transport mode and components 4 349
General commodities 31 2463
Power and precision machinery 9 683
Total 100% 8026
3.4 Analysis
The paths in the research model were analyzed using structural equation modeling (SEM). Analysis followed a two-step procedure based partly on the approach recommended by Anderson and Gerbing (1988). The first step applied confirmatory factor analysis to develop a measurement model that has an acceptable fit to data. The second step then tests the theoretical model (or structural model) via path analysis to ensure that the structural model is meaningful and statistically acceptable. Notably, SEM is used to test some causal relationships among construct variables. The adjustment of collected sample could only produce some duplicate data and that is no meaning while applying this method. Therefore, the raw sample was used directly in this study.
Technically, when the appropriate assumptions hold, the chi-square test may be statistically insignificant. However, in practice, the chi-square test is extremely sensitive to sample size and departures from multivariate normality, frequently resulting in rejection of a well-fit model (Hoyle, 1995). Therefore, chi-square/degree-of-freedom (df) ratio can be used as an index of goodness-of-fit (James et al., 1982; Jöreskog and Sörbom, 1993). The acceptable chi-square/df ratio is <5 (<3 is better) (Jöreskog and Sörbom, 1993; Hatcher, 1998). Many fitness indices exist, such as Bentler's comparative fit index (CFI), goodness of fit index (GFI), GFI adjusted for degrees of freedom (AGFI), normed-fit index (NFI), non-normed-fit index (NNFI); all of which should exceed or be close to 0.9. Notably, root mean square residual (RMR) should be <0.05, and root mean square error of approximation (RMSEA) should be <0.08 (<0.05 is better) (Hatcher, 1998).
4. RESULTS
4.1 Sample and Reliability
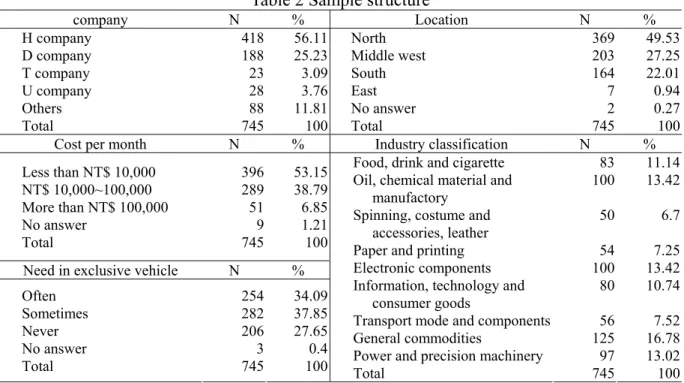
In total, 8,026 questionnaires were mailed to companies, and 745 valid questionnaires were returned; valid response rate was 9.28%, which is acceptable for a mailed survey. Table 2 shows the sample structure. Among respondents, 56.11% used freight shipping company H and 25.23% used freight shipping company D. In total, 49.53% of companies were located in northern Taiwan; 53.15% of companies spend less than NT$10,000 per month for transportation; and 38.79% of companies spend NT$ 10,000–100,000 per month. Most products are general commodities (16.78%). Spinning, costumes, accessories and leather
Proceedings of the Eastern Asia Society for Transportation Studies, Vol.7, 2009
account for 6.71% of products. Table 3 shows data reliability using Cronbach’s . All dimensions for construct variables have high reliability, with Cronbach’s values exceeding 0.8. Generally, data have acceptable reliability.
Table 2 Sample structure
company N % Location N %
H company 418 56.11 North 369 49.53
D company 188 25.23 Middle west 203 27.25
T company 23 3.09 South 164 22.01
U company 28 3.76 East 7 0.94
Others 88 11.81 No answer 2 0.27
Total 745 100 Total 745 100
Cost per month N % Industry classification N % Less than NT$ 10,000 NT$ 10,000~100,000 More than NT$ 100,000 No answer Total 396 289 51 9 745 53.15 38.79 6.85 1.21 100 Need in exclusive vehicle N % Often Sometimes Never No answer Total 254 282 206 3 745 34.09 37.85 27.65 0.4 100
Food, drink and cigarette Oil, chemical material and
manufactory Spinning, costume and
accessories, leather Paper and printing Electronic components Information, technology and
consumer goods
Transport mode and components General commodities
Power and precision machinery Total 83 100 50 54 100 80 56 125 97 745 11.14 13.42 6.7 7.25 13.42 10.74 7.52 16.78 13.02 100
Table 3 Reliability of construct variables Construct variables Cronbach’s α
Service quality 0.952
Relational performance 0.897
Satisfaction 0.924 Loyalty 0.946
4.2 Confirmatory Factor Analysis
Prior to path analysis, the measurement model was first validated with measured variables that measure construct variables. This study has five construct variables: service quality (V1~V3), relational performance (V4~V7), satisfaction (V8~V10), and loyalty (V11~V14). Each construct variable contains three or more measured variables. Confirmatory factor analysis (CFA) was applied to test the measurement model, and maximum likelihood estimation was used to calculate parameters. Table 4 shows CFA results. The chi-square is 360.157 (p < 0.0001), and the chi-square/df is near 5 (360.157/71 = 5.073) which shows an acceptable result. Furthermore, model fit is also based on CFI, GFT, AGFI, NFI and NNFI estimates (Table 5). These fitness indices exceeded or were near 0.9. Moreover, the RMR and SRMR estimate is <0.05 and the RMSEA estimate is <0.08. These results indicate a good fit of the model structure to data.
Table 4 Fitness indices results of CFA
Chi-square df GFI AGFI CFI NFI NNFI RMR SRMR RMSEA