行政院國家科學委員會專題研究計畫 成果報告
提昇異質性學生的科學學習─提昇不同學習風格與性別學
生的科學概念學習 (3/3)
計畫類別: 整合型計畫
計畫編號: NSC92-2511-S-009-012-
執行期間: 92 年 08 月 01 日至 93 年 08 月 31 日
執行單位: 國立交通大學教育學程中心
計畫主持人: 佘曉清
報告類型: 完整報告
報告附件: 國外研究心得報告
處理方式: 本計畫涉及專利或其他智慧財產權,1 年後可公開查詢
中 華 民 國 93 年 8 月 6 日
WEB-BASED E-LEARNING
ENVIRONMENTS IN TAIWAN: THE
IMPACT OF THE ONLINE SCIENCE
FLASH PROGRAM ON STUDENTS’
LEARNING
This chapter reports on a web-based, multimedia, flash science learning program that focuses on helping students develop an understanding of water pressure through online e-learning environment in Taiwan. The study examines the learning environment created during use of this online flash science program in their science classes and also investigates its impact on students’ cognitive and affective learning outcomes among different learning styles and grade levels. The results focus on three aspects: how the www flash science program promotes students’ science concept learning; how students’ feel about their satisfaction with learning with the www flash science program; the type of learning environment created during the use of this online flash science program in science classes; and associations between students’ cognitive learning outcomes, satisfaction with web-based learning, web-based computer-assisted learning, and perceptions of science classroom learning environments.
1. Introduction
Web-based e-learning technology has been widely used in many ways in school teaching and learning science. Many studies have reported that technology-assisted instruction helps students develop a conceptual understanding of abstract representations of physical science. The nature of this technology-assisted instruction is that it emphasizes simulation, or visualization, or animation, etc. to enhance students’ deeper mental imagery.
Some studies have reported that students whose learning styles are matched with their teachers’ approach to teaching result in greater ease of learning (Packer & Bain, 1978) and higher satisfaction (Renninger & Snyder, 1983) than for those whose styles are mismatched. These studies show the importance of understanding how a teacher’s approach to science teaching affects the science learning of students with different preferred learning styles.
Therefore, it is of interest to know whether web-based e-learning technology can help all students learn science, regardless of their preferred learning styles and grade levels. Also of interest is how do
students perceive this web-based e-learning environment.
2. Theoretical Framework
2.1 Web-based E-learning Education
Web-based e-learning technologies offer promise and potential for the delivery of enhanced learning in any topic to as many students as possible without limitation of time, place and language. Advances in information and communication technology are allowing web-based courses to replicate the features of face-to-face instruction through the use of audio, video, and high-speed Internet connections that facilitate synchronous and asynchronous communication. Very often, traditional class instruction has strongly depended on the delivery of knowledge through lecture presentation. However, Bonk and Cummings (1998) have argued that conventional face-to-face learning may not fully satisfy the needs of all learners. In a constructivist learning environment, part of the ownership for learning is shifted from the teacher to the students (Aggarwal & Bento, 2000). The key is to design a web-based e-learning environment that is suitable for the appropriate level of the students. Tetiwat and Igbaria (2000) suggested that at the secondary school level, students can use web-based teaching an aid for developing technology skills. There are obvious advantages in combining web-based learning with traditional face-to-face instruction.
For about two decades science educators have explored how to use the technology-assisted representations to assist students to develop a conceptual understanding of abstract representations of physical science (Gregory, & Stewart, 1997; Monaghan, & Clement, 2000; Steinberg, 2000;). Many studies also have shown that students who go through active-engagement computer-based activities do better than students who go through traditional instruction (Beichner, et.al, 1999; Goldberg, 1997). Rieber (1991) investigated two groups of fourth graders learning from using computer simulations that dealt with Newton’s law of motion. His results showed that the group of students who saw animated graphics performed better than the group of students who saw static graphics, but also displayed more new misconceptions. He further noted that even if students attend to an animated display, they often failed to notice the information it contained. De Jong (1991) indicated that novices have
difficulty with unstructured simulations; he contended that for novices, it is necessary to provide a structure. De Jong & Van Joolingen (1998) recommended scaffolding to enable content learning in simulation environments. While Tao and Gunstone (1999) investigated the use of predict-observe-explain activities with computer simulations of force and motion and found it could affect students conceptual change.
Finke (1989) defined mental imagery as the mental invention or recreation of an experience that in at least some respects resembles the experience of actually perceiving an object or an event, either in conjunction with, or in the absence of, direct sensory stimulation. Oyama and Ichikawa (1990) has noted that visualization, kinesthetic movements and eye movements have been associated with mental imagery. Kosslyn (1994) has documented that similar area of brain activation during actual visual perception and during the memory of or imagination of visual stimuli. Clement (1994) noted that the presence of dynamic imagery reports, hand motions, imagery enhancement techniques and the effort put into imagistic simulations all support the view that simulations in this case are very different from descriptive, language-like representations. He further suggested that the subjects are somehow mentally simulating some aspects of the rich flow of perceptions and or motor actions over time that would exist if they were actually viewing and/or causing such events.
Therefore, the design of our web-based flash science program is purposely provide students opportunity to visualize the physics phenomena in stead doing simulation on their own. The use of flash in designing a world wide web-based science learning program provide students the opportunity not only to obtain a visual understanding of the science content being presented, but also aids users in developing a clearer understanding of the science knowledge and builds on their previously conceptual framework of understanding. In our designing of web-based science flash program, we constrained the program to facilitate systematic collection of data on students’ cognition before, during and after interaction with our web-based science flash program. So students can quickly know their level of understanding the topic, and then learn the lessons, and each part of the lesson consisted exercises to help students reorganized their understanding and finally to do the post-test in order to know their level of understanding. In addition, students can also learn it after class to help them to build up on their deep of understanding. The web-based course also enhances the flexibility of
the learning process and learning time.
The limitation of the current research on technology assisted physics science learning program did not investigate how would audio part of the program influence students mental or conceptual imagery. In our web-based science flash program, we also provide the audio of dyads between the two actors and presented the science knowledge in the form of predict-observe-demonstration. It is hoping to help more variety of students on learning physical science efficiently.
2.2 Learning Environment and the Web
International research efforts involving the conceptualization, assessment, and investigation of perceptions of aspects of the classroom environment have firmly established classroom environment as a thriving field of study (Fraser, 1994, 1998a; Fraser & Walberg, 1991). Past research has confirmed the important contribution made by teachers in creating a classroom environment or atmosphere conductive to science learning (Fraser, 1998a, 1998b). Teachers make a major contribution toward creating positive learning environment in science classes, particularly through their interaction or communication with students (Wubbels & Levy; She & Fisher, 2000, 2002). She and Fisher (2000, 2002) have indicated that positive relationships occur between students’ perceptions of their teachers’ communication behaviors and their attitudes toward science. In addition, they also found that students’ perceptions about their teachers’ communication behavior also influence their cognitive outcomes.
Web-based learning environment has tried to replicate more seamlessly the features of face-to-face instruction through the use of audio, video, and high-speed Internet connections that facilitate synchronous and asynchronous communication. Therefore, the effectiveness of the web-based learning environment has became more important. There are many useful instruments that have been developed to measure students’ perceptions of a variety of aspects of the learning environment and this has extended to computer-based learning environments (e.g., Maor & Fraser, 1996; Teh & Fraser, 1994). Using such questionnaires in learning environment studies may provide us with useful data about how to improve the web-based learning environment.
instruction
Studies on student differences have recognized that factors, such as culture, cognition, physical development, socioeconomic status, gender and teacher-students communication pattern are influential in determining student success in the classroom (e.g., Maccoby, 1988; She & Fisher, 2000, 2002; Sternberg, 1997; Wiles & Bondi, 1992). Also, in the last two decades, student learning preferences have received attention as an area to be considered in designing effective instructional practices for a wide variety of students (e.g., Okebukola, 1986; Owens & Barnes, 1982). Sternberg (1997) found that people with different styles tend to use their ability in different ways and so respond in varying ways to the kinds of thinking required in different occupations. Dunn and Dunn (1990) feel that classrooms need to concentrate more on individual learning styles because students tend to learn and remember better, and enjoy learning more, when they are taught through their learning style preferences.
Felder and Silverman (1988) reported that generally the teaching style of most teachers does not match the learning style of most of their students. They also found students learnt better from processes which are sensory, visual, inductive, and active. In another example, Riding and Douglas (1993), using 59 15-16-year-old students, found that a computer presentation of material on motor car braking systems in a text-plus-picture format better facilitated the learning by images, compared with the same content in a text-plus-text version. The visual-spatial aptitude has been strongly linked to academic mastery of several sciences (Trindade, Fiolhais, & Almeida, 2002). The visual-spatial aptitude is the ability to form and control a mental image. If the visual-spatial cognition is so important in science, it would be worthwhile investigating which types of learning preference students would benefit through instruction with web-based e-learning science flash program.
An interesting approach to learning styles was presented by Hermann (1990). This model is based on the physical brain, in which four quadrants of the brain are labeled A, B, C, and D, counterclockwise beginning with the left cerebral quadrant. The thinking modes clustered within each quadrant have similarities, and the modes in different quadrants identify distinctly different characteristics or ways of thinking. Quadrant A (the upper left cerebral quadrant, external learning) is logical,
factual, analytical, technical, mathematical and critical. These learners prefer to be taught from authority through lectures and textbooks. They do well in the traditional, lecture-based, textbook-driven classrooms, and look to teachers to provide knowledge in answering their questions. Quadrant B (the lower limbic left quadrant, procedural learning) is sequential, structured, organized, planned, and detailed. These learners prefer to learn through a methodical, step-by-step testing of what is being taught, as well as practice and repetition to improve skills. They do well in hands-on activities and use abstract knowledge and commonsense. Quadrant C (the lower limbic right quadrant, interactive learning) is interpersonal, kinesthetic, emotional, sensory, and feeling. These learners prefer to learn through experience, feedback, listening, sharing, experiencing sensory input, and sharing ideas. Quadrant D (the upper right cerebral quadrant, internal learning) is visual, holistic, innovative, imaginative, and conceptual. These learners prefer to learn through visualization, insight, idea synthesis, and sudden understanding of a concept holistically and intuitively. It would be interested to know which types of learning style students would benefit through the web-based science flash learning program.
3. Purpose
This aims of this chapter are to report a web-based, multimedia, flash science learning program focusing on helping different learning preference students develop understanding of water pressure through an online e-learning environment in Taiwan. It specifically examines the learning environment created when teachers and students use this online flash science program in their science class and also investigates the impact on students’ cognitive learning outcomes among different learning styles and different grade levels. Moreover, students’ satisfaction toward web-based learning also was examined. The relationships among students’ cognitive learning outcomes, satisfaction toward web-based learning, web-based computer assisted learning, and their perceptions of science learning environment also were examined.
4. Methodology
There were 459 grade 7 to 9 students from 11 middle schools in Taiwan involved in this study. The sample consisted of 65 grade 7 students, 270 grade 8 students, and 124 grade 9 students. All of the students were given a learning preference questionnaire to differentiate them into four different learning styles: QA, QB, QC and QD. Learning environment questionnaires were given during the teachers’ and students’ use of this online flash science program to assess the learning environment. A satisfaction of web-based learning questionnaire was administered to 459 students after they the use of web-based online flash science program. All of the 459 students were also given a pre-test before getting into the web-based online flash science program and finished the post-test of water pressure immediately after the web-based online flash science program. The pre-test and post-test are the same test and are given as an online-test. All of the results were analyzed by the SPSS version 10.
4.2 Questionnaires
The Questionnaire of Learning Preference (Lumsdaine & Lumsdaine, 1995) differentiates the students into four different learning preference styles based upon Hermann’s Quadrants A, B, C, and D. This questionnaire consists of 60 items which describe a series of learning activities according to Quadrants A, B, C, and D. Each quadrant consisted of 15 items. Students were required to circle the learning activity for whose items are easy for them and that they enjoy doing. The total for all the responses was added and the percentage contribution calculated for each quadrant. The students were grouped into the four learning styles in which they had the highest percentage. Cronbach’s alpha was computed to estimate the internal consistency of each scale and was found to be 0.73, 0.78, 0.76, and 0.78 for QA, QB, QC and QD learning preference scale, respectively.
The seven scales of the questionnaire entitled the What is
Happening in this Class (WIHIC) (Fraser, 1998; Fraser, Fisher &
McRobbie, 1996) were selected to measure the learning environment. Specifically, the scales of Student Cohesiveness, Teacher Support, Involvement, Investigation, Task Orientation, Cooperation, and Equity were used in this study. In addition, the challenging scale of the Teacher
Communication Behavior Questionnaire (TCBQ) (She & Fisher, 2000,
Individualized Classroom Environment Questionnaire (ICEQ) (Fraser,
1990) was also used to add to the description of the learning environment. Anther scale used was The Student Self-Efficacy scale based on a scale developed by Jinks and Morgan (1999).
The Web-based Computer Assisted Learning Questionnaire (WBCAL) was developed specifically for exploring students’ perception of the web-based computer assisted learning environment. This questionnaire included Computer Usage and Web Usage scales adapted from the
Computer Attitude Scale (CAS) developed by Newhouse (2001). An
Attitude to Using Computer scale is based on a scale from the Test of
Science-Related Attitudes (TOSRA) (Fraser, 1981).
A Satisfaction of Web-based Learning (SWBL) questionnaire was developed specifically to examine students’ satisfaction toward learning with the web-based science flash program It included three scales Attitude toward WWW Learning, Attitude toward WWW Reasoning, and Attitude toward WWW Challenging. The first of these use selected and modified from the TOSRA (Fraser, 1981). The scales of reasoning and challenging toward www flash scales were developed from the Challenging scale of the TCBQ (She & Fisher, 2000, 2002).
4.3 Water pressure Pre-test and post-test
The pre-test and post-test contained the same questions in order to measure students’ cognitive learning outcomes. A panel of eight, physical science teachers, scientists, and science educators were responsible for developing the water pressure test. The test specifically focuses on the objectives of the water pressure flash program. The Cronbach alphas of the pre-test and post-test were 0.79 and 0.81, respectively. The test-retest reliability was 0.75.
4.4 Design of the web-based online flash physical science program
In the design of the physical science web-based course, two panels were used. A panel of eight physical science teachers, scientists, and science educators were responsible for designing the presentation of content, thinking questions, and tests of water pressure, air pressure and buoyancy topics. Another panel of five computer engineers, scientists, science educators, and science teachers were responsible for the designing of the web-based system, infrastructure and interface. The flash was used to
develop fully animated web-based pages that allowed learners to discover concepts that are not readily accessible on pages in a textbook or on static web pages. The flash includes animations, buttons, pictures, sounds and text. In addition, it also provides students with thinking questions after each section of the flash animation in order to make them think. The content of the flash was also designed mainly in a dyad format to encourage student thinking.
5. Results
5.1 Validation of scales WIHIC(What is happening in classroom)
Estimates of the internal consistency of the seven scales of the WIHIC were calculated using Cronbach’s alpha coefficient and are shown in Table 16.1. The alpha reliability coefficient for each scale, using the individual as the unit of analysis, ranged between 0.86 and 0.93. The discriminant validity, the extent to which each scale measures a dimension different from that measured by any other scale, was examined using the mean correlation of one scale with the other four scales. These figures ranged from 0.45 to 0.57. The values can be regarded as small enough to confirm the discriminant validity of the WIHIC, indicating that each scale measures a distinct although somewhat overlapping aspect of learning environment.
The ability of a classroom questionnaire like this to differentiate between classes is considered important. Students within a class usually view the classroom learning environment similarly, but differently from students in other classes. The instrument's ability to differentiate in this way was measured using one-way analysis of variance (ANOVA) with class membership as the main effect. The results, depicted in Table 16.1, show that each of the scales did in fact significantly differentiate between classes (p<0.001). The amount of variance explained by class membership is reflected in the eta2 scores which ranged from 0.18 to
0.26.
Estimates of the internal consistency of the Challenging, Differentiation and Student Self-efficacy scales were 0.91, 0.87, and 0.82.
Table 16.1
Internal Consistency (Cronbach Alpha Coefficient), Discriminant Validity (Mean Correlation with Other Scales) and Ability to Differentiate Between Classrooms for WIHIC
Scale
Alpha Reliability
Mean Correlation
With Other Scales ANOVA Results
Student Cohesiveness 0.92 0.49 0.26*** Teacher Support 0.89 0.45 0.22*** Involvement 0.89 0.57 0.23*** Investigation 0.86 0.48 0.18*** Task Orientation 0.91 0.56 0.21*** Cooperation 0.92 0.54 0.18*** Equity 0.93 0.55 0.23*** ***p <0.0001, n=396.
5.2 WBCAL (Web-based computer assisted learning)
Estimates of the internal consistency of the three scales of the WBCAL, calculated using Cronbach’s alpha coefficient and shown in Table 16.2, were found to be generally satisfactory, particularly considering the small sample. The reliability coefficient for each scale, using the individual student as the unit of analysis, ranged between 0.70 to 0.89. The mean correlation of one scale with the other two scales ranged from 0.53 to 0.67. These values can be regarded as small enough to confirm the discriminant validity of the WBCAL indicating that each scale measures a distinct, although somewhat overlapping, aspect of the web-based computer assisted learning. The results, depicted in Table 16.2, show that each of the scales did in fact significantly differentiate between classes (p<0.001). The amount of variance explained by class membership is reflected in the eta2 scores which ranged from 0.19 to
0.22.
Table 16.2
Validity (Mean Correlation with Other Scales) and Ability to Differentiate Between Classrooms for WEBCAL
Scale
Alpha Reliability
Mean Correlation With Other Scales
ANOVA Results
Attitude to Using Computer 0.70 0.53 0.22***
Computer Usage 0.82 0.65 0.19***
Web Usage 0.89 0.67 0.18***
***p <0.0001, n=375.
5.3 SWBL (Satisfaction of web-based learning)
Estimates of the internal consistency of the three scales of the Satisfaction of web-based learning (SWBL), calculated using Cronbach’s alpha coefficient and shown in Table 16.3, were found to be generally satisfactory, particularly considering the small sample. The reliability coefficient for each scale, using the individual student as the unit of analysis, ranged between 0.88 to 0.93. The mean correlation of one scale with the other two scales ranged from 0.55 to 0.68. These values can be regarded as small enough to confirm the discriminant validity of the SWBL, indicating that each scale measures a somewhat overlapping, aspect of the SWBL. The eta2 scores which ranged from 0.08 to 0.15. It
shows that the attitude and challenging scale did in fact significantly differentiate between classes.
Table 16.3
Internal Consistency (Cronbach Alpha Coefficient), Discriminant Validity (Mean Correlation with Other Scales) and Ability to Differentiate Between Classrooms for SWBL
Scale Alpha Reliability Mean Correlation With Other Scales ANOVA Results
Attitude toward www learning 0.93 0.55 0.15***
Reasoning toward www learning 0.88 0.68 0.08
learning
*p<0.05, ***p <0.0001, N=437
5.4 Descriptive information of learning environment
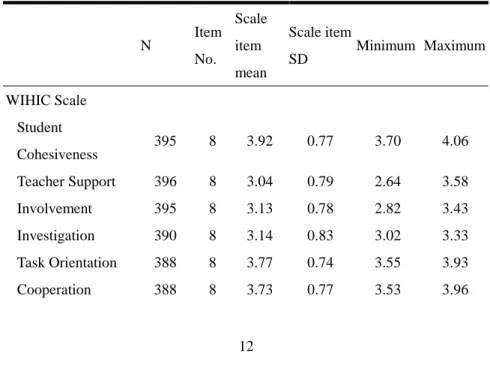
Table 16.4 presents the general profile of the learning environments. The mean scores and standard deviations scores for each scale of the WIHIC questionnaire, Challenging scale of TCBQ, Differentiation scale of ICEQ, and Student Self-Efficacy scale. In general, students viewed their learning environment positively and these environments were characterized by relatively high levels of student cohesiveness, task orientation, cooperation, equity and differentiation (these mean scores ranged from 3.1 to 3.5). In addition, students perceived their teacher as using more challenging questions. Moreover, the two mean scores of the scales of students’ perceptions about web-based computer assisted leaning (WBCL) are favourable. In particular, students’ attitudes toward using computer and web usage are quite high with mean scores of 3.1 and 3.5.
Table 16.4
Scale Means and Standard Deviations
N Item No. Scale item mean Scale item SD Minimum Maximum WIHIC Scale Student Cohesiveness 395 8 3.92 0.77 3.70 4.06 Teacher Support 396 8 3.04 0.79 2.64 3.58 Involvement 395 8 3.13 0.78 2.82 3.43 Investigation 390 8 3.14 0.83 3.02 3.33 Task Orientation 388 8 3.77 0.74 3.55 3.93 Cooperation 388 8 3.73 0.77 3.53 3.96
Equity 391 8 3.70 0.87 3.48 3.96 TCBQ Scale Challenging 388 8 3.52 0.75 3.15 3.65 Self-Efficacy Scale Student Self-Efficacy 391 8 2.97 0.69 2.64 3.26 ICEQ Scale Differentiation 392 8 3.08 0.76 2.38 3.46 WBCL Scale Attitude to Using Computer 373 8 3.51 0.62 2.10 4.14 Computer Usage 375 8 2.91 0.83 2.05 3.90 Web Usage 373 8 3.11 0.92 2.68 3.62 SWBL Scale Attitude toward WWW Flash 437 8 3.82 0.75 3.61 4.03 Reasoning toward WWW Flash 424 8 3.86 0.63 3.68 4.04 Thinking toward WWW Flash 431 8 3.92 0.64 3.79 4.11
After learning from the web-based flash program, the students’ satisfaction of web-based learning (SWBL) was quite high on all of the three scales, ranging from 3.81 to 3.91. This indicates that students rated their satisfaction about learning in this web-based science learning program as highly positive.
5.5 Cognitive outcomes
statistically significant gains after learning water pressure from the web-based flash program (p<0.0001) (see Table 16.5). Students’ means on the pre-test ranged from 7.75 to 8.62 while on the post-test they ranged from 10.38 to 10.84.
Table 16.5
Different Learning Styles’ Students’ and Cognitive Learning Outcomes
Pre-test Post-test
Mean SD Mean SD Difference T test
QA learning preference 7.96 3.46 10.38 2.68 2.42 9.93 *** QB learning preference 7.75 3.34 10.38 2.74 2.62 10.74 *** QC learning preference 7.94 3.44 10.51 2.66 2.56 11.53 *** QD learning preference 8.62 3.22 10.84 2.39 2.22 9.75 *** ***p <0.0001, N=459
In addition, it was found that all of the students’ made progress after learning water pressure from web-based flash program regardless of grade level (see Table 16.6). The grades 7, 8 and 9 students’ means on pre-test are 8.17, 7.07, and 10.30, and their post-tests are 10.92, 10.02, and 11.69, respectively. The grades 7 and 8 students had not been taught water pressure before while the grade 9 students had been taught it in their eight grade indicating that the students had not been taught water pressure before gained as much as those who had been. However, it does shows that students can make further progress even when had been taught that topic before.
Table 16.6
Students’ Cognitive Learning Outcomes Across Grades 7 to 9
Pre-test Post-test
Grade
level Mean SD Mean SD
Difference T test
Grade 8 07.07 3.08 10.02 2.81 2.95 17.20***
Grade 9 10.30 2.71 11.69 1.92 1.40 7.14***
***
p <0.0001, N=459.
5.6 Association between scales of WIHIC and WBCAL
Table 16.7 reports associations between the seven WIHIC scales and the three WBCAL scales. Multiple regression analysis involving the whole set of WIHIC scales was conducted, in addition to a simple correlation analysis, to provide a more conservative test of associations between each WIHIC scale and the WBCAL scaleswhen all other WIHIC scales were mutually controlled.
Table 16.7 Associations Between WIHIC and WBCAL Scales in Terms of simple (r) and multiple correlations (R)
Attitude to Using Computer
Computer Usage Web Usage
Scale r β r β r β Student Cohesiveness 0.29*** 0.16 0.23*** 0.02 0.25*** -0.03 Teacher Support 0.03 -0.24*** 0.25*** 0.01 0.26*** -0.04 Involvement 0.23*** 0.14 0.39*** 0.25** 0.44*** 0.28*** Investigation 0.20*** 0.02 0.35*** 0.17* 0.41*** 0.18* Task Orientation 0.32*** 0.20* 0.29*** -0.03 0.32*** 0.00 Cooperation 0.24*** -0.04 0.32*** 0.20*** 0.37*** 0.20* Equity 0.27*** 0.12 0.21*** -0.12 0.29*** -0.03 Multiple correlation, R 0.40*** 0.45** 0.49*** R2 0.16 0.20 0.24 *p<0.05, **p <0.001, ***p <0.0001, N=373.
An examination of the simple correlation coefficients in Table 16.7 indicates that there were statistically significant relationships (p<0.0001) between students' perceptions of their classroom learning environment
for seven of the scales of the WIHIC with all three scales of students’ perceptions of web-based computer assisted learning. A weak association was found between the Teacher Support scale and attitude to using computer. That is, students’ perception of web-based computer assisted learning scores were higher where they perceived their classroom as having more student cohesiveness, involvement, investigation, task orientation, cooperation, and equity. However, using the more conservative standardized regression coefficient (ß) which measures the association when the effect of the other scales is held constant, the regression coefficients of the Involvement, Investigation, and Cooperation scales retained their significance correlated with two of the WBCAL scales confirming the importance of having more involvement and investigation in the classroom. It is noteworthy that the students’ perceptions of their classroom learning environment contributed between 16 and 24 percent of the measured variance in students’ perception of their web-based computer assisted learning environment.
5.7 WIHIC & SWBL associations
A similar patter was found between students’ perceptions of their learning environment for seven of the scales of the WIHIC with all three scales of satisfaction of web-based learning (SWBL) (see Table 16.8). A weak association was found between the Teacher Support scale and satisfaction of web-based learning, but only at the p<0.05 level. However, using the more conservative standardized regression coefficient (ß), the Investigation scale is the only scale that retained its significance correlated with all three of the SWBL scales confirming the importance of having more investigation in the classroom. It is noteworthy that the students’ perceptions of their classroom learning environment contributed between 11 and 16 percent of measured variance in students’ attitude toward web-based learning.
Table 16.8
Associations Between WIHIC and SWBL Scales in Terms of Simple (r) and Multiple Correlations (R)
Attitude toward WWW Flash Reasoning toward WWW Flash Challenging toward WWW Flash Scale r β r β r β Student Cohesiveness 0.19 *** 0.02 0.20*** 0.06 0.24*** 0.11 Teacher Support 0.13 * -0.02 0.15** 0.03 0.22*** 0.07 Involvement 0.23*** -0.00 0.19*** -0.15 0.24*** -0.10 Investigation 0.29*** 0.22** 0.31*** 0.31*** 0.33*** 0.26*** Task Orientation 0.26 *** 0.09 0.28*** 0.18 0.32*** 0.19 Cooperation 0.27*** 0.17 0.21*** 0.02 0.22*** -0.06 Equity 0.19*** -0.09 0.19*** -0.06 0.26*** 0.20 Multiple correlation, R 0.34 *** 0.36** 0.40** R2 0.11 0.13 0.16 *p<0.05, **p <0.001, ***p <0.0001, N=388.
5.8 WBCAL and SWBL associations
An examination of the simple correlation coefficients in Table 16.9 indicates that there were statistically significant relationships between students' perceptions of their perception of web-based computer assisted learning for all three scales of the WBCAL with all three scales of the SWBL. A weak association was found between the Attitude to Using Computers and thinking. That is, student satisfaction of web-based learning was higher when they had a more positive attitude towards using computers, computer usage and web usage. However, using the more conservative standardized regression coefficient (ß), the Web Usage scale retained its significance with all the SWBL scales confirming the importance of having more web usage in classroom. The students’ satisfaction of web-based learning contributed between 8 and 28 percent of measured variance in students’ perception of web-based computer assisted learning.
Table 16.9
Associations Between WBCAL and SWBL Scales in Terms of Simple (r) and Multiple Correlations (R)
Attitude toward WWW Flash Reasoning toward WWW Flash Challenging toward WWW Flash Scale r β r β r β Attitude to Using Computers 0.20*** 0.06 0.18** 0.06 0.16* 0.02 Computer Usage 0.20 *** -0.08 0.18** -0.09 0.19*** -0.07 Web Usage 0.29*** 0.33*** 0.27*** 0.32*** 0.27*** 0.33*** Multiple correlation, R 0.31 *** 0.29*** 0.28*** R2 0.09 0.28 0.08 *p<0.05, **p <0.001, ***p <0.0001, N=373
5.9 Association between the WIHIC and cognitive outcomes
Associations between students’ perceptions of their learning environment and their cognitive outcomes before and after learning water pressure from the web-based flash science program also were analyzed using simple correlation analyses and standardized regression (Table 16.10). The students’ scores in the pre-test and post-test were used separately in these analyses. The simple correlation (r) figures reported in Table 16.10 indicate that there were statistically significant (p<0.001) associations between students’ pre-test scores and three of the scales of the questionnaire, namely, Student Cohesiveness, Investigation, and Equity. There were statistically significant (p<0.001) associations between students’ post-test scores and five of the scales of the questionnaire, namely, Student Cohesiveness, Investigation, Task Orientation, Cooperation, and Equity. An examination of the standardized regression coefficients shows that the Student Cohesiveness and Investigation scales contribute to students’ cognitive outcomes in both the pre-test and post-tests. Thus, having more student cohesiveness and investigation is very important for improving students’ cognitive outcomes in web-based flash science learning program. Students’ perceptions of their WIHIC contributed about 9% and 12% to the measured variance in students’ cognitive outcomes.
Table 16.10
Associations Between WIHIC Scales and Students Cognitive Outcomes in Terms of Simple (r) and Multiple Correlations (R)
Pre-test Post-test Scale r β r β Student Cohesiveness 0.18*** 0.15* 0.26*** 0.15* Teacher Support 0.10* -0.04 0.10 -0.03 Involvement 0.17*** -0.03 0.17** -0.12 Investigation 0.24*** 0.19* 0.25*** 0.19* Task Orientation 0.16* -0.05 0.25*** 0.05 Cooperation 0.15* -0.06 0.26*** 0.11 Equity 0.22*** 0.16 0.24*** 0.05 Multiple correlation, R 0.29*** 0.35*** R2 0.09 0.12 * p<0.05, **p <0.001, ***p <0.0001, N=388.
In addition, it was also found that there were statistically significant (p<0.001) associations between the Challenging and Students Self-Efficacy scales and students’ pre-test and post-test. That is, students’ cognitive achievement scores were higher where students perceived their teacher using more challenging questioning and where the students had a higher feeling of self-efficacy (see Table 16.11). No associations were found with the Differentiation scale.
Table 16.11
Associations Between Challenging, Students’ Self-Efficacy, and Differentiation Scales and Students Cognitive Outcomes in Terms of Simple (r) and Multiple Correlations (R)
Pre-test Post-test
Scale r β r β
Student Self-Efficacy 0.19*** 0.13 0.20*** 0.11 Differentiation 0.09 -0.05 0.08 -0.09 Multiple correlation, R 0.25*** 0.36*** 0.06 0.13 *p<0.05, **p <0.001, ***p <0.0001, N=388.
5.9 SWBL & cognitive outcomes
Associations between students’ satisfaction of web-based learning and their cognitive outcomes before and after learning water pressure from web-based flash science program also were analyzed using simple correlation analyses and standardized regression (Table 16.12). The students’ scores in the pre-test and post-test again were used separately in these analyses. The simple correlation (r) figures reported in Table 16.12 indicate that there were statistically significant (p<0.001) associations between students’ post-test scores and two of the scales of the questionnaire, namely, Attitude and Challenging. That is, students’ cognitive achievement scores were higher where students had a more favourable attitude toward the program and had more opportunity of think. An examination of the standardized regression coefficients shows that the Challenging scale is the only factor which retains its significance. Thus, having more challenging opportunities is very important for improving students’ cognitive outcomes in web-based flash science learning program. Students’ satisfaction of web-based leaning contributed about 9% and 12% to the measured variance in students’ cognitive outcomes.
Table 16.12
Associations Between SWBL Scales and Students Cognitive Outcomes in Terms of Simple (r) and Multiple Correlations (R)
Pre-test Post-test
Attitude toward WWW Flash 0.04 0.06 0.19*** 0.13
Reasoning toward WWW Flash -0.02 -0.18 0.09 -0.23*
Challenging toward WWW Flash 0.05 0.15 0.18*** 0.30***
Multiple correlation, R 0.12 0.24***
R2 0.01 0.06
*
p<0.05, **p <0.001, ***p <0.0001, N=424.
6. Discussion
This study attempted to facilitate students’ science learning involving the use of a web-based, multimedia, flash science learning program focusing through an online e-learning environment. This study examined the learning environment created during teacher and student use of this program in their science class and also investigated its impact on students’ cognitive and affective learning outcomes among different learning styles and different grade levels. The WIHIC, WBCAL, and SWBL questionnaires, Challenging scale, Differentiation scale, and Students’ Self-Efficacy scale were used in this study. The validation data provided in the study have confirmed the reliability and validity of the questionnaires for use in Taiwan.
During the use of this program, students perceived their learning environment as having high levels of student cohesiveness, task orientation, cooperation, equity and differentiation. They also perceived their teacher as using more challenging questions. In addition, the students’ attitude toward using computer and web usage were positive.
Students’ satisfaction with the web-based online science flash learning program was also quite high on the three scales of Attitude, Reasoning, and Challenging. Thus, students were very positive satisfaction about learning in this web-based flash science learning program. In particular, they perceived that the program is very interesting, satisfying, promoting their ability to reason, and challenging their thinking and problem solving ability.
Students’ cognitive outcomes also increased dramatically after learning science through the program, regardless their type of learning preference. This supports the Felder and Silverman (1988) study where they noted that the teaching style of most teachers does not match the learning style of most students in general, but, they found students learn
better from processes which are sensory, visual, inductive, and active. In addition, students from different grade levels all made a significant cognitive improvement after learning from the program.
Strong and consistent relationships were found between students’ perception about their classroom environment (WIHIC) and their perception of Web-based computer assisted learning (WBCAL). Simple correlations showed that students’ perception of web-based computer assisted learning scores were higher where they perceived their classroom as having more student cohesiveness, involvement, investigation, task orientation, cooperation, and equity. The more conservative multiple regression analysis indicated that between 16 and 24 percent of measured variance in students’ perception of web-based computer assisted learning could be attributed to their perceptions of classroom learning environment. If teachers wish to develop better perceptions in their web-based computer assisted learning, then they should allow more involvement, investigation, and cooperation.
Strong and consistent relationships also were found between students’ perception about their classroom (WIHIC) and their perception of satisfaction of web-based learning (SWBL). Simple correlations showed that students’ perception of satisfaction of web-based learning scores were higher where they perceived their classroom as having more student cohesiveness, teacher support, involvement, investigation, task orientation, cooperation, and equity. The more conservative multiple regression analysis indicated that between 11 and 16 percent of measured variance in students’ perception of satisfaction of web-based learning could be attributed to their perception of learning environment. If teachers wish to develop better satisfaction toward web-based learning, then they should allow more time for investigation.
Strong and consistent relationships also were found between students’ perception of web-based computer assisted learning (WBCAL) and their perception of satisfaction of web-based learning (SWBL). Simple correlations showed that students’ perception of satisfaction of web-based learning scores were higher where they perceived as having more positive attitude to using computers, computer usage and web usage. The more conservative multiple regression analysis indicated that between 08 and 28 percent of measured variance in students’ perception of satisfaction of web-based learning could be attributed to their perception of web-based computer assisted learning. If we wish to promote students’ better satisfaction toward web-based learning, then we
might need to enhance students’ perception of web-based computer assisted learning.
Associations with students’ cognitive outcomes were also found and were higher when students perceived more student cohesiveness, investigation, equity, self-efficacy, and the teacher used more challenging questioning. Having more of these aspects in the classroom is very important for improving students’ cognitive outcomes in web-based flash science learning program. It supports the Fraser (1994) study between student cognitive and affective outcomes and the learning environment, which indicated that classroom environment perceptions can influence students’ outcomes. Moreover, it again supports She and Fisher’s previous studies (2000, 2002) that the use of challenging questions can increase students’ science learning outcomes.
7. Conclusions and Summary
The work presented in this chapter provides a significant contribution to science learning involving the use of a web-based, multimedia, flash science learning program using an online e-learning environment. Results show that students perceived their learning environment created during the use of this online flash science program is their science class as having high levels of students’ cohesiveness, task orientation, cooperation, equity, differentiation, and their teachers using more challenging questions. Students’ attitudes toward using computers and web usage are very favourable. Students were satisfied with the program and their cognitive outcomes increased dramatically after learning science this way, regardless of any types of learning preference or grade levels. In particular, students’ cognitive outcomes were also found to be higher when students perceived more student cohesiveness, investigation, equity, self-efficacy, and more teacher use of challenging questions. These results are very encouraging and shed some light on how to successfully promote students’ science learning through the use of a web-based online physical science learning program.
References
Aggarwal, A. K., & Bento, R. (2000). Web-based education. In A. Aggarwal (Ed.), Web-based learning and teaching technologies:
opportunities and challenges. London, UK. IDEA Group
Publishing.
Beichner, L .B., Bernold, E. B., Dail, P., Felder, R, Gastineau, M. G., & Risley, J. (1999). Case study of the physics component of an integrated curriculum. American Journal of Physics, 67, 16-24. Bonk, C. J., & Cummings, J. A. (1998). A dozen recommendations for
placing the student at the center of web-based learning. Educational
Media International, 35 (2), 82-89.
Clement, J. (1994). Imagistic simulation and physical intuition in expert problem solving. In the Proceedings of the sixteenth Annual
conference of the cognitive science society (pp. 146-156). Hillsdale,
New Jersey: Lawrence Erlbaum,
De Jong, T. (1991). Leanring and instruction with computer simulations.
Education and Computing, 6, 217-229.
De Jong, T., & Van Joolingen, W. R. (1998). Scientific discovery learning with computer simulations of conceptual domains. Review of
Educational Research, 68, 179-201.
Dunn, R., & Dunn, K (1990). Understanding the Dunn and Dunn learning styles model and the need for individual diagnosis and prescription. Reading, Writing, and Learning Disabilities, 6, 223-247.
Felder R., & Silverman, L. (1988). Learning and teaching styles in engineering education. Journal of Engineering Education, 78, 674-681.
Finke, R.A. (1989). Principles of mental imagery. Cambridge, MA: MIT Press.
Fraser, B. J. (1981). Test of Science-Related Attitudes handbook (TOSRA). Melbourne, Australia: Australian Council for Educational Research.
Fraser, B. J. (1990). Individualised Classroom Environment
Questionnaire: Handbook and test master set. Melbourne: The
Australian Council for Educational Research.
Fraser, B.J. (1994). Research on classroom and school climate. In D. Gabel (Ed.), Handbook of research on science teaching and
learning (pp. 493-541). New York: Macmillan.
Fraser, B. J. (1998a). Science learning environments: Assessment, effects and determinants. In B.J. Fraser & K.G. Tobin (Eds.), The
international handbook of science education (pp. 527-564).
Fraser, B. J. (1998b). Classroom environment instruments: development, validity and applications. Learning Environments Research: An
International Journal, 1, 7-33.
Fraser, B. J., McRobbie, C. J., & Fisher, D. L. (1996, April). Development,
validation and use of personal and class forms of a new classroom environment instrument. Paper presented at the annual meeting of the
American Educational Research Association, New York.
Fraser, B. J., & Walberg, H. J. (Eds.), (1991). Educational environments:
Evaluation, antecedents and consequences. Oxford, England:
Pergamon Press.
Goldberg, F. (1997). Constructing physics understanding in a
computer-supported learning environment. AIP conf. Proc., 399,
903-911.
Gregory, J. R., & Stewart, M. F. (1997). Production of a multimedia CAL package in basic physics. Physics Education, 32 (5), 332-39. Hermann, N. (1988). The creative brain. Lake Lure, NC: Brain Books. Jinks, J. L., & Morgan, V. (1999). Children's perceived academic
self-efficacy: An inventory scale. Clearing House, 72, 224-230. Kosslyn, S. M. (1994). Image and brain: The resolution of the imagery
debate. Cambridge, MA: MIT Press,
Lumsdaine, E., & Lumsdaine, M. (1995). Creative problem solving. New York, NY: McGraw-Hill, Inc.
Maor, D., & Fraser, B. J. (1996). Use of classroom environment perceptions in evaluating inquiry-based computer assisted learning.
International Journal of Science Education, 18, 401-421.
Maccoby, E. E. (1990). The role of gender identity and gender constancy in sex-differentiated development. New Directions for Child
Development, 47, 5-20.
Monaghan, J. M., & Clement, J. (2000). Algorithms, visualization, and mental models: high school students’ interaction with a relative motion simulation. Journal of Science Education and Technology,
9(4), 311-325.
Newhouse, C. P. (2001). Development and use of an instrument for computer-supported learning environments. Learning Environment
Research: An International Journal, 4, 115-138.
Okebukola, P. A. (1986). The influence of preferred learning styles on cooperative learning in science. Science Education, 70 (5), 509-17.
Owens, L., & Barnes, J. (1982). The relationships between cooperative, competitive, and individualized learning preferences and students' perceptions of classroom learning atmosphere. American
Educational Research Journal, 19 (2) 182-200.
Oyama, T., & Ichikawa, S. (1990). Some experimental studies on imagery in Japan. Journal of Mental Imagery, 14, 185-195. Packer. J., & Bain, J. D. (1978). Cognitive style and teacher-student
compatibility . Journal of Educational Psychology, 70, 864-871 Renninger, K. A., Snyder, S. S., (1983). Effects of cognitive style on
perceived satisfaction and performance among students and teachers. Journal of Educational Psychology,75 (5), 668-676. Riding, R. J., & Douglas, G. (1993). The effect of cognitive style and
mode of presentation on learning performance. British Journal of
Education Psychology, 63, 297-307.
Rieber, L. P. (1991). Animation, incidental learning, and continuing motivation. Journal of Educational Psychology, 83, 318-328. She, H.C., & Fisher, D. (2000). The development of a questionnaire to
describe science teacher communication behavior in Taiwan and Australia. Science Education, 84(6), 706-26.
She, H. C., & Fisher, D. (2002). Teacher communication behavior and Its association with students' cognitive and attitudinal outcomes in science in Taiwan. Journal of Research in Science Teaching, 39(1), 63-78.
Steinberg, R. (2000). Computers in teaching science: to stimulate or not to stimulate. American Journal of Physics, 68(7), 37-s41.
Sternberg, R. (1997). Thinking styles. New York: Cambridge University press.
Tao, P. K., & Gunstone, R.F. (1999). The process of conceptual change in force and motion during computer-supported physics instruction.
Journal of Research in Science Teaching, 36 (7), 859-82.
Teh, G., & Fraser, B.J. (1994). An evaluation of computer-assisted learning in terms of achievement, attitudes and classroom environment. Evaluation and Research in Education, 8, 401-421. Tetiwat, O., & Igbaria, M. (2000). Opportunities in web-based teaching:
The future of education. In A. Aggarwal (Ed.) Web-based learning
and teaching technologies: opportunities and challenges. London,
UK: IDEA Group Publishing.
virtual environments: a descriptive study. British Journal of
Educational Technology, 33 (4), 471-488.
Wiles, J. & Bondi, J. (1993). The essential middle school (Second
Edition). New York, NY: Macmillan Publishing, Co.
Wubbels, T., & Levy, J. (Eds.). (1993). Do you know what you look like?
Interpersonal relationships in education. London, England: