內在價值、外在價值及功能價值在滿意度及再購意願所扮演之角色-資訊可見度之中介影響
73
0
0
全文
(2) . Acknowledgement. I would like to show my gratuity to my advisor, Dr. Chien-Hsing Wu, for all the effort he put to assist me completing my master thesis. Not only did he give me the guidelines but also showing me the procedures that are required throughout the whole process. I fully appreciate everything Dr. Chien-Hsing Wu has done to allow me have this accomplishment.. A special thanks to the IMBA assistant, Ruth Wang, for her kindly help along the way. She is always a helpful person which allows my process of writing my thesis smoother.. Finally, I would like to express my appreciation to my parents, encouraging me and giving me advice to achieve this goal. The confidence that they gave me propelled me to today’s success.. During these two years, I learned a lot and became more mature as a person. This opportunity was special for me as I gained knowledge and experience which helps me grow.. Yung-Hsien Lin June, 2015. II .
(3) . The Role of Internal Value, External Value, and Functional Value in Purchasing Satisfaction towards Repurchase Intention: Mediating Effects of Information Visibility Advisor: Dr. Chien-Hsing Wu Department of Information Management National University of Kaohsiung Student: Yung-Hsien Lin International Business of Administration National University of Kaohsiung. ABSTRACT With the rapid development of advanced internet technology, purchasing products via electronic commerce (EC) has increasingly become one of the popular channels for markets. While literature presents various examinations of antecedents of repurchasing behavior, it at the same time puts limited attention to the role of value consumption theory for the sports products. The value consumption theory used in the thesis contains internal value, external value and functional value with respect to their effects on purchasing satisfaction towards repurchasing intention. A salient examination is the mediation effect of information visibility on independent variable and purchasing satisfaction. Data analysis results from 354 valid online consumers present the findings that (1) in the first level, internal value, external value and functional value are all significantly associated with purchasing satisfaction; however, internal and functional value show strongly while external weakly. (2) Information visibility act as a mediator which can fully mediates external value and partially mediate internal and functional value. (3) In the second level, all variables are significantly associated with purchasing satisfaction strongly with the exception of need, which was weakly. (4) Information visibility act as a mediator which can fully mediate epistemic, conditional and need and partially mediate emotional, social, price, quality and usage. Discussion and implications are also addressed. Keywords: Mobile commerce, consumption value, sports products, information visibility. III .
(4) . 內在價值、外在價值及功能價值在滿意度及再購意願 所扮演之角色-資訊可見度之中介影響 指導教授:吳建興 博士 資訊管理學系 國立高雄大學 指導學生:林雍憲 國際商業管理碩士學位學程 國立高雄大學. 摘要 由於科技快速地發展,線上購物已成為消費者主要的消費方式之一。 雖然過去的文獻已驗證消費價值論可以用來描述消費者再購意願,然而, 影響線上運動產品的再購意願仍未做更深入的分析,尤其是資訊豐富性在 購物滿意度所扮演的角色,至今仍著墨甚少。本研究論文以消費價值論(內 在價值、外在價值以及功能價值)為理論基礎,提出並實證檢驗一個運動 產品的再購意願的因果模式,同時也檢驗資訊可見度在消費價值因素與購 物滿意度的中介關係。由 354 份有效的資料分析結果發現:(一) 內在價 值、外在價值以及功能價值皆與購物滿意度有顯著關聯;不過,內在價值 及功能價值顯示強烈顯著,而外在價值顯示較弱顯著。(2) 資訊可見能完 全中介內在和功能價值而部分中介外在價值。(3) 在第二層的分析當中, 所有變數顯示強烈顯著而需求價值則顯示較弱顯著。(4) 資訊可見度在第 二層完全中介了知識、狀況以及需求價值而部分中介了情緒、社群、價格、 品質和使用價值。本研究論文同時也提出討論及相關管理意函。 關鍵詞:網路消費 購買價值論 運動用品 資訊可見度 . IV .
(5) . Table of Contents List of Tables .................................................................................................................. II 0HTU. UT. 6H. List of Figures ............................................................................................................... III 1HTU. UT. 67H. Chapter One: Introduction ............................................................................................. 1 2HTU. UT. 68H. 1.1 Background ...................................................................................................................... 1 3HTU. UT. TU. UT. 69H. 1.2 Motivation and Objectives ............................................................................................... 3 4HTU. UT. TU. UT. 70H. 1.3 Research Procedure ......................................................................................................... 4 5HTU. UT. TU. UT. 71H. 1.4 Thesis Overview .............................................................................................................. 5 6HTU. UT. TU. UT. 72H. Chapter Two: Literature Review and Hypothesis Development ................................... 7 7HTU. UT. 73H. 2.1Mobile Commerce ............................................................................................................ 7 8HTU. UT. 74H. 2.2 Expectation-Confirmation Theory................................................................................. 11 9HTU. UT. 75H. 2.3 Consumption Value Theory .......................................................................................... 13 10HTU. UT. 76H. Chapter Three: Research Method ................................................................................ 27 1HTU. UT. 7H. 3.1 Research Framework and Hypotheses........................................................................... 27 12HTU. UT. 78H. 3.2 Sampling Plan................................................................................................................ 29 13HTU. UT. 79H. 3.3 Measure ......................................................................................................................... 29 14HTU. UT. 80H. 3.4 Data Analysis and Techniques ...................................................................................... 32 15HTU. UT. 81H. Chapter Four: Results and Discussions........................................................................ 33 16HTU. UT. 82H. 4.1 Descriptive Statistics ..................................................................................................... 33 17HTU. UT. 83H. 4.2 Reliability ...................................................................................................................... 40 18HTU. UT. 84H. 4.3 Factor Analysis .............................................................................................................. 42 19HTU. UT. 85H. 4.4 Hypothesis Testing ........................................................................................................ 45 20HTU. UT. 86H. 4.5 Discussion and Implications .......................................................................................... 51 21HTU. UT. 87H. Chapter Five: Conclusion ............................................................................................ 54 2HTU. UT. 8H. 5.1 Research Findings ......................................................................................................... 54 23HTU. UT. 89H. 5.2 Research Suggestions .................................................................................................... 55 24HTU. UT. 90H. 5.3 Future Studies ................................................................................................................ 56 25HTU. UT. 91H. References:................................................................................................................... 57 26HTU. UT. 92H. Appendix A: Research Questionnaire (Chinese version) .................................................... 60 27HTU. UT. 93H. Appendix B: Research Questionnaire (English version) ..................................................... 63 28HTU. UT. I . 94H.
(6) . List of Tables Table 1.1: Research Focus over the Past Five Years ............................................... 2 29HTU. UT. 95H. Table 2.1: Most Popular Jersey Sales in the NBA .................................................. 9 30HTU. UT. 96H. Table 3.1 Operational Definition for Variables ..................................................... 30 97H. Table 4.1 Overall Descriptive Statistics for the Valid Samples ............................. 33 Table 4.2: Mean and Standard Deviation for Independent Variables .................... 37 Table 4.3: Mean and Standard Deviation for Dependent Variables ...................... 38 Table 4.4: Mean and Standard Deviation for Mediator ......................................... 39 Table 4.5: Mean and Standard Deviation for the Combined Independent Variables ............................................................................................................................. 39 Table 4.6: Cronbach’s Alpha for Independent Variables ....................................... 40 Table 4.7: Cronbach’s Alpha for Dependent Variables ......................................... 42 Table 4.8: Cronbach’s Alpha for Mediator ............................................................ 42 31HTU. UT. 32HTU. 98H. UT. 3HTU. 9H. UT. 34HTU. 10H. UT. 10H. 35HTU. UT. 102H. 36HTU. UT. 37HTU. 103H. UT. 38HTU. 104H. UT. 105H. Table 4.9: Factor Analysis Results for Independent Variables .............................. 44 Table 4.10: Factor Analysis for the Dependent Variables ..................................... 45 Table 4.11: Test Results for H1 ............................................................................. 46 Table 4.12: Tests Results for H2, H3 and H4. ....................................................... 46 Table 4.13: Tests Results for Information Visibility towards Satisfaction ............ 47 Table 4.14: Results for Internal, External and Functional towards Information Visibility .............................................................................................................. 47 Table 4.15: Test Results for H5, H6 and H7.......................................................... 48 Table 4.16: Test Results for H2a-H4d ................................................................... 49 Table 4.17: Results for H5a-H7d........................................................................... 50 39HTU. UT. 40HTU. 106H. UT. 41HTU. 107H. UT. 108H. 42HTU. UT. 43HTU. 109H. UT. 4HTU. 10H. UT. 1H. 45HTU. UT. 46HTU. 47HTU. UT. 13H. UT. 14H. II . 12H.
(7) . List of Figures Figure1-1: Research Procedure ............................................................................... 5 48HTU. UT. 15H. Figure2-1: Phone Brand Shares in 2013 ................................................................. 8 Figure2-2: Shoes Brand Market share ................................................................... 10 Figure2-3: Expectation- Confirmation Theory ..................................................... 12 Figure2-4: Consumption Value Theory Model ..................................................... 15 49HTU. UT. 50HTU. 16H. UT. 17H. 51HTU. UT. 52HTU. 18H. UT. 19H. Figure3- 1: Research Framework ............................................................................1 53HTU. UT. Figure4-1: Brand Preference for the Respondents ................................................ 36 Figure4-2: Accessories Preference for the Respondents ....................................... 37 Figure4-3: Validated Statistical Results ..................................................................1 54HTU. UT. 5HTU. 56HTU. UT. UT. III . 120H. 12H.
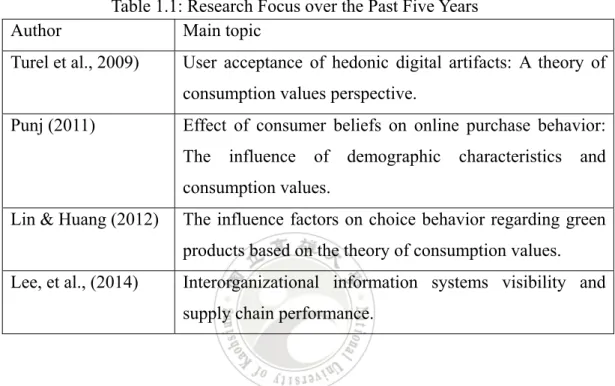
(8) . Chapter One: Introduction 1.1 Background Throughout the past few decades, the World Wide Web or the Internet has changed our style of living. High technology is improving at a high rate and does not seem to slow down anytime soon. Prior to the 20th century, human species may not P. P. expect such a dramatic development but it is clear that technology has immersed into our lives. There are many advantages, for instance, with the fast speed of the Internet, consumers can purchase the product with just one click of a button. This has become a trend, as young people consider it to be the most convenient way to order the commodities that they want. Although one may argue that online purchasing has weaknesses and may hinder our private information, the security systems are more enhanced compared to the past, with some of them requiring answering personal questions or fingerprints. In today’s global village, transactions between countries are made almost every day. Thus, it is essential to connect one another and that the response can be delivered immediately. The platform of Internet then plays a huge role, as it is very convenient, handy and easy to use. This study will focus on determining the variables that affect online purchasing behaviors on sports products. Also, analysis of consumption values will be applied as an observation. In the past, there were reviews about this topic and some of which were adopted. Table 1.1 shows some of the literature that deal with the issue of consumption value and purchasing behavior, and information visibility as well for this study within the past five years. For example, Punj (2011) reported that consumers tend to consider the fitness of products and time the most important aspects when buying products online. Moreover, to address the purchasing behavior issue, Lin & Huang (2012) conducted a research that consumption value is an 1 .
(9) . essential factor towards purchasing behavior. Their report indicated that there are a lot of variables that should be put into consideration. This implies that functional value, social value, conditional value, emotional value and epistemic value are all determinates of online purchasing.. Author. Table 1.1: Research Focus over the Past Five Years Main topic. Turel et al., 2009). User acceptance of hedonic digital artifacts: A theory of consumption values perspective.. Punj (2011). Effect of consumer beliefs on online purchase behavior: The. influence. of. demographic. characteristics. and. consumption values. Lin & Huang (2012). The influence factors on choice behavior regarding green products based on the theory of consumption values.. Lee, et al., (2014). Interorganizational information systems visibility and supply chain performance.. Information visibility has been seen one of the important factors that determine the purchasing intention. For example, Lee, Kim & Kim (2014) reported from their research findings that asset specificity, complementary resources and joint governance can be positively influenced by visibility. Therefore, another part of this study is to test whether information visibility can play as a mediator or not. In other words, when the information is more visible, will the repurchase intention be higher or not? It is a very new concept as not a lot of research has been done on it, in particular for the context of online sports products. This study will open up a new era and work as a base for future reference in related topics.. 2 .
(10) . 1.2 Motivation and Objectives In our modern society, people consider it is better looking when one’s body is fit. It is not healthy either to be too fat or skinny; therefore, a lot of us would consider exercising to be a part of our routine. Also, the designs of sports products are becoming more and more fashionable, allowing every citizen to wear them even though they are not athletes. With the combination of rapid growth in online marketing, sports products can be purchased online as well. Therefore, one of the motivations of this study is to observe why people would choose to buy sports products online. Of course, there are always advantages and disadvantages when making a decision. What we would like to know is that how consumers balance their cost and benefit, leading to the final destination from the perspective of consumption value. In the field of consumer behaviors, there are a lot of things that needs to put into consideration. It is clear that there are many factors involving this subject. We would like to know what the forces are that propel customers to purchase the product. As a result, the objective of this study is to investigate the variables contributing to this certain behavior. With the assistance of data analysis and statistical inference under computer software, this research will test whether these variables or factors have significant effects. In today’s world, the value of time is very precious as people would use money to buy time in order to become more efficient. Saving time not only helps them work faster but also leaves up some leisure time for them to rest. The fast-going pace is dominating our society and we would like to receive the new message first hand. Therefore the ease of use and understand is essential when promoting products. Information visibility provides the information that we need to know prior purchasing. If it is clear and makes the transaction move quicker and smoother, there would be 3 .
(11) . positives effects. Hence, another objective in this study is to test whether information visibility can enhance the variables and ultimately increase the possibilities of repurchase intention. To sum up, the motivations and objectives of the research thesis are listed as follow: 1. Investigating the variables that have significant effects on repurchasing behavior. 2. Examining if information visibility can be a mediator that alternates the effect of independent variables on the dependent variables; increasing the chance of repurchasing intention.. 1.3 Research Procedure The research procedure of the thesis is shown in Figure 1.1. The research is about the internal, external and functional value of consumers’ perception of satisfaction when buying products online. Also, there will be a mediator, information visibility, to test whether it will lead to repurchase intention as the mediation effect of information visibility on the relationship between independent variables and purchasing satisfaction is examined empirically. After the topic and objectives are all figured out, literature review is conducted as a resource to learn more about this issue, where research hypotheses are defined. The next step will be developing the research model sampling plan and measure will be described. To obtain the data, this research will distribute questionnaires online. When all the data are collected, reliability and validation will conducted and computer software will be utilized to test whether the hypothesis developed earlier are significant or not. Lastly, discussion and implications will be addressed, followed by the conclusions and suggestions. This paper can also be a reference for future studies in related issues or topics. 4 .
(12) . Research Background, Motivation and Objective . Literature Review and Documents . Research Method Design: Online Questionnaire . Collecting Data and Analysis . Major Findings and Research Result . Research Conclusions and Suggestions \. \. Figure1-1: Research Procedure. 1.4 Thesis Overview There will be a total of five chapters in this research. Contents and descriptions of each chapter will be introduced as follows: Chapter One: Introduction. Research background is included in this chapter as well as the motivation and objectives. The outline and research procedure can be 5 .
(13) . viewed here too. Chapter Two: Literature review. Besides the journals and articles that are used as references, this chapter will also introduce the variables adopted, giving more interpretation and explanation in deep. Theories that are used in this study will be utilized and the proposal of hypothesis will be in this section. Chapter Three: Research method. This chapter will interpret the methods used and the sampling plan. Also, the model will be developed in order to test the hypothesis using the questionnaires. Chapter Four: Results and Discussion. Using the computer software to get the results, this part will analyze the data and explain the research results. Statistical inferences will be made in order to know whether it is significant or not. Chapter Five: Conclusion. The summary and conclusion compose of this chapter as to know the major findings. In addition, suggestions are made for future studies.. 6 .
(14) . Chapter Two: Literature Review and Hypothesis Development 2.1Mobile Commerce As advanced Internet technology gradually evolves throughout our daily lives, consumers expect something new or fancy compared to the past. It cannot be neglected that this technical equipment has played a huge role on Earth’s development. For instance, cameras have flourished its way, becoming almost a necessity in every household. The great aspect of it is that in the past, we did not know if the picture we took was good enough; but as for now, we could review our photos and decide if we would like to keep it or not. If we are not satisfied with it, just simply click on the delete button and retake it again. Another advantage of digital cameras is that we could just save our photos in the desktop, whereas in the past, seems like printing the photos out would be the only method to admire them. Mobile phones are another great invention of human beings. Certainly, cell phones have also made a great leap, making a big proportion of people feeling that they cannot live without them. In fact, the market share for mobile phones has been really competitive in the past few years (Mick, 2013). Figure 2.1 shows the market share of some mobile brands in 2013 conducted by Consumer Intelligence Research Partners (CIRP). Besides calling, texting, and using applications on our smart phones, online purchase has also become a trend. The convenience that it brings to us is not only saving our time to go to specific stores and purchase the product, but also it gives consumers a chance to view and compare products within the same platform (Liu & Xiong, 2005). The percentage of online purchasing will continue to grow because this way of purchasing is really fresh among us; given the fact that human race reacts more sensitive to novelty (Cooper, 2013). People in the past would have never 7 .
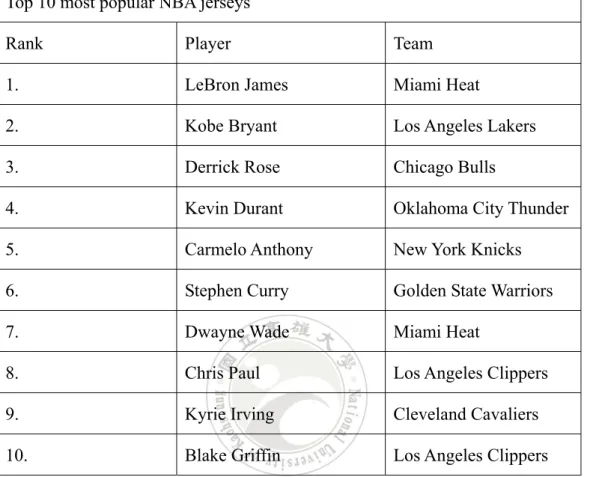
(15) . thought anything like this as specialists expects the rate to increase in the near future.. Figure2-1: Phone Brand Shares in 2013. Sports products tend to follow the same path as online purchasing as well. Back in the days, sportswear would be only considered to be worn by athletes due to the fact that in order for them to excel in their professionalism, their outfit certainly accounts for a part of it. For example, basketball players would have to wear jerseys in games so that the resistance is lower compared to wearing a short sleeve shirt while shooting. Nevertheless, in today’s world, jerseys have become a style of outwear. The sales of the most famous players in the NBA, LeBron James, Kobe Bryant and Derrick Rose made the top of the list (NBA official release, 2013). Rankings can be seen in Table 1.. 8 .
(16) . Table 2.1: Most popular Jersey Sales in the NBA. Top 10 most popular NBA jerseys Rank. Player. Team. 1.. LeBron James. Miami Heat. 2.. Kobe Bryant. Los Angeles Lakers. 3.. Derrick Rose. Chicago Bulls. 4.. Kevin Durant. Oklahoma City Thunder. 5.. Carmelo Anthony. New York Knicks. 6.. Stephen Curry. Golden State Warriors. 7.. Dwayne Wade. Miami Heat. 8.. Chris Paul. Los Angeles Clippers. 9.. Kyrie Irving. Cleveland Cavaliers. 10.. Blake Griffin. Los Angeles Clippers. Source: www.nba.com Shoes are also another big product. The best athlete in the world, Michael Jordan had his own brand when he was playing with the Chicago Bulls. During that period of time, sports fans went crazy because the Jordan brands would have a new pair of shoes every year and people would collect them. Figure 2.2 tells us that Jordan brand still remains the dominant brand of shoes. Other brands like Converse, is also on the rise, as many teenagers specify that it is their favorite shoe and can be seen on the streets quite often.. 9 .
(17) . Figure2-2: Shoes Brand Market Share (Source: Statista). Jerseys and shoes were considered more as a fashionable part of outwear. On the other hand, sports products like badminton rackets or baseball bats were more technical. The sales of these products were lower than the shoes or jerseys, due to the fact that people would only consume them if they wanted to participate in the particular game. As it can be seen, the behavior of purchasing online sports products are somewhat affected not only externally but also internally as well. One could have the desire to buy Jordan shoes due to fact that he thinks that this is a trend and it can make him perceive himself as a higher social class. On the contrary, people who actually play sports on a regular basis would buy technical products since these are the requirements in order to perform in a contest. In the present world, mobile commerce has immersed into our lives so that it makes us easier to consume products through online. Therefore, the penetration rate of mobile commerce can only increase. This study will utilize the expectation confirmation theory, discussing what. 10 .
(18) . factors or variables can lead to repurchase intention. According to the theory, if consumers have a higher satisfaction, the repurchase intention would be higher. The perceived performance, which incorporated expectation and confirmation are also important because if the actual performance is better than what we expected, it would often lead to a higher repurchase intention.. 2.2 Expectation-Confirmation Theory The expectation- confirmation theory is a common model used to explain the consumers’ purchasing behavior (Bhattacherjee, 2001). It consists of five variables including expectations, perceived performance, confirmation, satisfaction, and repurchase intention. Figure 2.4 displays the whole model. The expectation variable implies the level of anticipation before applying to the actual event. For example, if we are going to a watch live baseball game that features the best pitchers on both teams, we would anticipate for a very exciting game. One thing to notify is that this is all before the activity happens. In the case of shopping or purchasing, we would describe it as pre-consumption. The perceived performance variable is referred to the thinking of how good your product or site actually is (West, 2014). It is mainly focusing on the seller side, determining how good they perform throughout the whole process. The confirmation variable and the satisfaction variable are closely related. If the subject has a positive belief towards the service, the satisfaction rate would be higher. Based on the fact that people have different personalities, one might think that this product or service deserves a high rating whereas others might not, although they are both provided with the same service. Finally, the ultimate goal is to lure the customers to buy the products again. Repurchase intention will be mostly decided by how satisfied are the consumers with the products or service. Other studies have also 11 .
(19) . included different approaches, indicating that service quality influences repurchase intention (Blery, 2003) significantly. On the flip side of expectation, repurchase intention, is focused on the post-consumption. Since repurchase means coming back and buying it again, this part discusses the actions after one has bought or been served already.. Expectation Perceived Performance. Confirmation. Satisfaction. Repurchase Intention. Figure2-3: Expectation- Confirmation Theory (Bhattacherjee, 2001). Due to the fact this model can be adopted in a variety of ways, there are different points of views extending from it. One case is that Brown et al. (2007) found out that there were some relationships while he examined the expectation, experience and satisfaction all together. In this model, it also incorporated the ease of use and usefulness; which in this case, can be an extension to this study too because ease of use is used to characterize the functions of the product or service. As a result, when there is a higher experience, it often leads to a higher expectation (Brow et al., 2007). Innis and La Londe (1994) found out that customer service has a significant impact on repurchase intention using the satisfaction confirmation theory. Often, we would perceive the service quality by expressing how you have been served by the waiter or waitress, in the case of a restaurant. Since there are all kinds of services in the service industry, it is essential for managers to carefully train the employers and assure that they provide the best service to their customers. In this competitive industry, just a simple two words “thank you” could be the determining factor of 12 .
(20) . consumers choosing where to consume. Therefore, customer service can maintain customer loyalty (Innis & La Londe, 1994), and also increases the rate of repurchasing. Another interesting paper incorporated the expectation confirmation- theory with the self-determination theory, indicating service expectation, confirmation and satisfaction are positively on self-determined motivation (Lin et al., 2009). Self-determination theory has three basic variables affecting the outcome which are competence, relatedness and autonomy. This research has some major findings because it gives us an indicator, realizing the fact that when people are more satisfied, they will become more loyal, leading to the repurchasing stage more easily. However, whether it is applicable for the online sports products repurchasing behavior is still under examination. Therefore, the current study develops the first hypothesis as follow. H1: Satisfaction significantly influences online repurchasing intention.. 2.3 Consumption Value Theory One aspect of this study is to investigate whether consumers have a trend or preference when buying sports products online. The value of the concrete object that it brings towards buyers is different among each and every one of them; making it an interesting faucet as we would like to know what variables would have an effect on it while purchasing products online. Therefore, the consumption value theory would be adopted in this research. This is the most relevant theory to use since we would like to know how much value is the product worth to consumers. Sheth et al. (1991) examined that why customers have the desire to buy a certain product or not. Extending from this, when consumers actually do make a purchase, 13 .
(21) . the choices that they make can be another interesting topic too. In other words, why we chose this product instead of others is worthwhile for us to observe. In our case, we could also conclude that why do consumers have a tendency to buy certain brands over others. This psychological behavior accounts for a big proportion in decision making when facing the dilemmas of which products we should buy. The consumption value theory identified by Sheth et al. (1991) stated that there are a total of five variables, including functional, conditional, social, emotional and epistemic variables. All these five factors have an impact towards consumer choice behavior. As a matter of fact, the purchasing behavior of each individual is largely different, which makes it hard to explore. This is why the consumption value theory model puts various variables together in order to make it more judgmental and critical. Also, three conditional remarks were made to clarify the whole landscape of the theory. Figure 2-4 displays the framework of the consumption value theory model. 1.. Consumer choice is a function of multiple consumption values.. 2.. The consumption values make differential contributions in any given choice situation.. 3.. The consumption values are independent.. Functional Value . Conditional Value . Social Value . Consumer Choice Behavior. Emotional Value . Epistemic Value . 14 .
(22) . Figure2-4: Consumption Value Theory Model (Sheth, Newman, &Gross, 1991). The consumption value theory is a theory that can be used in a lot of different fields. It can also be applied in a variety of ways. For instance, Turel et al. (2010) used this model to develop hypothesis concerning hedonic digital artifacts. Within it, subjects were asked if they perceive positive attitudes towards the artifacts while utilizing it. Another example was that Punj (2011) installed it to examine the consumers’ shopping behavior online. The paper showed significant relevance to this study because both of which are focusing on the online platform. In recent years, the issue of green consumption has been rising as more and more people are interested in this novel topic. There have also been a lot of debates on this topic, whether to construct a new building in designated areas or to leave the environment as it is. Controversies and arguments can be seen on TV or in the news regarding what is the best choice to make in order to make the world a better place. Will constructing really improve our economic and increase every citizen’s wealth? Or we human beings should not harm the nature and try to preserve it as much as we can? The bargain will go non-stop as it still remains a difficult task to solve. As a matter of fact, the theory was also used in the green consumption field as well by Lin and Huang (2012). As we can see, despite the fact that these are all different subjects, all of them can adopt the consumption value theory to explain the hypothesis or the model. From this, we can conclude that this theory is really important among us and it should be widely used in every aspect. One of the most valuable discoveries concluded from the consumption value theory is the functional value that it possesses. For example, musical appeal and playfulness are really essential behind the use and recommendation of ringtones (Turel, 2010), indicating that for people who do use ringtones on their mobile phones, 15 .
(23) . they are. more attracted to music and may have high interest in them. Knowing this. beforehand, the market could provide all sorts of ringtones for these users to choose from; as this will make the users find it more appealing and might have a higher possibility of choosing the ringtones provided by this company in the future. The power of consumption value theory is not only limited to predicting our purchase behavior. It can go beyond that, advising policy makers design communication strategies to assist low income consumers enjoy the benefits that the high income households own (Punj, 2011). Online purchasing not only saves our time, it can also save the money on gasoline if we were to drive or commute. Therefore, the functional value that it brings us is not only consumers actually enjoy the process of shopping, but also searching for what the best fit for each buyer. As a result, policy makers could offer more benefits towards online purchasing, which could eventually attract more low income consumers and helping them enjoying the benefits as well. There are still a lot to be developed from the consumption value theory and areas that can be discussed even deeper too. Although every products are different, there may be some characteristics that some of them may share. In order to make the analysis more effective, categorizing these attributes together before evaluating and constructing the hypothesis should be a reasonable method to adopt. This study will not follow the same path of the original model. Some twists of changes were made in order for this paper easier to categorize. First of all, the emotional value and epistemic value would go under the internal value because these two variables are both explaining it from humans’ inner voice. In fact, the major effect comes from our own beliefs; making it a more meaningful variable. Next, the conditional and social value can be classified into the external value. Since the social is dealing with other people, and conditional is affected by special events, both of which are on the opposite human internal, which is the external variable. Lastly, the 16 .
(24) . functional value would have four subordinate variables which are price, quality, need and usage. This part would have more arguments for the functional value as it includes the practical instincts of the product. Of course, price and quality would be considered the most important factors when making a purchase of a product you like. After consuming the product, one would realize if they really need it or they just want to possess it based on their instincts. The last subordinate variable, usage discusses while we are using the product, was it a good experience or it was not very handy. Notice that only the categorizations are different from the original model, it is still based on the theory and that nothing has changed much aside from the layout. In fact, based on the understanding of the consumption theory and the product characteristics, the current study groups the dimensions of consumption value into two composites: internal value and external value. Details are described below.. 2.3.1 Internal value The internal value discusses our natural behavior arousing from our deepest part of our mind and heart. This is all affected by our own cognitive thinking; leading us to make a choice within ourselves. Emotions carry valuable meanings (Stosny, 2009) which are all built-in and can reflect our behaviors. For example, if one feels hungry, the facial expression would look more uncomfortable compared to those who are already full. Barlow and Maul (2000) stated that it is also important for sellers to create bonds with their customers. The fact that if people are served well and are kept in good contact with each other, they would have a higher chance of repurchasing because they are already familiar to one another. One goal for servers is to create value to customers, so that they would have emotions towards the service (Barlow & Maul, 2000). The end user would like to make a purchase from the same client as they 17 .
(25) . may have become more intimate and the merchant would have an extra loyal customer. This will lead to a positive relationship which creates a win-win situation. In reality, it is difficult to explain why consumers have this impulse to purchase the commodity. On one side, it is the desire to obtain it, feeling that I cannot live without the specific product so I need to buy it. But it is also the attractiveness of it, that people cannot withstand the power of marketing. When our emotions are really strong towards the merchandise, there is nothing that can stop us from purchasing it. Epistemic value refers to the novelty or curiosity that drives consumers to purchasing behavior. The similarity between emotional and epistemic is that both of them are derived from the internal part. However, the difference between them is quite large. Epistemic is the power that lures you to become cool or to just experience new stuff, although it may not be a necessity for you. In other words, buying the commodity can make you feel good about yourself. On the contrary, emotional value does not have the power to pull you but it is the happiness you perceive and the willingness to pay pushes you to make the purchase. When customers possess these two feelings, the urge to consuming becomes stronger and stronger. From an epistemic point of view, our behaviors are orientated from the intrinsic values (Grimm, 2008); we can conclude that epistemic plays a big role when discussing consumer behaviors. In the case of sports products, some people would buy Jordan brand basketball shoes because they think it is fancy and looks good on them. Another example would be purchasing jerseys in virtue of it is a new experience for some of us. People tend to react more sensitive to novel things and out of curiosity, we would like to try things that we have never done before. Similar to young children while growing up as they will always show a higher interest when new objects are displayed in front of them (Eysenck, 2004). Hedonic values provide consumers to actually enjoy the process of shopping. 18 .
(26) . This psychological feeling of content derives within customers. Some people may not purchase a product, but they would enjoy window shopping for they perceive satisfaction while doing this. Normally, female consumers will enjoy this action more than male consumers. They do not think it as wasting time instead they are appreciating their behavior by simply relaxing and wandering. In the online world, people would often make an implicit trade-off between effort and accuracy (Punj, 2011). Is the time that they save more important? Or is it the accuracy of the product fit more essential? This is a bargain that every online consumer will face; base on their cognitive choice, they would make a decision that suits them well. Combining all these internal factors all together, it certainly has an impact towards our purchasing behavior. Therefore, the current study attempts to reveal whether internal value affects satisfaction and proposes the second hypothesis as follow. H2: Internal value significantly influences satisfaction. 2.3.2 External Value Our purchasing behavior can be affected in a variety of ways. Not only internally, but it also can be influenced externally as well. After combining these two sectors, it will make our hypothesis more reasonable because any research cannot be tested from one point of view; it has to be treated from a variety of perspectives. Social value puts the environment into consideration. When a typical person wants to belong to a certain group, he might need to perform a status or obtain a designated object in order to be considered into that social group. Some people would like to express their status by showing what they have (Chen, 2006) so that other people can accept them too. In this reality world, one would certainly like to put themselves into a higher social class and do not want to be discriminated by other people around them. It is always a 19 .
(27) . sensitive issue because of the different race, wage and culture between us. Pan (2009) stated that when we link a specific product to a group, we are classifying our norms into the society. For instance, we would often associate people who drive a Mercedes-Benz a higher social class due to the expensive price in those vehicles. On the other hand, if a person does not possess any luxury goods, they might be viewed as a lower class, owing that they might not think those goods are necessary or a lower income level. Another value that falls under the external content is the conditional variable. The variable talks about under specific circumstances or special events, the intention to repurchasing will rise. For example, when Christmas is around the corner, parents will go to department stores to look for presents that are suitable for their children. It is the holiday season’s atmosphere that drives the parents to go buy the gifts; otherwise it would be abnormal for not getting presents for their kids. Under special conditions, the conditional value will have an effect on our purchasing behavior because a lot of us would follow the social norm, realizing that the proper thing to do on a special day is to show our considerations to our family and relatives. Conditional value was originally developed from temporary functional or social value (Sweeny & Soutar, 2001). It can be seen as an individual part as in comparison to the other variables. One of the major differences of conditional value is that the situation affects our behavior more than anything else. For instance, some people enjoy to update, and think that it is very fashionable to adopt the latest trend (Chen & Lin, 2008), which is the case of his motivation that propels himself to buy goods. On the other hand, conditional sometimes cannot be rejected since it would be considered weird not to follow what other people do. We humans do not want to be stereotyped, so this makes us follow what most of the other people are doing. There is no right or wrong, but under these special circumstances, you really cannot resist the force that 20 .
(28) . conditional value brings to us. In the subject of economics, government intervention is considered one of the most influential factors. We cannot overlook the impact that others bring among us. For instance, if your friends prompted you to follow what they do, you might follow for there is the peer pressure. As an inference, the government could promote a policy and we as citizens may choose to obey. In this case, if we are encouraged to exercise more or the mayor could try to held more sports events and eventually could become an athletic and healthy city. Sports and exercises would be the hot topic as residents would be more into it. Also, if there were some discounts when you purchase online, it will become trend which will help our purchasing means more convenient. Combining all these external factors all together, it certainly has an impact towards our purchasing behavior. Therefore, the current study attempts to reveal whether external value affects satisfaction and proposes the third hypothesis as follow. H3: External value significantly influences satisfaction. 2.3.3 Functional Value In addition to the internal and external values, we cannot neglect the third variable in the model, functional value. As a matter of fact, the functional value is considered the most essential part (Sheth et al., 1991) when discovering the consumer’s purchasing behavior. In this study, the functional value will contain four attributes which are price, quality, need and usage. In the marketing world, price certainly is a very important aspect as many people will base on their understanding of what is cheap or expensive and then make their decision of whether to buy the good or not. It is always the first thing that comes into our mind since the price tag is just in front of our eyes. In economics, people would 21 .
(29) . judge on what is the equilibrium price so that it equates supply and demand (Callan & Thomas, 2007). As for the commodity itself, the merchant will charge the price in order to show the value towards the product; the consumers will evaluate their willingness to pay before the transaction occurs. The price sensitivity for each person may differ, therefore making the seller hard to adjust the price from time to time. For example, if the price was raised by three percent, some buyers would think it is too expensive and change to another brand. But price reduction may not be the best solution to improve value for money perception (Turel et al., 2010). As a result, the pricing decision remains one of the toughest goals for the retailer as they would have to choose the right price in order to gain profit and maintain customer loyalty. Besides price, the quality factor is another segment that we would put into serious consideration when consuming. Generally, higher quality will require a higher price (Zeithami, 1988), contributing to a positive relationship. The standard of living has been increasing so people are more aware of the quality of life that they would like to enjoy. Citizens of this global village perceive that in order for them to live a plentiful life, the commodities that they use must meet high standards. Hence, the quality factor deserves to be acknowledged and should be examined carefully in order to understand the level of satisfaction for customers. Price and quality are closely related and seem inseparable. The determination of how much quality should be presented according to the constant price level will vary across every consumer due to the fact that everyone’s perception is different. Mostly, this is still very subjective so that there should not be a specific number but within a reasonable range. For example, we cannot conclude that the price of a T-shirt is exactly four hundred NT dollars, but to give it a range between three hundred to six hundred NT dollars seem acceptable. When the demand increases, the pressure of increasing quality rises (Nagurney et al., 2014), leading to a higher quality within the 22 .
(30) . products. From this, we can see that the retailers are afraid that their customers will change their consumption to another brand. To mitigate the effect, the best solution is to increase the quality and try to maintain consumers or even attract other groups of buyers. There are a lot of necessities for us to survive or appreciate our life. Water and oxygen are the most basic elements in our daily lives. Products like clothes and jeans are required in order to keep us warm. But as technology improves, some people would consider having a computer is a necessity. The need to own a computer has already penetrated into our brain, making us feel that we cannot live without a laptop. Subjects tend to convey their desire to own a product when they make first contact to the actual good (Chang et al., 2006). Some commodities are considered a prerequisite for some people whereas others may not think so. As a result, this is another subjective matter because of the distinct level of ambition between humans. In this study, subjects might require tools in order for them to play the sport. In other cases, the aspiration level could conquer the value of need and purchase the product even though it is not considered a prerequisite. The last factor that falls into the functional value is the usage variable. In this segment, the essential concept is the actual process of implementing the procedure. While using the product, are users satisfied with the content or is it convenient enough for them to operate are the two main questions that they will face. User-friendly is considered one of the most important factors today, because it would make the procedure more smoothly. In other words, convenience and the ease of accessibility will definitely increase our repurchase intention. If end users do not need to spend much time to go over the instruction book and can adapt to it easily, they will perceive positive feelings towards the product (Karahana, 1999). Therefore, the current study attempts to reveal whether functional value affects satisfaction and proposes the forth 23 .
(31) . hypothesis as follow. H4: Functional value significantly influences satisfaction However, aside from the above mentioned theories and concepts, the role that information visibility plays to the effect on repurchase willingness has not been addressed. A quick survey of literature indicated that few researches have incorporated information visibility into the model to alternatively describe repurchasing intention. Information visibility is basically the concept that whether enough information can be seen or is provided on a specific platform. When it can be easily seen, we would find it more applicable because we can notice the message right away. If one cannot immediately access to the information provided, the value that conveys will be decreased (Handfield, 2003). Therefore, information visibility is an essential part of the whole process. It is also an important role in the supply chain. Joshi (2000) reported that information visibility likely increased the efficiency level, and in consequence enhanced the possibility of transaction. In the supply chain, each sector has to complete their task in order to let the whole process function well. If one part has a delay or did not work properly, there will be some negative effects towards the outcome. Therefore, it is very paramount to carefully examine each and every region of the chain so that the damage can be limited to the least amount. Just like the teamwork in sports, if one player is dominating but cannot gain help from any other team members, he will still be struggling and will have a hard time competing, not to mention to gain a victory for his team. Information visibility has not been proved that it can help companies achieve benefits as a concrete example, but it does show some positive effects towards marketing. Lee et al (2013) reveals that there are two main components concerning the success of information visibility. The collaborative behavior between firms and 24 .
(32) . the supply chain partners has to be positive and both parties should have trust in one another. If one of them falls into the prisoner’s dilemma, or lost faith in their counterparts, the possibility of succeeding will be reduced dramatically. The opportunistic behavior is also vital due to the fact that firms want to retain information asymmetry and manage the behaviors of supply chain partners (Lee et al., 2013). If the firm has no idea or feels confused about what their supply chain partners are up to, the relationship will be more difficult to maintain. Also, in the resource dependence theory adopted by Lee et al. (2013) proved that visibility can actually improve the performance of supply chains. The overall performance of the chain can be traced back to each individual sector taking full responsibility of their own job and completing the mission for the greater success. But the management and the ability to connect each other remains the main task for supervisors. Thus, tracking and keeping records are key components and should be handled properly. The aim of visibility is to foster planning and controlling the operations (Musa et al., 2014). If this does help the management sector within a company, it can be extended to the service sector and ultimately improve sales and have a big impact on the market. In the past, not a lot of research has been done using information visibility as the main investigator, leading to higher degree of motivation towards this study. As a result, we can determine whether this specific variable has a big impact on online repurchasing behavior. Due to the fact that it is such a new mindset, this concept is still in an immature stage with limited resources across the field. This research would face some obstacles as not a lot has been mentioned by scholars. But on the other hand, this is a great opportunity as well because there will be more research conducted later on. The market would always be in a trade-off, so in the case of more reliant information, the space for development would be limited. As for this case, 25 .
(33) . although nothing much has been done in the past, there is a chance that this study can spark other scholars and development more about information visibility in the near future. In chapter three, the model is described to examine whether information visibility can increase the effects of the independent variables towards the dependent variable. In other words, we are to investigate whether information visibility performs as a mediator or not in the developed model. Therefore, the fifth, sixth, and seventh hypothesis are defined as follow. H5: Information visibility mediates the effect of internal value on satisfaction H6: Information visibility mediates the effect of external value on satisfaction H7: Information visibility mediates the effect of functional value on satisfaction. 26 .
(34) . Chapter Three: Research Method 3.1 Research Framework and Hypotheses The overall research model is illustrated in Figure 3.1. It is divided into three layers, with internal value, external value and functional value being the independent variables in the first layer. The second layer consists of two variables including the information visibility and satisfaction. The satisfaction plays two roles; one is a dependent variable grouped with the independent variable of internal, external, and functional value and another is independent variable grouped with the dependent variable of repurchase intention. A salient consideration is that information visibility is used as a mediator that could influence the effect of independent variable (e.g., internal value) on dependent variable (satisfaction). After conducting hypotheses through the first two layers, the model will lead us to the ultimate goal, which is the repurchase intention in the final layer. Internal value ‐ Emotional value ‐ Epistemic value H5 H2. External value ‐ Social value ‐ Conditional value Functional value ‐ Price ‐ Quality ‐ Need ‐ Usage. H3 H6. Satisfaction. H4. H7. Information Visibility. Figure3- 1: Research Framework 27 . H1. Repurchase Intention.
(35) . H1: Satisfaction significantly influences repurchase intention on online sports products. H2: Internal value significantly influences satisfaction. H2a: Emotional value significantly influences satisfaction. H2b: Epistemic value significantly influences satisfaction. H3: External value significantly influences satisfaction. H3a: Social value significantly influences satisfaction. H3b: Conditional value significantly influences satisfaction. H4: Functional value significantly influences satisfaction. H4a: Product price significantly influences satisfaction. H4b: Product quality value significantly influences satisfaction. H4c: Product needs significantly influence satisfaction. H4d: Product usage significantly influences satisfaction. H5: Information visibility mediates the effect of internal value on satisfaction. H5a: Information visibility mediates the effect of emotional value on satisfaction. H5b: Information visibility mediates the effect of epistemic value on satisfaction. H6: Information visibility mediates the effect of external value on satisfaction. H6a: Information visibility mediates the effect of social value on satisfaction. H6b: Information visibility mediates the effect of conditional value on satisfaction. H7: Information visibility mediates the effect of functional value on satisfaction. H7a: Information visibility mediates the effect of product price on satisfaction. H7b: Information visibility mediates the effect of product quality on satisfaction. H7c: Information visibility mediates the effect of product needs on satisfaction. 28 .
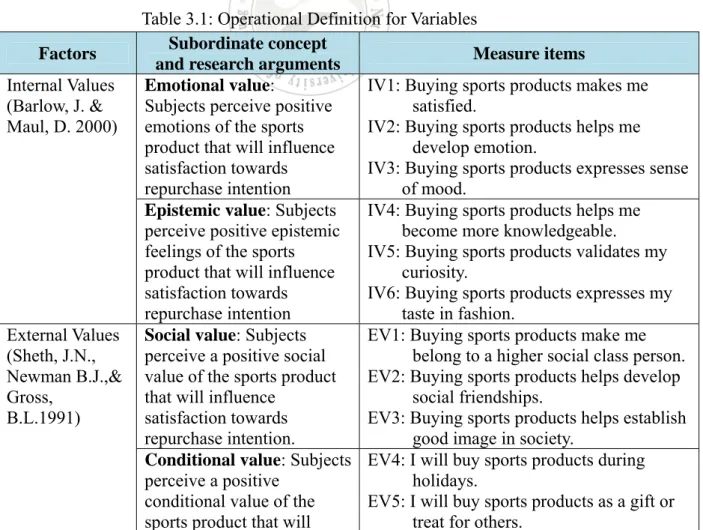
(36) . H7d: Information visibility mediates the effect of product usage on satisfaction. 3.2 Sampling Plan The main focus of this research is to investigate the purchasing behaviors of consumers buying sports products online. An important factor here is the satisfaction and the repurchase intention faucet. From our cognitive mind, we would conclude that if consumers had a higher satisfaction rate while consuming sports products, they would have a higher possibility of coming back and buying them from online again. Keep in mind that it does not assure people would repurchase for sure, it’s just that the possibility would be higher compared to those who had a lower satisfaction rate. The targets that are applied in this scenario would be a wide range of people, due to the fact that the Internet has immersed into our lives over the past couple of decades. The overall percentage of online purchasing has also been gradually increasing as it has already become a trend. Therefore, the samples that are available to conduct the questionnaire should be fairly convenient, as long as they have experience in online purchasing or have the notion of purchasing sports products. This questionnaire would also be available online where people can fill it out while surfing the Internet or using social media applications.. 3.3 Measure From the previous reviews and studies, the variables were defined and shown in Table 3.1. Aside from the internal, external and functional variables, each of them would also have some subordinates so that it makes the model more structured. For instance, the functional variable has price, quality, need and usage variables under it. The external part includes social and conditional whereas the emotional and epistemic 29 .
(37) . variables make up for the internal. The design of this questionnaire was based on a Likert seven-digit scale; where 7 represents strongly agree with the statement while 1 strongly disagrees. It is used to ask how individuals react to the purchasing behavior of online sports products in a matter of different approaches. Taking not only the psychological point of view but also in terms of the practical needs broadens this issue’s horizon. Although the questions do not seem so complex, it in fact, can guide us to obtain useful indications in order for further development in related fields of studies. The first part of the questionnaires asks the subjects’ basic information, including age, gender. The latter part of it was about the subjects’ intrinsic value towards the quoted statements regarding all the variables. If one felt that statement close to his or her perception, he would give a higher score to that specific part. On the other hand, if disagreement with the questions, he would score a lower value.. Factors Internal Values (Barlow, J. & Maul, D. 2000). External Values (Sheth, J.N., Newman B.J.,& Gross, B.L.1991). Table 3.1: Operational Definition for Variables Subordinate concept Measure items and research arguments Emotional value: IV1: Buying sports products makes me Subjects perceive positive satisfied. emotions of the sports IV2: Buying sports products helps me product that will influence develop emotion. satisfaction towards IV3: Buying sports products expresses sense repurchase intention of mood. Epistemic value: Subjects IV4: Buying sports products helps me perceive positive epistemic become more knowledgeable. feelings of the sports IV5: Buying sports products validates my product that will influence curiosity. satisfaction towards IV6: Buying sports products expresses my repurchase intention taste in fashion. Social value: Subjects EV1: Buying sports products make me perceive a positive social belong to a higher social class person. value of the sports product EV2: Buying sports products helps develop that will influence social friendships. satisfaction towards EV3: Buying sports products helps establish repurchase intention. good image in society. Conditional value: Subjects EV4: I will buy sports products during perceive a positive holidays. conditional value of the EV5: I will buy sports products as a gift or sports product that will treat for others. 30 . .
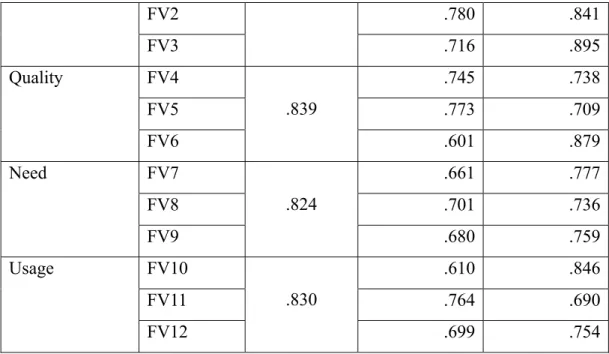
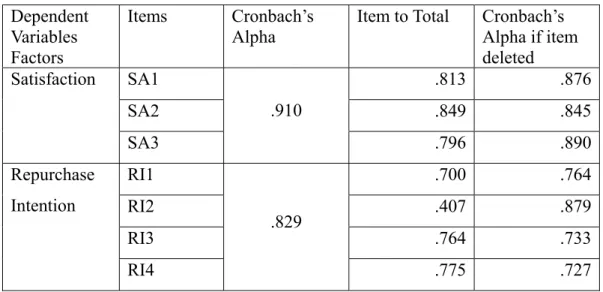
(38) . Functional values (Sheth, J.N., Newman B.J.,& Gross, B.L.1991). Satisfaction (Punj, G. 2011). Information Visibility (Joshi, Y.V. 2000). Repurchase Intention (Blery, E. 2003). influence satisfaction towards repurchase intention. Product price: Subjects perceive reasonable price of the sports product that will influence satisfaction towards repurchase intention. Product quality: Subjects perceive reasonable quality of the sports product that will influence satisfaction towards repurchase intention. Product needs: Subjects perceive positive needs of the sports product that will influence satisfaction towards repurchase intention. Product usage: Subjects perceive a positive usage of the sports product that will influence satisfaction towards repurchase intention. Satisfaction: Subjects are satisfied with the sports product that leads to repurchase intention.. FV4: The quality of sport products I purchase is good. FV5: The texture of sport products I purchase is comfortable for me. FV6: I am qualified with the sports products I purchase. FV7: I buy the sports products because of needs. FV8: Buying sports products can be a collection. FV9: I feel I need them whenever I purchase sports products. FV10: I use my sports products in specific circumstances. FV11: I feel content while using sports products. FV12: I am satisfied with the use of sports products I purchase. SV1: I am satisfied with purchasing sport products online. SV2: I am happy with the sports products I purchase online. SV3: Overall, I am satisfied with the whole process of buying sports products online. Information visibility: IV1: The information I see online is useful Subjects perceive an when purchasing sports products acceptable information online. visibility of the sports IV2: The information visible online about product that will mediate the sports products is sufficient. effect of above mentioned IV3: The information online for the sports independent variables on products attracts my attention. satisfaction towards IV4: Overall, I see the information I expect repurchase intention. provided online for sports products. Repurchase Intention: RI1: I will buy sports products again in the Subjects perceive a positive near future. intention to repurchase RI2: I choose not to buy sports products (R). sports product. RI3: I will buy sports products again when I need them. RI4: Overall, I am surely buying sports 31 . . EV6: I will buy sports products in the conditions I think necessary and valuable. FV1: The price of sports products I purchase is reasonable. FV2: The price of sports products I purchase is worthwhile. FV3: I am satisfied with the price of products I purchase..
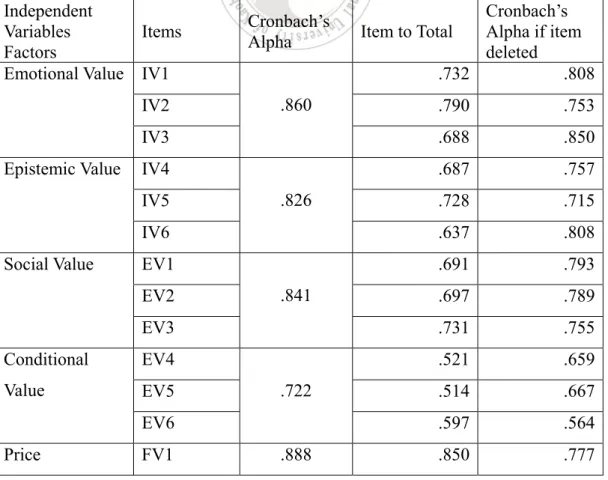
(39) . products again. 3.4 Data Analysis and Techniques To conduct the hypothesis tests and derive research findings, statistics techniques are used to analyze the collected valid data from subjects. First, data reliability is conducted to ensure that internal consistency is acceptable, based on the coefficient, Cronbach’s alpha. The Cronbach’s alpha coefficient value that above 0.8 is considered excellent, 0.8 to 0.7 is considered very good, 0.6 is good and over 0.5 is still acceptable, while value below 0.5 will be consider low reliability, which would be rejected. Second, the exploratory factor analysis is conducted to purify the components and compose the measurement scales into certain factors. Question items having similar loadings or which might lower the reliability could be removed to enhance the power of factor formation. Finally, structural equation model is established test the research hypotheses proposed in the previous Chapters. To do so, computer tool, Statistical Package for the Social Sciences (SPSS), is utilized to analyze the data. Details will be described in Chapter 4.. 32 .
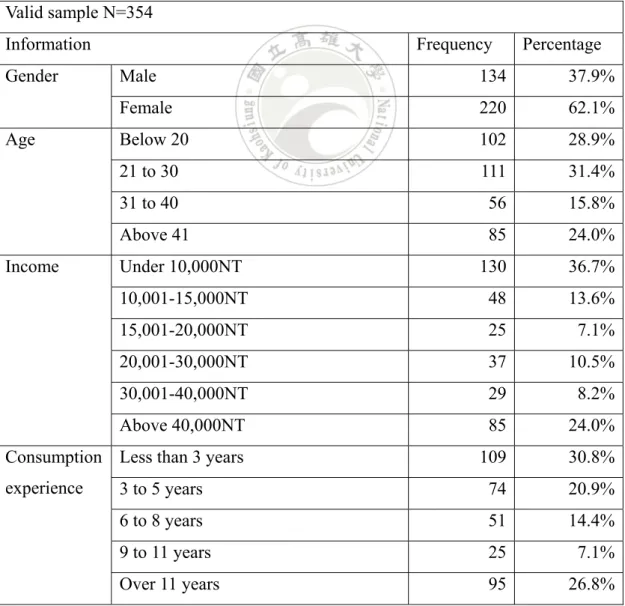
(40) . Chapter Four: Results and Discussions 4.1 Descriptive Statistics This research distributed out a total of 425 questionnaires. Of the total amount, 225 of them were collected online and 200 of them in printed form. Subtracting those who had not purchase sports products within the last year, and those responses who were outliers, the valid amount of questionnaires came to 354. This gives us a validity rate of approximately 83.3%. Table 4.1 shows the overall descriptive statistics.. Table 4.1: Overall Descriptive Statistics for the Valid Samples Valid sample N=354 Information Gender. Frequency. Percentage. Male. 134. 37.9%. Female. 220. 62.1%. Below 20. 102. 28.9%. 21 to 30. 111. 31.4%. 31 to 40. 56. 15.8%. Above 41. 85. 24.0%. Under 10,000NT. 130. 36.7%. 10,001-15,000NT. 48. 13.6%. 15,001-20,000NT. 25. 7.1%. 20,001-30,000NT. 37. 10.5%. 30,001-40,000NT. 29. 8.2%. Above 40,000NT. 85. 24.0%. Consumption Less than 3 years. 109. 30.8%. 3 to 5 years. 74. 20.9%. 6 to 8 years. 51. 14.4%. 9 to 11 years. 25. 7.1%. Over 11 years. 95. 26.8%. Age. Income. experience. 33 .
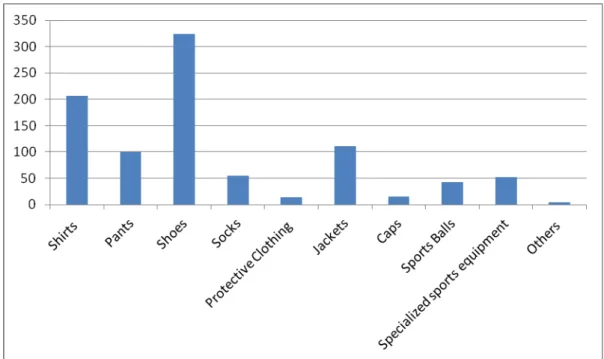
(41) . Frequency (a. Less than 3 times. 191. 54.0%. year). 3 to 5 times. 123. 34.7%. 6 to 8 times. 29. 8.2%. 9 to 11 times. 4. 1.1%. Over 11 times. 7. 2.0%. Below 1000NT. 39. 11.0%. 1001 to 2000NT. 103. 29.1%. 2001 to 3000NT. 114. 32.2%. 3001 to 4000NT. 48. 13.6%. More than 4000NT. 50. 14.1%. Money spent. Brand. Nike. 263. 41.7%. (choice of 2). Adidas. 179. 28.4%. New Balance. 70. 11.1%. Puma. 30. 4.8%. Converse. 52. 8.3%. Reebok. 8. 1.3%. Under Armor. 7. 1.1%. Others. 21. 3.3%. Accessories. Shirts. 207. 22.4%. (choice of 3). Pants. 100. 10.8%. Shoes. 324. 35.1%. Socks. 55. 6%. Protective clothing. 14. 1.5%. 111. 12%. Caps. 15. 1.6%. Sports balls. 42. 4.5%. Specialized sports equipment. 52. 5.6%. 4. 0.4%. Jackets. Others .. The respondents were mostly female, contributing to over 60% of the total sample. As for the age range, it is spread out quite equally for people within the 21 to 30 age range representing the most proportion, 31.4%. This shows that the sports 34 .
(42) . product that everyone consumes does not really have an age restriction. People of all ages still continue to buy sports products for them to engage in games or to exercise. The income showed two dominant groups, below 10,000NT and over 40,000NT. Due to the fact that some subjects fall into the under 20 or 21 to 30 age group, their income is not very stable yet. For those who are over the age of 40, their income would then have a higher chance of earning over 40,000NT. The consumption experience was also evenly spread out with the exception of the 9 to 11 years range. This implies that people do have a tendency to buy sports products and that they have continued to purchase them throughout their daily lives. Within the past year, respondents replies that they did not buy sports products over three times, showing over half of the total amount, 54.0%. The second largest population was the 3 to 5 times range. From this, we can conclude that people do not go to buy sports products that often within one year due to the fact that the turnover ratio of are not very high. Money spent on sports products fall into the 1001 to 2000NT and the 2001 to 3000 NT category, accounting for 61.3%. Technically, some famous brands are more expensive than others, as we can see that people are willing to spend such money on these products. For the brand preference, subjects can choose a maximum amount of two brands that they like the most. Nike showed the dominant brand choice for consumers as it has already developed a deep popularity among us. Adidas also had a high rate, earning 28.4% which came only behind Nike. New Balance and Converse added up to 19.4% due to the Taiwanese female’s taste in these brands’ shoes. A graph of brand preference is shown in figure 4-1 based on the numbers.. 35 .
(43) . Figure4-1: Brand Preference for the Respondents. From figure 4-1, Nike had a high response with over 250 people choosing it as their favorite brand. Adidas can compete with Nike, with over 150 votes, standing in at the number two spot. Puma, Reebok and Under Armor does not show a high rate for we can tell that the popularity is not that high in Taiwan. Subjects had the privilege to choose up to three accessories that they enjoy purchasing the most. Shoes were the dominant category, accounting for 35.1% followed by shirts, which had 22.4%. Pants and Jackets were not far behind as both of them also showed over 10%. One thing to notify here is that protective clothing, sports balls and specialized sports equipment added up to only around 11.6%. This implies that Taiwanese people purchase sports products is mostly for the purpose of wearing or style instead of playing professional sports. Figure 4-2 has the overall numbers for consumers’ choice of accessories for sports products.. 36 .
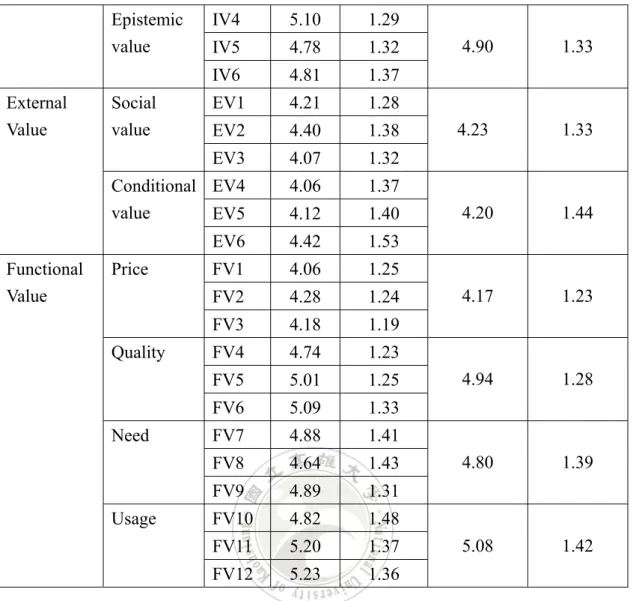
(44) . Figure4-2: Accessories Preference for the Respondents. Shoes earned over 300 votes followed by shirts with over 200. The next group falls into pants and jackets as they both had over 100 responses. Protective clothing, caps and sports balls did not have at least 50 replies, making them the last in this section. The emotional value showed the highest mean of 5.35 of all the independent variables as shown in Table 4.2. This indicates that people agree very much to the statements when concerning buying sports products will make them happy. The second highest was the usage item under the functional value with an average of 5.08. As for the low ones, the price was 4.17 and the conditional value was 4.20.. Table 4.2: Mean and Standard Deviation for Independent Variables. Independent Factors Variables Internal Value. Emotional value. Items. Mean. IV 1. 5.35. IV 2. 5.15. IV 3. 5.39. 37 . Component Standard Component Standard Deviation Average Deviation 1.18 5.30 1.21 1.18 1.25.
(45) . Epistemic value External Value. Functional Value. IV4. 5.10. 1.29. IV5. 4.78. 1.32. IV6. 4.81. 1.37. EV1. 4.21. 1.28. EV2. 4.40. 1.38. EV3. 4.07. 1.32. Conditional EV4 value EV5. 4.06. 1.37. 4.12. 1.40. EV6. 4.42. 1.53. FV1. 4.06. 1.25. FV2. 4.28. 1.24. FV3. 4.18. 1.19. FV4. 4.74. 1.23. FV5. 5.01. 1.25. FV6. 5.09. 1.33. FV7. 4.88. 1.41. FV8. 4.64. 1.43. FV9. 4.89. 1.31. FV10. 4.82. 1.48. FV11. 5.20. 1.37. FV12. 5.23. 1.36. Social value. Price. Quality. Need. Usage. 4.90. 1.33. 4.23. 1.33. 4.20. 1.44. 4.17. 1.23. 4.94. 1.28. 4.80. 1.39. 5.08. 1.42. The satisfaction and repurchase intention for dependent variables in table 4.3 showed high means of 4.94 and 5.68. This implies that customers are willing to come back and purchase products that make them satisfied. Table 4.3: Mean and Standard Deviation for Dependent Variables. Variables. Factors. Dependent Satisfaction Variable Repurchase Intention. Items. Mean. SA1. 4.90. SA2. 4.93. SA3. 4,98. 1.36. RI1. 5.41. 1.30. RI2. 5.76. 1.04. RI3. 5.73. 1.24. RI4. 5.83. 1.27. 38 . Component Standard Component Standard Deviation Average Deviation 1.33 4.94 1.35 1.36. 5.68. 1.23.
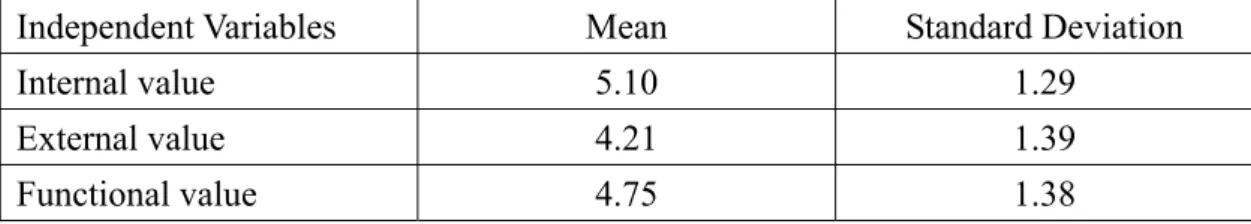
(46) . The mediation effect of information visibility in Table 4.4 showed an average of 4.66 with a standard deviation of 1.36. Table 4.4: Mean and Standard Deviation for Mediator. Variables. Factors. Items. Mean. Standard Component Deviation Average. Mediator. Information INV1 Visibility INV2. 4.68. 1.38. 4.72. 1.41. INV3. 4.80. 1.33. INV4. 4.45. 1.31. Component Standard Deviation. 4.66. 1.36. Looking it from a broader view, we can combine emotional and epistemic into internal value, social and conditional into the external value. Also, putting price, quantity, need and usage together would become the functional value. Table 4.3 has the average and standard deviation for all three categories.. Table 4.5: Mean and Standard Deviation for the Combined Independent Variables. Independent Variables. Mean. Standard Deviation. Internal value. 5.10. 1.29. External value. 4.21. 1.39. Functional value. 4.75. 1.38. The highest mean was the internal value, with an average of 5.10 while the lowest was external value, only 4.21. For the component mean scores in Table 4.2 to Table 4.5, seven levels of Likert scale were adopted for the questionnaire in this research. 1 representing totally disagrees, 4 representing moderate and 7 indicating totally agree. The higher the score is means the higher of the perceived agreement.. 39 .
數據
+7
相關文件
The contents of this essay are to demonstrate that one can get the ultimate achievements by Separate-teaching also, to clarify the value of Separate-teaching and
From the doctrinal structure of this `sastra`, it has been found that this work has only amended some errors committed in the `Abhidharma-ynana-
減:本年度提列折舊數 本年度期末帳面價值 本年度提列折舊數 醫療成本 管理及總務費用 上年度期末帳面價值
2011年按落成用途之公共及私人工程數目與價值 NÚMERO E VALOR DOS PROJECTOS DE CONSTRUÇÃO PÚBLICA E PRIVADA, POR FINALIDADE EM 2011 NUMBER AND VALUE OF PUBLIC CONSTRUCTION
價值觀/態度:責任 感、自律、尊重 技能/能力:
培養創意 發展音樂 培養評賞音樂 認識音樂 及想像力 技能與過程 的能力 的情境. 價值觀 與 態度
Philosophiæ Naturalis Principia Mathematica Mathematical Principles of Natural Philosophy.
培養創意 發展音樂 培養評賞音樂 認識音樂 及想像力 技能與過程 的能力 的情境. 價值觀 與
