內在價值,外在價值及功能價值對滿意度及再購物意願之影響—綠色資訊可見度之中介影響
79
0
0
全文
(2) National University of Kaohsiung Approval for Final Examination/Defense of Master's Thesis This is to certifY that:. Effects of functional value,internal value,and external value on purchasing satisfaction tovvards online repurchasing intention:mediation of green inforrnation vislbilitv.. by Lim Jia Hon貫. M1023510. a candidate for the lnternational MBA degree.. . /. ′ ′じ. プ 鬱. I. ′. プリ ι. Committee Names and Signatures. Sigrlature of Program Direetsr:. (mOnth). (day).
(3) Effects of Functional Value, Internal Value, and External Value towards Online Repurchasing Intention: Mediation Effect of Green Information Visibility. Advisor: Dr. Chien-Hsing Wu Department of Information Management National University of Kaohsiung. Student: Jia-Hong Lim International Business of Administration National University of Kaohsiung. ABSTRACT. Since the online trading systems have been invented, people have another way to buy good or service instead of walking into a store. This systems also expand the local market to the global market, so that, more and more people are willing to purchase online. To understand the consumer behavior, there are numerous of literatures which discuss about consumer online repurchase intention, but they pay little attention on the consumption theory with consumer electronic product. So this research sets up the model based on the consumption value that includes internal, external, and functional value to effect consumer’s buying satisfaction towards online repurchasing intention. In addition, green information visibility as a mediator to influence the independent variables and consumer purchasing satisfaction. Through the process of collected 308 valid samples and analyzing them for results, some findings can be addressed. (1) Among those three values, internal and functional value highly influence their satisfaction except external value. (2) Functional value is the only variable that is affected by the mediator while internal and external are not affected. (3) For sub-factors, quality and usability strongly support consumer’s satisfaction while price and attitude partially support their satisfaction except the others. (4) Attitude, price and quality value has mediating effect except the others. Discussion and implications will also be implied. Keywords: consumption value, green information visibility, consumer electronic products,. online repurchase intention. ii.
(4) 內在價值,外在價值及功能價值對滿意度及再購物意願之影響— 綠色資訊可見度之中介影響 指導教授: 吳建興 博士 資訊管理學系 國立高雄大學. 指導學生: 林家弘 國際商業管理碩士學位學程 國立高雄大學. 摘要. 自從線上交易平台的發明,人們便有了另一種方式購買商品或服務,並不是只 能到實體店面購買。再者,透過這套平台可以從原本區域市場開擴至國外市場,因而 促使越來越多人願意線上購物。為了了解消費者的行為,過去已有不少的文獻對消費 者線上再購意向做了相關討論,但它們並不那麼關注於消費者行為理論與消費性電子 產品的關係。故此篇研究將以消費價值為基礎設計研究模型,當中包括內在價值,外 在價值與功能價值對消費者購買滿意度進而導致線上再購意向之探討。透過採集 308 份有效樣本以及分析它們而得到結果之程序,有些發現可以在此說明。(1) 除了外在 價值及其三個子價值之外, 內在價值與功能價值與滿意度之間有顯著的正向關聯。 (2) 功能價值是唯一被中介影響的變數,而內在價值與外在價值並不受影響。(3) 對於子 因子而言,除了其他因子,品質與適用性高度支持消費者的滿意度,與此同時價格與 態度則部分支持他們的滿意度。(4) 除了其他因子,態度,價格與品質價值都有受到 中介影響。此外,管理相關的討論與意涵也會說明。. 關鍵詞:消費者價值理論,綠色資訊能見度,消費性電子產品,線上再購 意願 iii.
(5) Table of Contents List of Tables ........................................................................................................................................... ii List of Figures ........................................................................................................................................ iii 1.. Chapter One: Introduction .............................................................................................................. 1 1.1. Background ............................................................................................................................ 1. 1.2. Motivation and Objective ...................................................................................................... 3. 1.3. Research Produce .................................................................................................................. 4. 1.4. Thesis Overview ..................................................................................................................... 6. Chapter 2: Literature Review .................................................................................................................. 7 2.1. Internet Commerce ............................................................................................................... 7. 2.2. Expectation-Confirmation Theory ....................................................................................... 16. 2.3. Consumption Value Theory ................................................................................................. 18. 2.4 Green Information Visibility....................................................................................................... 24 Chapter 3: Research Method ................................................................................................................. 26 3.1 Research Model .......................................................................................................................... 26 3.2 Sampling Plan Target .................................................................................................................. 28 3.3 Measure ....................................................................................................................................... 28 3.4 Data Analysis Techniques........................................................................................................... 32 Chapter Four: Results and Discussion .................................................................................................. 33 4.1 Description Statistics .................................................................................................................. 33 4.2 Reliability.................................................................................................................................... 39 4.3 Factor Analysis ........................................................................................................................... 41 4.5 Discussion and Implications ....................................................................................................... 48 Chapter Five: Conclusion ..................................................................................................................... 54 5.1 Research Findings ....................................................................................................................... 54 5.2 Research Suggestions.................................................................................................................. 55 5.3 Future Studies ............................................................................................................................. 56 References:............................................................................................................................................ 57 Appendix A: Research Questionnaire (English Version) ..................................................................... 64 Appendix B: Research Questionnaire (Chinese Version) ..................................................................... 69. i.
(6) List of Tables. Table1.1: Percentage of respondents who have made at least one online purchase in the past three months in Asia/Pacific:...................................................................................... 1 Table1.2: Research related during past few yeas ............................................................... 3 Table 3.1: Operational definition ..................................................................................... 29 Table 4.1: Overall Descriptive Statistics for the Valid Samples ..................................... 33 Table 4.2: Mean and Standard Deviation for Independent Variables .............................. 37 Table 4.3: Mean and Standard Deviation for Dependent Variables ................................ 38 Table 4.4: Mean and Standard Deviation for Mediator ................................................... 38 Table 4.5: Mean and Standard Deviation for Combined Independent Variables ............ 39 Table 4.6: Cronbach's Alpha for Independent Variables ................................................. 39 Table 4.7: Cronbach's Alpha for Dependent Variables ................................................... 41 Table 4.8: Cronbach's Alpha for Mediator Variables ...................................................... 41 Table 4.9: Factor Analysis Results for Independent Variables........................................ 43 Table 4.10: Factor Analysis for the Dependent Variables ............................................... 44 Table 4.11: Test Results for H1 ....................................................................................... 44 Table 4.12: Test Results for H2, H3 and H4.................................................................... 45 Table 4.13: Test Results for Green Information Visibility towards Satisfaction ............ 45 Table 4.14: Tests Results for Internal, External and Functional value towards Green Information Visibility ...................................................................................................... 45 Table 4.15: Test Results for H5, H6 and H7.................................................................... 46 Table 4.16: Test Results for H2a, H2b, H3a, H3b, H3c, H4a, H4b and H4d .................. 47 Table 4.17: Results for H5a, H5b, H6a, H6b, H6c, H7a, H7b and H7d .......................... 48. ii.
(7) List of Figures Figure 1-1: Research Process ............................................................................................. 5 Figure 2-1: Global Users of TVs vs. Mobile Phones vs Smartphones vs. PCs vs. Tablets, 2013.................................................................................................................................... 8 Figure 2-3: Q2 2014 Y/Y retail spending growth by channel ........................................... 9 Figure 2-4: The most common types of product purchased online, 2014 ....................... 10 Figure 2-5: Top 10 Consumer Electronics Products in the U.S. 2013 ............................. 11 Figure 2-6: Revenue growth in technology devices ........................................................ 12 Figure 2-7: Spending on technology devices by region................................................... 12 Figure 2-8: Global Land and Ocean Temperature Anomalies ......................................... 15 Figure 2-9: Expectation-Confirmation Theory Model .................................................... 16 Figure 3-1: Research Model............................................................................................. 26 Figure 4-1: Brand preference for the respondents ........................................................... 36 Figure 4-2: Accessories preference for the respondents .................................................. 36. iii.
(8) Chapter One: Introduction. 1.1 Background. Past purchase or taking order for goods are generally by making phone call or walk into a store. However, the innovation of internet transfers the method of making a trade into online visual store. This innovation gives us a lot of benefit, no matter at consumer or supplier side. The buying behavior tends to shop on visual store and has become more and more. According to the 2014 Online Shopping Behavior Study conducted by MasterCard, a technology company in global payment, across 25 markets between November and December 2013. The report for the Asia/ Pacific region included interviews with 7010 respondents from 14 markets who were asked questions about their online shopping habits. Accepting the interviewees were all connected online with laptops or smartphones, the survey results thus reflect the behavior of connected consumers – rather than percentages of the population as a whole. Which is how China topped the rankings of Asian online shopping, with a stunning 98.6 per cent reporting they had purchased at least one item online within the preceding 90 days. In second place was Korea, with 96.8 per cent. Taiwan (94.6 per cent), India (94 per cent) and Singapore (91.5 per cent) followed. The result show in table 1.1(Wong 2014, Master Card). High technology and high speed of internet are the reason which change buying behaviors, although some security and privacy problems occur, which is hardly to be solves successfully.. Table1.1: Percentage of respondents who have made at least one online purchase in the. past three months in Asia/Pacific:. Market. %. 1. China. 98.6. 6 Australia. 88.4. 2. Korea. 96.8. 7 Japan. 86.2. 3. Taiwan. 94.6. 8 Malaysia. 84.4. 4. India. 94.0. 9 Hong Kong. 84.0. 5. Singapore. 91.5. 10 Indonesia. 83.4. Market. 1. %.
(9) And also, the Nielsen Global Survey of E-commerce was conducted between Feb. 17 and March 7, 2014, the top five online purchasing categories for Taiwan consumers are. clothing/accessories/shoes. (45%),. tours/hotel. reservations. (42%),. airline. ticket/reservations (38%), event tickets (movie, performance/exhibition/game, etc., 36%) and groceries (food and beverages, 32%).Consumers everywhere want a good product at a good price, and the seemingly limitless options available in a virtual environment provide new opportunities for both merchants and consumers. Taiwan consumers appear to know how to leverage physical and virtual channels for their best interests—more than two-thirds (68%) “Often look at products online before purchasing them in the store” and more than half (52%) “Often check out products in the store before purchasing them online.” Online transaction not only increases the number of trading, but also provides a convenient platform to make a trade between host country and client countries. The online platform is friendly to use and also provides information and picture of the product that let us have multiple choices on the product types and suppliers. However, online marketers have paid increasing attention to the factors that may be used to describe repurchase satisfaction towards repurchase intention. Hence, a research question may be raised that the research thesis focuses on online repurchase intention of electronic product which will affect by some variables based on consumption value. And also, there are some literature list in Table 1.2 which are related to this topic in past few year. For example, Koo & Ju (2010) tested the effect of atmospheric cues of online stores on the intervening affective emotional states of consumers, which has a subsequent impact on behavioral intention. Tsai el at. (2011) indicate that whether a more prominent display of privacy information will cause consumers to incorporate privacy considerations into their online purchasing decisions; William el at. (2010) present a comprehensive review of recent empirical studies dealing with online consumer behavior and decision-making processes. These studies discuss about the effect of external value, internal value and privacy information on online purchasing behavior. Instead of consumption value of consumers influence their satisfaction and online repurchase intention with green information visibility has not been discussed. Although privacy information is one of the considerable factors of online purchasing, it is not included in this study. The influence of information visibility of consumer 2.
(10) electronic products is examined in the research thesis. The reason is that a study shows that over half (53%) the respondents in this study said they have had the experience of going to the store to buy an electronics products, but could not decide what to buy. The most common reason cited (30%) for this was not having the information they needed (online prices, reviews, specs, etc.) followed by feeling overwhelmed by the number of choices. Many also felt that the salesperson was of little help (Andrew Eisne 2011). Most of the digital device was possessed on many different kind of functions which are difficultly explained in a few minutes at the retail store as reference. Moreover, a general resemblance with minor differences product hardly compare and judge its value. Table1.2: Research related during past few yeas. Author Cranor & Tsai (2011). Koo & Ju (2010). William el at. (2010) Narges el at.(2010). Topic The effect of online privacy information on purchasing behavior: An experimental study The interactional effects of atmospherics and perceptual curiosity on emotions and online shopping intention Toward an integrated framework for online consumer behavior and decision making process: A review Students’ online shopping behavior: An empirical study. 1.2 Motivation and Objective. To let purchasing life become more super connected and easier, consumer electronics exhibitions were held around the world to present new high tech devices and expensive toys. They are an electronic manifestation of ideals that drive our society: bigger, better and faster. Although these high-end electronics represent modern engineering and sophisticated design solutions, novelty was quickly faded. Most of the supplier will provide online purchasing service for those devices, in order to increase the speed of sales process. To know why consumer will choose to purchase consumer electronic product online is one of the motivation of this study. It is because they may carry some risks and exchange their benefit during the process. The consumption value may be used to test the consumer behavior.. 3.
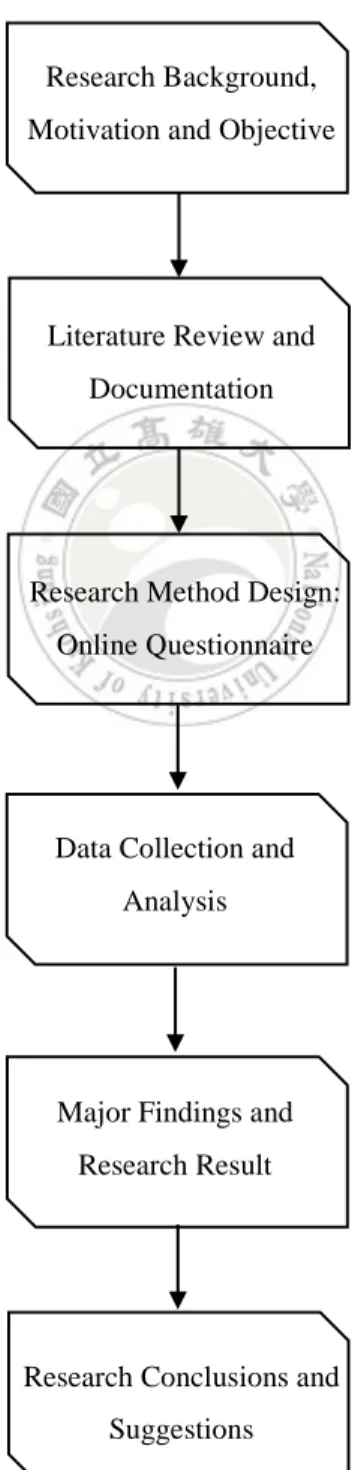
(11) Furthermore, searching and examining the information which explains the feature, functional and manipulation of particular product is one of the key factors that influence consumer purchasing behavior. In this study, the green information visibility is used as a mediator which affects the consumers to repurchase electronic products. In fact, when choosing between two similar products, according to a survey from DoubleClick Performics, 83 percent of consumers are extremely or very likely to choose the environmentally friendly option, that gauges online consumer behavior and attitudes regarding green marketing. This implies that consumer will be willing to purchase product with green information. Everyone would like to be a smart consumer rather than a compulsive or susceptible consumer. To keep thinking the impact or benefit of the product is what we usually do before making a decision. Therefore, consumers should consider many variables, such as culture, social, usability, etc. From the perspective of psychology of consumers, exploring what they care mostly will be likely benefit to the marketing strategies because focusing on what they can be touched will greatly contribute to satisfaction level towards purchasing products again and again. Moreover, consumers are paying increasing attention to the concepts of environment protection. In consequence, products along with green information are being highlighted, in particular the online goods. The research thesis is motivated by two issues and reaches two main objectives as follows. 1. To propose and empirically examine a research model that incorporates both consumption value and expectation and confirmation theory to describe repurchase satisfaction towards repurchase intention in the context of online consumer electronic products. 2. To examine the mediation effect of green information visibility on the relationship between consumption value and repurchase satisfaction.. 1.3 Research Produce. The research process is presented in Figure 1.1, of which the main idea of this research is the perception of internal, external and function value of consumer that will satisfy or not satisfy the specific products after experienced the online purchasing towards the intention of repurchase. The mediator, green information visibility, is regarded as having influencing power that alternates the effect of consumption value on repurchase 4.
(12) satisfaction. It is also examined in the research thesis. The study starts from a review of related literature including online commerce, purchasing behavior, consumption value, and expectation and confirmation, followed by the hypotheses development. The research method is then described that contains research model derived from the developed hypotheses, sampling plan, measure, and data analysis techniques used to derived research findings. The final step is the discussion, implication, conclusions and suggestion of this study.. Research Background, Motivation and Objective. Literature Review and Documentation. Research Method Design: Online Questionnaire. Data Collection and Analysis. Major Findings and Research Result. Research Conclusions and Suggestions. Figure 1-1: Research Process 5.
(13) 1.4 Thesis Overview. The research thesis is divided into five chapters. Each chapter is briefly described as follows. Chapter 1: Introduction. This chapter is mainly about the background of this research that derives to motivation and objective of it. It also contains the related research process and thesis overview is included. Chapter 2: Literature Review. It deals with not only giving more details about the topic and also finding out the related journals and article as references to explain each of the variable which are summarized in this chapter. These explanations is utilized in the Chapter three. Chapter 3: Research Method. This chapter includes the research methodology which defines the sampling plan and research model. The method also develops the questionnaire and collects data to test hypothesis which is presented in the model. The data techniques used to test reliability and validity are included in this chapter. Chapter 4: Results and Discussion. This chapter is to present data analysis results from the data collected which is conducted by computer software. Chapter 5: Conclusion. This chapter summarizes the research thesis and discuss the overall study. Research suggestions and limitations are addressed. Future research focuses are also presented in this chapter.. 6.
(14) Chapter 2: Literature Review. 2.1 Internet Commerce. Since the communication channels has long shifted to Internet, the online system creates a lot of commercial activities through the Internet, such as online trading, relationships development, communication, entertainment, etc. Although the usage of Internet is increasingly popular in commerce, factors that are significantly linked to online trading systems or commercial platform are not as safe, effective and efficient as expected. The invention of smartphone lead to another generation in online trading and mobile commerce becomes a new trend. Mobile commerce means the delivery of electronic commerce capabilities directly into the consumer’s hand, anywhere, via wireless technology (Duffey, 1997). Using mobile or tablet devices to purchase a products via mobile shopping apps or mobile-optimized websites is a hot topic and also a most convenient way to create a transaction between consumer and suppliers nowadays. After consumer was confirmed to purchase a good at merchant website, his or her order information is encrypted while being transferred over the Internet. When it is done, the online store transmits the formatted order from the web host to the payment and a request for the card for validation is inquired. Before shipping and receiving, the payment gateway transfers the payment to the merchant’s bank account. In 1997, the first mobile commerce service was introduced with the first two mobile phone which enabled coca cola vending machines were set up in the Helsinki area in Finland. The payment was accepted via SMS (Short Message Service) text messages to banking service provided by Merita Bank of Finland. The founder of mobile commerce server is Kevin Duffey. Later, a lot of national commercial platforms for mobile commerce were launched, such as Smart Money in the Philippines, NTT DoCoMo’s iMode Internet service and mobile purchase of airline tickets in Japan, mobile parking payments in Norway, train ticketing via mobile device in Austria, etc. These platforms offer people to change their way of using mobile phone from contacting others to the utilization of transaction. In order to take advantages of the potential mobile commerce market, smartphones and iPhone was launched and lead mobile commerce moved away from SMS systems and into practical applications. Meanwhile, the adding fax, email, and phone capabilities of 7.
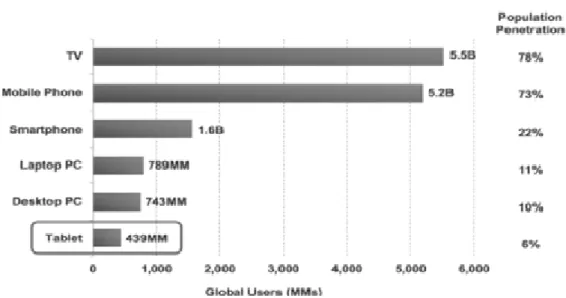
(15) smartphone can solve the security vulnerabilities and overcrowding problems. The advanced technology of smartphone function has increased the usability of mobile commerce system which lead to the brick and mortar business owners. For example, the BigBox retailers have made an effort to take benefits from the utilization of a number of mobile capabilities such as location-based services, barcode scanning and push notifications can improve the customer experience of shopping in physical stores towards repurchase intention (Chitrangda 2014). Moreover, they also allow customers to access the common benefits of shopping online such as product reviews, information, or coupons. Until recently, there was a report from Mary Meeker who expertly study the annual Internet usage trend (Meeker 2014). This report was provided in May 2014. It shows some results that are related to the current research thesis. First, the global users of mobile have reached to 5.2 billion as much as 5.5 billion of TV’s users while the population penetration is 73% and 78%.(Figure 2-1). Second, overall, there is 25% of page views come from mobile device instead of May 2013 was only 14% which increase 79% (Figure 2-2).. Figure 2-1: Global Users of TVs vs. Mobile Phones vs Smartphones vs. PCs vs. Tablets, 2013 Source: http://www.kpcb.com/internet-trends. 8.
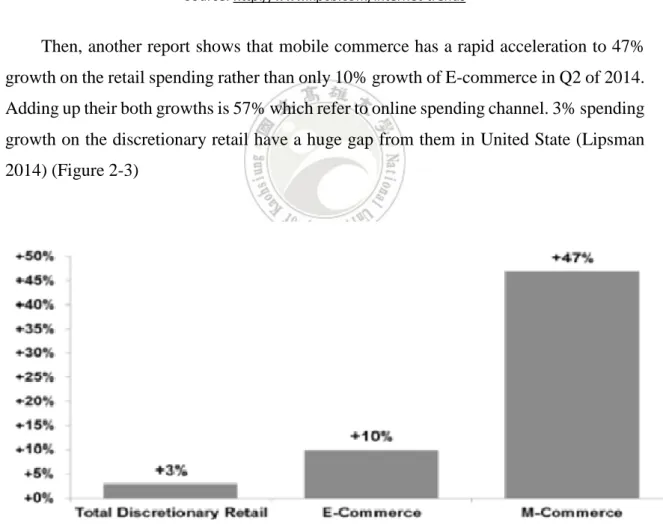
(16) Figure 2-2: Mobile Usage as % of Web Usage, by Region, 5/14/2013 Source: http://www.kpcb.com/internet-trends. Then, another report shows that mobile commerce has a rapid acceleration to 47% growth on the retail spending rather than only 10% growth of E-commerce in Q2 of 2014. Adding up their both growths is 57% which refer to online spending channel. 3% spending growth on the discretionary retail have a huge gap from them in United State (Lipsman 2014) (Figure 2-3). Figure 2-3: Q2 2014 Y/Y retail spending growth by channel Source: http://www.comscore.com/. These results show that web users of mobile device have continually rise while they will also make transaction incidentally. Mobile commerce system changes our buying 9.
(17) behavior not only at the retail store or web of computer, but also the web of mobile device for us to shop at any time which the place was provided Internet surfing. This trend can decrease the flow of trading process and increase the transaction volume and speed. The popular using of mobile commerce become an important channel for supplier to sale their products. There are many types of products available for consumers to select, such as clothes, beg, consumer electronic products, etc. In the current research thesis, I will choose consumer electronic products as my research objects to study the consumer online repurchase intention of it. In Figure 2.4, it is found that more than half (62%) of US consumers with Internet access now shop online at least once a month, and just 1% say they never shop online, according to a recent report by Walker Sands. The most common types of products bought online in the 2013 year include electronics (69% percent of consumers surveyed purchased online in 2013), books (67%), clothing (63%), household goods (38%), and office supplies (30%) (Nanji 2013).. Figure 2-4: The most common types of product purchased online, 2014, Source: http://www.marketingprofs.com/charts/2013/12195/online-shopping-trends-most-popular-categoriestop-purchase-drivers. Consumer electronic products can be named as consumers electronic goods which are electronic equipment intended for entertainment, communications, and office productivity. For example, radio receivers, television sets, DVD players, digital camera, personal computers, telephones, mobile phones and etc. are invented by those high-tech companies. To get the highly improved digital technology, they have largely merged the computer industry as consumerization of information technology. This amount of 10.
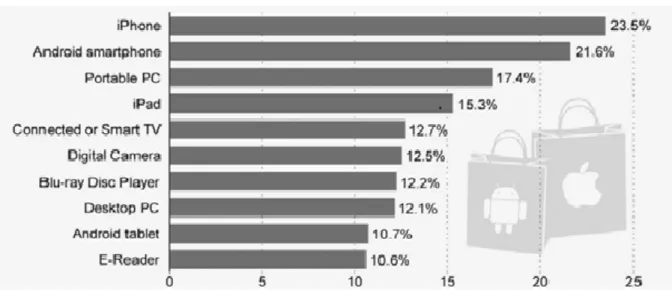
(18) products introduced makes it possible for the consumers to update their electronics every year if they so wish Thus, an indication of the consumer electronics industry should be an ideal place for impulse buying. Even though many consumer electronic products are expensive and seen as high-involvement products, there can still occur impulse buying in the industry (Brodén & Söderberg 2011). In the early 20th century, the first major electronic product was radio broadcasting which became the basis of mass production radio receiver for consumers. Later products include personal computers, audio equipment, and etc. However, the improvement of technology is too fast to let high-tech companies transfer a lot of electronic product functions into mobile phone or tablet. For example, mobile phone combines most of the functions which include FM broadcasting, taking picture, etc. into a simple software application for handiers to use and bring out without a lot of hardware device. The reason why a chart shows the percentage of U.S. consumers, who are likely to buy the following products in 2013 among the electronic product, The iPhone ranks first on Americans’ 2013 consumer technology wish list, 23.5 percent of 2,285 U.S. consumers surveyed in October 2012 by Strategy Analytics said they are somewhat or very likely to buy Apple's smartphone during the next twelve months. A smartphone with Android comes second, with 21.6 percent. This is followed by a portable PC (17.4 percent) and again an Apple product, the iPad (15.3 percent) (Mathias Brandt, 2013) (Figure 2.5).. Figure 2-5: Top 10 Consumer Electronics Products in the U.S. 2012 Source:http://www.statista.com/chart/815/top-10-consumer-electronic-products-in-the-us-2013/. 11.
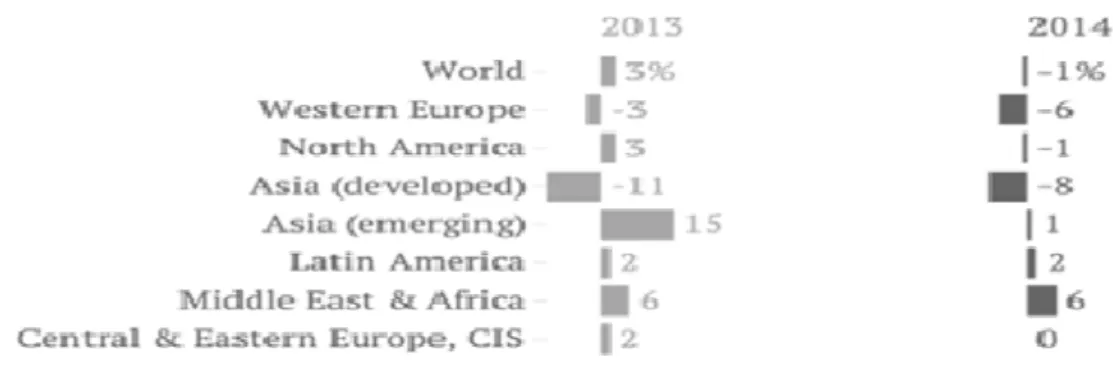
(19) Then, no much change on those digital devices lead the global revenue growth to dropping to negative 1% in 2014 January, not the positive 3% of 2013. Many software applications on mobile phone are replacing digital camera, video recorder, etc. This causes the revenue growth in electronic devices dropped from 2013 to 2014, but the spending of consumer was sustained increasing at some regions from 2011 to 2014. One of the regions is emerging Asia which includes China, India, Pakistan , Bangladesh and Indonesia, states that together contain about 3.2 billion people and gradually increase their income, meanwhile, the price of electronic product become cheaper and cheaper after their cost of process is getting low. So, there has a biggest extendable electronic device market about 105 million US dollars increase from 2010 to 2014. The factor for the rich world’s declining contribution to tech revenues is nothing new for people in Western Europe, North American, and Asia’s developed markets to buy. They are waiting for the next wave of innovation to help lift it again. (Leo Mirani 2014) (Figure 2.5 and 2.6).. Figure 2-6: Revenue growth in technology devices Source:http://qz.com/163972/global-spending-on-tech-will-fall-this-year-because-theres-nothing-new-tobuy/. Figure 2-7: Spending on technology devices by region Source:http://qz.com/163972/global-spending-on-tech-will-fall-this-year-because-theres-nothing-new-tobuy/ 12.
(20) Online shopping electronic product has advantages and disadvantages, so there are many of factors that need to take into account, likes checkout, shipping, payment, product browsing and etc. These trade information services are the factors to let consumer make a buying decision and e-commerce’s companies will be more responsive to supply chain member’s needs due to the visibility of real-time data via the Internet (Rayport & Sviokla, 1995), just like the concepts by (Robert 2003) that “Information is one of the most important assets of an organization. Consequently, managing information strategically must be a priority for any organization that wants to compete and win in the marketplace. It begins with developing a strategic plan, implementing the strategy and assessing its effectiveness in the real world environment. In order to attach a strategic value to the information flow within the organization, the information manager must first understand the business portfolio of the organization and how the organization functions in a day-today environment (Brown & Chen 1999). Information also helps supply chain managers plan, execute, and evaluate results with greater precision and speed. At the same time, technology that permits complete visibility to this information enables businesses to manage their operations more effectively. So companies have transformed this kind of information visibility into competitive advantage (Rayport and Siokla, 1995), not just for themselves but also for their supply chains. However, visibility can also lead to information overload as companies have access to more information than they are accustomed to managing potentially resulting in confusion and additional uncertainty in the connecter environment (Mentzer 2004). Before consumer took a view on display or trial product in store, they may also search for information regarding products on web. For example, the online information of a smartphone on Ebay includes image, item condition, color, price, storage capacity, style, features, compatibility, brand, model, carrier, operating system, and etc. Besides that, social media such as google plus, Facebook, twister or blog has widely been used to share their used experience on the digital device. These ‘‘green’’ claims have emerged as a marketing strategy in part due to growing evidence that consumers care about the environment and are willing to pay a higher price for a product or process that generates less environmental harm (Timothy & Lata 2011). For example, Large and Thomsen (2011) argued and confirmed that green concepts positively linked to the environmental performance improvement, albeit may be likely a barrier to green collaboration among suppliers. 13.
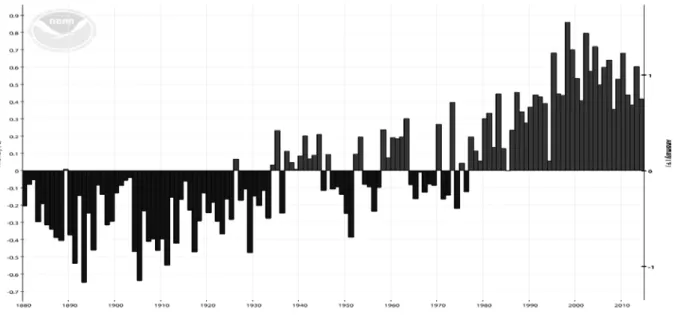
(21) Importantly, the environmental product development has been talked over years. A number of survey evidences from reputable research bodies was cited as identifying heightened environmental awareness, a growing consumer interest in green products, and a pronounced willingness to pay for green features (Peattie and Crane 2005). Despite this optimistic picture, by the mid-1990s new market research evidence began to emerge which was less unequivocal about the growth of green consumerism. Mintel reviewed report on the environment recorded only a very slight increase in green consumers since 1990, and identified a significant gap between concern and actual purchasing – a picture replicated in subsequent management research (Peattie & Crane 2005). The frequency and prominence of green claims was also found to be in decline (National Consumer Council, 1996), and green products looked to have achieved only limited success At the end of the 1990s, despite being the source of much activity and considerable research, green marketing gives the impression of being significantly unsuccessful (Peattie and. Crane,1999). However, environmental issue becomes worse and worse since the end of 19th Century. The Figure 2.7 showed that the world temperature has been consistently hotter than the 20th century average. But if looking more closely, it can be seen that the heat has been abating since 1998.This data has been collected by NCDC (National Climatic Data Center) which is part of NOAA (National Oceanic and Atmospheric Administration), a scientific agency of the US Administration. NOAA is an international leader for temperature data (Figure 2.7).. 14.
(22) Figure 2-8: Global Land and Ocean Temperature Anomalies Source: http://www.ncdc.noaa.gov/cag/. People realize that the effect of environment temperature change causes a lot of problem, for example the climate has tremendous changed within a year. Fortunately, during 2010-2011, global sales of low carbon and environmental goods and services were measured at roughly $5.2 trillion dollars with 48 percent of the total coming from lowcarbon activities, 31 percent from renewable energy and 21 percent from environmental activities. This represents annual growth of 3.7 percent from the previous year. Green products and services are increasingly important to the U.S. and global markets. "Sales of environmentally friendly products in the U.S. exceeded $40 billion in 2011, according to data from various market tracking services and advertising age. This includes $29.2 billion for organic food, more than $10 billion for hybrid, electric and clean-diesel vehicles, more than $2 billion on energy-efficient light bulbs and $640 million on green cleaning products" .The need to conserve and reuse resources can lead to a renewable global economy. For example, the rapid growth of nations in Asia and Latin America continued consumption in the developed world makes sustainability a necessity. The environment is not a luxury to preserve because it is pretty; it is a necessity to maintain because our survival depends on it (Cohen, 2010). Also, the win–win philosophies have created expectations that green products would be environmentally superior to traditional products but also competitive in terms of price and technical performance (Baumann et al., 2002). To response to this issue, while the current research investigates the effect of satisfaction of consumer electronic product purchase on the repurchase intention, the alternative effect of online green information on between is also examined. The green 15.
(23) information includes the manufacturing process, the operation of device, and the recycle information.. 2.2 Expectation-Confirmation Theory. This paper examines human’s psychology and functional effect influencing one’s intention to continue purchasing and using the electronic product. Expectation confirmation theory is adapted from consumer literature and integrated with theoretical and empirical findings from prior consumption value research to theorize a model of consumer repurchase intention of electronic product. Expectation-confirmation theory (ECT) is from prior IS usage research which is widely used in the consumer behavior literature to study consumer satisfaction, postpurchase behavior (e.g., repurchase, complaining), and service marketing in general (Bhattacherjee 2001). The predictive ability of this theory has been demonstrated over a wide range of product repurchase and service continuance contexts, including automobile repurchase, camcorder repurchase, institutional repurchase of photographic products, restaurant service, and business professional services. The process by which consumers reach repurchase intentions in an ECT framework is as follows (Bhattacherjee 2001). First, consumers form an initial expectation of a specific product or service prior to purchase. They then accept and use that product or service. They form perceptions about its performance after a time period of initial consumption. Third, they evaluate its perceived performance according to their original expectation and then determine the extent to which their expectation is confirmed. They therefore form a satisfaction, or affect, based on their confirmation level and expectation on which that confirmation was based. Finally, satisfied consumers form a repurchase intention, while dissatisfied ones discontinue its next use. In general, the ECT explains that consumers' intention to repurchase a product or continue service use is determined primarily by their satisfaction with prior use of that product or service (Bhattacherjee 2001).. Expectation Confirmation. Satisfaction. Perceived performance Figure 2-9: Expectation-Confirmation Theory Model 16 Source: Bhattacherjee 2001. Online repurchase intention.
(24) Related to this, unmet expectations have been negatively associated with newcomer’s adjustment, and positively associated with absenteeism intentions to quit, and turnover. Although most models of met expectations suggest that initial expectations are the basis on which subsequent evaluation are developed, the theoretical perspectives differ in terms of how deviations from expectations—positive or negative, large or small— influence outcomes. Generally, when expectations are low and experiences are high, individuals may adjust their satisfaction evaluation downward towards their expectations, thus enacting a dissonance reduction strategy. Moreover, lower satisfaction levels will be their ultimate evaluation, which is influenced by their preconceived expectations. Similarly, when expectations are high and experiences are low, individuals may adjust their satisfaction evaluations upward towards their expectations. In this case, the positive effect of experiences is actually enhanced by positive expectations, such that when individuals have positive expectations and positive experiences their satisfaction is likely high (Susan el at. 2002). This expectation is usually based on others’ experience or information obtained through product reviews or word of mouth. So confirmation was regarded as a process of cognitive belief that describes the extent to which consumers’ expectations of service use were met in reality. Customers will return greater confirmation if lower expectation meets higher performance, which turns positively affects repurchase intention by mediating customer satisfaction ( Bhattacherjee, 2001). In this research, the first hypothesis is consumer satisfaction significantly influences online repurchase intention. Satisfaction was defined as the summary psychological state resulting when the emotion surrounding disconfirmed expectations is coupled with the consumer’s prior feelings about the consumption experience and is viewed as the key to building and retaining a loyal base of long-term consumers. For example, "Investing in customer satisfaction is like taking out an insurance policy. If some temporary hardship befalls the firm, customers will be more likely to remain loyal." (Eugene and Sullivan 1993, p.125-143). And last, I examined online repurchase intention as the endogenous variable instead of studying the online consumers’ actual behavior, based on the theory of reasoned action proposed by Ajzen and Fishbein (1980) (Kim el at. 2003), intention is considered the best immediate factor in the relationship between attitude and behavior, and is appropriate to test consumers’ behavior. Online customer retention is a hot issue in both the IT and marketing areas. Researchers have studied online customer retention in different contexts, such as “online repurchase intention”, “Continue to shop online” “customer intention to return”, “Web site stickiness”, and “continued information 17.
(25) systems/IT intention” (Chao el at. 2011). Electronic product repurchase intention is influenced by the initial use or purchase experience that continuance in online repurchase intention. However, consumer behavior was underlined on online repurchase intention; a construct combining IS theory and marketing theory. In this construct, the customer is not only an e-commercial website user, but is also a consumer. The goal of this study is to understand the importance of relationship and differences between the hedonic factors or utilitarian factors in affecting customers’ buying behaviour to continue online purchasing electronic products (Chao et al., 2011). If the consumer satisfies with the use of electronic product, he will continue online purchase with latest version again. H1: Satisfaction is significantly related to repurchase intention. 2.3 Consumption Value Theory. The research thesis explores the value of electronic product which will be created after the purchase and use of a consumer. On account of these experiences, the adding of green information visibility influences consumer satisfaction towards online repurchase intention is still under investigation. The definition of consumption values are introduced by Sheth et al. (1991). It refers to subjective beliefs and desirable attitude that will become personal values. People generally achieve personal values through actions or activities, such as social interaction, economic exchange, possession, and consumption (Sheth et al. 1991). According to means-ends chains models of consumer product knowledge (Peter & Olson, 1990), people may have ideas and preferences about various actions that can help them achieve personal values. Therefore, the creation of personal values from a product depends on consumption values which are instrumental in nature. For example, owning an elegant house and acquiring a prestigious car are for some people to the desirable ways of achieving self-fulfillment. Attending football games (especially those of favorite teams) and taking a vacation trip are favorable activities which lead to personal fun and enjoyment. Furthermore, individuals may develop several personal values by which they direct or evaluate consumption activities. Therefore, the consumption values of these types of activities (or possessions) are sophisticated and do not simply satisfy one single personal value (Sheth et al. 1991). These values may include epistemic value, social value, price value, etc. In order to clarify these values, they are distributed into three categories: internal value, external value, and functional values. As aforementioned, consumption 18.
(26) activities usually include an assortment of goods and services (Boyd and Levy 1963). For example, "owning an elegant house" requires house owners to acquire many goods and services in addition to the house itself, just as "taking a vacation trip" involves many other related acquisitions. Moreover, in a product constellation for a consumption activity, there may be some properties in common. McCracken (1988, p. 119) observes that "the consumer goods in any complement are linked by some commonality or unity". From a social interaction perspective, Solomon (1983) maintains that consumers employ product constellations in "setting the stage" for the social roles they play. Product constellations occur, because individuals use entire complements of products to achieve personal values. The products unified in a constellation all carry the same information about individual values. In addition, Lai (1994) reported that consumers may obtain satisfaction holistically from the related consumption activities and the constellation of products in use. In Sheth el.at. (1991), ‘why consumers make the choices they do’ is the main purpose for them to develop their theory. In generally, there are three choices: buy or not buy (to use or not use), choose one type over another and the choice of brand over another, to make a decision on a specific product. They used smoking cigarette as an illustrations to examine between smokers versus nonsmokers, filtered versus non-filtered and Marlboro versus Virginia Slims with their consumption values. At the same time, this theory applies to choice involving a full range of product types such as durables or non-durables goods or services. Electronic product is one of durables goods but users may receive negative effect more than positive effect on an old electronic product rather than new ones after a couple years, especially when customer loyalty is getting lower and lower in the Internet era. For example, if they keep using the old electronic product, they can save money; on the contrary their product may consume by time and easy to break down at any time. Therefore, this study only focuses on who will be likely to buy new electronic product with environment protect feature based on their experience and expectation. With the model of Sheth et.at. (1991), it is applicable to explain why consumers make a choice on new electronic product. However, the current research does not consider the types and brand. To feature the Sheth el.at. (1991)'s theory, the research thesis groups the model factors into three categories: internal value, external value and functional value. First, internal value involves epistemic value and attitude value. Then external value consists of social value, education value and culture value. The functional value comprises of price, quality, attribute and usability. Details are described below. 19.
(27) 2.3.1. Internal Value. When confronted with a purchase decision, we may engage in internal search by scanning our own memory bank to assemble information about different product alternatives. Usually, though, even the most market-aware of us needs to supplement this knowledge with external search, where information is obtained from advertisements, friends, or just plain people-watching. (Solomon et al., 2006). The inspiration of these information may directly make an impression in our own memory bank that will shape some perspective to the particular product such as epistemic value and attitudes value. The notion of epistemic culture is designed to capture these interiorized processes of knowledge creation. It refers to those sets of practices, arrangements and mechanisms bound together by necessity, affinity and historical coincidence which, in a given area of professional expertise, make up how we know what we know. Epistemic cultures are cultures of creating and warranting knowledge (Cetina, 2007). The epistemic cultures also can transform as a value which can arouse curiosity of consumer to a new product. For example, smartphone and cellphone are similar product, yet, smartphone not only remain the cellphone’s function and also add-in new functions. The curiosity of new function attract consumer to buy, learn and use it. Another value is attitude values, consumer attitude will change after they used the product. Then, the other product, which was produced by the same company, may get the same effect by the previous one. Based on the social identity theory and research conducted by Curra´s-Pe´rez et al. (2009), consumers feel motivated to develop socially identifying relationships with a company as a means of improving their own selfdefinitions. Having psychologically defined themselves as a member of that company, consumers then internalize the company’s stereotypical norms as personal norms which reveals positive attitudes toward the company (Terry et al. 2000; Curra´s-Pe´rez et al. 2009). Though it is sometimes common to define an attitude as affect toward an object, effect (i.e., discrete emotions or overall arousal) is generally understood to be distinct from attitude as a measure of favorability (Sule 2013). Therefore, the second hypothesis is developed as follow. H2: Internal value is significantly related to satisfaction H2-1: Epistemic value is significantly related to satisfaction 20.
(28) H2-2: Attitudes value is significantly related to satisfaction. 2.3.2. External Value. During the consumer decision-making process, internal memory is combined with external memory – which includes all the product details on packages in shopping lists, and through other marketing stimuli – to permit brand alternatives to be identified and evaluated (Solomon et al., 2006). This value is created by consumer’s external memory to value a product. Thus, there are many external factor that may influence consumer memory, such as fashion, culture, environment, etc. To specify the factors, the research chooses social value, education value, and culture value as external value to evaluate consumer purchase behavior. The extent to which the concept of social value, generally is defined as “something of value for society” (Dietz and Porter, 2012). So communication of consumer which defines as word of mouth that will create social value to consumer. Prior studies have found that the influence on purchase decision through word of mouth communication was further extended with the advent of the Internet, which extended e-world-of-mouth that consumers perceive world-of-mouth as more trustworthy and persuasive than traditional media, such as print ads, personal selling, and radio and TV advertising, and communication to various additional virtual settings. On the Internet, consumers can post their opinions, comments and reviews of products on weblogs (e.g. xanga.com), discussion forums (e.g. zapak.com), review websites (e.g. Epinions.com), e-bulletin board systems, newsgroups, and social networking sites (e.g. facebook.com)(Cheung & Thadani, 2010). Education value refers to knowledge development via learning and thinking that influence consumers to make purchasing decision. So knowledge can influence human decisions or actions (Ishak & Zabil 2012). The relationship between knowledge and consumer's behavior can best be explained by Ajzen’s theory of Planned Behavior (TPB) (Ajzen & Fishbein 1980). Based on TPB, individual attitudes and beliefs are shaped by knowledge. Therefore, a study that investigates the impact of knowledge on human behavior is implicitly underlined by the Planned Behavior Theory. For example, Viswanath et al. (2003) tested eight models and found that the predictive validity of six of the eight models significantly increased after the inclusion of moderating variables. All 21.
(29) online vendors deal with a degree of customer heterogeneity, and one of the key differences among customers is the degree of knowledge a given customer has about the product being sold. Culture can influence various areas of consumer behavior, such as how and why they shop, because it affects an individual‘s self-concept, value system and communication style. Hofstede‘s cultural values framework is one of the most extensively used models in the examination of cross-cultural consumer behavior. This framework measured 75 countries and regions on each of Hofstede‘s five dimensions of cultural values: individualism-collectivism, power distance, uncertainty avoidance, masculinityfemininity and long-term orientation (Shen el at. 2014). Some researcher believes that culture difference does have an impact on companies’ initiatives to design the product package, for instance, during their research; the choices of packaging colors are quite different (Mitul & Bhavesh, 2012). Nonetheless, this study simply examine that whether culture impacts on consumer purchasing behavior. The third hypothesis is then defined as follow. H3: External value is significantly related to satisfaction H3-1: Social value is significantly related to satisfaction H3-2: Education value is significantly related to satisfaction H3-3: Culture value is significantly related to satisfaction. 2.3.3. Functional Value. Other than the previous value, there is another value which is necessary to be included, functional value. The functional value of an alternative is defined as: The perceived utility acquired from an alternative's capacity for functional, utilitarian or physical performance. For example, the decision to purchase a particular automobile might be based on fuel economy and maintenance record (Sheth et al., 1991). Thus, to find out the purchasing behavior of consumer, functional value will involve four attribute: price, quality, attribute, and usability in this research. Generally, the price as the first factor on goods that we are willing to purchase or trade in, is a part of the marketing mix, used to stimulate the consumer and become a communicator, to negotiate and a competitive weapon. The consumer can use price as a 22.
(30) means to compare products, judge relative value for the money, and the judge quality of products. It is estimated that this factor has a considerable influence on the consumers when performing online shopping (Sajjad et al., 2012). Moreover, when consumers try their best for a lower price, those consumers are defined as price-sensitive. Planned future price increases should be communicated to consumers as well as planned price cuts, since it gains from the decreased uncertainty more than offsets the loss from the delay in purchase behavior (Shihtao et al. 2010). Another factor is needed to be consider, that is quality factor. In Zeithmal’s (1988) concept, quality was seen as the superiority of a certain product or service in a broad sense. Perceived quality was defined as consumers ’judgment about products’, excellence or superiority. According to Dodds et al. (1991), consumers’ perceived value represents a trade-off between quality and benefit they perceive from the product and the sacrifice they perceive by paying the price (Choi & Kim, 2013). For example, counterfeit product has lower quality and price rather than genuine product. In particular, the online market for experienced products provides a substantial and largely untapped revenue source, but represents a challenge for online sellers, as the technology-mediated environment makes it more difficult to convey the experiential attributes associated with such products (e.g., taste, sound, fit). While some researchers are investigating how a virtual product experience (VPE) provided through a Web interface can better convey visual product attributes the e-commerce channel remains limited in conveying experiential attributes as compared to a physical store. There are two types of attribute: extrinsic and intrinsic cues. Extrinsic cues are product-related attributes that are not inherent to the product being evaluated, such that changes to these attributes do not alter the fundamental nature of the product. Intrinsic cues are product attributes that, if altered, change the fundamental nature of the product (Wells et al., 2011). Using a Television set as an example, the price of television is extrinsic cue and its components are intrinsic. While consumers use both intrinsic and extrinsic cues to assess product quality, extrinsic cues may be more influential in certain contexts, such as when extrinsic cues are more readily available or more easily understood than intrinsic cues (Wells et al., 2011). Usability includes three main concepts: effectiveness, efficiency, and user consummation. In its broadest sense, usability is the expression of whether the product is good enough to meet all needs of the user. User evaluation of the usability measures affects purchasing of the product. Han et al. (2001) stated that image/impression and 23.
(31) performance dimensions should be considered together to evaluate usability of electronic devices. To be able to show the effects of interface factors, performance and image/impression dimensions are detailed (Kumru & Ergun, 2014). In order to measure the level of consummation of the user, as well as effectiveness and efficiency, usability testing is needed. This allows the designer to see what people actually do, what works for them, and what doesn’t, not what he or she thinks they would do. According to Nielsen (1993), “your best guess is not good enough.” That's why usability testing is essential (Christianne & Marcelo, 2013). Therefore, the forth hypothesis is formed as follow.. H4: Functional value is significantly related to satisfaction H4-1: Price value is significantly related to satisfaction H4-2: Quality value is significantly related to satisfaction H4-3: Attribute value is significantly related to satisfaction H4-3: Usability value is significantly related to satisfaction. 2.4 Green Information Visibility. Visibility and trust are intricately related, which is a driver of consumer’s intention to purchase, and hence building trust is likely to contribute positively to sales profit and business growth. The problem of information visibility on the Internet is one that is primarily attributed to anonymity, lack of face-to-face interactions, unfamiliarity between buyers and sellers and the lack of repeated interaction. One way to mitigate online risk is via information visibility, which has shown to help to lower user risk belief. Consumers generally felt they received insufficient information about products and services, and hence they preferred more information and details, not only on pricing and services, and on production processes and health impact as well. The provision of appropriate information by organizations is seen as building trust with consumers and facilitating perceptions of reliability (Cheah & Dewan 2014). From an academic perspective, the area of “Green Information Technology’ has been rigorously studied; however, the trend toward using technologies, innovation, and techniques requires further exploration. This fairly new area of inquiry is referred to as “Green IT,” a term applied to the most important strategic technology to better support sustainable practices; the term also closely relates to information systems and business processes. Watson et al. (2010) criticized the fact that the IS academics primarily have 24.
(32) focused on productivity improvements and economic efficiency rather than supporting environmental practices. This focus has resulted in waste, unused resources, energy inefficiency, noise, friction, and emissions. There is a lack of information regarding how to bring about economic benefits while encouraging social and ecological responsibility for the future generations (Koo el at. 2015) Recent developments show that a Green IT agenda now has been integrated into individual beliefs and actions at the micro-base; meanwhile, organizational sustainability and economic and environmental outcomes at the macro-base have become main stream in IS literature. Unlike macro-level research into organizational ecological sustainability (Koo el at. 2015), environmental attitudes and behavior are closely related to people’s values, which may provide a basis for the formation of motivation types as guide-lines for consumer behavior. While environmental sustainability has received attention amongst consumers, Green IT has just begun to display its unique practical contributions, both negative and positive, to the environment and economy. Green IT & IS will necessarily include both organizational and individual aspects of environmental technology (people, processes, software, and information technologies) (Sarkis et al., 2013). Similarly, the research argument for this issue is whether visibility of green information mediates the effect of consumption value on satisfaction towards repurchase intention. Therefore, the fifth, sixth, and seventh hypothesis are defined as follows. H5: Green information visibility significantly mediates the effect of internal value on satisfaction H6: Green information visibility significantly mediates the effect of external value on satisfaction H7: Green information visibility significantly mediates the effect of functional value on satisfaction. 25.
(33) Chapter 3: Research Method. 3.1 Research Model. This research paper focuses on examination of the consumer online repurchase intention of consumer electronic product. Based on the review of literature and the arguments of the current research focus, the research model is presented in Figure 3.1, which contains three parts. The first part has three independent variables including internal value, external value and functional value. The internal value contains sub-variables of epistemic and attitudes. The external value has social, educational, and culture while functional value includes price, quality, attribute, and usability. The second part is the independent variables that have satisfaction and online repurchase intention. The satisfaction is also regarded as the independent variable of online repurchase intention. The final part is the mediator, green information visibility, which is included in the model to alternate the effect of independent variables on dependent ones. Hypotheses are defined as follows.. Figure 3-1: Research Model. 26.
(34) H1: Satisfaction significantly influences online repurchase intention H2: Internal value significantly influences satisfaction H2a: Epistemic value significantly influences satisfaction H2b: Attitudes value significantly influences satisfaction H3: External value significantly influences satisfaction H3a: Social value significantly influences satisfaction H3b: Educational value significantly influences satisfaction H3c: Culture value significantly influences satisfaction in consumer electronic products H4: Functional value significantly influences satisfaction H4a: Price significantly influences satisfaction H4b: Quality significantly influences satisfaction H4c: Attributes significantly influences satisfaction H4d: Usability significantly influences satisfaction H5: Green information visibility mediates the effect of internal value on satisfaction H5a: Green information visibility mediates the effect of epistemic value on satisfaction H5b: Green information visibility mediates the effect of attitudes value on satisfaction H6: Green information visibility mediates the effect of external value on satisfaction H6a: Green information visibility mediates the effect of social value on satisfaction H6b: Green information visibility mediates the effect of educational value on satisfaction H6c: Green information visibility mediates the effect of culture value on satisfaction H7: Green information visibility mediates the effect of functional value on satisfaction H7a: Green information visibility mediates the effect of price value on satisfaction H7b: Green information visibility mediates the effect of quality value on satisfaction H7c: Green information visibility mediates the effect of attributes value on satisfaction H7d: Green information visibility mediates the effect of usability value on satisfaction. 27.
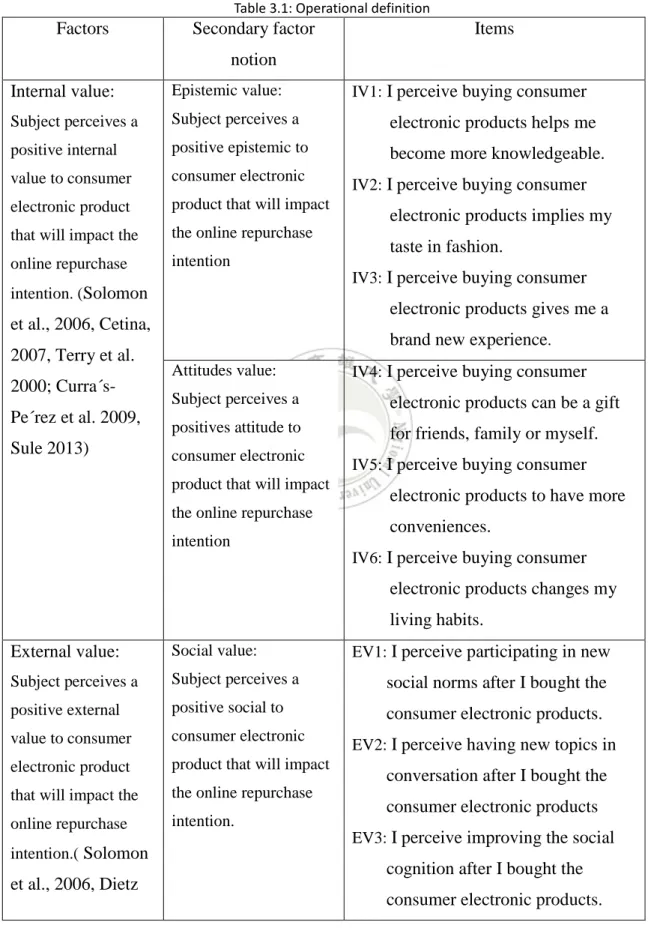
(35) 3.2 Sampling Plan Target. The research purpose in the thesis is to explore the consumer buying behavior for the consumer electronic products by survey, especially the mediation effect of green information visibility. Thus, the research’s subject who have buying experience or willing to buy consumer electronic product in the future that will be focused on. Next, the questionnaire will ask the subjects about if the green information visibility of the product influence their satisfaction when they purchased it. And also, in order to investigate about the consumer’s online repurchase intention, subjects will be asked in the questionnaire whether they satisfy the e-commerce platform that will lead them to purchase from virtual store. Then, the questionnaire will be sent to the subjects through the internet and handout. The sample target will be college student, friends, family, relative or colleague and will expect to have the responders will more than 300 people. The software for setting up the questionnaire may use Google drive and internet social media such as Facebook and others for easily sharing. In terms of gender and age, I hope there will not too much gap that this result will be better and able to reflect the idea of the general consumer.. 3.3 Measure. Prior to the literature review, the variables were implied and prompted in Table 3.1. Amid some of the variables with sub-variables, the reason is to deeply account them and make the model more completive so there are internal, external, and functional values. The first part of the questionnaire inquires the subjects’ basic information, such as age, gender, salary or willing to pay. Another part of it is about the subject’s personal opinion through the related statement that will regard with all the variables. For instance, the question will ask subject how variable impacts them after they consume or try the electric product, do they feel fulfillment and desire what the value was provided by the consumer electronic product. Due to the questionnaire was designed to ask what the feeling of the subject from consumer electronic product consumption; the answer may request to fill on 1 to 7. The symbol 1 represents the subject does not find out or a little sense perception towards the variable by the consumer electronic product, on while symbol 7 defines as the subject having a highest sense perception towards the variable from the consumer electronic product. Using number for answering the questionnaire can let the report easily understand and discriminate 28.
(36) the subjects’ mind set; and at the same time, the statistics will be possible to derive the research findings. Table 3.1: Operational definition. Factors. Secondary factor. Items. notion Internal value:. Epistemic value:. Subject perceives a. Subject perceives a. electronic products helps me. positive internal. positive epistemic to. become more knowledgeable.. value to consumer. consumer electronic. electronic product. product that will impact. that will impact the. the online repurchase. online repurchase. intention. IV1: I perceive buying consumer. IV2: I perceive buying consumer. taste in fashion. IV3: I perceive buying consumer. intention. (Solomon. electronic products gives me a. et al., 2006, Cetina, 2007, Terry et al. 2000; Curra´sPe´rez et al. 2009, Sule 2013). electronic products implies my. brand new experience. Attitudes value:. IV4: I perceive buying consumer. Subject perceives a. electronic products can be a gift. positives attitude to. for friends, family or myself.. consumer electronic. IV5: I perceive buying consumer. product that will impact the online repurchase. electronic products to have more conveniences.. intention. IV6: I perceive buying consumer. electronic products changes my living habits. External value:. Social value:. Subject perceives a. Subject perceives a. social norms after I bought the. positive external. positive social to. consumer electronic products.. value to consumer. consumer electronic. electronic product. product that will impact. that will impact the. the online repurchase. online repurchase. intention.. EV1: I perceive participating in new. EV2: I perceive having new topics in. conversation after I bought the consumer electronic products EV3: I perceive improving the social. intention.( Solomon. cognition after I bought the. et al., 2006, Dietz. consumer electronic products.. 29.
(37) and Porter, 2012,. Educational value:. Cheung & Thadani,. Subject perceives a. after I bought the consumer. 2010, Ishak &. positive educational to. electronic products.. Zabil 2012, Ajzen,. consumer electronic. & Fishbein 1980, Viswanath et al.. EV4: I perceive learning new skills. EV5: I perceive myself improving. product that will impact the online repurchase. learning methods after I bought the consumer electronic products.. intention.. 2003, Hofstede‘s. EV6: I perceive learning motivation. 2001, Shen el at.. after I bought the consumer. 2014, Mitul &. electronic products.. Bhavesh, 2012). Culture value:. EV7: I perceive changing belief after I. Subject perceives a. bought electronic products.. positive culture to. EV8: I perceive myself changing. consumer electronic. ideality after I bought electronic. product that will impact the online repurchase. products. EV9: I perceive myself changing. intention.. morality after I bought electronic products. Functional value:. Price value:. FV1: The price of consumer electronic. Subject perceives a. Subject perceives a. positive functional. rational price to. value to consumer. consumer electronic. electronic product. product that will impact. that will impact the. the online repurchase. online repurchase. intention.. product is valuable for us. FV2: The price of consumer electronic product is rational for us. FV3: The price of consumer electronic product is payable for us.. intention.( Sheth et. al., 1991, Sajjad et. Quality value:. FV4: The design and the quality of. al., 2012, Shihtao et Subject perceives a al. 2010, Zeithmal’s 1988, Dodds et al. 1991, Choi & Kim, 2013, Wells et al.,. consumer electronic product are durable for us.. rational quality to consumer electronic. FV5: The function and the quality of. product that will impact. consumer electronic product are. the online repurchase. plentiful and thoughtful for us. FV6: The application and the quality of. intention (design,. 2011, Han et al.. function, application. consumer electronic product are. 2001, Kumru &. etc.).. accessible and sensitive for us.. Ergun, 2014, 30.
(38) Nielsen 1993,. Attribute value:. Christianne &. Subject perceives a. Marcelo, 2013). rational attributes to. FV7: The attribute of consumer electronic product can be preserved for resale. FV8: The attribute of consumer electronic product is ease to buy for us.. consumer electronic product that will impact. FV9: The attribute of consumer electronic product is easy to repair for us.. the online repurchase intention.. Usability value:. FV10: The usability of consumer. Subject perceives a. electronic product is easy to use for. rational attitude to. us.. consumer electronic. FV11: The usability of consumer. product that will impact. electronic product create convenient. the online repurchase. in our lives. FV12: The usability of consumer. intention.. electronic product is practical.. Green information. Green information. visibility (Cheah &. visibility:. consumer electronic products is. Dewan 2014,. Subject perceives. able to be saw when I was. Watson et al. 2010,. adoptable information of. purchasing.. Koo el at. 2015, Sarkis et al., 2013). GIV1: The recycle information of. consumer electronic. GIV2: The energy saving information. product that will be a. of consumer electronic products is. mediate effect of independent variable to fulfill and intent them to. able to be saw when I was purchasing. GIV3: The environmental protection. online repurchase.. information of consumer electronic products is able to be saw when I was purchasing. Satisfaction(Eugene Satisfaction: and Sullivan 1993). SA1: I was satisfied with the consumer. Subject perceives a. electronic product after I consumed.. positive satisfaction in. SA2: I was satisfied with the consumer electronic product after I used.. consumer electronic product and intent them. SA3: I was satisfied with the consumer electronic product after I tried it.. to online repurchase.. 31.
數據

+7


相關文件
The contents of this essay are to demonstrate that one can get the ultimate achievements by Separate-teaching also, to clarify the value of Separate-teaching and
對外商品貿易指數的資料是源於進出口貨物准照及申報單的資料,而有關指數主要包括:價值指
From the doctrinal structure of this `sastra`, it has been found that this work has only amended some errors committed in the `Abhidharma-ynana-
減:本年度提列折舊數 本年度期末帳面價值 本年度提列折舊數 醫療成本 管理及總務費用 上年度期末帳面價值
2011年按落成用途之公共及私人工程數目與價值 NÚMERO E VALOR DOS PROJECTOS DE CONSTRUÇÃO PÚBLICA E PRIVADA, POR FINALIDADE EM 2011 NUMBER AND VALUE OF PUBLIC CONSTRUCTION
16- 按工程價值統計之工程主要指標 PRINCIPAIS ESTATÍSTICAS DOS PROJECTOS DE CONSTRUÇÃO, POR ESCALÕES DE VALOR DAS OBRAS PRINCIPAL STATISTICS OF CONSTRUCTION PROJECTS BY
培養創意 發展音樂 培養評賞音樂 認識音樂 及想像力 技能與過程 的能力 的情境. 價值觀 與 態度
Philosophiæ Naturalis Principia Mathematica Mathematical Principles of Natural Philosophy.
