i
COLLEGE OF MANAGEMENT
I-SHOU UNIVERSITY
Master Thesis
The Effect of Perceived Justice on Customer
Satisfaction after a Service Failure in Restaurant
Advisor: Professor Tsai, Ming-Chi
Graduate Student: Nguyen, Thanh Hai (Anna)
ii
Abstract
This study examines the influences of perceived justice on customer satisfaction after a service failure occurs and how customer satisfaction affects customer loyalty as well as word-of-mouth intention. This study focuses on the concept of justice theory and three dimensions of justice (distributive, procedural and interaction).
The study considered a sample of 255 customers of fast-food restaurant in Vietnam, whose had experienced service failure and had been offered service recovery at least one time. This study hypothesized that perceived justice will positively affect customer satisfaction directly after service recovery satisfaction. It is further hypothesized that customer satisfaction will significantly influence customer loyalty and word-of-mouth intention. In addition, this study hypothesizes that people with different demographic information (gender, age, educational background, occupation and income) will have different level of satisfaction, brand loyalty and WOM intentions.
This study applies quantitative methods such as factor, correlation and regression. The results found that two dimensions perceived justice (distributive and interactional justice) positively affect customer satisfaction and satisfaction significantly influences customer loyalty. Further findings indicate that there is a significant difference in the level of satisfaction, loyalty and WOM intention between people that have different ages, occupations and monthly income. However, there is no difference in satisfaction, loyalty and WOM intention among people with different background. Finally, the difference in WOM intention among male and female customers also found. Managerial implications of these findings are briefly discussed.
Keywords: Service Failure, Service Recovery, Perceived Justice, Recovery Satisfaction, Customer Loyalty, WOM.
iii
Table of Contents
List of Tables ... vi
List of Figures ... vii
Chapter 1 INTRODUCTION ... 1
1.1 Research Background ... 1
1.2 Problem Statement and Research Objectives ... 2
1.3 Research Significance ... 3
Chapter 2 LITERATURE REVIEW ... 5
2.1 Service Failure ... 5 2.2 Service Recovery ... 6 2.3 Customer Satisfaction ... 7 2.4 Perceived Justice ... 7 2.4.1 Distributive Justice ... 8 2.4.2 Procedural Justice ... 9 2.4.3 Interactional Justice ... 9 2.5 Customer Loyalty ... 10 2.6 Word-of-mouth ... 11 2.7 Demographic factors ... 12
2.7.1 Demographic factors and customer satisfaction ... 12
2.7.2 Demographic factors and customer loyalty ... 13
2.7.3 Demographic factors and word-of-mouth ... 14
Chapter 3 METHODOLOGY ... 15
3.1 Research Design ... 15
3.2 Research Framework ... 15
3.3 Sampling Design... 16
3.4 Data Collection ... 16
3.5 Measurements and Questionnaire Design ... 17
iv
3.5.2 Measurements ... 17
3.6 Data Analysis ... 20
3.6.1 Descriptive Statistics ... 20
3.6.2 Reliability and Validity Analysis ... 20
3.6.3 Regression and Correlation Analysis ... 20
3.6.4 Independent T-test ... 21
3.6.5 One-way ANOVA ... 21
Chapter 4 DATA ANALYSIS ... 22
4.1 Descriptive Statistics ... 22 4.2 Factor Analysis ... 23 4.2.1. Distributive Justice ... 24 4.2.2. Procedural Justice ... 24 4.2.3. Interactional Justice ... 25 4.2.4. Customer Satisfaction ... 26 4.2.5. Customer Loyalty ... 27 4.2.6. Word-of-mouth ... 27
4.3. Correlation and Regression Analysis ... 28
4.3.1. Correlation Test ... 28
4.3.2. Regression Analysis and Hypotheses Testing ... 29
4.4. Independent Sample T-test ... 34
4.4.1 Gender Difference in Satisfaction. ... 34
4.4.2 Gender Difference in Loyalty. ... 35
4.4.3 Gender Difference in Word-of-mouth intention. ... 35
4.5. One-way ANOVA Analysis ... 37
4.5.1 Demographic Differences in Satisfaction ... 37
4.5.2 Demographic Differences in Loyalty ... 38
4.5.3 Demographic Differences in WOM intention ... 40
CHAPTER 5: CONCLUSIONS AND RECOMMENDATIONS ... 44
5.1 Discussion ... 44
v
5.3 Limitations and Future Study ... 47
5.4 Conclusion ... 48
References ... 49
vi
List of Tables
Table 3.1 Measurement items of Distributive justice, Procedural justice, Interactional justice .... 18
Table 3.2 Measurement items of Customer satisfaction, Customer Loyalty, Word-of-mouth ... 19
Table 4.1 Descriptive Statistic Findings ... 22
Table 4.2 The KMO and Bartlett’s Test of Distributive Justice, Procedural Justice, Interactional Justice, Customer satisfaction, Customer Loyalty, Word-of-mouth ... 23
Table 4.3 Exploratory Factor Analysis of Distributive Justice ... 24
Table 4.4 Exploratory Factor Analysis of Procedural Justice ... 25
Table 4.5 Exploratory Factor Analysis of Interactional Justice ... 25
Table 4.6 Exploratory Factor Analysis of Recovery Satisfaction ... 26
Table 4.7 Exploratory Factor Analysis of Customer Loyalty ... 27
Table 4.8 Exploratory Factor Analysis of Word-of-mouth ... 27
Table 4.9. Correlation Coefficient Analysis ... 28
Table 4.10. Multiple regression analysis of relationship between Distributive Justice, Procedural Justice, Interactional Justice and Customer satisfaction ... 30
Table 4.11. Regression analysis of relationship between Customer Satisfaction and Customer Loyalty ... 31
Table 4.12. Regression analysis of relationship between Customer loyalty and Word-of-mouth . 32 Table 4.13. The different between Male and Female in Satisfaction ... 34
Table 4.14. The different between Male and Female in Loyalty ... 35
Table 4.15. The different between Male and Female in Word-of-mouth ... 36
Table 4.16. The difference in Satisfaction among different age groups, education background, Occupation and Income. ... 37
Table 4.17. The difference in Loyalty among different age groups, education background, Occupation and Income. ... 39
Table 4.18. The difference in WOM intention among different age groups, education background, Occupation and Income. ... 41
Table 5.1 Summary of the research findings ... 45
vii
List of Figures
Figure 3.1 Research Framework ... 15 Figure 4.1 Regression Findings ... 29
1
Chapter 1 INTRODUCTION
1.1 Research Background
Service firms need to provide satisficing experiences for customers to generate profitability, increase market share or simply stay in the business. However, in the world of doing business, it is impossible to totally avoid service failures. Service failures in general come in various forms: severe the wrong food that is not customers’ order, delayed flights, unqualified meal, and when it occurs, it potentially affects the relationship between customer and the service providers, resulting in customer displeasure, negative world-of-mouth and customer defection. In this case, managers need to immediately response by providing some corrections in order to restore unfavorable intentions and maintain positive relationship with customers.
Service recovery is defined as actions taken by a firm to respond to a service failure (Gronroos,1988). Service recovery strategies are immediately implemented by a firm and its employees in order to return the satisfaction to customers (Danaher & Mattsson, 1994; Sparks & McColl-Kennedy, 2001). The eventual purpose of service recovery is to calm dissatisfied customers by proper actions to reduce possible harm to customer relationships and also a firm’s negative reputation, which are caused by service failures (Ha & Jang, 2009; Zemke, 1993).
However, it is unlikely that service firms can avoid all service failures from happening, they can learn to successfully respond to service failures. A good service recovery strategy can influence positive impacts. Previous studies have presented strong links between effective service recoveries and customer satisfaction, customer loyalty, repurchase intentions, and long-term relationships.
In order to basically understand effective service recovery, previous studies have developed justice theory as the main framework for studying service recovery procedures (McColl- Kennedy & Sparks, 2003). A justice theory framework has achieved popularity in clarifying how customers evaluate a firm’s responses toward service failure and recovery. In this theory, perceived justice is a multi-dimensional concept including three dimensions: distributive, procedural, and interactional justice.
2
1.2 Problem Statement and Research Objectives
Zero defect is an unachievable target for the restaurant industry. No restaurant business likes mistakes or shortcomings, however infrequent service failures are unavoidable regardless of how hard standards and procedures are or how much employee training is well-organized (Hart et al, 1990; Johnston, 1999). As a result, managers and employees spend a huge amount of time trying to respond to service failures and unsatisfied customers (Johnston, 1999).
Although restaurants might not be able to prevent errors from occurring, they can learn from the mistakes that they make (Hart et al., 1990). Service failures help a business to detect the causes of poor performance and to improve its service procedures and employee training (Brown, 1997). Furthermore, firms can provide swift and effective service recovery efforts to respond to a service problem and to turn an angry and unsatisfied customer into a highly satisfied one. A study of consumers in the airline, hotel, and restaurant industries found that most customers who received apologies, attentive assistance, and compensation from service employees after encountering service failures actually perceived the experience as very favorable (Bitner et al., 1990).
The main objectives of this study are following:
1. Examine how justice perceived justice after service failures affect customer satisfaction in restaurants.
2. Examine how customer satisfaction in turn affects customers’ loyalty in restaurants. Accordingly, following are the research questions that will be answered by this study:
1. How perceived justice after service failure influence the customer satisfaction in restaurant setting?
2. How customer satisfaction after service failure influence the customer loyalty in restaurant setting?
3. How customer satisfaction after service failure affect the word-of-mouth intention in restaurant setting?
4. Does customer loyalty have an influence on the word-of-mouth intention in restaurant setting?
3 failure?
6. Do people with different background have different brand loyalty after service failure? 7. Do people with different background have different word-of-mouth intention after service
failure?
With above questions and objectives of the study, people can have a better understanding about the important of perceived justice and service recovery to achieve the customer satisfaction and customer loyalty after a service failure. The success of this study will be helpful for future researchers in development of restaurant industry in Vietnam.
1.3 Research Significance
The lack of academic attention in the field of service recovery is also showed on the limited experimental studies that have been conducted over the time. Blodgett, J.G., Hill, D. J. and Tax, S. S. (1997) confirmed "given the acknowledged importance of service recovery, it is surprising that so few large-scale field studies have focused on this topic." Similarly, Greenberg, Jerald (1990) stated, “...limited attention is given to recovery, little is known about how customers evaluates recovery efforts, what constitutes successful recovery and the potential (and limit) of recovery to convert customer dissatisfaction to satisfaction”. Furthermore, Hoffman, D.K. & Kelly, S.W. (2000) have proposed few experiential studies have studied about service recovery and customer loyalty.
However, most service recovery researches investigate customers’ perceived justice on customer satisfaction customer loyalty in general or some in retail, airlines and hotel industry, and limited works focus on how consumers assess recovery resolution in restaurant industry.
In addition, Chebat and Slusarczyk (2005) perceive that the specific influences of the three justice dimensions on customer loyalty are not similar. Moreover, work examining whether the justice dimensions also influence satisfaction with service recovery inversely is absent for the literature. Maxham and Netemeyer (2002) studied the effects of perceived justice on satisfaction with service recovery, but they did not investigate the relative effects of the justice dimensions. In addition, Río-Lanza et al., (2009) state that since not three dimensions of justice have the same effect, especially in illustrative satisfaction, they propose that three dimensions of perceived justice needed to be analyzed separately rather than in a combined form.
4
Bearing this in mind, this paper efforts to contribute to this literature by examining the effects of justice slanted towards recovery on customer satisfaction and loyalty in restaurants in Vietnam after service failures. In particular, how the three dimensions of perceived justice affects customer satisfaction and how satisfaction influences customer loyalty will be examined.
Consequently, the information in this study will help firms which are doing business in restaurant industry have a more clearly evaluation of the importance of service recovery and perceived justice after a service failure. Accurate actions and strategies after service failure happened can reverse the situation, turn an angry and upset customer into a highly satisfied one. Previous studies showed that service recovery can lead to customer satisfaction, customer loyalty, favorable behaviors in the future and moreover, can improve overall firms’ performance. This study can be helpful for managers in managing the firm’s performance in restaurant setting.
5
Chapter 2 LITERATURE REVIEW
2.1 Service Failure
Service failure is defined as a mistake or a problem that happens during service delivery (Y. W. Fan 2010) Service failures rise when customers feel dissatisfied because the service offered was not as initially planned or expected. It is important to remember that service failures are determined by the customer and not by the service provider (Ennew and Schoefer,2003)
Bitner, et al. (1990) recognized two types of failures: process failures and outcome failures. The outcome failures defined as what customers obtain from the service (e.g., a Hawaiian pizza), while the process dimension reflects how they receive the service, that means how it is delivered (Parasuraman et al., 1985).
Kelley and Davis (1994) mentioned that the regularity and severity of service failures are both vital factors influencing service performance. When a service failure happens, the failure severity will determine the level of recovery needed to restore customers’ satisfaction. Therefore, the diverse regularities and severities of service failures result in numerous levels of service performance losses for companies. Some previous research (Weun, Beatty and Jones, 2004, Smith et al., 1999;) on how customers react to service failures stated that “the higher the severity of service failure, the lower the level of customer satisfaction and service performance is”. As presented by Smith et al. (1999), in failure/recovery, customers prefer receiving resources in amounts adequate with the severity of the failure that they experienced and the added value of the recovery funds is reduced as the customer’s loss gets larger.
General examples of service failures include unreasonably slow service, unavailable product/service, product defect, and other core service-associated problems (such as incorrect product delivery or being served rotten food). Hence, the service provider is responsible for prioritize service failure, as its direct affects to consumer satisfaction (Kelley, Hoffman, & Davis,1993) and also switching behavior and negative word of mouth (Keaveney, 1995).
Regarding to the study of service failures, Ilan Silber, Aviad Israeli, Adi Bustin & Ofir Ben Zvi (2009) summarized 9 common service failures in restaurant includes: Dish defect, slow service,
6
out of stock, incorrect temperature, wrong cooking degree, inappropriate servers’ behavior, wrong order, billing error and food/beverage spillage
2.2 Service Recovery
Service recovery is defined as actions implemented to resolve problems right after service failures occur, remove negative attitudes of unsatisfied customers, and retain customers (Miller et al., 2000). According to Lewis (1996), service recovery is implemented to resolve problems before customers start to complain or leave with dissatisfaction. The purpose of service recovery is to “seek out and response to service failures” (Johnston, 1995) Service recovery is a part of service philosophy management, which enhances customer satisfaction as the key purpose of business (Hart et al., 1990)
From the firms’ standpoint, service recovery not only allows the service firm to converse the failure but also offer a second chance to satisfy the customer’s expectations (Sparks & McColl-Kennedy, 2001; Boshoff, 2007). A loyal customer tends to repurchase at the same place, spread positive recommendations to others.
Recovery management is considered to have an important effect on the evaluation of customers because they tend to be more emotionally when they involved in recovery service compared to the routine service (Bitner et al., 1990).
Hart, Heskett, and Sasser (1990) suggested that customers who experienced service failure which was followed by an acceptable recovery were more satisfied and more loyalty and willing to spread positive word of mouth than customers who have not experienced service failure at all.
Research of Warden, Huang, & Wu (2008) analyzed 342 people who reported more than 684 service failures to identify eight specific recovery actions for restaurants including discount free food, management intervention, coupon, apology, dish replacement, correction, and no action. According to Bitner et al.’s’ general types of service recovery strategies (1990), 8 recovery actions in restaurant includes: Compensation strategies (discount, free food, coupon); Assistance strategies (management intervention, replacement, correction, apology); and No action strategy.
7
2.3 Customer Satisfaction
Customer satisfaction is one of the main focuses in consumer behavior and marketing literature (Ghalandari, Babaeinia, and Jogh 2012). No companies can disregard the importance of bringing the best service to customer achieve the greatest customer satisfaction. In general, customer satisfaction can be explained as reactions to the enjoyable fulfillment of a customer’s needs, wants, or desires (Olive,1997). Satisfaction is an emotion evaluation, and thus it may lead to positive or negative feeling (Andreassen,2000) and it can result in loyalty and word of mouth (Nikbin,2012).
In service recovery context, customer satisfaction or recovery satisfaction is defined as a positive status of emotion due to the problem resolved by service provider. According to Kuo and Wu (2012), recovery satisfaction is different from customers’ satisfaction because recovery satisfaction is described as the customers’ satisfaction with the secondary service (corrective service) offered by a service provider after a service failure. According to equity theory, “customers will be satisfied (positive inequity) when they find that the ratio of inputs to outcomes for themselves is greater than the ratio of inputs to outcomes for the referent person or group” (Oliver & Swan, 1989).
Most satisfaction models connect satisfaction with positive outcomes such as loyalty and positive word-of-mouth. Moreover, consumer satisfaction is believed to boost the firm’s profitability (Oliver,1997). Satisfaction improves profitability by gaining market share, achieve customer loyalty, improving a brand’s reputation, increasing margins, and other strategies (Barsky and Nash, 2003).
2.4 Perceived Justice
Customers’ assessment of service recovery offered by service provider is termed perceived justice (Rio-Lanza et al., 2008; Schiffman & Kanuk, 2007). Ha &Jang 2009) also defined perceived justice as the professed fairness of a firm’s recovery effort. Cohen (2001) in his study suggested that perceived justice is associated with reasoning and behavioral reactions to result, and the result of using services could influence customer emotions and behaviors. Adams (1963) stated that justice theory appeared in every exchange in life, when people consider the inputs with the results then compare them with others in similar circumstances to make assessment. In the situation that
8
there is an equivalent balance between them, the exchange is perceived as ‘fair’, but if the results fail to meet the customer’s expectations, these outcomes are considered unfair. Moreover, customers evaluate perception of fairness by 3 following factors: procedural fairness, outcomes, and interactional treatment (Smith et al., 1999; Tax et al., 1998; Goodwin and Ross,1992)
In service recovery literature, justice theory appeared to be the main theoretical framework for assessing the effectiveness of firms’ service recovery. The framework stated that the level of satisfaction and the intention behavior in the future of customers depends on their evaluation of how fairly they are being treated (McColl-Kennedy & Sparks, 2003).
For service recovery context, previous studies suggest three dimensions of justice: distributive justice, procedural justice and interactional justice.
2.4.1 Distributive Justice
Distributive justice emphases on the outcome fairness and compensation offered for customers’ damage and/or inconvenience (Smith et al., 1999; Tax et al., 1998). For example, many service providers provide different combinations of credits, refunds, discounts and apology to remain relationship with the unsatisfied customers.). Distributive justice is also clarified by the professed equity of an outcome or a decision and explained as the allocation of costs and benefits in terms of exchange relationships (Smith et al., 1999; Homans, 1961). Furthermore, distributive justice can also be defined in term of nonmonetary which includes cost incurred, emotions, and ego benefits (Sparks and McColl-Kennedy,2001).
The concept of distributive justice is the outcome of the society’s exchange theory that focused on the part of justice in determining future behaviors (Adams, 1963). Equity theory is the core proponent of distributive justice is (Pinder, 1998). According to equity theory, customers can be satisfied with the outcome-to-input proportion of an individual that greater than others’. By contrast, if a person’s outcome-to-input ratio is smaller than another source’s outcome-to-input ratio, it will lead to dissatisfaction. That means customers want to follow their outcomes to maximize gains and minimize losses (Adams, 1965).
McCollough, et al. (2000) suggested that distributive justice and interactional justice can essentially predict recovery satisfaction. Spark and McColl-Kennedy (2001) showed the existence
9
of the influence of perceived justice on customer satisfaction in a hotel industry. A similar study was conducted by Holbrook Jr. and Kulik (2001), stated that justice is healpful in understanding a customer’s reations in a service background. Thus, this argument leads to the following hypothesis: H1: Distribute justice will have a positive influence on customer satisfaction
2.4.2 Procedural Justice
Procedural justice can be defined as the perceived justice of the procedures, policies, and criteria used by the service firms in the result of an argument or compromise (Blodgett, 1997). One crucial factor in procedural justice is the speed or time taken to solve the problem (Tax, Brown, and Chandrashekaran, 1998). Therefore, it is important to make sure that immediate action is taken to resolve customer’s inconvenience. This can be attained by having less bureaucracy, and employees should be trained how to response when service failure happens. Since procedural justice is mostly relevant to service business strategies, this perception deals with subjects of accessibility and promptness (Blodgett Hill, & Tax, 1997; Tax, Brown, & Chandrashekaran, 1998) Procedural justice is vital in service recovery, because a consumer may be pleased with the recovery strategy being provided, but they may become dissatisfied with the slow procedures (Kelley et al., 1993). Based on this study, it can be stated that when customers experience fair process, they satisfied. The procedure could be considered equity, if it is unbiased, consistent, and impartial, and emphasizes on interests of all parties and is created on accurate information and ethical values (Blodgett et al., 1997). Under this argument, the following hypothesis is proposed: H2: Procedural justice will have a positive influence on customer satisfaction
2.4.3 Interactional Justice
Interactional justice refers to how customers be treated during the recovering process. To be more detailed, interactional justice focuses person-to-person interactions during the recovery process. It means the assessment of the degree to which the customers have experienced impartiality in human interactions from the service provider (in this case: employees, managers) during the recovery process. For example, in the research, it has been shown that courtesy and empathy (Tax and Brown,1998) and politeness, concern and neutrality (Sparks and McColl-Kennedy,2001) can positive affect customers’ overall assessments of justice.
10
Blodgett et al. (1997) claimed the importance of interactional justice in the research of service recovery and failure. In their experimental study, Tax, Brown, and Chandrashekaran (1998) emphasized that interactional justice is a strong predictor of customer satisfaction and trust. A study of Namkung and Jang (2009) on restaurants in the US stated that interactional justice can enhance customer retention by increased the satisfaction.
In the context of interactional justice, it is shown that customers should be treated with the proper respect, courtesy and sincerity (Maxham & Netemeyer, 2002). Regarding to previous literature, social interactions are crucial in the sharing economy business models. In terms of service management, interactional justice is one of the principal factors in predicting customer satisfaction and loyalty (Grönroos, 1994).
Thus, this argument leads to the following hypothesis:
H3: Interactional justice will have a positive influence on customer satisfaction
2.5 Customer Loyalty
Customer loyalty is the closest stage to the repurchasing behavior of customers. Customer loyalty can be defined as a consequence of all the experiences including emotional involvements physical interactions, and value chain moments that a customer has with a service provider (Mascarenhas et al., 2006).
Jones and Sasser (1995) also defined customer loyalty is the willingness of a customer to continue repurchase a specific product or service. According to their study, there are two forms of customer loyalty: short-term and long-term. The first one is long-term customer loyalty, which describes a customer that will not willingly switch to another business provider. On the other hand, those with short-term loyalty are likely to turn to a different business providers for a better same service. Customer loyalty depends in whether a consumer will continue to consume from the same business provider, referred as the competitiveness core of a business in the market. Since a highly loyal customer is possible to lead more potential customers to the firm, many providers consider achieving customer loyalty as one of their primary business goals.
Fornell (1992) offers a method to measure customer loyalty in terms of repurchase intention and price tolerance. Similar to Jones and Sasser (1995), Oliver (1999) categorizes loyalty into two
11
kinds: short-run and long-term. However, Oliver measures short-run loyalty by word-of-mouth intention, complaints and post purchase recommendation behavior. By contrast, long-term loyalty is defined by four distinct parts: active, conative affective and cognitive. Srinivasan et al. (2002) suggested two main factors for measuring loyalty: price tolerance and word-of-mouth. A customer with greater loyalty will have a higher level of price tolerance and a superior willingness to make a recommendation to his or her friends.
Sasser and Reichheld (1990) claimed that a customer with satisfaction will have greater customer loyalty, which proposes a much greater opportunity for repeat consume in the future. In the customer satisfaction study of Anderson and Sullivan (1993), customer satisfaction was found to have a positive influence on customer-repeat purchase behavior, an explanation of customer loyalty. Hence, in this study the following hypothesis was proposed:
H4: Customer satisfaction will have a positive influence on customer loyalty
2.6 Word-of-mouth
Word-of-mouth (WOM) is a kind of information communicated between customers by sharing specific experiences about goods or services with others (Westbrook, 1987). WOM can be transferred by person-to-person talks for expressing customers’ assessment for a product, a brand and a service (Wangenheim 2005). Customers can simply spread their stories to others in the Internet and other social media devices these days.
WOM gains persuasion through the higher perceived reliability and honesty of the speaker. The main focus of earlier researchers is on the positive WOM (PWOM) which is spread by satisfied customers as they communicate with others. Thus, PWOM is usually seen as a highly potential source of new customers (Kelly, 1997; Rosen, 2000), especially in services.
It has been proposed that customers who are extremely satisfied with recovery strategy are “over the moon” and willing to tell others about their story (Schneider & Bowen, 1999). Thus, the following hypothesis is presented:
12
The connection between loyalty and word-of-mouth was proposed in the framework of Dick and Basu (1994) and few studies investigated the effect of loyalty on word-of-mouth (Reynolds and Arnold, 2000; Sichtmann, 2007). To further clarify the link between loyalty and word-of-mouth, De Matos and Vargas Rossi (2008) suggested that customers who are loyal to a service provider are more willing to spread positive recommendations of the company to group members. On the other hand, customers who are disloyal and moreover, turn to other providers are more likely to give negative word-of-mouth about the firm. Even previous research reinforced the effect of loyalty on word-of-mouth however the connection between the two concepts in the literature of service failure and recovery is still remains to be seen. Under this argument, the following hypothesis is proposed:
H6: Customer loyalty will have a positive influence on word-of-mouth intention.
2.7 Demographic factors
Demographic data allows researchers to acquire characteristics of their sample thus making the classification of the information more meaningful (Elanain, 2003).
2.7.1 Demographic factors and customer satisfaction
Bryant et al. (1996) conducted a research on more than 400 companies using the American Customer Satisfaction Index (ACSI) and suggested that there is significant relationship and differences in the levels of satisfaction among demographic groups.
Palvia and Palvia (1999) found out that age is a significant determining factor of satisfaction in information technology industry. Oyewole (2001) conducted a study about customer satisfaction with airline services reported also that gender, occupation, education have significant effect on customer satisfaction, while age and household income had no influence.
Other studies found that there are differences in customer behavior when it involves gender (Foucault &Scheufele, 2002)
Education level is a critical demographic factor because as customers `become more educated they demand different products and different levels of service (Kent & Omar, 2003).
13
Income has a relationship with purchasing decisions, thus high-income customers gather information prior to buying a product and this may have an influence on satisfaction (Homburg & Giering, 2001
Thus, we have following hypothesis:
H7.1: There is a difference in satisfaction between male and female customers.
H7.2: There is a difference in satisfaction among customers from different age groups. H7.3: There is a difference in satisfaction among customers from different educational background.
H7.4: There is a difference in satisfaction among customers from different occupations. H7.5: There is a difference in satisfaction among customers with different income level.
2.7.2 Demographic factors and customer loyalty
Regarding the relationship between loyalty and age, some studies discovered these issues for fast moving consumer goods (FMCG). In a study in the USA, Uncles and Ehrenberg (1990) found that there was no difference in loyalty between younger and older generation of consumers
The psychological character of females shows that they may be more loyal to a brand, especially in service in comparison to males. This can be explained by females are known to generally put a highe value on long-term relationships or commitments and tend to have a more feeling in decision making.
Studies have found that income and customer loyalty are related (Crask and Reynolds, 1978; Korgaonkar et al., 1985; Zeithaml, 1985). Zeithaml (1985) also found that consumption related decisions bear large impact of income as higher income allows more choices to the costumers making them less loyal compared to costumers in lower income group. Homburg and Giering (2001) noted that lower income positively influences the customer satisfaction – repurchase behavior relationship as it tends to be stronger when costumers earn less.
14
This can be explained with the findings of Farley (1964); Walsh and Mitchell (2005) who pointed that higher income is generally related to higher educational levels and higher ability to process information which play an important role in this context.
Under this argument, the following hypothesis is proposed:
H8.1: There is a difference in loyalty between male and female customers.
H8.2: There is a difference in loyalty among customers from different age groups. H8.3: There is a difference in loyalty among customers from different educational background.
H8.4: There is a difference in loyalty among customers from different occupations. H8.5: There is a difference in loyalty among customers with different income level.
2.7.3 Demographic factors and word-of-mouth
The relationship between demographic factors and WOM still remain to be discovered. There is no relevant research focus on determine how demographic factors affect the WOM intention. So, we assume that there is a connection between them that people with different background may have different WOM intention.
Thus, we have following hypothesis
H9.1: There is a difference in WOM intention between male and female customers.
H9.2: There is a difference in WOM intention among customers from different age groups. H9.3: There is a difference in WOM intention among customers from different educational background.
H9.4: There is a difference in WOM intention among customers from different occupations. H9.5: There is a difference in WOM intention among customers with different income level.
15
Chapter 3 METHODOLOGY
3.1 Research Design
The descriptive research method was used to gathering the needed information for this study. This method allows researcher to interpret the theoretical meaning of the findings and hypothesis development for further studies. Furthermore, this study applied a questionnaire type of descriptive research method which enables researcher to collect data from the respondents without having any difficulties in answering the questions. More specifically it addressed the following research purpose: to examine the influence of perceived justice on satisfaction and customer loyalty after service failure happened in restaurant setting. The questionnaire was conducted among customers of fast-food restaurants in Vietnam.
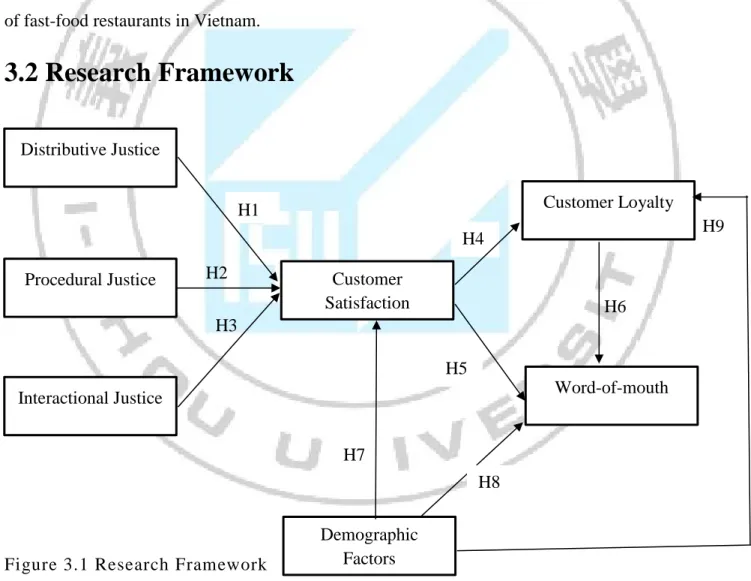
3.2 Research Framework
Figure 3.1 Research Framework
H5 H4 H1 H2 H3 H6 H7 H8 H9 Distributive Justice Procedural Justice Interactional Justice Customer Satisfaction Customer Loyalty Word-of-mouth Demographic Factors
16
3.3 Sampling Design
The sample for this study was collected by a simple sampling method from the identified sampling frame. According to Yoon’s reseach (1999) the author used 300 samples for questionnaire to interview customers in a restaurant setting and all factors had met the criteria of reliability analysis. Usable research sample was around 251 samples.
Therefore, sampling method for this study was convenience sampling and based on previous studies to choose the response sample for processing research. Total sample size for this study was 255.
3.4 Data Collection
To meet the requirements previously outlined as necessary for a valid test of the research hypotheses, it was decided to collect data by surveying customers of various fast-food restaurants in Vietnam. After the pre-test to adjust and improve the questionnaire, the questionnaire was officially released. Customers which are waiting in the restaurant or finished having a meal were approached and their cooperation is requested. The respondents were firstly introduced the purpose of this study then provided a fully version of the questionnaire that allow them to fill immediately. To accomplish the questionnaire, the respondents were asked to recall their latest experience about the service failure in a fast-food restaurant and the compensation they have been offered by the restaurant after service failure event. It was estimate that the questionnaire may take about five minutes to complete. It was believed that the use of consumers that actually engaged in the service act would help ensure realism, increase external validity, and lessen concerns regarding consumers' ability to project their actions and affective responses.
However, there was a second method used to collect data from the customers in case of some potential problems could happen when directly distribute the questionnaire in the restaurant. The researcher also distributed the survey via the internet, which means via the websites or fan-pages of some popular fast-food brands by provide a link to the questionnaire with the request followed in the main page in those websites. The survey also was sent to the email of those websites’ members which are the regular customers of those restaurants in case they were not notice of the survey request in the websites.
17
3.5 Measurements and Questionnaire Design
3.5.1 Questionnaire Design
Various item scales were used to measure each construct in this study. Validated scales from previous studies were used after a minor adjustment. In this study, questionnaire was divided into four main parts. In the first three parts, respondents were invited to recall the latest time that they experienced service failure in a restaurant.
Part I included open-ended questions with multiple choices to examine the main service failures happened in restaurants and what kind of compensation that customers have been offered after service failure.
Part II included questions that measured on a five-point Likert-type scale (from 1 to 5 according to ascending level included: 1= strongly disagree, 2 = disagree, 3 = neutral, 4 = agree. 5 = strongly agree) to reflect perceived justice process. It means to examine the customers’ opinion and feelings about the compensation offered by the restaurant after service failures.
Part III also contained questions are on the five-point scale from “strongly disagree (1)” to “strongly agree (5)”. The purpose was to determine the level of satisfaction and the future behavior of customers after receiving the restaurant’s compensation.
Part IV involved closed-ended questions that used to enable the respondents to describe their identity, personal information.
Part II and III of the survey instrument was targeted at verifying the hypotheses.
3.5.2 Measurements
For this study, in part I, common service failures and recover strategy in restaurants were adopted from Ilan Silber, Aviad Israeli (2016).
In part II, perceived justice was measured with instruments developed by Smith et al. (1999) and Blodgett et al. (1997). Four items were used to reflect the concept of distributive justice while five items were used to reflect the model of procedural justice and five items to measure the concept of interactional justice.
18
Table 3.1 Measurement items of Distributive justice, Procedural justice, Interactional justice
On the other hand, in part III, customer satisfaction was measured using the scale developed
Construct Measurement items Sources
Distribute justice
The compensation I received was fair. I did get what I deserved.
In resolving the problem, the restaurant gave me what I needed.
Given the circumstances, I feel that the restaurant offered adequate compensation. Smith et al. (1999); Blodgett et al. (1997) Procedural justice
I think my problem was resolved in the right way. I think the restaurant has good policies and practices for dealing with my problems.
My complaint was resolved as quickly as it should have been.
The restaurant showed adequate flexibility in dealing with my problem.
The restaurant tried to solve my problem as quickly as possible. Blodgett et al. (1997) ; Smith et al. (1999), Rio-Lanza et al. (2008) Interactional justice
The restaurant was appropriately concerned about my problem.
The restaurant put the proper effort into resolving my problem.
The restaurant proved able and to have enough authority to solve my problem.
I was treated with courtesy and respect.
The restaurant showed interest in being fair when solving my problem.
The treatment and communication with managers of the restaurant to solve my problem were acceptable.
Blodgett et al. (1997) ; Smith et al. (1999), Rio-Lanza et al. (2008)
19
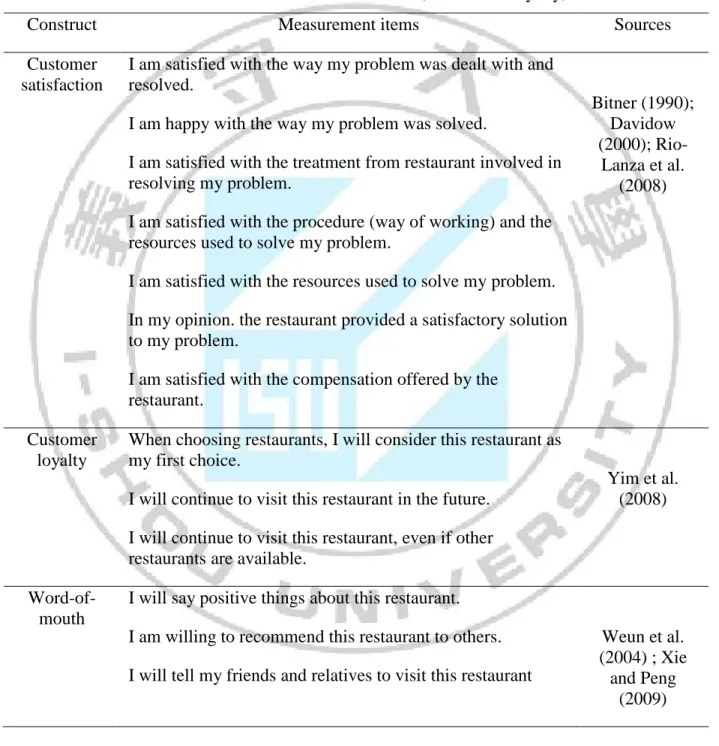
by Bitner (1990), Rio- Lanza et al. (2008), and Davidow (2000) with seven questions. To measure customer loyalty construct, this study used three items adapted from Yim et al. (2008) and to measure the concept of word-of-mouth, three questions that adapted from Weun at al. (2004); Xie and Peng (2009) were used.
Table 3.2 Measurement items of Customer satisfaction, Customer Loyalty, Word-of-mouth
Construct Measurement items Sources
Customer satisfaction
I am satisfied with the way my problem was dealt with and resolved.
I am happy with the way my problem was solved.
I am satisfied with the treatment from restaurant involved in resolving my problem.
I am satisfied with the procedure (way of working) and the resources used to solve my problem.
I am satisfied with the resources used to solve my problem. In my opinion. the restaurant provided a satisfactory solution to my problem.
I am satisfied with the compensation offered by the restaurant. Bitner (1990); Davidow (2000); Rio-Lanza et al. (2008) Customer loyalty
When choosing restaurants, I will consider this restaurant as my first choice.
I will continue to visit this restaurant in the future. I will continue to visit this restaurant, even if other restaurants are available.
Yim et al. (2008)
Word-of-mouth
I will say positive things about this restaurant. I am willing to recommend this restaurant to others. I will tell my friends and relatives to visit this restaurant
Weun et al. (2004) ; Xie and Peng
20
3.6 Data Analysis
After coding and data cleaning, the questionnaire data was entered the computer database for analysis. The analysis use of data for the subject was based on the application software of economic and social sciences SPSS 20.0 and Excel. To analyze the data, descriptive statistics, reliability analysis, correlation analysis, regression analysis, One-way ANOVA and Independent T-test were used.
3.6.1 Descriptive Statistics
Descriptive analysis is used to describe personal information of respondents. At this stage, information of the participant’s such as gender, age, educational background, occupation, income was gathered and analyzed. Descriptive analyses comprise means and standard deviations. In addition, descriptive analysis was used to illustrate minimum and maximum scores of each variable to help providing more information about the variables.
3.6.2 Reliability and Validity Analysis
In this study, the internal consistency analysis (Cronbach’s Alpha) was employed to check the reliability of each factors. According to study of Hair et al. (2006), if the value of Cronbach’s alpha is greater than 0.7, it can be concluded that the factor has high reliability and if alpha smaller than 0.3 indicates that the factor has low reliability. After that, Exploratory Factors Analysis (EFA) was used to extract the factor measurement and test the constructive validity of each factor.
3.6.3 Regression and Correlation Analysis
Correlation analysis is a statistical technique used to describe the relationship between two variables and quantitative the strength of their relationship. Two factors are seen having correlation if they vary together, then these factors can be used to analyze correlation coefficient. In this study, Pearson's correlation coefficient analysis was used to explore the relationship among 3 dimensions of Perceived Justice and Customer Satisfaction, as well as among Customer Satisfaction, Customer Loyalty and WOM intention.
Regression uses to define a mathematical equation which can be used to predict the value of one factor based on the value of one or more other factors and can therefore be used to illustrate
21
the relationship between them (O’Brien, 1981). In this study, regression analysis was used to analyze the relationship among 3 dimensions of Perceived Justice and Customer Satisfaction, as well as among Customer Satisfaction, Customer Loyalty and WOM intention.
3.6.4 Independent T-test
T-test is statistical test that determines whether there is a statistically significant difference between the means in two unrelated groups. In this study, T-test was used to investigate is there any difference in Satisfaction, Loyalty and WOM intention between male and female customers.
3.6.5 One-way ANOVA
One-way ANOVA analysis was used to test differences in the evaluation of target groups (age, educational background, occupations and income) by investigating these variables: Satisfaction, Loyalty and WOM intention. If there is existence of any difference among groups, it was analyzed deeper by using Post hoc Test to test specific groups and investigate the difference assessment with method tested Scheffe if the case of variance among groups are equally.
22
Chapter 4 DATA ANALYSIS
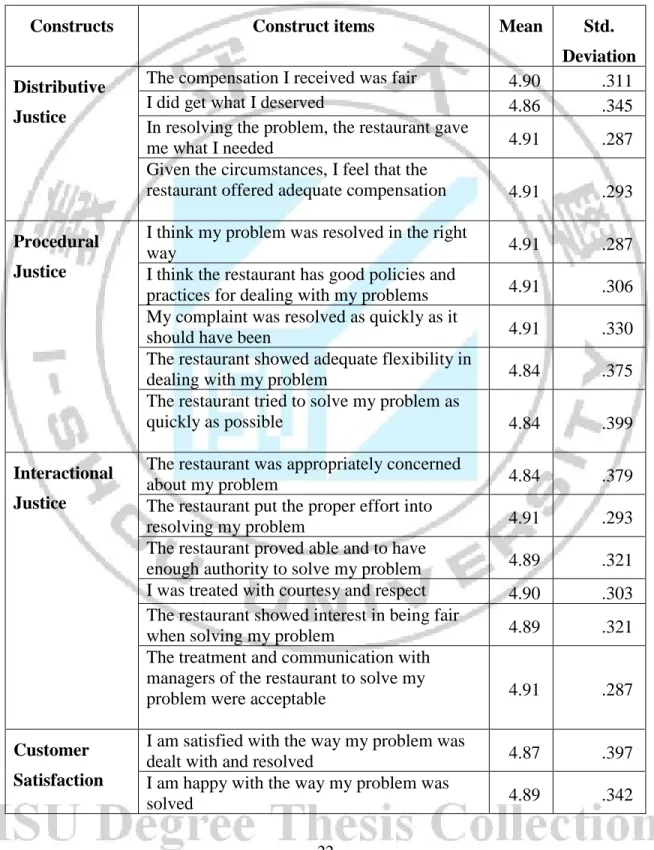
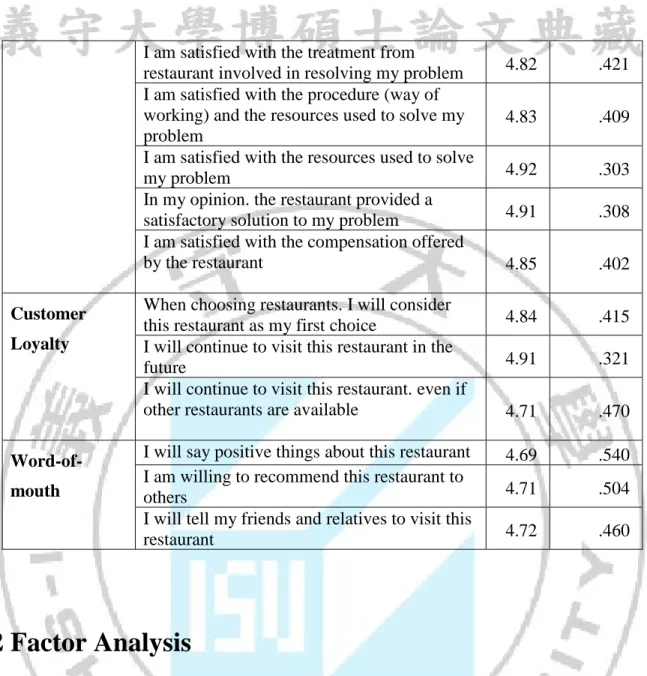
4.1 Descriptive Statistics
Table 4.1 Descriptive Statistic Findings
Constructs Construct items Mean Std. Deviation Distributive
Justice
The compensation I received was fair 4.90 .311
I did get what I deserved 4.86 .345
In resolving the problem, the restaurant gave
me what I needed 4.91 .287
Given the circumstances, I feel that the
restaurant offered adequate compensation 4.91 .293
Procedural Justice
I think my problem was resolved in the right
way 4.91 .287
I think the restaurant has good policies and
practices for dealing with my problems 4.91 .306 My complaint was resolved as quickly as it
should have been 4.91 .330
The restaurant showed adequate flexibility in
dealing with my problem 4.84 .375
The restaurant tried to solve my problem as
quickly as possible 4.84 .399
Interactional Justice
The restaurant was appropriately concerned
about my problem 4.84 .379
The restaurant put the proper effort into
resolving my problem 4.91 .293
The restaurant proved able and to have
enough authority to solve my problem 4.89 .321 I was treated with courtesy and respect 4.90 .303 The restaurant showed interest in being fair
when solving my problem 4.89 .321
The treatment and communication with managers of the restaurant to solve my
problem were acceptable 4.91 .287
Customer Satisfaction
I am satisfied with the way my problem was
dealt with and resolved 4.87 .397
I am happy with the way my problem was
23
I am satisfied with the treatment from
restaurant involved in resolving my problem 4.82 .421 I am satisfied with the procedure (way of
working) and the resources used to solve my problem
4.83 .409
I am satisfied with the resources used to solve
my problem 4.92 .303
In my opinion. the restaurant provided a
satisfactory solution to my problem 4.91 .308 I am satisfied with the compensation offered
by the restaurant 4.85 .402
Customer Loyalty
When choosing restaurants. I will consider
this restaurant as my first choice 4.84 .415 I will continue to visit this restaurant in the
future 4.91 .321
I will continue to visit this restaurant. even if
other restaurants are available 4.71 .470
Word-of-mouth
I will say positive things about this restaurant 4.69 .540 I am willing to recommend this restaurant to
others 4.71 .504
I will tell my friends and relatives to visit this
restaurant 4.72 .460
4.2 Factor Analysis
Table 4.2 The KMO and Bartlett’s Test of Distributive Justice, Procedural Justice, Interactional Justice, Customer satisfaction, Customer Loyalty, Word-of-mouth
Constructs KMO value
Bartlett’s Test
Approx. Chi-Square df p-value
Distributive Justice .794 1524.051 6 .000 Procedural Justice .657 1823.577 10 .000 Interactional Justice .825 3116.220 15 .000 Customer Satisfaction .502 3005.763 21 .000 Customer Loyalty .656 252.365 3 .000 Word-of-mouth .761 941.853 3 .000
24
In this stage, Exploratory Factor Analysis (EFA) was used to extract the factor dimension and test the constructive validity of each dimension, with the application of Varimax rotation, value of Kaiser – Meyer – Olkin (KMO) was in range of 0.5 to 1 as suggested by Hair et al. (2006) and the p-value in Barlett’s Test = .000. The data of Distributive Justice, Procedural Justice, Interactional Justice, Customer satisfaction, Customer Loyalty, Word-of-mouth was analyzed.
4.2.1. Distributive Justice
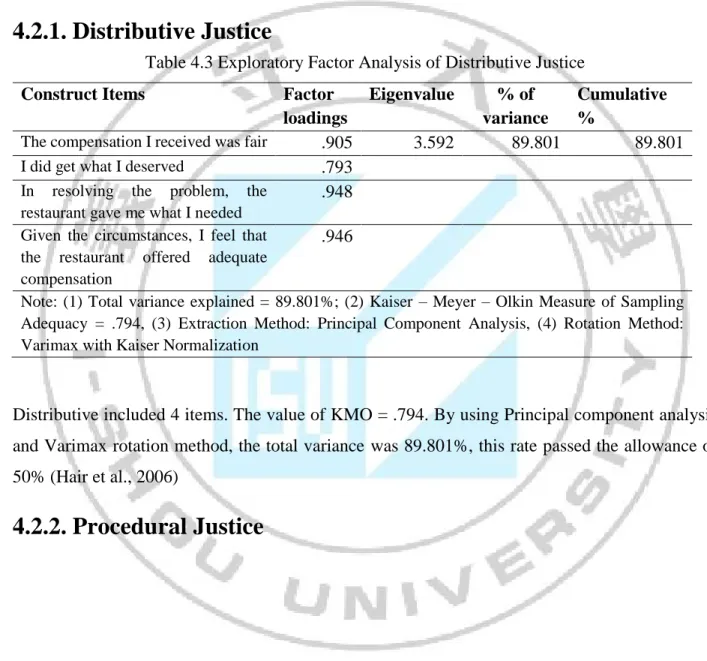
Table 4.3 Exploratory Factor Analysis of Distributive Justice
Construct Items Factor loadings
Eigenvalue % of variance
Cumulative %
The compensation I received was fair .905 3.592 89.801 89.801 I did get what I deserved .793
In resolving the problem, the restaurant gave me what I needed
.948 Given the circumstances, I feel that
the restaurant offered adequate compensation
.946
Note: (1) Total variance explained = 89.801%; (2) Kaiser – Meyer – Olkin Measure of Sampling Adequacy = .794, (3) Extraction Method: Principal Component Analysis, (4) Rotation Method: Varimax with Kaiser Normalization
Distributive included 4 items. The value of KMO = .794. By using Principal component analysis and Varimax rotation method, the total variance was 89.801%, this rate passed the allowance of 50% (Hair et al., 2006)
25
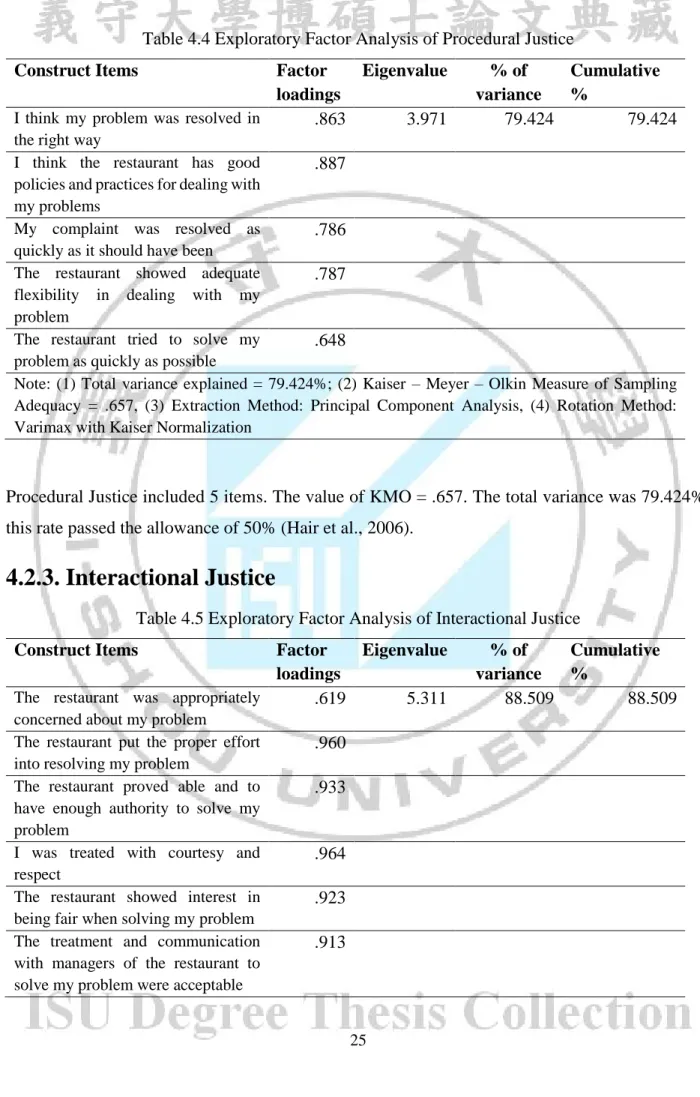
Table 4.4 Exploratory Factor Analysis of Procedural Justice
Construct Items Factor loadings
Eigenvalue % of variance
Cumulative %
I think my problem was resolved in the right way
.863 3.971 79.424 79.424
I think the restaurant has good policies and practices for dealing with my problems
.887
My complaint was resolved as quickly as it should have been
.786 The restaurant showed adequate
flexibility in dealing with my problem
.787
The restaurant tried to solve my problem as quickly as possible
.648
Note: (1) Total variance explained = 79.424%; (2) Kaiser – Meyer – Olkin Measure of Sampling Adequacy = .657, (3) Extraction Method: Principal Component Analysis, (4) Rotation Method: Varimax with Kaiser Normalization
Procedural Justice included 5 items. The value of KMO = .657. The total variance was 79.424%, this rate passed the allowance of 50% (Hair et al., 2006).
4.2.3. Interactional Justice
Table 4.5 Exploratory Factor Analysis of Interactional Justice
Construct Items Factor loadings
Eigenvalue % of variance
Cumulative %
The restaurant was appropriately concerned about my problem
.619 5.311 88.509 88.509
The restaurant put the proper effort into resolving my problem
.960 The restaurant proved able and to
have enough authority to solve my problem
.933
I was treated with courtesy and respect
.964 The restaurant showed interest in
being fair when solving my problem
.923 The treatment and communication
with managers of the restaurant to solve my problem were acceptable
26
Note: (1) Total variance explained = 88.509%; (2) Kaiser – Meyer – Olkin Measure of Sampling Adequacy = .825, (3) Extraction Method: Principal Component Analysis, (4) Rotation Method: Varimax with Kaiser Normalization
Interactional Justice included 6 items. The value of KMO = .825. The total variance was 88.509 %, this rate passed the allowance of 50% (Hair et al., 2006).
4.2.4. Customer Satisfaction
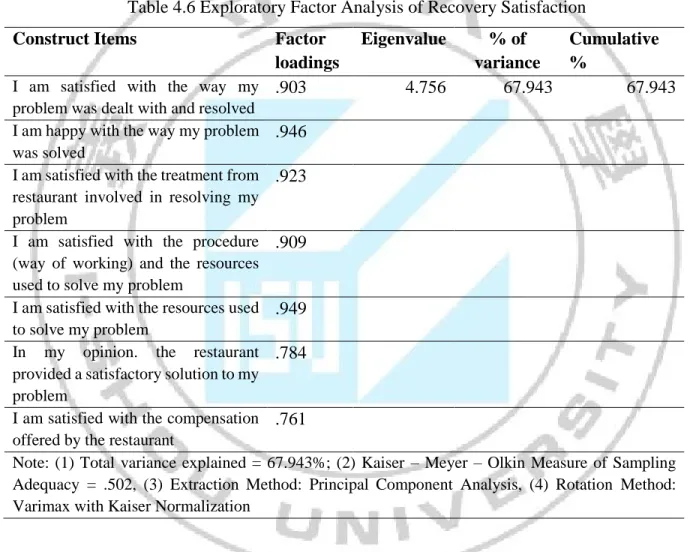
Table 4.6 Exploratory Factor Analysis of Recovery Satisfaction
Construct Items Factor loadings
Eigenvalue % of variance
Cumulative %
I am satisfied with the way my problem was dealt with and resolved
.903 4.756 67.943 67.943
I am happy with the way my problem was solved
.946 I am satisfied with the treatment from restaurant involved in resolving my problem
.923
I am satisfied with the procedure (way of working) and the resources used to solve my problem
.909
I am satisfied with the resources used to solve my problem
.949 In my opinion. the restaurant provided a satisfactory solution to my problem
.784
I am satisfied with the compensation offered by the restaurant
.761
Note: (1) Total variance explained = 67.943%; (2) Kaiser – Meyer – Olkin Measure of Sampling Adequacy = .502, (3) Extraction Method: Principal Component Analysis, (4) Rotation Method: Varimax with Kaiser Normalization
Customer satisfaction included 7 items. The value of KMO = .502. The total variance is 67.943 %, this rate passed the allowance of 50% (Hair et al., 2006).
27
4.2.5. Customer Loyalty
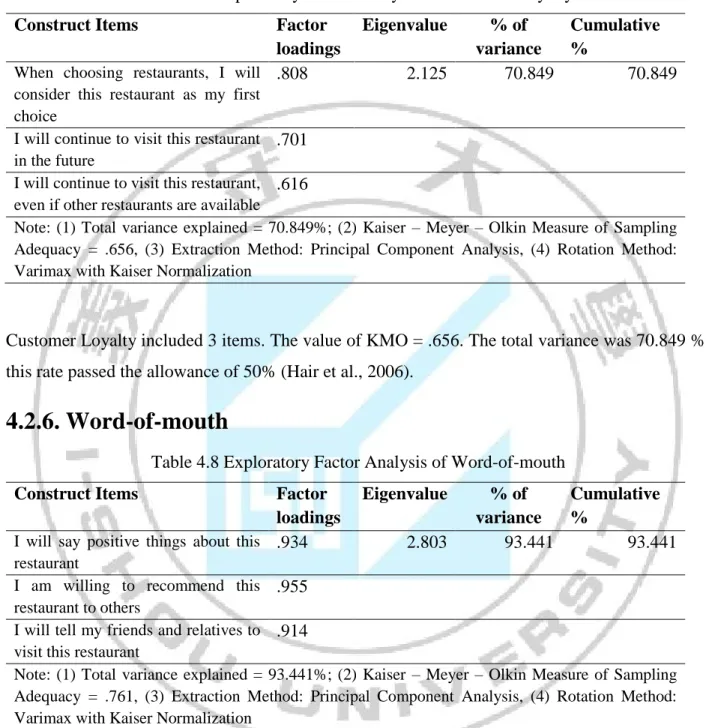
Table 4.7 Exploratory Factor Analysis of Customer Loyalty
Construct Items Factor loadings
Eigenvalue % of variance
Cumulative %
When choosing restaurants, I will consider this restaurant as my first choice
.808 2.125 70.849 70.849
I will continue to visit this restaurant in the future
.701 I will continue to visit this restaurant, even if other restaurants are available
.616
Note: (1) Total variance explained = 70.849%; (2) Kaiser – Meyer – Olkin Measure of Sampling Adequacy = .656, (3) Extraction Method: Principal Component Analysis, (4) Rotation Method: Varimax with Kaiser Normalization
Customer Loyalty included 3 items. The value of KMO = .656. The total variance was 70.849 %, this rate passed the allowance of 50% (Hair et al., 2006).
4.2.6. Word-of-mouth
Table 4.8 Exploratory Factor Analysis of Word-of-mouth
Construct Items Factor loadings
Eigenvalue % of variance
Cumulative %
I will say positive things about this restaurant
.934 2.803 93.441 93.441
I am willing to recommend this restaurant to others
.955 I will tell my friends and relatives to visit this restaurant
.914
Note: (1) Total variance explained = 93.441%; (2) Kaiser – Meyer – Olkin Measure of Sampling Adequacy = .761, (3) Extraction Method: Principal Component Analysis, (4) Rotation Method: Varimax with Kaiser Normalization
Word-of-mouth included 3 items. The value of KMO = .761. The total variance was 93.441 %, this rate passed the allowance of 50% (Hair et al., 2006)
28
4.3. Correlation and Regression Analysis
4.3.1. Correlation Test
In this study, Pearson's correlation coefficient analysis was used to explore the association among 3 dimensions of Perceived Justice, Customer Satisfaction, Customer Loyalty and WOM. (See Table 4.9)
Table 4.9. Correlation Coefficient Analysis
Mean SD 1 2 3 4 5 6 1. Distributive Justice 4.82 .36 .958 2. Procedural Justice 4.85 .33 .904** .927 3. Interactional Justice 4.89 .26 .782** .834** .968 4. Customer satisfaction 4.92 .17 .763** .774** .903** .920 5. Customer Loyalty 4.93 .17 .791** .798** .898** .969** .778 6. Word-of-mouth 4.93 .17 784** 797** 857** 914** 973** .963
Note: *: p< 0.05; **: p<0.01; ***: p< 0.001; The values in the diagonal line are the Cronbach’s Alpha
coefficients.
All three dimensions of Perceived Justice (Distributive Justice, Procedural Justice, Interactional Justice) were found to have relationships with Customer satisfaction (), because correlation coefficient between these variables had significant value < .05. (r=.763**; r=.774** and r=.903** respectively). In addition, Customer satisfaction had a relationship with Customer Loyalty (r=.969**) and WOM intention (r=.914**) because correlation coefficients among variables had the significant values < .05. Similarly, Customer Loyalty was also found to have a relationship with WOM (r=.973**),
Furthermore, Distributive Justice, Procedural Justice, Interactional Justice, Customer satisfaction, Customer Loyalty, Word-of-mouth were being analyzed to check reliability of every single item. Reliability coefficient above 0.7 is acceptable and α > 0.9 is considered excellent (George and Mallery, 2001, p. 217). From the results of table 4.9, Cronbach’s Alpha coefficients of 6 factors were high, all greater than 0.9 except Customer Loyalty (0.778).
29
4.3.2. Regression Analysis and Hypotheses Testing
Figure 4.1 Regression Findings
4.3.2.1 Regression Analysis of Distributive Justice, Procedural Justice,
Interactional Justice and Customer Satisfaction.
Adj. 𝑅2= 0.938 0.973*** Note: *: p<.05; **: p<.01; ***: p<.001 Adj. 𝑅2 = 0.825 Adj. 𝑅2= 0.946 Distributive Justice Procedural Justice Interactional Justice Customer Satisfaction Customer Loyalty Word-of-mouth
30
Table 4.10. Multiple regression analysis of relationship between Distributive Justice, Procedural Justice, Interactional Justice and Customer satisfaction
Model Summary
R 𝑅2 Adjusted 𝑅2 Std. Error of the Estimate Durbin-Watson .909 .825 .823 .07281 .355 ANOVA Model Sum of Squares
df Mean Square F Sig.
Regression 6.294 3 2.098 395.682 .000
Residual 1.331 251 .005
Total 7.624 254
Coefficients
Model Unstandardized Coefficients Standardized Coefficients t Sig. B Std. Error Beta (Constant) 2.061 .085 24.256 .000 Distributive Justice .105 .030 .219 3.524 .001 Procedural Justice -.059 .307 -.112 -1.591 .113 Interactional Justice .540 .032 .825 17.125 .000
According to Table 4.10, F= 395.682*** was explaining the change of Customer satisfaction by three dimensions of Justice (Distributive, Procedural and Interactional Justice). Adjusted 𝑅2= 82.3% means that three dimensions of perceived justice have 82.3% affected in the change
of Customer satisfaction.
In the Coefficients section, Beta of Distributive Justice= 0.219 and the significance = .000 so it can be concluded that Distributive justice has a positive influence on Customer Satisfaction. In addition, Beta of Interactional justice= 0.825 and the significance= .000 so it can be concluded that Interactional Justice has a positive relationship with Customer satisfaction. So H1:
Distributive Justice will have a positive influence on Customer satisfaction and H3:
Interactional justice will have a positive influence on Customer satisfaction was supported.
However, for Procedural Justice, Beta has the negative result ( -0.112). It can be explained by the correlation between Distributive justice and Procedural justice. According to Table 4.9, correlation coefficient between these two factors was high (0.904) so it means the
31
relationship between them was strong and it resulted in the negative Beta of Procedural justice. These two factors cannot be used together in the regression to predict the change of Customer Satisfaction. So, in this study, only Distributive and Interactional justice were used to predict Customer satisfaction. H2: Procedural justice will have a positive influence on Customer
satisfaction was not supported.
4.3.2.2 Regression Analysis of Customer satisfaction and Customer loyalty.
Table 4.11. Regression analysis of relationship between Customer Satisfaction and Customer Loyalty
Model Summary
R 𝑅2 Adjusted 𝑅2 Std. Error of the Estimate Durbin-Watson .969 .938 .938 .04255 .490 ANOVA Model Sum of Squares
df Mean Square F Sig.
Regression 6.966 1 6.966 3847.541 .000
Residual .458 253 .002
Total 7.424 254
Coefficients
Model Unstandardized Coefficients Standardized Coefficients t Sig. B Std. Error Beta (Constant) .228 .076 3.005 .003 Customer Satisfaction .956 .015 .969 62.029 .000
The F value was 3847.541***, it explained the change of Customer Loyalty by Customer Satisfaction. In addition, adjusted R2 is 93.8% meaning Customer Satisfaction has 93.8% affected
in the change of Customer Loyalty. Beta value of Customer Satisfaction= 0.969 and the significance = .000.
Consequently, it can be concluded that H4: Customer Satisfaction will have a positive
32
4.3.2.3. Regression Analysis of Customer Satisfaction, Customer Loyalty and
Word-of-mouth
According to Table 4.9, the correlation coefficient between Customer Satisfaction and Customer Loyalty was high (r= 0.969) so these two factors cannot be used together to predict mouth. So, this study used the regression analysis for Customer Loyalty and Word-of-mouth only.
Table 4.12. Regression analysis of relationship between Customer loyalty and Word-of-mouth
Model Summary
R 𝑅2 Adjusted 𝑅2 Std. Error of the Estimate Durbin-Watson .973 .947 .946 .04163 1.995 ANOVA Model Sum of Squares
df Mean Square F Sig.
Regression 7.786 1 7.786 4493.116 .000
Residual .438 253 .002
Total 8.224 254
Coefficients
Model Unstandardized Coefficients Standardized Coefficients t Sig. B Std. Error Beta (Constant) -.121 .075 -1.609 .109 Customer loyalty 1.024 .015 .973 67.031 .000
The F value was 4493.116***, it explained the change of WOM by Customer loyalty. In addition, adjusted R2 is 94.6% meaning Customer Satisfaction has 94.6% affected in the change of Customer Loyalty. Beta value of Customer loyalty= 0.973 and the significance = .000.
Consequently, it can be concluded that H6: Customer loyalty will have a positive
influence on WOM was supported.
H5: Customer satisfaction will have a positive influence on Word-of-mouth intention
33 Summary of the results of Regression Analysis
Hypothesis Result
Hypothesis 1: Distribute justice will have a positive influence on
customer satisfaction.
Supported
Hypothesis 2: Procedural justice will have a positive influence on
customer satisfaction.
Not supported
Hypothesis 3: Interactional justice will have a positive influence on
customer satisfaction.
Supported
Hypothesis 4: Customer Satisfaction will have a positive influence on
Customer Loyalty.
Supported
Hypothesis 5: Customer Satisfaction will have a positive influence on Word-of-mouth intention
Not supported
Hypothesis 6: Customer Loyalty will have a positive influence on Word-of-mouth intention
34
4.4. Independent Sample T-test
The purpose of independent sample T-test is to investigate if there is a significant difference in Satisfaction, Loyalty and Word-of-mouth intention between male and female respondents.
(7) Hypothesis 7.1: There is a difference in satisfaction between male and female customers (8) Hypothesis 8.1: There is a difference in loyalty between male and female customers
(9) Hypothesis 9.1: There is a difference in WOM intention between male and female customers
4.4.1 Gender Difference in Satisfaction.
(7) Hypothesis 7.1: There is a difference in satisfaction between male and female customers
Table 4.13. The different between Male and Female in Satisfaction
Group Statistics
Gender N Mean Std. Deviation Std. Error Mean
Male 132 4.9372 .15648 .01362
Female 106 4.9634 .09237 .00897
Independent Samples Test
Levene’s Test for Equality of
Variances
T-test for Equality Means
F Sig. t df Sig. (2-tailed) Mean Difference Std. Error Difference Equal variances not assumed 7.886 .005 -1.604 218.114 .110 -.02616 .01631
As shown in Table 4.13, the sig. value in Levene’s Test = .005 < .05. Thus, the variances are not equal and Equal variances not assumed should be used to evaluate equality of hypothesis
35
7.1. In addition, p-value in t-test = 0.110 > 0.05 hence, the H7.1 was not supported, there is no difference between male and female participants in Satisfaction.
4.4.2 Gender Difference in Loyalty.
(8) Hypothesis 8.1: There is a difference in loyalty between male and female customers
Table 4.14. The different between Male and Female in Loyalty
Group Statistics
Gender N Mean Std. Deviation Std. Error Mean
Male 132 4.9472 .15375 .01338
Female 106 4.9768 .07911 .00768
Independent Samples Test
Levene’s Test for Equality of
Variances
T-test for Equality Means
F Sig. t df Sig. (2-tailed) Mean Difference Std. Error Difference Equal variances not assumed 9.300 .003 -1.915 203.951 .057 -.02955 .01543
As shown in Table 4.14, the sig. value in Leveene’s Test = .003 < .05. Therefore, the variances are not equal and Equal variances not assumed should be used to evaluate equality of hypothesis 8.1. In addition, p-value in t-test= 0.057 > 0.05 hence, the H8.1 was not supported, there is no difference between male and female participants in Loyalty.
4.4.3 Gender Difference in Word-of-mouth intention.
(9) Hypothesis 9.1: There is a difference in WOM intention between male and female customers