行政院國家科學委員會專題研究計畫 成果報告
電子化政府的績效評估架構與分析:策略管理觀點
研究成果報告(精簡版)
計 畫 類 別 : 個別型 計 畫 編 號 : NSC 97-2410-H-004-102- 執 行 期 間 : 97 年 08 月 01 日至 98 年 10 月 31 日 執 行 單 位 : 國立政治大學公共行政學系 計 畫 主 持 人 : 施能傑 計畫參與人員: 此計畫無其他參與人員 報 告 附 件 : 出席國際會議研究心得報告及發表論文 處 理 方 式 : 本計畫涉及專利或其他智慧財產權,2 年後可公開查詢中 華 民 國 99 年 06 月 29 日
壹、研究計畫背景及研究問題
一、研究背景
電子化政府是過去十多年來政府服務模式轉變的世界性潮流 (Cabinet Office, 2000 & 2002; Curtin et al., 2003; Yong, 2003; Eifert & Puschel, 2004; OECD, 2004; Nixon & Koutrakou, 2007; Anttiroiko, 2008; 聯 合 國 設 置resources on e-government的連結網頁 http://www.uneca.org/aisi/nici/egov.htm);公共行政專業 教育中,這方面或稱政府資訊管理系統的研究或教學領域也成為公共管理的重要 主軸之一 (Garson, 2000)。台灣 1986 年起開始逐步建立稅務等幾個領域的大型資 訊系統,1991 年起又進行政府辦公室自動化工作,1996 年開始規劃運用網際網 路推動電子化政府的工作,實際執行的行動計畫包括「電子化/網路化政府中程 計畫 (1998 ~ 2000) 」、「電子化政府推動方案 (2001 ~ 2004) 」和「e化政府計畫 (2005 ~ 2007) 」等三個階段(行政院研考會,2005),目前又正執行另一個階段 的「優質網路政府計畫 (2008 ~ 2011)」(內容參見附件一,各階段計畫內容皆可 從 行 政 院 研 究 發 展 考 核 委 員 會 網 站 中 獲 取 (http://www.rdec.gov.tw/ct.asp?xItem=4160385&CtNode=12901&mp=100)。 美 國 Brown University的 Taubman Center for Public Policy自 2001 年起每年對一百多個 國家政府網站內容進行評比,台灣有三次名列第一 (2002, 2004, 2005) ,2007 年 列第三。台灣在World Econom ic Forum 所做的評估也有很好的表現,2006~2007 的年度報告顯示,整體網路環境整備度排名13,政府整備度排名 6,政府使用度 排名8。由此可見,台灣電子化政府是在短時間內推動最具成效的政府改造工作 (施能傑,2007),就公共行政領域而言,雖然算是較為近期的研究重點,但確 是對實務工作者和理論研究者都是有意義的課題。 二、台灣電子化政府的服務內容與重要性 台灣的電子化政府主要是由行政院研究發展委員會負責。經過幾年的規劃與 執行,特別是 2002 年後在數位台灣方案下的「e 化政府」計畫,推動供民眾使
用的10 項政府線上服務(政府整合服務單一入口、戶政 e 網通、地政 e 網通、 稅務e 網通、監理 e 網通、商工行政服務 e 網通、智慧財產權 e 網通、法務資訊 便民 e 化服務、全球投資審議管理資訊系統、衛生局所網路便民服務),供政府 員工運用的2 項政府效能提升計畫(公文交換 G2B2C,政府機關視訊聯網系統), 以及7 項政府數位資訊(國土資訊系統、全國檔案資訊系統、防救災資訊系統、 公共工程資訊系統、全國建築管理資訊系統、營建知識管理系統、防救災緊急通 訊系統整合建置計畫)。除了這些重大網路服務外,政府電子採購網、海關入口 網(通關自動化)、行政院公報資訊網、全國法規資料庫、全國就業 e 網、國家 網路智庫等等也都陸續提供使用,民眾和企業主分別透過自然人憑證和工商憑證 都可以安全地透過網路使用電子化政府(參見行政院研究發展考核委員會, 2006)。當然,目前中央政府和各地方政府本身,以及許多機關都設置有網站, 提供民眾接觸使用。 電子化政府確實提供了政府內部管理服務和外部公共服務的新工具,譬如 說,電子公文交換計畫每年節省的郵寄經費約 億元,更重要的是公文傳送速度 由天計改以分為計算單位,從中央政府到鄉鎮市公所,透過近萬條線路形成一個 網際網路,快速進行公文處理和交換,也進行重要緊急訊息的及時傳遞,政府員 工每日都依賴這樣的電子化運作模式處理業務。 民眾也習慣更依賴網際網路途徑和電子化政府互動,從簡單資訊查詢,到申 請表單下載、線上申辦業務、線上發表意見和參與電子意見調查等等。縱然仍存 有所謂的資訊數位落差狀況,但整體而言,多數民眾接受更便捷的服務模式。譬 如說,網路申報所得稅就是一個非常成功個案例,更多民眾和企業主直接利用網 路申報稅務,除了非常方便外,也真正節省許多交通和等候的社會成本。 再者,電子化政府也實際上帶動著政府服務流程的改造,單一申辦窗口,整 合跨機關或同一機關跨單位,有時甚至可以整合中央與地方政府間的業務,造成 組織實體尚未能重組改造前,在電子化下的虛擬式組織改造。政府單一入口網 (http://www.gov.tw/) 或不安全進口食品網都是這些功能的例子。 最後,電子化政府也實踐民主行政的內容,讓政府相關的資訊更迅速和普及 公開,政府資訊公開法要求各機關必須主動公開的資訊,透過機關網站有效地傳 送。行政院公報資訊網的設置是另一個成功的例子,各機關相關的法規都在這個 服務網中事先預告和刊登,履行政府依法行政過程的最基本要求。
三、電子化政府的效益
電子化政府確實改變了政府提供公共服務的方式和速度,民眾與政府關係也 改變,研究文獻的重點之一也著眼於討論,電子化政府服務是否讓民眾感到更滿 意服務,是否也提升民眾的信任感等等 (如 Meching, 2002; La Porte, 2002; Chadwick & May, 2003; Holzer, 2004; Scott, 2006; Tolbert & Mossberger, 2006)。
針對韓國81 個城市環境決策品質的個案研究顯示 (Lim & Tang, 2007),城市 網站上的相關內容品質等狀況(如提供民眾接觸政府資訊、交易功能、互動機制) 確實會影響環境決策品質和資訊充分性,而且都是管理者運用電子政府的積極創 新方式也影響著電子化政府的成效。美國稍早一項經驗調查研究顯示 (W elch, Hinnant & Moon, 2005) ,政府網站使用和電子化政府與網站滿意度間都有正相 關,對於電子化政府滿意度和對政府信任感有正相關。研究者也曾找到許多運用 電子化政府成功的案例,黃東益和陳敦源 (2004) 介紹歐洲一些案例,另外,例 如美國聯邦政府的電子法規討論系統 (http://www.regulations.gov)、環境保護署民 眾 參 與 網 (http://www/network-democarcy.org/eap-pip) 和 英 國 民 眾 網 上 空 間 (http://www.ukonline.gov.uk/CitzenSpace/CitizenSpace/fs/en),說明可以積極採用電 子化民主技術,促進民眾參與,包括網路上的商議討論,提升民眾對政府的信任 感 (Holzer et al., 2004)。不過,也有研究比較持謹慎的觀點,針對 14 個國家的經 驗研究指出 (Wong & Welch, 2004),電子化政府網站的和政府開放性、透明度和 互動性的關係,未必然一定是線性的正面關係,與該國文官體制發展有關,換言 之,本來的官僚體系就屬於對外界較為開放者,電子化政府的提升促成效果就更 大。陳敦源等人 (2007) 的研究發現也和前述發現較一致,即台灣案例中,網路 使用與網上公民接觸雖有正向關係,但主要是更增強原本就有公民參與的行為 者,而非促動本來屬於低參與行為者的公民參與。 四、研究問題 總之,從以上的論述可以瞭解,電子化政府對政府、民眾、企業、政府員工 和社會都創造服務的價值,「少用馬路、多用網路」雖是一個形容口號,但確實 點出電子化政府在現代公共行政領域的重要性。政府部門的官方說法也強調,國 際上電子化政府發展趨勢,從早期「公共事務管理」轉向當前的「公共服務創新」,
更逐漸推向「公共價值創造」的發展目標,其影響層面自然從政府行政層面逐步 地擴及至政治、社會及經濟發展等層面。 電子化政府過程不論是建置基礎或運用系統,或者是維護營運需求、設計服 務內容、資訊安全系統和維護人力等等,當然皆需要投入相當的經費,而且有時 也會有使用率不高的投資個案狀況等等。Heeks (2001) 研究指出電子化政府計畫 失敗率比例可能高達八成,同時在檢討相關重要學術期刊出版的研究文獻後,指 稱:「電子化政府研究是處於一種很糟的狀況」 (Heeks & Bailur, 2007: 261)。聯 合國年度調查報告中則繼續呼籲必須對電子化政府效益或影響進行評估 (UN, 2010),OECD在 2010 年 3 月 29, 30 日召開如何設定電子化政府績效指標的工作 討論會,針對既有文獻較少納入討論的部分進行議題方向的討論,包括後端支援 辦公室 (back office) 、產出和結果面的績效指標、經濟面向影響指標等(會議簡 報 資 料 置 於 http://www.oecd.org/document/59/0,3343,en_2649_34129_44704443_1_1_1_1,00.ht ml, accessed on 2010/5/10)。 行政院主計處提出的年度電腦應用概況報告顯示,政府行政機關的年度資訊 總支出從2001 年的 157 億元增至 2006 年的 184 億元,佔政府年度總支出比例仍 低於1%,雖然這樣的比例遠低於日本和美國,但仍是一筆相當的經費。中央政 府自 2001 年起不定期出版年度電子化政府報告書 (如行政院研究發展考核委員 會,2008) ,提供台灣電子化政府推動的相關現況介紹和成就說明,不過,對於 電子化政府的實際效益問題並未有系統地長期追蹤,這個問題也正反映出一個現 象,即政府十多年來繼續努力推動的各項行動方向,但卻缺乏一個引導性的電子 化政府績效管理架構。因此,究竟如何對於電子化政府計畫進行績效管理,是一 個理論上和實務上都具有意義的研究目的和問題,本研究的主要研究問題有二: 1. 分析特別是 2000 年以後關於電子化政府成效評估的重要研究文獻,以及其 使用的觀點,包括國外和台灣的研究。 2. 運用績效管理理論的指引,建構一個綜合性的電子化政府績效管理與衡量架 構。
貳、電子化政府績效評估的國際觀點
2000 年後,國際上有不同單位開始進行各國的電子化政府績效評比。績效 衡量的重點可以分為三大類:基礎資訊通訊設施的準備度、政府網站功能和綜合 性。以下分別介紹相關的評比組織和所用的績效衡量架構。
一、電子化準備度
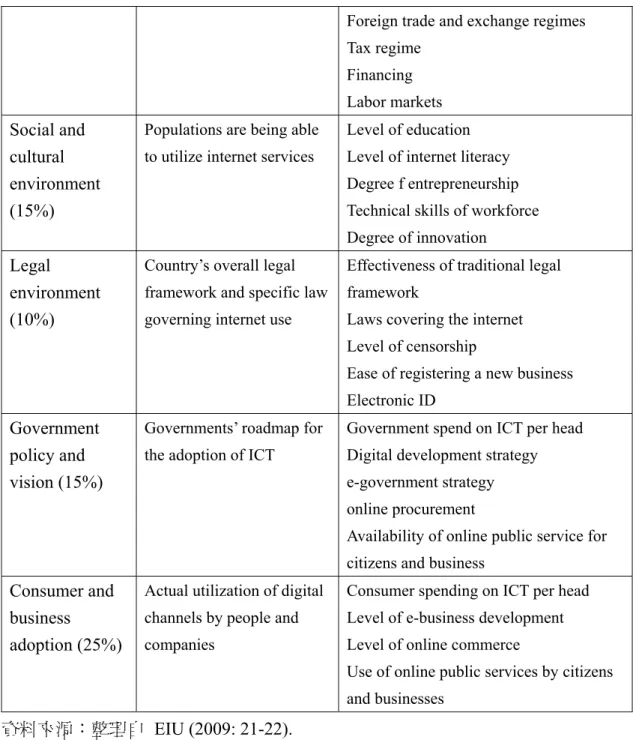
第一個常被引用的報告是由Economist Intelligence Unit (EIU) 和 IBM 合作 出版的「電子化準備度 (e-readin ess)」評比。準備度評比的目的旨在引導國家能 夠繼續快速運用資訊和通訊科技 (ICT) 基礎建設,讓包括政府部門、企業和民 眾消費者能夠在生活和工作有更佳的方法可用。此一評比機制自 2000 年起推 動,每年蒐集近百項的量化和質化指標,作為綜合評估許多國家電子化準備度程 度的基準,使用的指標不斷做調整。2007 年起採用六項構面:connectivity and technology, business environment, social and cultural environment, legal environment, government policy and vision, consumer and business adoption (EIU, 2009),各構面 佔總指數的權重不一,如表1。台灣的評估結果如表 2。
表1 EIU 準備度評估
Category Definition Indicators connectivity
and technology infrastructure (20%)
The extent to which individuals and business can access mobile networks and the internet
Broadband penetration, broadband affordability, mobile-phone penetration, internet user penetration, international internet bandwidth internet security
Business environment (15%)
Country’s attractiveness as a trading economy for business investment
Overall political environment Macroeconomic environment Market opportunities
Policy toward private enterprise Foreign investment policy
Foreign trade and exchange regimes Tax regime Financing Labor markets Social and cultural environment (15%)
Populations are being able to utilize internet services
Level of education Level of internet literacy Degree f entrepreneurship Technical skills of workforce Degree of innovation
Legal environment (10%)
Country’s overall legal framework and specific law governing internet use
Effectiveness of traditional legal framework
Laws covering the internet Level of censorship
Ease of registering a new business Electronic ID
Government policy and vision (15%)
Governments’ roadmap for the adoption of ICT
Government spend on ICT per head Digital development strategy e-government strategy online procurement
Availability of online public service for citizens and business
Consumer and business
adoption (25%)
Actual utilization of digital channels by people and companies
Consumer spending on ICT per head Level of e-business development Level of online commerce
Use of online public services by citizens and businesses
資料來源:整理自 EIU (2009: 21-22).
表2 台灣在 EIU 評比的表現
Category 2004 2005 2006 2007 2008 2009 connectivity and technology
infrastructure
6.27 7.70 7.70 8.00 7.80 7.70
Business environment 7.99 8.15 8.10 7.96 7.99 7.53 Social and cultural
environment
7.25 6.00 6.20 8.00 8.07 8.10
Legal environment 7.67 7.46 8.11 7.80 7.70 7.38 Government policy and vision 8.75 9.05 8.55
Consumer and business adoption 7.67 7.10 7.10 8.85 8.65 7.84 Supporting e-services 7.75 7.75 8.00 Overall 7.32 (20) 7.13 (22) 7.51 (23) 8.05 (17) 8.05 (19) 7.85 (16) 資料來源:整理自EIU 各年度報告。
另一個常被引用的評估報告則是由世界經濟論壇 (W orld Econom ic Forum , WEF) 和 INSEAD 合作發表的年度「全球資訊科技報告 (Global Inform ation Technology Report)」,報告中主要的評比指數稱為「網路準備度指數 (Networke d
Readiness Index, NRI) 」
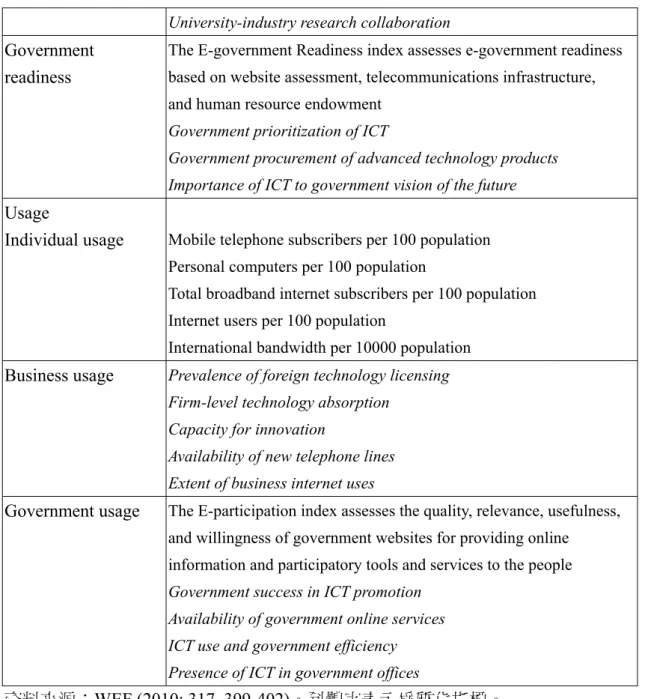
(http://www.weforum.org/en/initiatives/gcp/Global%20Information%20Technology% 20Report/PastReports/index.htm/)。此一評比所希望引導的目標和EIU的方向幾乎 是一致的,即各國運用資訊和通訊能力,並推論各國對資訊化網路化社會的準備 程度。目前使用3 個次指數:環境 (environm ent)、準備度 (read iness) 和使用度 (usage),權重各為 1/3。每一次指數也都包括權重相同的 3 個構面,但每個構面 都包括數目不一的衡量指標(含量化和質化),如表3。台灣的評估結果如表 4。
表3 W EF 準備度指數架構
構面 指標
Environment
Market environment Number of utility patents
High-technology exports as a percentage of total goods exports Total tax rate
Time required to start a business
Number of procedures required to start a business
Venture capital availability Financial market sophistication Availability of latest technologies State of cluster development Intensity of local competition Freedom of the press
Accessibility of digital content
Political and regulatory
Number of procedures to enforce a contract Time to enforce a contract
environment Effectiveness of law-making bodies Laws relating to ICT
Judicial independence
Intellectual property protection
Efficiency of legal framework for disputes Property rights
Quality of competition in the ISP sector
Infrastructure environment
Main telephone lines per 100 population Secure internet servers per million population Electricity production per capita
Gross tertiary education enrollment rate Education expenditures as a percentage of GNI
Availability of scientists and engineers Quality of scientific research institutions
Readiness
Individual readiness One-time residential telephone connection charge as a percentage of GDP per capita
Residential monthly telephone subscription as a percentage of monthly GDP per capita
High-speed monthly broadband subscription charge as a percentage of monthly GDP per capita
Lowest sampled cost per 100 kb/s as a percentage of monthly GNI Cost of 3-minute local call during peak hours as a percentage of monthly GDP per capita
Quality of math and science education Quality of education system
Internet access in schools Buyer sophistication
Business readiness One-time business telephone connection charge as a percentage of GDP per capita
Business monthly telephone subscription as a percentage of monthly GDP per capita
Computer, communications, and other services as a percentage of total commercial services imports
Extent of staff training
Local availability of specialized research and training services Quality of management schools
University-industry research collaboration
Government readiness
The E-government Readiness index assesses e-government readiness based on website assessment, telecommunications infrastructure, and human resource endowment
Government prioritization of ICT
Government procurement of advanced technology products Importance of ICT to government vision of the future
Usage
Individual usage Mobile telephone subscribers per 100 population Personal computers per 100 population
Total broadband internet subscribers per 100 population Internet users per 100 population
International bandwidth per 10000 population Business usage Prevalence of foreign technology licensing
Firm-level technology absorption Capacity for innovation
Availability of new telephone lines Extent of business internet uses
Government usage The E-participation index assesses the quality, relevance, usefulness, and willingness of government websites for providing online
information and participatory tools and services to the people
Government success in ICT promotion Availability of government online services ICT use and government efficiency Presence of ICT in government offices
資料來源:WEF (2010: 317, 399-402)。斜體字表示為質化指標。
表4 台灣在 WEF 評比的表現
年度 NRI e-Government Government Readiness Government Usage 2001~2002 5.18 (15) 7 N/A N/A 2002~2003 5.31 (9) N/A 2 4 2003~2004 4.61 (17) N/A 12 6 2004~2005 1.12 (15) N/A 3 5 2005~2006 1.51 (7) N/A 9 4 2006~2007 5.28 (13) N/A 6 8
2007~2008 5.18 (17) N/A 11 8 2008~2009 5.30 (13) N/A 14 8 2009~2010 5.20 (11) 資料來源:彙整自WEF 各年度報告。N/A 是因為該項原始資料引自聯合國,台 灣因非成員國,未列入評比國家。 最後,和網路準備度有相關的評比報告是由國際電訊聯盟 (Interna tional Telecommunication Union, ITU) 和 聯 合 國 貿 易 與 發 展 會 議 ( United Nations Conference on Trade and Development) 所發佈的。2006 和 2007 年該聯盟分別提 出「數位機會指數 (Digital Opportunity Index)」評比報告。該向評比分為三個構 面,即:機會、基礎建設和使用,合計包括 11 項具體指標 (W orld Inform ation Society, 2007),如表 5,台灣表現不算差。
表5 ITU 準備度評估架構
構面 指標 2005 2006
Opportunity Percentage of population covered by mobile cellular telephony
Internet access tariffs as a percentage of per capita income
Mobile cellular tariffs as a percentage of per capita income
0.99 0.99
Infrastructure Proportion of households with a fixed line telephone Proportion of household with a computer
Proportion of households with internet access at home Mobile cellular subscriber per 100 inhabitants
Mobile internet subscribers per 100 inhabitants
0.63 0.75
Utilization Proportion of individuals that used the internet Ratio of fixed broadband subscribers to total internet subscribers
Ratio of mobile broadband subscribers to total mobile subscribers
0.29 0.38
Index score 0.66 (10) 0.71 (7) 資料來源: 指標彙整自 ITU (2007: 40)。兩年的台灣評比分數彙整自當年報告。
Index)」,報告是將 ICT 當作是增進國家經濟生產力能力的資本、勞動力存量和 消 費 , 因 此 乃 著 眼 於 衡 量 一 個 國 家 的 資 訊 密 度 (infodensity) 和 資 訊 使 用 (infouse),資訊密度代表著資本和勞動力存量,資訊使用代表著消費。指標體系 如表6,台灣的指數評比總分自 2001 年的 204.34 分持續增至最近一次報告 2005 年的302.17 分,排名第 17 (ITU, 2007: 127)。 表6 ITU 數位機會指數評估架構 構面 次面向 指標
Infodensity Networks Main telephone lines per 100 inhabitants Mobile cellular subscribers per 100 inhabitants International internet bandwidth
Skills Adult literacy rates
Gross enrolment rates (primary, secondary, tertiary) Infouse Uptake Internet users per 100 inhabitants
Proportion of households with a TV Computers per 100 inhabitants
Intensity Total broadband internet subscribers per 100 inhabitants International outgoing telephone traffic per capita 資料來源: 指標彙整自 ITU (2007:: 123)。
ITU 在上述基礎下,繼續結合 10 多個國際性組織,推動國家投入於 ICT 建 設 和 準 備 度 上 , 這 個 更 大 的 聯 盟 稱 為 Partnership on Measuring ICT for Development,並在最近討論建議一套衡量的「核心 ICT 指標」體系,分為 4 個 構面,共計41 個指標,如表 7。 表7 ITU 核心 ICT 評估架構 構面 指標 ICT infrastructure and access
Fixed telephone lines per 100 inhabitants Mobile cellular subscribers per 100 inhabitants Computers per 100 inhabitants
Internet subscribers per 100 inhabitants
Broadband internet subscribers per 100 inhabitants International internet bandwidth per inhabitant
Internet access tariffs and as a percentage of per capita income Mobile cellular tariffs and as a percentage of per capita income
Percentage of localities with public internet access centres by number of inhabitants
Access to, and use of , ICT by households and individuals
Proportion of households with a radio Proportion of households with a TV
Proportion of households with a fixed line telephone Proportion of households with a computer
Proportion of individuals who used a computer in the last 12 months Proportion of households with internet access at home
Proportion of individuals who used the internet in the last 12 months Location of individuals use of the internet in the last 12 months Internet activities undertaken by individuals in the last 12 months Use of ICT by
business
Proportion of business using computers Proportion of employees using computers Proportion of business using the internet Proportion of employees using the internet Proportion of business with a Web presence Proportion of business with an intranet
Proportion of business receiving orders over the internet Proportion of business placing orders other the internet ICT sector and
trade in ICT goods
Proportion of total business sector workforce involved in the ICT sector Value added in the ICT sector
ICT goods import as a percentage of total imports ICT goods exports as a percentage of total exports
資料來源:Partnership on Measuring ICT for Development (2008: 109-152)。
二、政府網站功能
國際上對於電子化績效評估的重點主要是置於政府網站的效用等課題,這方 面的討論又與網站功能階段論有關 (參見 Layne & Lee, 2001; Moon, 2002; UN, 2002 & 2010; Santos & Heeks, 2003; Seifer t, 2003; West, 2004; Asgarkhani, 2005; Gil-Garcia & Martinez-Moyano, 2007; Lee, 2010 ;Lee (2010) 特別檢視 12 個階段 模式,並提出一個新的分類觀點,區辨不同階段模式間背後意涵的異同性)。聯 合國最早期提出的五個發展階段 (UN, 2001) 迄今仍是最常被用的架構之一:草 創(emerging)、增強 (enhanced) 、互動 (interactiv e)、交易 (transactional) 和網路
串連 (netw orked)(2010 年版則簡化為四個階段,3 和 4 合一,網路串連則改名 為connected)。 基於政府網站功能是民眾接觸電子化政府的直接窗口,因此這方面有不少組 織提供評估報告,首先介紹的是Brown University公共政策研究中心由Darrell M. West自 20001 年起開始進行電子化政府評估 (http://www.insidepolitics.org/)。此 項評比主要是根據網站內容和功能進行評估,對象包括美國城市、州和地方政 府、聯邦政府和全球政府。2008 年全球報告中包括 198 個國家中央政府 1667 個 網站 (W est, 2008)。 網站評估架構主要著眼於資訊可及性、服務傳送和公眾接觸等三個面向,再 細分為許多指標,包括:
線上資訊提供:分為 7 項資訊 Phone contact information, Address information, Links to other sites, Publications, Databases, Audio clips, Video clips
線上業務辦理服務:指整個業務申辦過程都可在網站上完成的線上服務,不 包括任何仍指需親自去洽公的部分線上申辦服務
隱私保護與安全:網站上有無清楚的隱私和安全政策宣告 無障礙服務:符合 World Wide Web Consortium (W3C) 的標準 外國語言提供
商業廣告和收費狀況
民眾戶動機制:包括 Email, Search, Comme nts, Em ail Updates, Broadcast, Website Personalization, PDA access。
台灣在這個評比上,一向都有很好的成就,如下表8。 表8 台灣在 Brown University 評比的表現 年度 評比國家數 排名 年度 評比國家數 排名 2001 196 2 2005 198 1 2002 198 1 2006 198 49.8 (2) 2003 198 5 2007 198 51.1 (3) 2004 198 1 2008 198 58.7 (2) 資料來源:彙整自各年度報告。
另一個進行電子化政府網站評比的組織是由美國 Rutgers University (The E-Governance Institute, National Ce nter f or Public Perform ance) 和 韓 國 Sungkyunkwan University (Global e-Policy e- Government Institute, Graduate School of Governance) 合作,同時由聯合國經濟與社會事務處公共行政和發展管理組, 以及美國公共行政學會 (ASP A) 共同贊助。此一評比針對全世界重要大城市的 網站功能進行評比 (Holzer & Kim, 2008)。該評比使用五個構面衡量電子化網站 服務的績效,包括:安全與隱私、可用度、內容、服務和民眾參與,各個構面的 權重都一樣,也各自多包括 2020 個左右的細部衡量指標,如下表 9。台灣並無 任何城市被此項調查列入評比。 表9 Rutgers University 網站評比架構 構面 指標 Privacy/Sec urity
A privacy or security statement Data collection
Option to have personal information needed
Third party disclosures
Ability to review personal data records
Managerial measures Use of encryption
Secure server Use of cookies
Notification of privacy policy Contact or email address for inquires
Public information through a restricted area
Access to nonpublic information for employees
Use of digital signatures Usability Homepage, page length
Targeted audience Navigation bar Site map Font color Forms Search tool Update of website Content Information about the location of
offices
Listing of external links Contact information Minutes of public City code and regulations City charter and policy priority Mission statements
Budget information
GIS capabilities
Emergency management or alert mechanism
Disability access Wireless technology
Access in more than on language Human resources information Calendar of events
Documents, reports, or books Services Pay utilities, taxes, fines
Apply for permits Online tracking system Apply for licenses E-procurement Property assessments Searchable databases Complaints
Bulletin board about civil applications
FAQ
Request information
Customize the main city homepage Access private information online Purchase tickets
Webmaster response
Report violations of administrative laws and regulations
Citizen participation
Comments or feedback Newsletter
Online bulletin board or chat capabilities
Online discussion forum on policy issues
Scheduled e-meetings for discussion
Online survey/polls Synchronous video Citizen satisfaction survey Online decision-making
Performance measures, standards, or benchmarks
資料來源:Holzer & Kim (2008: 97-98).
American Custom er Satisfaction In dex 中也就電子化政府使用滿意度進行調 查,主要是對美國聯邦政府許多政府網路使用者基於自願性回答問卷的方式,根 據四個面向評估政府網站的使用滿意度,即:容易瀏覽 ( navigation)、搜索引擎 (search)、服務申辦功能 (f unctionality)和外觀感受 (look & feel)。滿意度調查一 年中進行四次,將政府網站依主要屬性分四類(資訊新聞、入口網、電子交易、 求職),進行長期追蹤比較 (ACSI, 2008)。
最後,最近一項就12 個歐洲國家內 35 個主要城市網站的電子治理研究發現 (Torres, Pina & Acerete, 2006) ,由三大面向加計權重計算構成的電子治理程度: 電子服務 (40%) 、電子民主(40%) 和網站成熟度 (10 %),只有 9 個城市屬最高 組,其總指數也僅介於0.45 到 0.53 間。三大面向也皆很少達到成熟階段,另外, 國家投資於ICT 經費、電信基礎設施兩者和電子治理有顯著相關性。
三、全面性焦點
狀況。以下分別介紹聯合國和日本早稻田大學的評估體系。 聯合國積極鼓勵各國推動電子化政府,而且長期發佈各國政府電子化的績效 狀況。2001 年起聯合國公共經濟與公共行政處和美國公共行政學會合作,首度 提出衡量其成員國政府電子化狀況的基準報告,此後聯合國經濟與社會事務處在 2003, 2004, 2005, 2008 和 2010 年都繼續提交評比報告,但是每一個年度都有其 觀察重點,表現在年度報告的副標題上。這些報告一直維持著一個不變的核心目 的,即希望透過電子化政府衡量評估,瞭解各國中央政府運用既有ICT 發展技術 於執行政府功能的意願和能力 (UN, 2010: 109)。 2001 年衡量電子化政府指數(後來稱電子化政府準備度指數 e-governm ent readiness in dex,2010 年又改稱電子化政府發展指數 e-governm ent developm ent index)的基本架構中採用三個績效衡量面向:網站內容 (web presence)、ICT 基 礎建設 (T elecommunication infrastructure)、人力資本 (hum an capital),共有 10 個具體指標 (United Nations, 2001)。2003 年起大體上維持這樣的衡量架構,每一 構面佔指數的權重都相同。網站內容是評估各國中央政府入口網或官方網站提供 線上資訊內容或服務功能的狀況,調查項目則根據聯合國所稱電子化政府發展五 個階段(2010 年起改稱四階段)而設計,但評估報告中並未詳細列出實際使用 的查核細項或指標,這一構面偏屬於質化評估。不過,2003 年起的報告中都另 加上電子參與 (e-participation) 指數報告,相關構面的衡量指標如表 10。台灣因 非聯合國會員國,所以歷次的報告中均未納入評比。 表10 UN 電子化政府評比架構 構面 指標 Telecommunication Infrastructure
Internet users per 100 inhabitants
Fixed telephone lines per 100 inhabitants Mobile subscribers per 100 inhabitants PC per 100 inhabitants
Fixed broadband per 100 inhabitants
Online population TV per 100 inhabitants
Human capital Adult literacy rate (權重佔2/3)
Combined gross enrolment ratio for primary, secondary and tertiary schools
e-consultation e-decision-making
資料來源:UN (2010: 109-113)。斜體字是曾用過的指標。
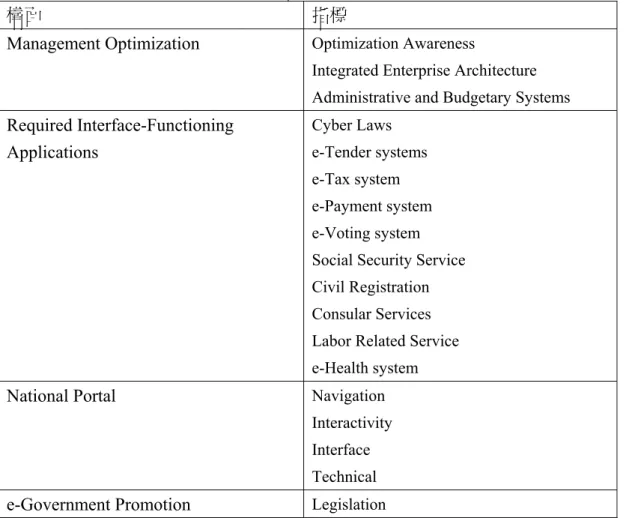
另一個關注全面性的電子化政府績效評比是由日本早稻田大學 (Institute of E-Government, W aseda University) 所 進 行 的 電 子 化 政 府 評 比 報 告 (http://www.obi.giti.waseda.ac.jp/index2.html ),這項報告是和APEC的電子化政 府研究中心合作,主要是以亞洲地區和APEC會員體為關注焦點的評比研究。自 從2005年起評比主要的構面有六個,分別是:基礎網絡設施整備度 (network preparedness) 、 線 上 系 統 服 務 應 用 內 容 (required interf ace-functioning applications)、管理最佳化程度 (m anagement optimization)、國家入口網 (natio nal portal) 、 電 子 政 府 推 廣 (e-governm ent prom otion) 、 政 府 資 訊 長 (CIO in government),2010年最近一次的評比再加上電子化參與 (e-par ticipation) 構面, 目前7個構面下共包括31項衡量指標,如表11。台灣在歷年的評估結果如表12。
表11 W aseda University 電子化政府評比架構
構面 指標
Management Optimization Optimization Awareness
Integrated Enterprise Architecture Administrative and Budgetary Systems Required Interface-Functioning Applications Cyber Laws e-Tender systems e-Tax system e-Payment system e-Voting system Social Security Service Civil Registration Consular Services Labor Related Service e-Health system National Portal Navigation
Interactivity Interface Technical e-Government Promotion Legislation
Plans/strategies Policies Government Entities Private Entities Collaborations Funding Publications / Journals Training
Conferences, Fora, Seminars Advertisements
Government oversight committee Private over-sight committee Think-tanks
Introduction to CIO Presence Mandate Organizations
Development Programs Network Preparedness Internet Users
Broadband Subscribers Mobile Cellular Subscribers PC Users e-Participation Information Mechanisms Consultation 資料來源:Obi (2010: 10-11). 表12 台灣在Waseda University 評比的表現 年度 評比國家數 原始分數 (排名) 2006 34 (7) 2007 34 58.0 (8) 2008 34 (9) 2009 34 78.69 (8) 2010 40 74.4 (9)
參、台灣電子化政府績效的研究文獻檢閱
隨著 1990 年代中期後,台灣政府開始執行許多電子化政府的服務作業系 統,學術界也開始投入這方面的研究。研究的重點也和國外研究方向相當同步, 主要是許多個別型研究計畫,針對政府網站功能提出評估指標並進行實際評估。 2007 年起行政院負責推動電子化政府的研究發展考核委員會,透過委辦方式設 立台灣電子治理研究中心 (Taiwan E-Governance Research Center),資助更有系統 性的專案研究,包括對於電子化政府成效提出整體性評估架構。以下分別介紹這 兩部分的主要研究文獻成果。 一、政府網站功能研究 2000 年後研究文獻已累積不少,而且涵蓋不同課題,但政府網站功能一直 是研究文獻的主體,包括好用度到民主化等等課題,也從機關或民眾角度思考評 估指標,以及個別電子服務應用系統評估(陳祥、許嘉文,2001;黃朝盟 2001 ; 陳啟光、鄭傑升,2002;林榮和、楊金亨,2002;周韻采,2003;黃東益、黃家 珊,2003;蕭乃沂,2003a & 2003b;黃朝盟、洪偉釗,2003;黃東益、陳敦源, 2004;黃朝盟、余雅瑛,2004;楊明壁、詹淑文,2005;陳敦源、李仲彬、黃東 益,2007;黃朝盟、吳濟安,2007;羅晉,2008)。下面進一步較少部分文獻所 提的評估架構。 黃朝盟、洪偉釗 (2003) 整理國外相關文獻建議,再透過專家意見問卷的評 量後,提出網站可用性原則應該包括五個構面:網站規劃與管理、網站導覽設計、 網站使用介面設計、網站內容文字編輯。全部構面包括 40 項具體的操作指標。 黃朝盟、趙美慧 (2007) 更進一步撰寫專書,提供網站規劃與設計的操作性建 議,也就是評估網站好用性的具體指標。陳冠位 (2007) 主張政府入口網站應包 括幾項特質指標:資訊分類架構、網站管理分權機制、內部整合運作、雙向溝通 機制、線上申辦服務、個人化專區、資訊整合機制。陳祥、許嘉文 (2001) 認為 政府整合型入口網應該提供下列功能:政府資訊、線上服務、資訊安全與隱私權 維護、詢問與申訴管道和無障礙空間。
楊明壁 (2005) 使用 PZB 概念提出電子化政府入口網站服務品質構面和指 標,如表13。陳啟光、鄭傑升 (2002) 也是參考 PZB 等文獻先提估 11 個構面(友 善、反應、能力、可靠、溝通、安全、同理心、導覽、管道、資訊品質、公平), 44 個具體指標,經過調查研究的因素分析後,變成電子化政府成效評量表 3 大 構面:資訊系統能力、網站設計(使用)、政府推廣(計畫執行力),22 項指標, 如表14。 表13 構面 指標 友善 完整機關導覽 功能操作便利 安全 個人資料安全 能力 資訊內容與服務滿足使用者需求 單一窗口 可靠 資訊內容和服務可信任 服務項目可正常操作 溝通 專人處理抱怨與問題 網上提供發問和抱怨 反應 電子郵件告知辦理狀況 瞭解 個人化服務與資訊 系統品質 網頁連結不斷線 資訊品質 資訊內容經過整理不雜亂 提供最新公告與資訊 公平 告知服務項目 所有人都可使用政府網路服務 容易找到電腦連結上政府網站 規劃協助民眾使用網站的服務 資料來源:整理自楊明壁、詹淑文 (2005: 126-127)。 表14 構面 指標 系統能力 滿足使用者需求 郵件通知辦理狀況 快速搜尋到所需資訊或服務 提供完成跨機關業務 網站功能和服務項目正常運作
網上資料保護設計能保密 身份和密碼設計能確保個人資料安全 個人資料不會被盜用 不會擔心網上登記申請會被遺漏 網站設計 有FQA 網站資訊內容能滿足需求 導覽操作簡易 網上資料經整理過而不雜亂 有最新消息公告 機關業務導覽介紹很清楚 網站資訊易懂 政府推廣 有規劃學習使用網站服務活動 可在線上表達抱怨 收到政府通知相關服務活動等信息 所有民眾有平等機會使用網路服務 所提問題會得到處理回覆 容易找到電腦連線上政府網站 資料來源:整理自陳啟光、鄭傑升 (2002: 48)。 周韻采 (2003) 參考文獻後提供政府入口網的評估指標,提出表 15,並據以 評估幾個國家的狀況。羅晉 (2008) 則就政府網站是否提供電子民主機制提出評 估指標,如表16。 表15 構面 指標 資料搜尋 整合型資料庫 資訊時效性 網站穩定性 互動介面 技術支援 (免費軟體下載、多國語言版本、網站地圖) 服務型錄 線上回覆 (電子郵件回覆、線上調查) 電子交易 安全機制 (SSL, SET, PKI 機制,數位簽名) 會員機制 付費機制 (信用卡、預付卡、金融卡) 應用服務 電子報 多媒體服務
行事曆 網站接取 頻寬速度 (撥接接取、寬頻接取) 連線平台 (PDA、手機、公共資訊站) 資料來源:整理自周韻采 (2003: 46)。 表16 構面 指標 機關基本項目 機關地址 機關服務時間 機關組織圖表 機關 / 承辦單位 (人) 傳真 機關 / 承辦單位 (人) 電子郵件 機關交通位置圖 資訊公開 師政院警理念 業務職掌 施政計畫書 業務或政策相關文件 既定業務或政策的最新動態 預算 決算 人力配置 文字會議記錄 業務或政策相關法規 統計資料庫 衍生加值資訊或出版品 全文搜尋 常見問題及 制訂中政策或法規的背景文件 制訂中政策或法規的最新動態 電子報訂閱 多媒體文件 業務資訊的分眾或個人化 互動諮商 意見填寫表格 民意申訴信箱 留言版 / 公共論壇 民意調查 即時通訊或聊天室 視訊會議或即時播映
決策制訂 議題公投 公職人員選舉 資料來源:羅晉 (2008: 161-165)。 二、電子化政府或電子治理的成效評估 台灣研究文獻上對於電子化政府能促成哪些效益也開始注意。例如,李俊明 等人 2005)從經濟效益角度認為可區分為自身經濟效益和外部效益兩大類,前 者包括如增加(減少)國家稅收利益(稅收損失)、節省人力和降低行政經費支 出和服務效益,後者則有促進資訊科技應用的效益、促進資訊產業發展的效益 (硬體設備、軟體及資訊服務)和促進基礎設施建設的效益。 有關電子化政府成效的研究這幾年更是進入更有系統性的階段,這與行政院 研究發展考核委員會委辦設置的電子化治理研究中心有密切相關。該中心近兩年 來的專案研究報告,除了有一篇提出如何進行電子化政府計畫的成本效益分析分 法說明外(潘競恒,2008),包括兩篇如何衡量電子治理績效的構想,可稱是國 內這方面研究文獻中最為有系統性的努力,而且並將績效評估架構轉化進行實際 調查(黃朝盟、2008;黃東益,2009)。雖然兩份報告都稱「電子治理」,而非限 於電子化政府,不過,兩者仍有相當的重疊性,因此有可參考之處。 黃朝盟 (2008: 34) 檢視諸多相關文獻對於電子化政府和電子治理的定義 後,認為電子治理是指「政府大量引進資訊與通訊科技於社會價值權威性分配過 程,透過基礎建設、法治規範、政府行政、政府服務與公民參與,以達成民主、 效率與效能良善治理目標,包括效率與效能、透明與課則、平等與法治、民住與 參與以及信任與滿意」。在這個概念下,黃朝盟 (2008) 就電子治理成效的評估, 先著眼於對於內部使用者的效果評估,包括政府本身 (G) 、政府與政府 (G2G ) 和政府內部人員 (G2E) 三大類,使用的衡量面向和指標如表 17。每個指標,都 用一組問卷題目,詢問受訪者的主觀意見,所以皆是質化方式。 表17 電子治理對政府內部利害關係人的評估指標 成效對象 績效構面 次構面 衡量指標 政府本身 為民服務與管理 基礎建設 軟硬體 民眾服務 民意多元服務管道 政策依據 隱私權安全性 線上採購 線上型錄採購 普及性
地理資許系統 創新 內部網路 內部管理 財務 資金預算 成本與收入 政府對政府 組織的溝通協調 水平溝通 效率 垂直溝通 效率 工作品質 行政品質 專業整合合作與效能 政策品質 透明與課責 組織結構 水平整合 創新 垂直整合 創新 政府內部人 員 個人行為 認知 成就感 個人發展 專業知識 行政知識 資訊素養 工作複雜性 新技能要求 疏離感 壓力 時間緊迫性 資訊倫理 態度 滿意度 未來期許 行為 主動學習 工作成果 行政與決策品質 效率 效能 辯論基礎 短時間蒐集更多人意見 決策過程更多的意見交 換 服務品質 資訊性 便利性 互動性 回應性 即時性 組織結構與學習 專業分工與整合 人事縮減 創造新工作(資訊人員或 部門等) 流程再造(單位界線改
變、跨機關業務) 控制幅度 自主性 權力 課責 監控 學習型組織 有無學習機制 知識分享與管理 資料來源:彙整自黃朝盟 (2008: 46-48, 52-56)。 黃東益 (2009) 接著提出電子治理對其他利害關係人的成效評估,包括對於 外部民眾 (G2C) 和外部企業 (G2B) 兩大類。研究報告分別提出績效評估架構, 並分別選定個別電子化政府服務系統的使用者,進行問卷調查。整個成效評估架 構主要參考Heeks (2006) 的觀點,評估架構如表 18。李絡維 (2010) 則以電子採 購系統為個案,實際驗證該績效評估體系的因果關係,證實電子化政府功能中的 三個績效次構面,確實可以產生影響中的時間減少、滿意度和信任感這三項績效 指標。 表18 電子治理對政府外部利害關係人的評估指標 成效對象 績效構面 次構面 衡量指標 民眾 電子化政府品質 網站品質 可用性 可近性 服務內容 資訊品質 精確性 即時性 易理解性 完善度 相關性 服務品質 隱私性 可靠性 回應性 使用 資訊搜尋 資訊查詢行為 資訊查詢時間 資訊查詢量 服務使用 表單下載行為 線上溝通聯繫行為 線上申辦行為
線上交易行為 民主參與 線上公共參與行為 態度 政治信任感 政治效能感 滿意度 使用意願 成本效益 成本 效益 企業 電子化政府功能 網站品質 導覽 使用便易性 技術可近性 資訊品質 精確性 即時性 易理解性 完善度 相關性 服務品質 隱私性 可靠性 回應性 使用行為 資訊搜尋 查詢行為 資訊查詢量 服務使用 表單或檔案下載 線上溝通聯繫 線上申辦 線上交易 影響 態度 滿意度 使用意願 投入資源 金錢 人力 安全 效益 時間減少 成本下降 整合 參與 信任 資料來源:民眾部分彙整自黃東益 (2009a: 21, 189-200 ),企業部分彙整自黃東 益 (2009b: 19-26)。
此外,參與上述研究過程的研究生中,有一篇進一步以電子採購系統為效益 評估的研究,其提出的效益績效衡量架構也值得介紹。紀人瑋 (2010) 使用德菲 法方法(政府人員和大學教師),得出電子採購系統的效益評估指標體系如表19。 表19 電子採購效益評估架構 類型 構面 衡量指標 立即可見效益 時間 人工重複作業減少(對行政機關) 資料搜尋方便(對行政機關/企業) 系統使用方便性(對行政機關) 成本 通訊成本(對行政機關/企業) 耗材成本(對行政機關/企業) 人力成本(對行政機關/企業) 交際成本(對企業) 交通成本(對企業) 價格 實際價格(對行政機關) 市場價格(對行政機關) 非立即可見效益 透明 資訊公開(對行政機關) 行政流程透明 (對行政機關/企業) 供應商家數(對行政機關) 課責 採購資訊資料紀錄(對行政機關) 不良廠商資料庫建立(對行政機關/ 企業) 整合 系統整合(對行政機關/企業) 政府採購規劃能力(對行政機關/企 業) 作業流程整合(對行政機關/企業) 行政機關資料共享(對行政機關) 參與 整合採購管道(對行政機關/企業) 授權灌能(對行政機關) 使用行為 服務使用 系統使用人數(對企業) 線上交易次數(對企業) 線上申辦行為(對企業) 線上溝通聯繫次數(對企業) 表單下載次數(對企業) 使用滿意度 系統整體滿意度(對行政機關) 下次是否使用(對企業) 是否推薦他人使用(對企業)
資料來源:整理自紀人瑋 (2010: 123-125, 149)。斜體字為原列指標,但最終未獲 專家共識同意。
肆、電子化政府績效衡量的理論性模式
誠然目前確實已有許多關於電子化政府相關的成效評估文獻,前兩節更已大 致上蒐集和介紹其主要觀點,這些評估研究多數仍是選擇特定焦點進行,評估架 構較未凸顯理論性內涵,綜合性評估架構觀點也較不足。不過,在國外文獻中, 仍可發現有些比較具有理論性意涵的研究文獻,並嘗試提出模式,例如,常被引 用的D & M 評估模式,多數的模式也立基於典型邏輯演繹績效管理理論觀點, 差別是在邏輯順序的安排或具體指標的主張。以下介紹印度、歐盟、英國和美國 研究者提出的模式。 最早提出績效評估模式中具有理論概念指引的當推 W illiam H. DeLone 和 Ephraim R. McLean (1992, 2003) 提出資訊系統成功模式的修正版 (IS/IT model, D & M model),此模式目前依然是常被引用當作是電子化政府績效評估的架構參 考之一,最近也有實證研究再次支持該模式 (Wang & Liao, 2007) 。前述黃東益 (2008) 也是參酌這個模式發展出成效衡量架構。此衡量模式的重點是要找出電 子化政府計畫的成功定義,即依變項,最原始模型認為可以從個人層次影響推至 組織層次影響,依變項透過兩個中間效果達成:實際被試用和使用者滿意度,最 後,自變項則是資訊系統本身的系統品質和資訊品質等兩個特性。後來的修正版 主要是將資訊系統精緻成三個特性構面,並將依變項整合為淨效益一項,如圖 1。這個架構下,每個構面都可以視具體計畫或個案,訂定衡量指標,該文 (2003) 就以電子商務為例,提出其成功的各構面內部衡量指標,如表20。 I Information Quality System Quality Intention to Use User Satisfaction Net Benefits Use Service Quality 圖1 修正版 D & M 資訊系統成功模型 資料來源:DeLone & McLean (2003: 24).表20 D & M 模式的衡量指標 構面 Systems quality Information quality Service quality Use User satisfaction Net benefits 指標 Adaptability Availability Reliability Response time Usability Completeness Ease of understanding Personalization Relevance Security Assurance Empathy Responsive ness Nature of use Navigation patterns Number of site visits Number of transactions executed Repeat purchases Repeat visits User surveys Cost savings Expanded markets Incremental additional sales Reduced search costs Time savings 資料來源:DeLone & McLean (2003: 26)。
印度智慧政府國家研究院 (Nationa l Institute of Smart Government) 的 Piyush Gupta (2007) 提出評估電子化政府績效的「成果 – 促動 (Result-Ena bler)」模式。 此模式認為電子化政府計畫要能夠產生許多利害關係者所期待的成效,期待成效 成是利害關係者用以評價電子化政府是否有績效的核心重點,而為期產生期待成 效,電子化政府方案同時需要重視許多促動因素,因為這些因素具有間接促成成 效發生的作用。整個成效和促動因素間需要有持續的回饋機制,作為進行改善計 畫的驅力。
利害關係人 公民 企業 政府 金融機構 學界 政治人物 … 媒體 成效指標 關鍵績效 服務使用者便 利性 內部效率 永續性 … 創新與可複製 促動指標 策略與政策 流程 伙伴與資源 人力 … 技術 期待 電 子 化 政 府 計 畫 效益 回饋 改善驅力 圖2 電子化政府成效促動模式 資料來源:Gupta (2007: 261)。
和前一模式比較相近的模式是Esteves and Joseph (2007) 提出評估電子化政 府計畫的綜合性架構 (E AM),這個架構特別重視電子化政府計畫的促動因素架 構。衡量架構關切三個角度,一是電子化政府成熟程度(採用Accenture 所提四 種發展階段:平台建置者、穩定成長者、遠景追隨者、創新領導者),一是電子 化政府利害關係人(採用Heeks 的 e 行政、e 公民、e 服務和 e 社會等觀點,確 認出公民、內部成員、企業、政府、資訊人員、特殊利益團體等),最後是評量 面向(提估六個構面,14 個衡量重點,如表 21)。 表21 構面 策略 技術 組織 經濟 操作 服務 指標 目標 風險管理 整合 可及性 結構 文化 ROI 成本效益 功能 效率 資訊 申辦交易 單一窗口 資料來源:Esteves & Joseph (2007: 129).
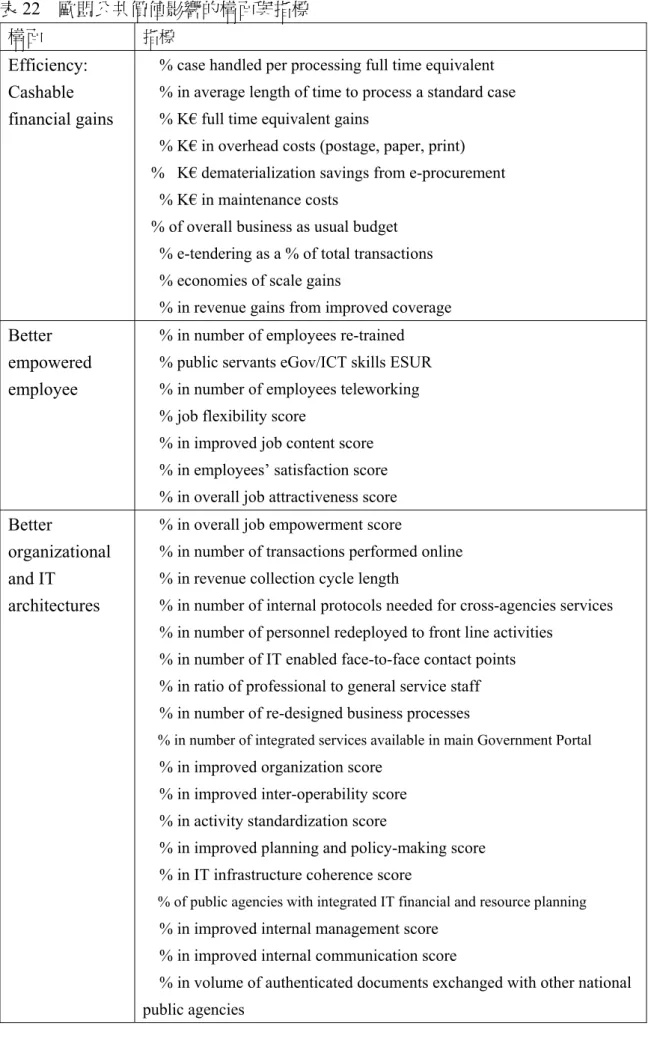
歐盟資訊社會與媒體處電子化政府組 (eGovernm ent Unit, D G Infor mation Society and Media, European Union) 進 行 電 子 化 政 府 經 濟 效 益 研 究 (eGovernment Economics Project),2006年正式出版電子化政府計畫的衡量架構模 式 (eGEP, 2006b),以及更細部衡量和資料來源等技術指導 (eGEP, 2006a)。這個 模式建立在一套公共價值理論邏輯觀點 (2006b: 11,公共價值理論觀點是歐洲國 家比較常使用的字眼和觀點,另也可參見英國智庫公共政策研究院的報告和其他 (e.g., Kearns, 2004; Castelnovo & S imonetta, 2008)),電子化政府計畫是透過好的 ICT機制引導組織變革和政府人力重新訓練的過程,然後提高政府部門的勞動生 產力,再透過執行各種網上服務和功能等計畫機制,希望達成各利害關係人所重 視的價值,這樣的良性循環一方面增進電子化政府的財務和政治正當性,有助於 說服社會接受政府投入更多相關資源推動相關計畫,一方面增進對於電子化服務 的信任感和減少資訊落差,強化相關計畫推動的支持。eGEP的衡量架構環繞在 三個重要驅動力,回應不同的公共價值主張,即效率(政府內部財務和組織的價 值)、效能(各服務對象的價值)和民主(政治體系的價值),總共建立9個影 響構面,基本衡量架構如圖3,由該圖所建立和建議的92項參考指標詳如表22。 效率 民主 效能 財務收益 財務與組織 價值 更具授能人力 更佳的組織和資 訊技術基礎 開放 透明與課責 參與 減少行政負擔 增進使用者價值 和滿意度 更多包容性的公 共服務 政治價值 服務對象價 值 圖3 歐盟電子化政府公共價值衡量架構 資料來源:eGEP (2006b: 15)。
表22 歐盟公共價值影響的構面與指標
構面 指標
Efficiency: Cashable financial gains
% case handled per processing full time equivalent % in average length of time to process a standard case % K€ full time equivalent gains
% K€ in overhead costs (postage, paper, print) % K€ dematerialization savings from e-procurement % K€ in maintenance costs
% of overall business as usual budget
% e-tendering as a % of total transactions % economies of scale gains
% in revenue gains from improved coverage Better
empowered employee
% in number of employees re-trained % public servants eGov/ICT skills ESUR % in number of employees teleworking % job flexibility score
% in improved job content score % in employees’ satisfaction score % in overall job attractiveness score Better
organizational and IT
architectures
% in overall job empowerment score
% in number of transactions performed online % in revenue collection cycle length
% in number of internal protocols needed for cross-agencies services % in number of personnel redeployed to front line activities
% in number of IT enabled face-to-face contact points % in ratio of professional to general service staff
% in number of re-designed business processes
% in number of integrated services available in main Government Portal
% in improved organization score % in improved inter-operability score % in activity standardization score
% in improved planning and policy-making score % in IT infrastructure coherence score
% of public agencies with integrated IT financial and resource planning
% in improved internal management score % in improved internal communication score
% in volume of authenticated documents exchanged with other national public agencies
% in volume of authenticated documents exchanged with public agencies across EU
% in the number digital knowledge sharing platforms for public agencies % in the number of Public Private Partnerships supported by a digital platform
% in the volume of documents exchanged digitally within PPP % in overall in inter-institutional cooperation score
Democracy: Openness
% in number of policy drafts online for consultation
% increase in number of government websites with Constituency Relationship Management Applications
% in response time to queries received online
% increase in number of government websites providing platforms for digital interaction and consultation (online forum, e-petitioning, etc) % in number of government websites providing two-way interaction with users
Transparency and
accountability
% change in aggregate openness score
% in number of government processes fully traceable online % in number of transactional services enabling online case tracking
% in number of public agencies reporting their budget and expenditure online
% in number of public agencies publishing online full organizational chart with indication of responsibility and contact information of each public servant
% in overall volume of administrative and legislative documentation online
% in online public information clarity and accuracy score % in externally assessed transparency score
Participation % in online public services with certified accessibility % in externally assessed participation score
% increase in queries submitted online % increase in online forum interaction % increase in policy drafts downloaded
Availability of online appeals procedure and e-ombudsman Effectiveness:
Reduced administrative burden
% in time saved for citizens
% in valorised (K€) time saved for businesses
% K€ cost savings for citizens (travel, postage, fees to intermediaries) % K€ cost savings for businesses ( travel, postage fees to
intermediaries)
% users reporting e-service saved time over traditional methods for a standard bundle of services
Users’ Value and Satisfaction
% in number of officially filed complaints
% in waiting times for a standard bundle of services % in off-hours service usage/info downloads
% in number of unique users repeatedly using elective online services % in number of unique users cross-using services in Government Portal
Unobservable (subjective) Intangible dimension
% in number of users reporting eGovernment services to be useful % in number of users reporting information available in government website to be accurate and credible
% in number of users reporting government website to satisfactorily address security and privacy issues
% in number of users reporting they trust providing personal information online
% in overall eGovernment user-satisfaction index % in overall eGovernment user-satisfaction index by age/income/educational attainment
Externally Measurable Functional dimension
% in number of government websites providing customer service (online call centre)
% increase in usage of transactional Pan-European eServices % in usability score
% in seamless service provision score % in innovative service provision score % in overall quality of service score More Inclusive
Public Services
Citizens
% in usage of public Job Portals % in usage of public eLearning Portals % in usage of public eHealth Portals
% in usage of online forms to receive Welfare benefits
% of Internet penetration by age income educational attainment % increase of eGovernment usage by socially disadvantaged groups % in inclusion related public e-services usage score
Businesses
% in number of SME bidding for public tenders electronically % in usage of government portals for businesses
% in number of SME handling export requirements online % in usage of government portal on funding opportunities 資料來源:eEGP (2006b: 54-55)。
英國University of Man chester 發展政策與管理研究所 (IDPM) 發展資訊組 是另一個重要理論基礎型的研究機構,主要研究者Richard Heeks (2006) 的報告 受到相當程度的引用。該報告中首先將電子化政府研究關切的議題,依時間區分 為四組議題:從最早的準備度 (readiness ) 繼續增加可用性 (availab ility)、應用 (uptake) 和影響 (im pact),然後結合傳統績效管理邏輯結構所提出的投入、中介 (intermediates)、產出和結果等面向概念,主張用「電子化政府價值鍊 (value chain)」觀點進行績效衡量,如圖 4,每個構面內也建議一些可參酌的次面向, 再據以發展具體衡量指標。 前置 資料庫 法制 制度 人力 技術 領導 驅力/需求 投入 經費 人員 技術 領導 政治支 持 targets 中介 網站媒介 其他電子 管道 後端支援 辦公室 產出 資訊與 決定 行動與 服務交 易 影響 財務效 益 非財務 效益 策略 發展 使用 採行 公共價 值目標 結果 外在因素 影響 應用 可用性 準備度 圖4 電子化政府價值鍊 資料來源:Heeks (2006: 14)。
美國 IBM 公司捐助設置的政府經營中心 (Center for Governm ent Business ) 出版一系列電子化政府研究,是另一個理論基礎研究的貢獻組織。其中,Genie N. L. Stowers (2004) 提交「如何衡量電子化政府績效」報告,該文先整理美國聯邦 政府2000 年代初期推動 23 項重大電子化政府服務計畫,以及州和地方政府的計 畫,所採用的常用衡量指標如表 25。另外,作者也主張電子化政府的衡量指標 體系建構必須和其策略目標結合,先有策略,再提出實踐策略目標的衡量指標, 並且介紹 Mississippi 和 Virginia 兩個州政府如何結合策略計畫和衡量指標的作 法。
表25
聯邦政府 (N=23) 州與地方政府
Amount of time saved (23) Number of applications offered (11) Number of transactions or uses (16) Cost savings from the applications (11) Number of participants (14) Adoption rates of applications (9) Cost savings (12) Customer satisfaction (9)
Adoption rates of applications (6) Number of visitors, page views, or hits (8)
Number of users, visitors, or Site hits (6) Number of agencies participating (5) Reduction of errors of redundancy (4) Number of transactions or uses (5) Customer satisfaction (4) Accessibility of sites (3)
Other (1 for each one) Common look and feel of sites (3) National rankings or awards (2) Reliability (2)
Number of search engine inquiries (2) Other (28, 1 for each one)
資料來源:Stowers (2004: 15-16). 然後,作者採用傳統績效管理理論的投入、過程、產出和結果面向的邏輯演 繹觀點 (Hatry , 2006),提供許多實務上使用的績效衡量指標等資訊。作者將電子 化政府衡量指標區分為兩大類別,每一類別都有其投入、產出和結果面向的指 標 。 第 一 個 類 別 是 網 路 技 術 類 (W eb/Technology) , 第 二 個 是 服 務 使 用 類 (Service-Oriented)。前者主要是著眼於衡量電子化政府網站上的活動狀況,後者 是衡量電子化政府實際傳送的服務內容,兩類別的具體指標如表26。 表26 投入 產出 結果 網路 技術 類 Application development and hardware set-up costs
number of hits or user contact sessions
number of document downloads
amount of time uses spend on a site
number of transactions completed, or the times
accessibility of services (number of pages on a site that meet accessibility criteria)
accuracy of the assistance or information provided as measured by percent accuracy rates in random fact checking adequacy of information as
online forms have been accessed and completed dollar amounts processed through each site
measured by staff and citizen surveys
accessibility of services (number of pages on a site that meet accessibility criteria)
accuracy of the assistance or information provided as measured by percent accuracy rates in random fact checking adequacy of information as measured by staff and citizen surveys
ease of use as measured by pop-up or other surveys
citizen satisfaction with site itself
Service Quality
minimal webpage errors percent of time when website is down and not available
Efficiency
Cost per transaction Total cost per user session
End Outcomes
Cost savings from e-government Staff time savings from
e-government 服務 內容 類 Maintenance and application improvement costs
time required for e-mail response to inquiry
number of e-mail messages sent to agency and/or officials number of e-mail requests successfully resolved number of applications developed and implemented number of e-permits
processed
level of citizen satisfaction as measured by pop-up or other surveys
usefulness of information as measured by surveys
Timeliness
response time to requests for information
time required for e-mail response to inquiry
number of times various maps and mapping applications have been accessed number of e-commerce applications accessed number of licenses and other applications accessed number of times multimedia presentations are played amount of feedback on multimedia presentations number of times databases are accessed
frequency of which information in databases is accessed
Service Quality
adoption rates within specified user groups
number of referrals from other websites and government portals for states and local governments, the number of agencies
participating by providing information or services Efficiency
Cost of providing each service per user
Cost per service transaction End Outcomes
Cost savings from e-government Staff time savings from
e-government Trust in government 資料來源:Stowers (2004: 38).
伍、電子化政府績效管理的思考架構與導入平衡計分卡理念
前兩部分對於文獻分析顯示,特別是國際評比,不同機構組織提出的電子化 績效評比所著重之處常有不同,背後甚至有些是夾雜著商業性的利益所在。雖然 這些績效評估指標都可供參考,但其背後欲達到的政策目標仍較不明顯,值得進 一步討論,這也是本研究所欲補充之處。本研究認為,應該從績效管理理論和技 術,建構電子化政府計畫的績效管理與衡量體系,平衡計分卡概念特別可以提供 這方面的協助。本節介紹績效管理理論,以及如何使用平衡計分卡理論和技術, 連接績效管理的環節。 一、績效管理基本概念和基本目的 績效管理是指組織能夠將對的事情用有效途徑達到預期水準,也就是根據選 定的近程與中長期組織發展目標方向,建立具體的組織,整體資源管理控制重 點,並定期評估努力之成效,再運用評估資訊提供組織和個人工作目標方向和重 點上調整的參據,以及必要的員工激勵與能力改善計畫 (參見 Hatry, 2006; Morley et al., 2001; Kaplan & Norton, 2001, 2004; Cardy, 2004)。美國國家績效評鑑 中心的績效衡量研究小組指出,績效管理是「利用績效資訊協助設定同意的績效 目標、進行資源配置與優先順序的排列,以告知管理者維持或改變既定的計畫目 標,並且報告成功符合目標的管理過程」 (引自丘昌泰,2000:317)。這些概念 下,完整的績效管理主要涉及四個關鍵事項之決定: 1. 什麼是對的事情? 2. 如何判斷達到預期水準? 3. 如何找出有效途徑? 4. 應該包括哪些組織? 值得特別重視的是,績效管理不等同於績效衡量,因為績效衡量只是處理上述第 二項問題。績效管理不僅要知道對的事情,做到多好,更要努力規劃和檢驗是否 找到好的途徑將事情做好,這樣的績效管理才能產生學習回饋作用。 績效管理本身就是一種大規模的組織變革(從文化面到行動面),即使具備著高層領導者和管理者展現具體行動全力支持的最有利成功條件,但仍必須依賴 有高品質的績效管理架構,方能有效地將決心轉化成能夠產生結果的行動。高品 質的組織績效管理架構有兩個重要原則:高效度的衡量結果和簡單化的衡量指 標,如表 27,讓組織成員和組織管理者共同感受到,組織績效管理和衡量不是 一個複雜、困難、難懂的內部自我監控過程,而是可以引導組織朝向更佳績效的 工具。 表27 組織績效衡量體系品質的判準 指標體系 結果效度 簡單 複雜 高 低 1. 結果高效度的績效衡量:組織績效衡量的結果必須具備高效度,即衡量組織 實際上達成潛在利害關係團體認為重要任務的績效表現資訊。高效度的衡量 結果可提供給組織外部和內部主要顧客覺得有用的績效資訊,協助他們得以 瞭解各自關切的業務領域之實際績效高低和可能問題成因等。為增進衡量結 果的效度,整套績效管理和衡量指標體系的建構,必要根據組織願景、目標 和策略等大方向演繹而出,這種觀點就是用策略管理引導績效管理和衡量。 2. 指標體系簡單化的績效衡量:績效衡量架構的內涵應求簡單化,簡單化包括 兩個意涵,一是績效衡量的策略目標面向數量必須精簡,一是績效衡量的全 部指標數量應該精簡,每個策略目標面向所對應的具體衡量指標數量最好在 4 個以內。績效衡量策略目標面向和衡量指標不能過多的目的,不是為簡單 而精簡,而是藉由簡單架構的框架限制下,促使組成員致力於討論出只有和 利害相關者具有直接連結性的重點,才應納入組織的績效管理與衡量架構 中,讓組織所有成員 – 從領導者、管理者到一般員工,將其行動努力的主 體聚焦於這些關鍵績效領域。 二、績效管理五個步驟 為期組織績效管理體系建構能符合上述兩大原則,參考相關文獻如美國都市


![表現指標[學前機構]](data:image/gif;base64,R0lGODlhAQABAIAAAP///wAAACH5BAEAAAAALAAAAAABAAEAAAICRAEAOw==)