I-Shou University
Master Thesis
Assess Applying New Technology’s
Benefit on the Job Satisfaction of
Employees - Case Study of Bricks
Production Facilities in Hai Duong
Advisor:
Dr. Joe. Y.C.Yang
Co-Advisor:
Dr. Truong An Quoc
Acknowledgements
First and foremost, I would like to express my gratitude to Dr. Joe Y.C.Yang and Dr. Truong An Quoc, my advisors for giving me the valuable knowledge backgrounds,
feedbacks and comments before and during the time of writing this Thesis.
I also would like to thank my family for their care and kindness that go beyond the Thesis as always. Thanks my classmate in IMBA program and partners for giving me good conditions, supports and comments for the thesis completion that would be a wonderful experience of my life. All of the mistakes in this thesis are solely my responsibility.
Abstract
The applications of new technologies in production have created higher quality products, shorter construction time, and labor productivity, so production efficiency is improved markedly. The study is to examine relationships among new technology application, job characteristics and job satisfaction in bricks production facilities in Hai Duong. The study used data from 225 employees working at bricks production facilities in Hai Duong. Principle component method is used for explorative factor analysis. To test the hypotheses regression, T-test and ANOVA are adopted. Result showed that new technology application and job characteristic have a positive relationship with job satisfaction and new technology application and job characteristic also have positive relationships. Results indicated that there were no different in job satisfaction among demographic of respondent. Implications of the findings for managers and research limitation are also discussed.
Keywords: new technology, job characteristic, job satisfaction, bricks industry, Haiduong province.
Table contents
Acknowledgements ... i
Abstract ... ii
Table contents... iii
List of Figure ... v
List of Table ... vi
Chapter 1 INTRODUCTION ... 1
1.1 Background ... 1
1.2 Overview of adobe bricks in Hai Dương Province ... 1
1.3 The objective of this study ... 2
1.4 Research Questions ... 3
1.5 Research contribution ... 3
Chapter 2 LITERATURE REVIEW ... 4
2.1 Introduction ... 4
2.2 The theory of technology ... 4
2.3 New technology’s benefit for Business ... 6
2.4 Satisfaction theory ... 8
2.5 The relationship of new technology and job satisfaction ... 10
2.6 Relationship between job characteristics and job satisfaction ... 11
2.7 Hypothesis and research framework ... 12
Chapter 3 RESEARCH METHODOLOGY ... 13
3.1. Introduction ... 13
3.2 Population ... 13
3.6.1 Reliability test ... 15
3.6.2 Factor analysis explored (EFA) ... 16
3.6.3. Linear regression ... 16
Chapter 4 RESULT ANALYSIS ... 17
4.1. Respondent demographic ... 17
4.2. Reliability analysis ... 18
4.3 Hypothesis testing ... 19
4.3.1 New technology application is positively related to job satisfaction ... 19
4.3.2 There is relationship between job characteristics and employees’ job satisfaction . 20 4.3.3 There is a relationship between new technology application and job characteristics.21 4.4 The difference among demographics of respondents in job satisfaction ... 22
4.4.1 The difference between genders of respondents in job satisfaction ... 23
4.4.2 The different in job satisfaction level among age group. ... 23
4.4.3 The different in job satisfaction level among education groups. ... 25
4.4.4 The different in job satisfaction level among position groups in company ... 25
4.4.5 The different in job satisfaction level among experience groups in company ... 26
4.5 Result discussion ... 26
Chapter 5 CONCLUSION AND RECOMMENDATION ... 28
5.1 Research summary ... 28
5.2 Research contribution ... 28
5.2.1 Academic contributions ... 28
5.2.2 Managerial contribution ... 29
5.3 Research limitation and suggestion for future study ... 31
Reference ... 32
List of Figure
List of Table
Table 2.1: Description of Hypothesis ... 12
Table 3.1 Variable and Item ... 14
Table 4.1: Respondent profife ... 17
Table 4.2 Cronbach’s alpha results ... 19
Table 4.3 The Regressions for relationship of new technology application and job satisfaction (H1) ... 20
Table 4.4 The Regressions for job characteristics and job satisfaction ... 21
Table 4.5 The Regressions for job characteristics and job satisfaction ... 22
Table 4.6 T – test of genders of respondents in job satisfaction ... 23
Table 4.7 ANOVA test of job satisfaction level among age group ... 24
Table 4.8 Post Hoc Tests of job satisfaction level among age group ... 24
Table 4.9 ANOVA test of job satisfaction level among education group ... 25
Table 4.10 ANOVA test of job satisfaction level among position group ... 26
Chapter 1 INTRODUCTION
1.1 Background
Despite dozens of businesses have contributed to the study and application of science to industry, the numbers are not many and most of the small and medium enterprises with potential weakness, according to the statistics of The Department of Applied Technology and Development (Ministry of Science and Technology). According to the Ministry of Agriculture, among 33,000 businesses which operate in the agricultural sector, over 93% are small and medium enterprises, and the level of business investment for technological innovation accounts for a small proportion of the total revenue, with 90% of enterprises under 10 billion (Rural economy, 2013)1 . According to the Department of Applied
Technology and Development (Ministry of Science and Technology), for 1,500 enterprises which engage in scientific and technological activities, only 350 enterprises have the potential to establish scientific and technological enterprises, while among them only 28 enterprises operating in the agricultural sector (8%) (Hoang Trieu, 2014)2 .
With abundant resources for brick industry, Hai Duong Province, with 144 brick production firms, has certainly great potential in this industry. In 2002 Hai Duong Province declared to "Apply new techniques to demonstrate brick vertical furnace with high efficiency, reduce environmental pollution, and contribute to sustainable development in Hai Duong province" But since then there has been no research related to benefit of applying new technology and employee satisfaction.
1.2 Overview of adobe bricks in Hai Dương Province
Currently the province of Hai Duong has three manufacturing enterprises adobe bricks with the product and the design capacity such as concrete tiles - aggregate capacity of 111.1 million tablets design standards (QTC )/year; aerated concrete brick AAC design capacity of 248.2 million tablets QTC/year; Mortar for lightweight concrete design capacity of 60,000 tons/year, the aforementioned products are standard quality standard
goods in Vietnam. In addition there are two businesses which implement projects in unburned material production capacity of 213.3 million tablets designed QTC/year (Hồng Quang, 2014)3.
According to Hong Quang (2014) Block had several advantages that can replace traditional terracotta tiles as possible to take advantage of industrial wastes as raw materials, fuel, capable of sound insulation, heat insulation, heat resistant, weather construction time-saving advantage is that ... but now, only about 18% adobe bricks used in the construction of Hai Duong. People mainly use adobe bricks for building constructions, sheds, fences ... Very few people use adobe bricks to build the house since habits and psychological factors are determining the choice of people. They have become accustomed to the presence of bricks for years. So they switched to using adobe bricks is a long and very difficult time. To promote the production and use of adobe bricks in construction, dated 05/21/2014, Chairman of Hai Duong issued Directive No. 11/2014 / CT-TTg regarding the increased use of building materials baked and limited production, using clay brick construction in the province. Whereby market adobe bricks in Hai Duong province has prospered, a series of construction projects in the province has used adobe bricks for construction, such as the Confederation of Labour Hai Duong, Office Resources Main Hai Duong, The Library of Literature Nguyen Luong Bang ... With a hand in the government, the business community, industry unburned materials of Hai Duong province will grow.
1.3 The objective of this study
- Understanding the factors that affect the application of new technology in the brick production
- Understanding the relationship between benefit of applied science and technology with the job satisfaction of employees
- Finding the factors related to technology makes employees feel satisfied with their jobs
3 Hong Quang ( 2014) HAI DUONG: PEOPLE FEAR TO TREAD WITH ADOBE BRICKS, Journal of
Construction electronic version Retrieved from < http://ficomyanmar.com/en/news/hai-duong-people-fear-tread-adobe-bricks.html
1.4 Research Questions
- What are the factors related to benefits of new technologies application in brick industry? - Is there a relationship between benefit of new technology application and employees’ job satisfaction?
- Are there differences between the demographic variables and job satisfaction in brick manufacturing business?
1.5 Research contribution
The production management can apply new technologies to improve both production quality and liberating the workers.
Claim theoretical basis of the relationship between benefit of applying science and technology and employees’ job satisfaction.
Chapter 2 LITERATURE REVIEW
2.1 Introduction
The applications of new technologies in production have created higher quality products, shorter construction time, and labor productivity, so production efficiency is improved markedly.
Therefore, this study attempts to examine the interaction effects of new technology application, job satisfaction, i.e. that contribute towards achieving organizational goals. It is strongly viewed that the interactions of these affect job satisfaction.
2.2 The theory of technology
"Technology is a method of machining, fabrication, make status changes, the nature and shape of raw materials or semi-finished products used in the manufacturing process to produce the finished product" (Attar and Sweiss , 2010 P. 45).
Technology has been defined in many ways. According to Arif A. and Karam A. (2001) technology refers either to a practical application of science to address a particular product or manufacturing need, or to an area of specialized expertise. A number of previous studies have shown the effects of technology on people’s behavior.
This study revealed how changes in technology have effects on workers’ job satisfaction in the workplace, while technology changes that did not account for human factors were likely to result in low morale and productivity (Arslan and Kivark, 2007). These findings highlighted the importance of technology in affecting employees’ behavior, thus determining performance.
According to the literature of Vu Cao Dam(2007), the author has three concepts of technology
Concept 1: "Technology is a strict order of operation of the processing material/ information
Concept 2: "Technology is a means (device) processing material / information, including: Hardware and Software".
Concept 3 (Model Sharif): "Technology is a body (system) knowledge of the processing material or information on the means and methods of processing material and / or information. Technology consists of four elements: Engineering (Technoware); Information (Inforware); People (Humanware); Organization (Orgaware)
Definition of ESCAP technology is considered a turning point in the concept of technology. According to this definition, not only produced new material technology that uses technology concepts are extended to all areas of social activity.
UNCTAD (1972) provides the definition of "technology is a necessary input for the production, and as such, it is bought and sold in the market as a commodity is shown in the following format:
z Production materials and sometimes intermediate products, which are bought and sold on the market, particularly associated with the investment decision.
z Human Resources, usually a qualified workforce and sometimes highly qualified manpower and expertise, with the ability to properly use the equipment and techniques and control apparatus and problem solving produce information.
The information, whether it is technical information or business information, launched on the market or be kept secret as part of the exclusive operation.
This definition shows that the essence of technology is the means of production, skilled manpower and information, and targeted inputs needed for production.
In this study, the authors use the concept of technological approach of two selected text Law. Technology is a set of methods, processes, skills, know-how, the means used to transform resources into product reliability. Products here consist of: technological line (line technology is the goal) and specific products are produced from the technological line (line technology serves as the means of production).
Lennart Elg (2014) stated that an innovation may often remain “up in the air” for a long time as a concept of what should be possible to achieve. Einstein described the scientific principles behind the laser more than 60 years before its first application. The competences needed to realize an innovation is far more complex than the scientific foundations of its basic principle.
2.3 New technology’s benefit for Business
Technological innovation is raised from the process of economic and social development. With the impact of science and advanced technology derived from the actual demand for products and services, the current state of the technology industry constantly improve the foundation for process innovation Technology occurs faster and stronger (Lennart Elg, 2014). According to Vu Cao Dam (2007) in the system of legal documents without a specific definition and formal for this concept, however, the core can have 5 cases of technological innovation:
(1) Introduce a new product;
(2) provide a new production methods or new trade; (3) Conquering new markets;
(4) Use of new materials;
(5) The new organization of production units.
Technological innovation success really means if it is the market, socially acceptable. Society is receiving technological innovation achievements, but also a place to provide resources for the success of technological innovation. Therefore Technological innovation is part of the planned economic development (Lennart Elg,(2014),.
Technological innovation derived from the demands and requirements of the social objective. Technological innovation is also inevitable path to success to be able to gain a competitive edge. Technological innovation is an important part of the development strategy (Geels et. al., 2008). Technological innovation to the growth of the city shifted from developing width to depth, creating production towards modernization, improving efficiency, competitiveness, and sustainable development.
Fagerberg et. al., (2011) show that focus Technological innovation towards creating appropriate technology, energy saving, consuming less resources, environmentally friendly, able to generate high economic value, contributing significantly to the total benefit of company . At the same time increasing levels of science, technology and the
share of localization technology. It should be done Technological innovation a comprehensive and effective to improve the business, ensuring sustainable development, environmental protection. Technological innovation structure towards technology combines multiple levels, acquisition and transfer of technology is the key, to go straight to the modern technologies for key sectors.
Since Granberg et. al., (2006) point out that strategy development of science and technology play an important role in the orientation of technological development and investment of each business to one side there are the incentives and support certain (capital, information ...) Government, on the other hand to ensure the business is going in the right direction, saving resources to avoid unnecessary risks. So Technological innovation content associated with the strategy to develop science and technology.
Tasks of technological innovation the work of all sectors, not only by the benefit but employee satisfaction and developed. Therefore, the company plays a supporting role, managing and tuning components.
Technological innovation the work of all social and economic sectors, not only by the city of deployment. Therefore, the city plays a supporting role, managing and adjusting the composition, where business is done the technological innovation must be taken center. Technological innovation is associated with company - sustainable development. However, to achieve that is not easy technological innovation must to preserve and protect the natural environment and society, raise the level of intellectual workers, making them adaptable and all machinery technology; and potentially more creative in business and production systems. For the key field, the key to focus resources to innovation sync from investing activities of modern equipment to train people, to change the method of production and Information for production (Granberg et. al., 2006).
Fagerberg et. al., (2011) discus technological innovation must first come from enterprises, the enterprises to actively implement. Technological innovation is an essential content in the manufacturing process of the business and must be done in by the business enterprise choices and conduct. The status of technology and equipment of Haiphong showed machinery systems in the list backward from 2 to 4 generations. So if the business does not actively Technological innovation, access to modern technology through technology
perform innovative research of new technologies, the business cannot succeed on the road to modernization (Granberg et. al., 2006). Base on Jacobsson et. al., (2010) study the most basic reason requires the state to support the technological innovation is to provide incentives for businesses, limiting the risks of investment in the private sector technological innovation. Therefore, the solution of state support should focus on the following two main topics:
+ Need to create and maintain a legal environment - through measures such as patent and antitrust activity - may increase the ability to generate revenues from investment acceptable technological innovation and thereby encourage such investment in the private sector.
In the above measures, financial instruments, especially the stuff about the tax is generally considered important. However, Etzkowitz et. al., (2000) recommend that non-financial instruments such as human resource development and industry standards are also important, particularly for developing countries. The fact is, the financial measures to encourage domestic technological innovation seem only successful if the government created the non-financial support is strong enough. For example, the research supports only work effectively when there are a large number of scientists and engineers with the ability to undertake R & D. Another factor to be included in the selection of the support mechanism innovation process is the innovation policy should be consistent with the needs of the country for a period determined by the development of technology. The policy should also change with the evolution of technology in the company (Etzkowitz et. al., 2000).
The technological innovation should actively promote the role of professional associations, trade unions because it is the influential organization for businesses as well as to the overall management system of the state. These associations can play a role as providers of information, support the strategic direction of the business in the technological innovation.
2.4 Satisfaction theory
Herzberg et al. (1987) argued that there are two groups of factors related to job satisfaction. These factors include motivate achievement, recognition, challenging work, progress, and mature work. Other factors include maintaining corporate policy and
corporate governance, supervision of their superiors, wages, relationship between individuals, working conditions, personal life, and assurance for work. Only these factors can motivate bring satisfaction to employees and otherwise maintain good personal factors will cause dissatisfaction among employees (Rahman, 2014).
Smith (1967) suggests that there are five factors affecting job satisfaction include: job satisfaction, satisfaction with supervision, satisfaction with pay, satisfaction with opportunities for advancement and agreed meet with colleagues.
The index describes the Job Descriptive Index job (JDI) by Smith et al. (1969), using five factors: job characteristics, superior, salaries, training opportunities - promotion and colleagues. The survey job descriptions (Job Satisfaction Survey - JSS) by Spector (1997) and satisfaction questionnaire Minnesota (Minnesota Satisfaction Questionair - MSQ) by Weiss et al. (1967) is typical 3 tools in measuring job satisfaction, which is the second MSQ JDI and tools are widely used both in practice and theory.
Job Satisfaction Scale (KDJS). such as:
.1. I get worthwhile and personal growth from my work .2. I am satisfied with the extent to which I can use my skills .3.I am satisfied with my workload
4.I am satisfied with overall staffing levels
.I am satisfied with the support available to me in my job 6. I am satisfied with the contact I have with colleagues
.7.I am satisfied with the opportunities I have to advance my career .8.I am satisfied with my salary/pay scale
2.5 The relationship of new technology and job satisfaction
Job satisfaction ha s been widely researched both in terms of its determinants and its predictive power. Researchers have noted that job satisfaction is directly related to employee turnover/retention rates (Shore, Newton et al. 1990, Abdullah (2013); Jehanzeb, K., Bashir, 2012 ) and absenteeism and indirectly to job performance and productivity although the findings for productivity have been somewhat contradictory. Research has been conducted with the general population of workers.Despite the ever more pervasive presence of technology in the workplace, there have been few empirical studies of the effect of computer use on job satisfaction (Zhu and Wang, 2007). For many workers, their daily activity is now highly dependent on the use of computers. For example, high levels of computer use are a feature of those who have come to be labeled as “knowledge workers,” -- namely those workers whose main tasks involve the collection, manipulation, interpretation and communication of information. Indeed, for many workers, most information regarding the organization (e.g., contact information, policies and procedures, employee benefits, etc.) is available only electronically ( El-Mashaleh, 2007)
This study enhance the overall assessment of job satisfaction mainly based on James Danziger and Debora Dunkle (2005) questionnaire study and referred other research including Scheer et al., (2007); Oladapo, (2007) and Samuelson, (2008). First, skill development is a 5-point (agree to disagree) scale: “People are encouraged to develop their skills.” We expect that workers who are able to improve and add to their skill set will report higher satisfaction in the job. Second, work autonomy is measured by the extent to which the respondent agrees with the statement “I have a lot of say over what happens in my job.” while third, work influence is measured by the extent to which the respondent agrees with the statement “I can influence my supervisors on work-related matters.” Both high levels of autonomy and influence have been consistently found to be associated with higher levels of job satisfaction. Finally, the extent to which the organization is an information-rich environment might add to job satisfaction. This is measured by the mean score of responses to three 5-point Likert-scaled items:
1. People are encouraged to develop their skills 2. I have a lot of say over what happens in my job
3. I can influence my supervisors on work-related matters 4. I can quickly adapt with new technology that I need for work; 5. The new technology I need for my work is always available 6. The technology that I need for my work is always up-to-date. 7. I can learn new things from new technology
8. We can see the productive efficiency from new technology 9. My job is safer when applying the technology innovation
2.6 Relationship between job characteristics and job
satisfaction
Four indicators of job characteristics are used in the analysis. this thesis focus s on indicators which we believe are reflective of jobs in which new technology are necessary for the completion of job tasks. We have identified two measures new technology use such as:
1. My job forces me to learn new things continuously 2. I never seem to have enough time to get my job done 3. In my major work tasks I rely extensively on technology
4. In my major work tasks, much of my time involves with innovation technology 5. I spend a substantial amount of my time in using the machine.
6. With new technology I fell my task is meaning full 7. I can use wide range of my skills with new technology
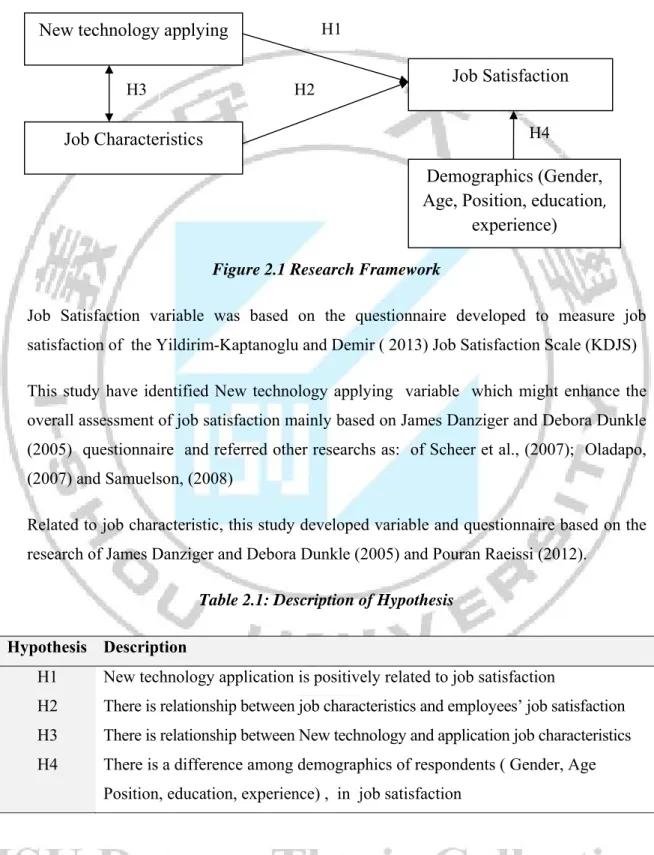
2.7 Hypothesis and research framework
From the discussion above, this research comes out with the flowing research frame work and hypothesis:
Figure 2.1 Research Framework
Job Satisfaction variable was based on the questionnaire developed to measure job satisfaction of the Yildirim-Kaptanoglu and Demir ( 2013) Job Satisfaction Scale (KDJS) This study have identified New technology applying variable which might enhance the overall assessment of job satisfaction mainly based on James Danziger and Debora Dunkle (2005) questionnaire and referred other researchs as: of Scheer et al., (2007); Oladapo, (2007) and Samuelson, (2008)
Related to job characteristic, this study developed variable and questionnaire based on the research of James Danziger and Debora Dunkle (2005) and Pouran Raeissi (2012).
Table 2.1: Description of Hypothesis
Hypothesis Description
H1 New technology application is positively related to job satisfaction
H2 There is relationship between job characteristics and employees’ job satisfaction H3 There is relationship between New technology and application job characteristics H4 There is a difference among demographics of respondents ( Gender, Age
Position, education, experience) , in job satisfaction
New technology applying
Job Characteristics
Job Satisfaction
H1 H2 H3Demographics (Gender,
Age, Position, education
,experience)
Chapter 3 RESEARCH METHODOLOGY
3.1. Introduction
This study used the questionnaire (in the level of Likert from 1- strongly disagree to 5 - strongly agree) to collect data to test hypotheses quantitative approach is applied to the test the hypothesis of this study.
3.2 Population
Questions will be distributed to employees at Haiduong Brick factory; and the goal is to collect 150 samples of the survey questions from different units in April to May, 2015.
3.3 Structure variables
Job Satisfaction variable was was based on the questionnaire developed to measure job satisfaction of the Yildirim-Kaptanoglu and Demir ( 2013) Job Satisfaction Scale (KDJS) This study have identified New technology applying variable which might enhance the overall assessment of job satisfaction mainly based on James Danziger and Debora Dunkle (2005) questionnaire and referred other researchs as: of Scheer et al., (2007); Oladapo, (2007) and Samuelson, (2008)
Related to job characteristic, this study developed variable and questionnaire based on the research of James Danziger and Debora Dunkle (2005) and Pouran Raeissi (2012).
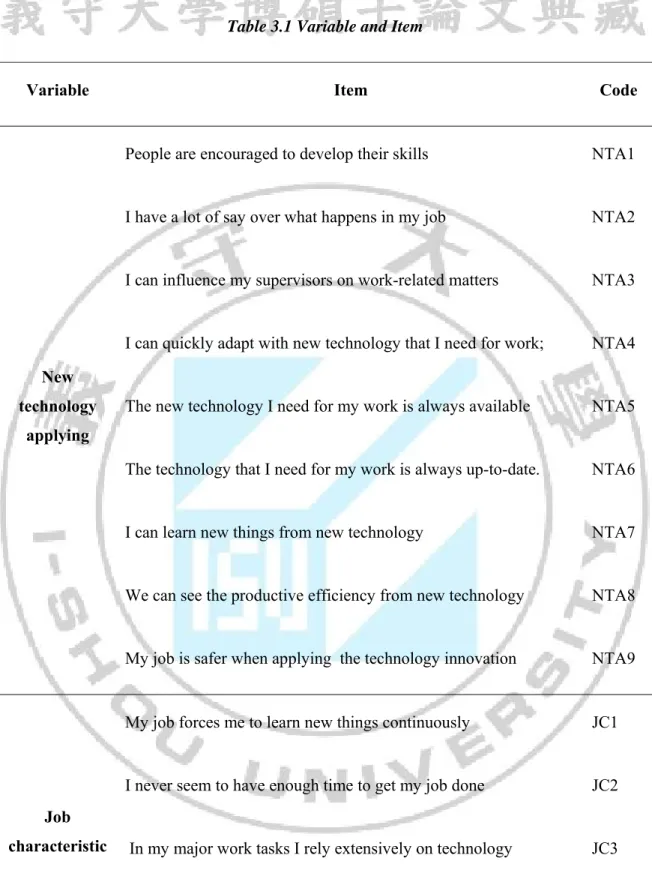
Table 3.1 Variable and Item
Variable Item Code
New technology
applying
People are encouraged to develop their skills NTA1
I have a lot of say over what happens in my job NTA2
I can influence my supervisors on work-related matters NTA3
I can quickly adapt with new technology that I need for work; NTA4
The new technology I need for my work is always available NTA5
The technology that I need for my work is always up-to-date. NTA6
I can learn new things from new technology NTA7
We can see the productive efficiency from new technology NTA8
My job is safer when applying the technology innovation NTA9
Job characteristic
My job forces me to learn new things continuously JC1
I never seem to have enough time to get my job done JC2
In my major work tasks I rely extensively on technology JC3
In my tasks, much of my time involves with innovation technology
I spend a substantial amount of my time in using the machine. JC5
With new technology I fell my task is meaning full JC6
I can use wide range of my skills with new technology JC7
Job
satisfaction
I get worthwhile and personal growth from my work JS1
I am satisfied with the extent to which I can use my skills JS2
I am satisfied with my workload JS3
I am satisfied with overall staffing levels JS4
I am satisfied with the support available to me in my job JS5
I am satisfied with the contact I have with colleagues JS6
I am satisfied with the opportunities I have to advance my career JS7
I am satisfied with my salary/pay scale JS9
I am satisfied with the amount of job security I have JS10
3.6 Analysis
3.6.1 Reliability test
Accordingly, only those variables with a correlation coefficient of total conformity variables (Corrected Item-Total Corrlation) greater than 0.3 and an alpha coefficient greater than 0.6 to be considered acceptable and included in the analysis appropriate next steps . Many researchers agree that the Cronbach Alpha of 0.8 or higher to close the measurement scale as well, from 0.7 to 0.8 is almost unusable. Researchers also suggest that Cronbach's alpha of 0.6 or higher can be used in the case study concept is new or new to the respondents in the research context.
3.6.2 Factor analysis explored (EFA)
Factor analysis was used to explore EFA to determine the structure of the relationship between the observed variables and the latent variables. EFA analysis which was conducted according to the type of discovery to determine the scope and extent of the relationship between the observed variables and factors like basis, as the basis for a set of measurements to a shortened or reduce the number of observed variables upload facility factors. Number of factors depending on the basis of model studies, in which they bound together by rotating axis intersecting vectors to occur no correlation. Factor Analysis EFA is useful in the initial experimental steps or extended testing.
3.6.3. Linear regression
Regression analysis is to find dependencies of a variable, called the dependent variable to one or more other variables, called the independent variable for the purpose of estimating or predicting the expected value of the dependent variable when know the values of the independent variables Some other names of the dependent variable and the following independent variables:
Dependent variable: the variable is explained, forecasting variable, the regression variables, response variables, endogenous variables.
Independent variable: Explanatory variables, predictor variables, repressors, variables or factors controlling variables, exogenous variables.
Chapter 4 RESULT ANALYSIS
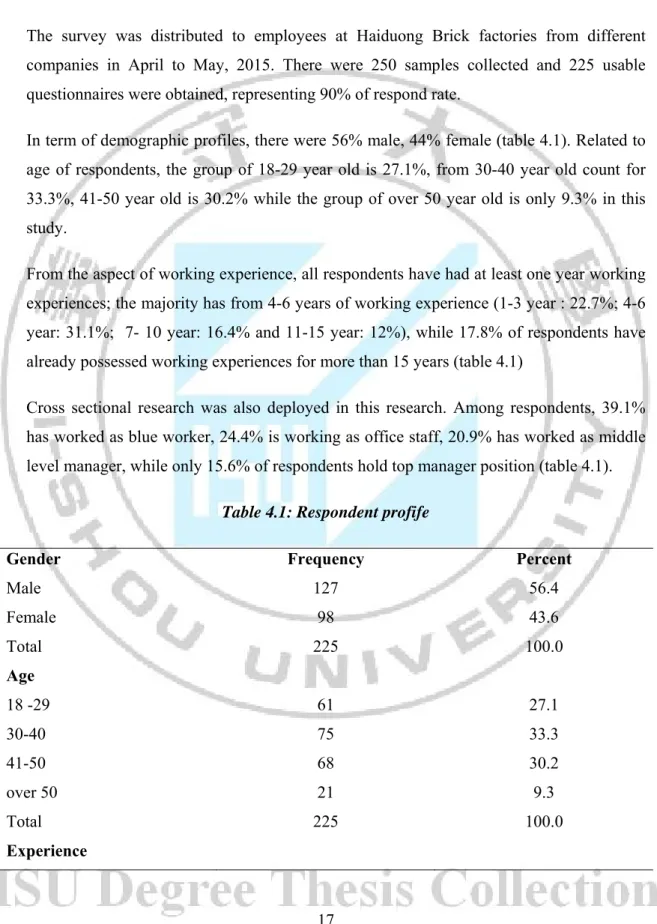
4.1. Respondent demographic
The survey was distributed to employees at Haiduong Brick factories from different companies in April to May, 2015. There were 250 samples collected and 225 usable questionnaires were obtained, representing 90% of respond rate.
In term of demographic profiles, there were 56% male, 44% female (table 4.1).Related to age of respondents, the group of 18-29 year old is 27.1%, from 30-40 year old count for 33.3%, 41-50 year old is 30.2% while the group of over 50 year old is only 9.3% in this study.
From the aspect of working experience, all respondents have had at least one year working experiences; the majority has from 4-6 years of working experience (1-3 year : 22.7%; 4-6 year: 31.1%; 7- 10 year: 16.4% and 11-15 year: 12%), while 17.8% of respondents have already possessed working experiences for more than 15 years (table 4.1)
Cross sectional research was also deployed in this research. Among respondents, 39.1% has worked as blue worker, 24.4% is working as office staff, 20.9% has worked as middle level manager, while only 15.6% of respondents hold top manager position (table 4.1).
Table 4.1: Respondent profife
Gender Frequency Percent
Male 127 56.4 Female 98 43.6 Total 225 100.0 Age 18 -29 61 27.1 30-40 75 33.3 41-50 68 30.2 over 50 21 9.3 Total 225 100.0
1-3 year 51 22.7
4-6year 70 31.1
7-10 year 37 16.4
11-15 year 27 12.0
more than 15 year 40 17.8
Total 225 100.0
Position
Blue color worker 88 39.1
White color worker 55 24.4
Middle level manager 47 20.9
Top manager 35 15.6
Total 225 100.0
Education
Less than high school 66 29.3
Completed high school 56 24.9
Completed college 71 31.6
Bachelor degree of more 32 14.2
Total 225 100.0
Regarding to the education of respondents, there are 29.3% is less than high school, completed high school count for 24.9%. There are 31.6% of respondents who get the degree of vocational school so called college. The respondents who have completed bachelor degree of more of this study are 14.2%. This result is reasonable since most employees at Haiduong Brick factories are manual workers
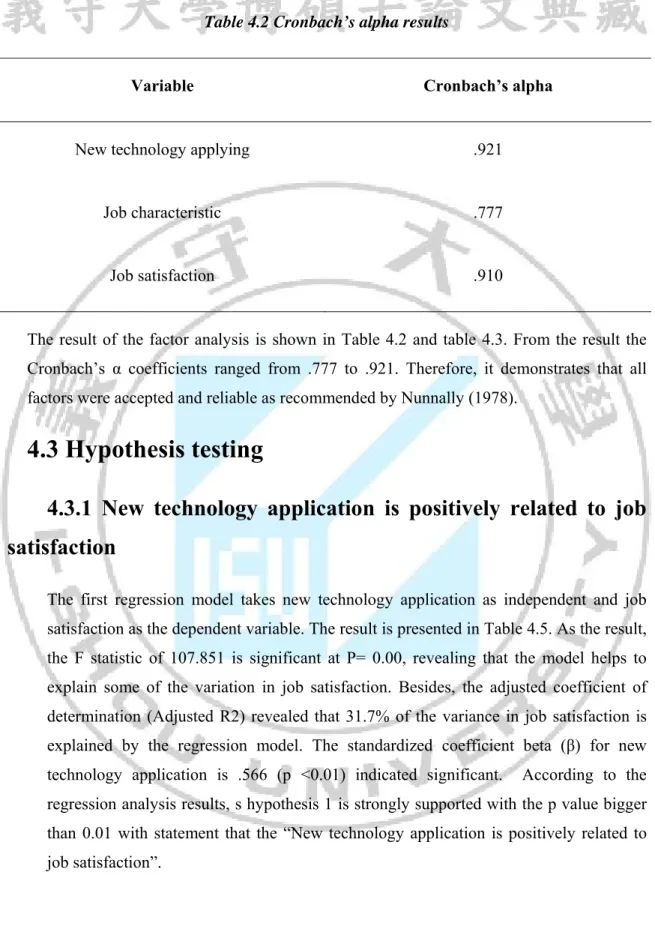
4.2. Reliability analysis
To test the reliability and internal consistency of each factor, the Cronbach’s alpha of each was determined. The results showed that the alpha coefficients of .921 in “New technology applying”; .777 in “Job characteristic” and .910 for “Job satisfaction” . (Table 4.2)
Table 4.2 Cronbach’s alpha results
Variable Cronbach’s alpha
New technology applying .921
Job characteristic .777
Job satisfaction .910
The result of the factor analysis is shown in Table 4.2 and table 4.3. From the result the Cronbach’s α coefficients ranged from .777 to .921. Therefore, it demonstrates that all factors were accepted and reliable as recommended by Nunnally (1978).
4.3 Hypothesis testing
4.3.1 New technology application is positively related to job
satisfaction
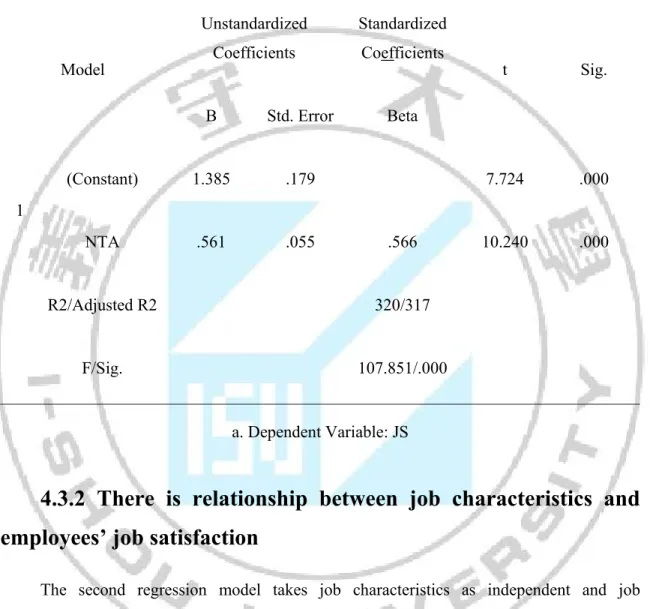
The first regression model takes new technology application as independent and job satisfaction as the dependent variable. The result is presented in Table 4.5. As the result, the F statistic of 107.851 is significant at P= 0.00, revealing that the model helps to explain some of the variation in job satisfaction. Besides, the adjusted coefficient of determination (Adjusted R2) revealed that 31.7% of the variance in job satisfaction is explained by the regression model. The standardized coefficient beta (β) for new technology application is .566 (p <0.01) indicated significant. According to the regression analysis results, s hypothesis 1 is strongly supported with the p value bigger than 0.01 with statement that the “New technology application is positively related to job satisfaction”.
Table 4.3 The Regressions for relationship of new technology application and job satisfaction (H1) Coefficientsa Model Unstandardized Coefficients Standardized Coefficients t Sig. B Std. Error Beta 1 (Constant) 1.385 .179 7.724 .000 NTA .561 .055 .566 10.240 .000 R2/Adjusted R2 320/317 F/Sig. 107.851/.000 a. Dependent Variable: JS
4.3.2 There is relationship between job characteristics and
employees’ job satisfaction
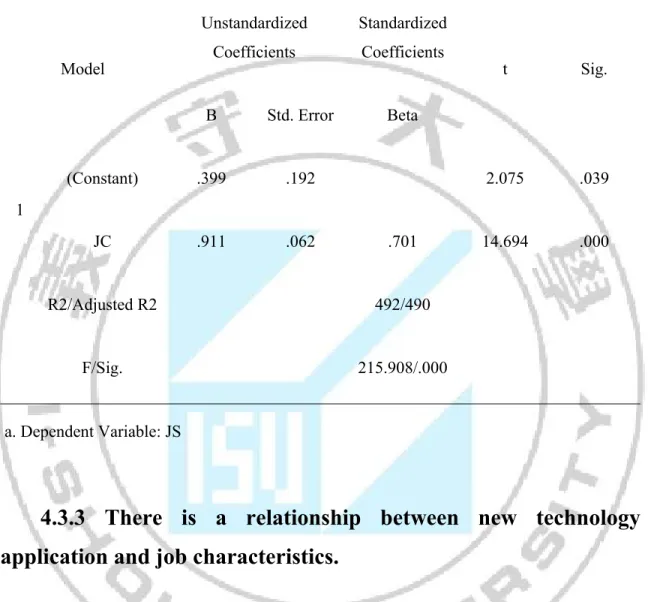
The second regression model takes job characteristics as independent and job satisfaction as the dependent variable and is. The result is presented in Table 4.7. As the result, the F statistic of 215.908 is significant at P= 0.00, revealing that the model helps to explain some of the variation in job satisfaction. Besides, the adjusted coefficient of determination (Adjusted R2) revealed that 49% of the variance in job satisfaction is explained by the regression model. The standardized coefficient beta (β) for job characteristics is .701 (p <0.01) indicated significant. According to the regression analysis results, hypothesis 2 is strongly supported with the p value bigger than 0.01 with statement that “job characteristics is positively related to job satisfaction”.
Table 4.4 The Regressions for job characteristics and job satisfaction Coefficientsa Model Unstandardized Coefficients Standardized Coefficients t Sig. B Std. Error Beta 1 (Constant) .399 .192 2.075 .039 JC .911 .062 .701 14.694 .000 R2/Adjusted R2 492/490 F/Sig. 215.908/.000 a. Dependent Variable: JS
4.3.3 There is a relationship between new technology
application and job characteristics.
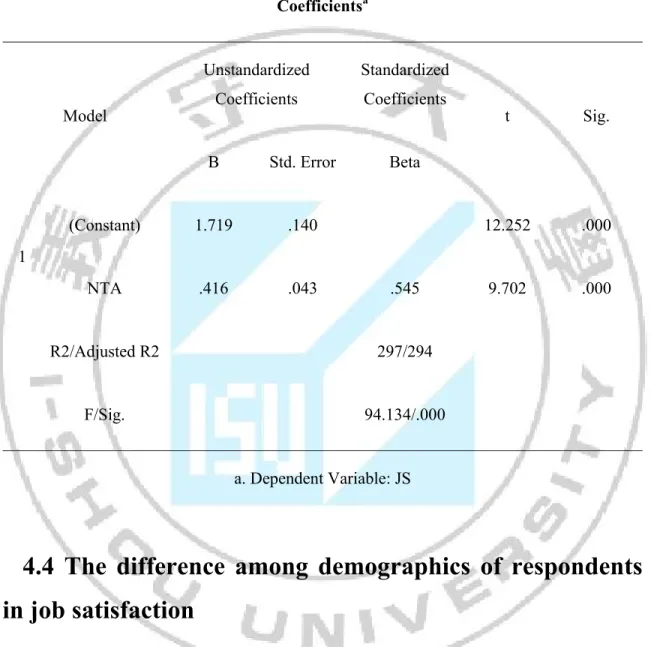
The forth regression model takes new technology application as independent and job characteristics. as the dependent variable and is. The result is presented in Table 4.7. As the result, the F statistic of 94.134 is significant at P= 0.00, revealing that the model helps to explain some of the variation in job characteristics. Besides, the adjusted coefficient of determination (Adjusted R2) revealed that 29.4% of the variance in job characteristics is explained by the regression model. The standardized coefficient beta (β) for new technology application is .545 (p <0.01) indicated significant. According to
0.01 with statement that “there is a relationship between new technology application and job characteristics.”
Table 4.5 The Regressions for job characteristics and job satisfaction
Coefficientsa Model Unstandardized Coefficients Standardized Coefficients t Sig. B Std. Error Beta 1 (Constant) 1.719 .140 12.252 .000 NTA .416 .043 .545 9.702 .000 R2/Adjusted R2 297/294 F/Sig. 94.134/.000 a. Dependent Variable: JS
4.4 The difference among demographics of respondents
in job satisfaction
For further testing the characteristic of respondent relate to job satisfaction. This study firstly uses the T-test method for testing the different satisfaction level between male and female. ANOVA method was used to test the different job satisfaction level among age, education, position and experience of employee.
4.4.1 The difference between genders of respondents in job
satisfaction
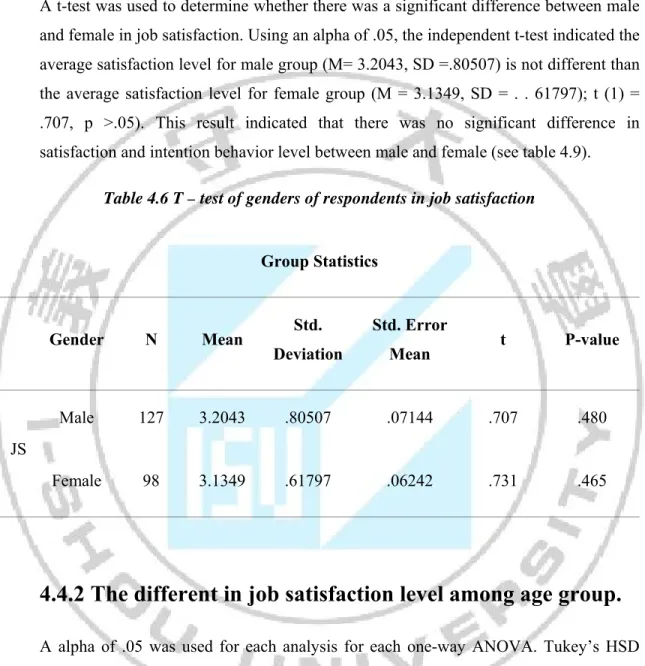
A t-test was used to determine whether there was a significant difference between male and female in job satisfaction. Using an alpha of .05, the independent t-test indicated the average satisfaction level for male group (M= 3.2043, SD =.80507) is not different than the average satisfaction level for female group (M = 3.1349, SD = . . 61797); t (1) = .707, p >.05). This result indicated that there was no significant difference in satisfaction and intention behavior level between male and female (see table 4.9).
Table 4.6 T – test of genders of respondents in job satisfaction
Group Statistics Gender N Mean Std. Deviation Std. Error Mean t P-value JS Male 127 3.2043 .80507 .07144 .707 .480 Female 98 3.1349 .61797 .06242 .731 .465
4.4.2 The different in job satisfaction level among age group.
A alpha of .05 was used for each analysis for each one-way ANOVA. Tukey’s HSD procedure was used to conduct pairwise comparisons following the ANOVA tests ( Table 412). The age group includes: 18-29; 30-40; 41-50 and over 50. The result indicated that there was significant difference in age group and job satisfaction. (F (3, 221) = 5.937. p <0.05)
Table 4.7 ANOVA test of job satisfaction level among age group
ANOVA JS
Sum of Squares df Mean Square F Sig.
Between Groups 8.873 3 2.958 5.937 .001
Within Groups 110.102 221 .498
Total 118.975 224
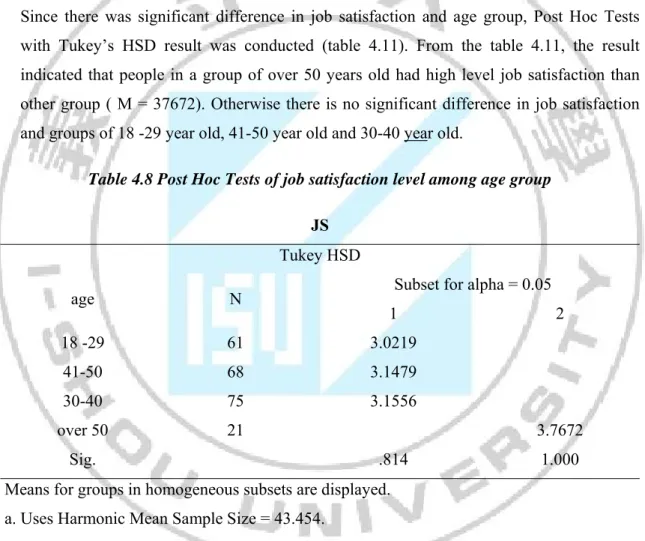
Since there was significant difference in job satisfaction and age group, Post Hoc Tests with Tukey’s HSD result was conducted (table 4.11). From the table 4.11, the result indicated that people in a group of over 50 years old had high level job satisfaction than other group ( M = 37672). Otherwise there is no significant difference in job satisfaction and groups of 18 -29 year old, 41-50 year old and 30-40 year old.
Table 4.8 Post Hoc Tests of job satisfaction level among age group
JS Tukey HSD
age N Subset for alpha = 0.05
1 2 18 -29 61 3.0219 41-50 68 3.1479 30-40 75 3.1556 over 50 21 3.7672 Sig. .814 1.000 Means for groups in homogeneous subsets are displayed.
a. Uses Harmonic Mean Sample Size = 43.454.
b. The group sizes are unequal. The harmonic mean of the group sizes is used. Type I error levels are not guaranteed.
4.4.3 The different in job satisfaction level among education
groups.
A alpha of .05 was used for each analysis for each one-way ANOVA. Tukey’s HSD procedure was used to conduct pairwise comparisons following the ANOVA tests ( Table 412). The education group includes: Bachelor degree of more, Less than high school, Completed high school, Completed college. The result indicated that there was no significant difference in education level and job satisfaction. (F (3, 221) = 1.552. p >0.05)
Table 4.9 ANOVA test of job satisfaction level among education group
ANOVA JS
Sum of Squares df Mean Square F Sig.
Between Groups 2.455 3 .818 1.552 .202
Within Groups 116.520 221 .527
Total 118.975 224
4.4.4 The different in job satisfaction level among position
groups in company
A alpha of .05 was used for each analysis for each one-way ANOVA. Tukey’s HSD procedure was used to conduct pairwise comparisons following the ANOVA tests (Table 4.13). The position group includes: Blue color worker, Top manager, Middle level manager and White color worker. The result indicated that there was no significant difference in position and job satisfaction. (F (3, 221) = 2.049. p >0.05).
Table 4.10 ANOVA test of job satisfaction level among position group
ANOVA JS
Sum of Squares df Mean Square F Sig.
Between Groups 3.220 3 1.073 2.049 .108
Within Groups 115.755 221 .524
Total 118.975 224
4.4.5 The different in job satisfaction level among experience
groups in company
A alpha of .05 was used for each analysis for each one-way ANOVA. Tukey’s HSD procedure was used to conduct pairwise comparisons following the ANOVA tests (Table 412). The experience group includes: 1-3 year, 4-6year, 7-10 year, 11-15 year and more than 15 year. The result indicated that there was no significant difference in work experience and job satisfaction. (F (4, 220) = 1.998; p >0.05)
Table 4.11 ANOVA test of job satisfaction level among experience group
ANOVA JS
Sum of Squares df Mean Square F Sig.
Between Groups 4.170 4 1.043 1.998 .096
Within Groups 114.805 220 .522
Total 118.975 224
4.5 Result discussion
From the result analysis, the regression models show that new technology application is positively related to job satisfaction, there is relationship between job characteristics and employees’ job satisfaction and new technology application have a relationship with job characteristics. As discussed by Noe et. al., (2006) new technologies can result in employees “working smarter” as well as providing high-quality products and more efficient services to customers. Companies, which have realized the greatest gains from
using new technology and practicing human resource management, support the use of technology to create what is known as high-performance work systems. Work, training, programs and reward systems often need to be reconfigured to support employees’ use of new technology. With the result of correlation among instinct job characteristic and extinct job characteristic, it can be conclude that, with the fast changing in technology innovation in all levels and sectors, all employees have to update knowledge and skills to adapt with new technology. As Goh, (2005) suggests that business strategy must support investments in technology change and focus on job characteristic of , their technology needs and ability to manage change. The possibility of making use of new technology to support new ways of working and to make the process more efficient is increasing (Samuelson, 2008).
Related to hypothesis 4there was a significant difference in demographics of respondents and job satisfaction. The result of T-test and ANOVA show that there are only one group of respondent demographic different in job satisfaction – age group with the people who is over 50 year old have high level of job satisfaction (M= 3.7672). Otherwise there are not any different among characteristic of respondent to job satisfaction. Traditional labor in brick industry usually is part time employee since they are almost is farmer and the main income come from agriculture product. So the level of satisfaction is not so difference. However, if the new technology like unburned material production line and make it more professional in managing so it will improve level of employee satisfaction asthe result of this study and other study as Samuelson, (2008), and Noe et. al., (2006)
Chapter 5 CONCLUSION AND
RECOMMENDATION
5.1 Research summary
The purpose of this study is investigating the relationship among new technology application, job characteristic and job satisfaction. Results show that new technology application is positively related to job satisfaction; there is relationship between job characteristics and employees’ job satisfaction and new technology application have a relationship with job characteristics. This paper attempted to provide a basis for understanding the perception of new technology adoption and its relationship with job satisfaction for employees working in brick industry. Results is associated with the research of Ghalia and Rateb ( 2010), who pointed that more investment in technology would rather increase employee job satisfaction regarding intrinsic, extrinsic and general perspectives. Construction technology in general and Brick industry in particular has great prudential in the developing country such as Vietnam
In recent year in Vietnam the construction industry around the world, both in developed and emerging economies is facing various challenges. The identification of the issues are more critical for emerging economies, which would help to address the research efforts more effectively. The solution for new technology application is strongly requirement and unburned material is good solution for this issue. Besides applying the unburned brick also the solution for environment problems since it is the big concern for all countries in the world (Serpell and Barai, 2007).This research is poised to expand the general knowledge-base for further research into the area of brick industry and technology.
5.2 Research contribution
5.2.1 Academic contributions
The production management can apply new technologies to improve both production quality and liberating the workers. Claim theoretical basis of the relationship between benefit of applying science and technology and employees’ job satisfaction. As Hong Quang (2014) shows that several advantages that can replace traditional terracotta tiles
as possible to take advantage of industrial wastes as raw materials, fuel, capable of sound insulation, heat insulation, heat resistant, weather construction time-saving advantage is that ... but now, only about 18% adobe bricks used in the construction of Haiduong. Research also contribute to promote the production and use of adobe bricks in construction, as the Directive No. 11/2014 / CT-TTg regarding the increased use of building materials baked and limited production, using clay brick construction in the province issued on 05/21/2014 by chairman of Hai Duong.
Related to T-test and ANOVA test result, there are only one group of respondent demographic different in job satisfaction – age group with the people who is over 50 year old have high level of job satisfaction (M= 3.7672). Otherwise there are not any different among characteristic of respondent to job satisfaction. Employees get a lot of benefits from applying new technology and development productive (Jehanzeb and Bashir, 2012). Most employees recognize the importance of new technology and would like to increase their income from it (Dillich, 2000). Employees have no feeling about their organizations, if they think that their organizations are not caring about the technology innovation (Garger, 1999).
5.2.2 Managerial contribution
In developed countries, the use of burning material in construction is as a prerequisite. Environmental factors, resources are always taken seriously and the legislation has its enormous impact. From the result, this study comes out some recommendations to improve the application of new technology in producing the brick as well as improving the efficiency of human resource.
As reported by University of Civil Engineering (2014) In France and the UK, companies, which invested the power plants must commit using 90% coal ash to produce bricks, concrete ... while government policy had supported the production of adobe bricks from ash. In Thailand, there is no need to issue incentive policies to encourage construction material unfired state but strict management of land use and environmental factors. Therefore, calcined material is much higher priced building materials unburned. Market factors that regulate the building materials industry in
Currently, in Vietnam the use of adobe bricks are facing some difficulties and challenges, requiring solutions and efficient synchronization. Some suitable solutions in Vietnam as well as Haiduong conditions can make the route taken adobe brick replacement brick entire future is:
- Improving production technologies adobe bricks, research using all sources of industrial waste such as ash, rock dust ...
- Capacity building for local mechanical equipment manufacture adobe bricks production to reduce imports, and strive to 2020 no imports.
- Revision, complete synchronized system of standards, regulations, specifications, technical procedures, rules and guidelines for implementation of economic and technical norms related to the production and use adobe bricks, enabling consultants, designers put unbaked brick in the building.
- To bring unbaked brick in life, need good organization of information dissemination to the State management agencies, entities in construction activity and people realize the advantages point advantage in the production and use of adobe bricks. Also see the negative impacts of the production and use of clay brick unplanned, to concentrate all production capacity development and use of adobe bricks, help develop industry building materials address our country sustainably.
Using materials adobe bricks replace the traditional brick and modern trends in the industry inevitably produce building materials. Solutions to reduce emissions into the environment, and can make use of waste materials for the manufacturing industry as thermal coal ash, rock dust, soil hills ... We can say that the material production technology adobe bricks are clean and advanced technology. However require undertakings and synchronization solutions in the implementation.
Human is center of company and its operation, to successfully implement the applying new technology should promote an active role and creative. Enterprises also need to fully implement the solutions similar micro-macro solutions but at the enterprise level and focused specifically on the content of business. However, during applying new technology company should be managed and instructed to comply with the general view of Haiduong province. applying the new technology like unburned material production line and make it more professional in managing so it will improve level of employee satisfaction as the this study supported result.
5.3 Research limitation and suggestion for future study
Although the theoretical contribution and managerial implication, some limitations of the research to be considered. The first limitation is that the sample is just conducted in Haiduong province, northern of Vietnam; therefore, the future research should perhaps be conducted with bigger number with variety area. Secondly, the model should be more developed by adding other variables such as turnover, commitment…and the model should be tested by other method to validated the result. A third limitation is related to sample characteristics that may limit the generalization of the results to some degree.Reference
Arif A. and Karam A. (2001). Architectural practices and their use of IT in the western cape province, South Africa. Journal of Information Technology in Construction (ITcon), 6,(2), 17-34.
Arslan G. and Kivark S. (2007). E-business transformation stages for construction
companies. In Soibelman L. and Akinci B. (Eds.), Proceeding of the 2007 ASCE international
workshop on computing in civil engineering, Pittsburgh, Pennsylvania, USA, 745-755.
Attar G, Sweiss R (2010) The relationship between information technology adoption and job satisfaction in contracting companies in Jordan, Journal of Information
Technology in Construction (ITcon), (l), 15, 44-63,
Aysegül Yildirim Kaptanoglu and Tarik Demir (2013) Examining job satisfaction among perfusionists: A brief report from Istanbul, J Pak Med Assoc, 63 (9), 1157 - 1162
El-Mashaleh M.S. (2007). Benchmarking information technology utilization in the construction industry in Jordan. Journal of Information Technology in Construction (ITcon), 12(19), 279-291.
ESCAP ( 2014), Economic and social survey of Asia and the Pacific: Regional connectivity for shared prosperity, The ESCAP Publications Office, New York.
Etzkowitz, Henry & Loet Leydesdorff, (2000) The dynamics of innovation: from National Systems and ‘Mode 2’ to a Triple Helix of university–industry–government relations,
Research Policy, l 29,109–123
Fagerberg, Jan, Maryann Feldman & Martin Shrolec (2011), Technological Dynamics and
Social Capability: Comparing U.S: States and European Nations, CIRCLE Electronic
Working Papers no. 2011/11
Garger, E. M. (1999). Goodbye training, hello learning. Work force, 78 (11): 35-42.
Geels, F.W., Hekkert, M.P., Jacobsson, S. (2008) The dynamics of sustainable innovation journeys, Technology Analysis and Strategic Management, 20 (5), 521-536
Goh B. (2005). IT barometer 2003: Survey of the Singapore construction industry and a comparison of results. Journal of Information Technology in Construction (ITcon), 10 (1), 1-13. Granberg, Anders, Staffan Jacobsson (2006) Myths or reality - a scrutiny of dominantbeliefs in the Swedish science policy debate, Science and Public Policy, 3 (5), 321-340
Heertje, A. (2006). Schumpeter on the Economics of Innovation and the Development of
Capitalism, edited by J. Middendorp, Cheltenham: Edward Elgar.
Herzberg, F. (1987). One more time: How do you motivate employees? Harvard Business
Review, 65(5), 109 – 128.
Jacobsson, Staffan, Eugenia Perez Vico (2010) Towards a systemic framework for capturing and explaining the effects of academic R&D, Technology Analysis & Strategic Management, 22 (7)
James Danziger and Debora Dunkle (2005) Information Technology and Worker Satisfaction,
Center for Research on Information Technology and Organizations, School of Social
Sciences University of California, Irvine CA 92697-4650
Jehanzeb, K., Bashir, N. A. (2012). Training And Development Program and Its Bene¿ ts to Employees and Organizations: A Conceptual Study. Far East Journal of Psychology and
Business, 9(2), 58-71.
Jehanzeb, K., Bashir, N. A. (2012). Training And Development Program and Its Benefi ts to Employees and Organizations: A Conceptual Study. Far East Journal of Psychology and
Business, 9(2) 58-71
Joby, J. & Panchanatham, N., (2014) Influence of Job Satisfaction and Organizational Commitment on Job Involvement towards Organizational Effectiveness, INDIAN JOURNAL
OF APPLIED RESEARCH, 4 (1), 280 -282
Kurz, H. D. (2005). Sozialökonom zwischen Marx und Walras, Marburg: Metropolis.
Lennart Elg (2014), Innovations and new technology - what is the role of research?
Locke, E. A. and Latham, G. P. (2002). Building a practically useful theory of goal setting and task motivation: A 35-year odyssey. American Psychologist, 57(9), 705-717.
Lu, H., While, A., Barriball, L., 2005. Job satisfaction among nurses: a literature review.
International Journal of Nursing Studies, 42, 211–227.
Luddy, Nezaam (2005), Job Satisfaction amongst Employees at a Public Health Institution in
the Western Cape, University of Western Cape, South Africa
Noe R., Hollenbeck J., Gerhart B. and Wright P. (2006). Human Resources Management, (5th ed.). New York: McGraw-Hill/Irwin.
Pouran Raeissi (2012) The relationship between job characteristics of mergency medical technicians and scene time in traumatic injuries, International Journal of Medicine and
Medical Sciences 4(9), 186-191University of Civil Engineering (2014) Reality and materials
development solutions adobe bricks, Journal of Construction (5) retrieved from
http://vlxd.nuce.edu.vn/index.php?lg=1&id=2475.
Rahman, H., Abdullah Al Mamun, M. (2013). HRM Focus on Distinctive Human Capital and Strategy of Building-Retaining Competitive Advantage. Global Journal of Management and
Business Research, 13(11), 13-18.
Rose, M. (2005). Job Satisfaction in Britain: Coping with Complexity, British Journal of
Industrial Relations 43(3), 455-467.
Samuelson O. (2008). The IT-barometer – A decade's development of IT use in the Swedish construction sector. Journal of Information Technology in Construction (ITcon), 13 (1), 1-19. Scott, K. D., Jusanne, M., & Steven, M. E. (2000). Factors influencing employee benefits beliefs that, pay is tied to performance. Journal of Business and Psychology, 14, 553-562. Sousa-Poza, A. and A. A. Sousa-Poza ( 2000). Taking Another Look at the Gender/Job-Satisfaction Paradox. Kyklos, 53(2), 135-152.
Spector, P. E. (1997). Job Satisfaction. Application, assessment, causes, and. consequences. Thousand Oaks, California Sage Publications, Inc.
Srivastava A.K. ( 2008) Effect of Perceived Work Environment on Employees’ Job Behaviour and Organizational Effectiveness, Journal of the Indian Academy of Applied
Psychology, 34 (1), 47-55.
UN Conference on Trade & Development (1972) Proceedings of the United Nations Conference on Trade and Development, 3rd session, Santiago de Chile, 13 April to 21 May 1972. Volume IV, General review and special issues - UNCTAD, Vol. IV - 268 pages
Vu Cao Dam (2007) Discussing the concept of science and technology enterprise, Journal of
Science and Technology activities , 2 (2007)
Zhu Y. and Wang Y. (2007). The organization of information standards in the Chinese construction industry. Journal of Information Technology in Construction (ITcon), 12 (14), 207-219.
Appendix: Questionnaire
Dear Participant,I am MBA student, as a part of my studies, I am conducting an academic research project concerning applying new technology’s benefit on the job satisfaction of employees. Participants in this study are all randomly selected for the invitation to participate.
This is to invite you to voluntarily participate in this study by anonymously completing the attached questionnaires. The process is expected to take about 30 minutes, or less. I will be available in or near the room throughout the session to answer any questions from participants and then collect their completed forms in a confidential envelope. Please be as open and honest as possible. No one from the company will see your responses or the completed questionnaires. Of course, you have the option to terminate your voluntary participation at any time.
The satisfaction that comes from participating in an academic research project like this is the only benefit to you. There is no other compensation. Thank you for your kind consideration and participation in this project. I deeply appreciate your contribution.
Sincerely,
Part A: General Information
1. Gender (circle one): a. Male b. Female 2. Age: ________
3. How long have you been working for the company? ______ (years) 4. Position (check one):
a. Top manager b. Middle level manager c. White color worker d. Blue color worker 5. Your highest level of education (circle one):
a. Less than high school b Completed high school c. Completed college d. Bachelor degree of more
Part B: Please read each item carefully and circle the appropriate number that indicates HOW MUCH YOU AGREE OR DISAGREE with each of the sections below:
Statement
Strongly Disagree
Disagree Neutral Agree
Strongly Agree
1 2 3 4 5
1. People are encouraged to develop their skills
2. I have a lot of say over what happens in my
job
3. I can influence my supervisors on
work-related matters
4. I can quickly adapt with new technology that I
need for work;
5. The new technology I need for my work is
always available
6. The technology that I need for my work is
always up-to-date.
7. I can learn new things from new technology
8. We can see the productive efficiency from
9. My job is safer when applying the technology
innovation
10. My job forces me to learn new things
continuously
11. I never seem to have enough time to get my
job done
12. In my major work tasks I rely extensively on
technology
13. In my major work tasks, much of my time
involves with innovation technology
14. I spend a substantial amount of my time in
using the machine.
15. With new technology I fell my task is
meaning full
16. I can use wide range of my skills with new
technology
17. I am satisfied with my workload
18. I am satisfied with overall staffing levels
19. I am satisfied with the support available to me
20. I am satisfied with the contact I have with
colleagues
21. I am satisfied with the opportunities I have to
advance my career
22. I am satisfied with my salary/pay scale
23. I am satisfied with the amount of job security I