國立臺灣大學生命科學院漁業科學研究所 碩士論文
Institute of Fisheries Science College of Life Science National Taiwan University
Master Thesis
利用衛星遙測技術研究近 40 年來棲地破壞對日本鰻資源量的 影響
Study of the relationship between Anguilla japonica resource and habitat destruction by satellite remote sensing in the past 40 years
陳健澤 Jian-Ze Chen
指導教授:韓玉山 博士 Advisor: Yu-San Han, Ph.D.
中華民國 102 年 7 月
July 2013
致謝
此論文能夠順利完成,要感謝 韓玉山老師的悉心指導,不厭其煩一次又一 次的指正論文上的缺失,也謝謝老師這兩年來提供許多的出差機會,讓我可以更 了解鰻魚產業的現況,與產業有所接軌,這兩年真的受益良多;此外也要感謝 黃 祥麟老師在衛星遙測技術上的指導與意見,讓這本論文可以順利完成。
承蒙國立臺灣海洋大學終身特聘教授 廖一久博士、國立台灣海洋大學環境 生物與漁業科學學系 王佳惠博士、國立台灣海洋大學環境生物與漁業科學學系 黃祥麟博士,對於論文的細心審閱,並且給予寶貴的意見,使此論文更加的完善,
對此由衷的感謝。
在實驗室這兩年中,感謝怡誠學長、岱倪學姊、明惠學姊、小陶學姊、給予 實驗上寶貴的意見;感謝皖之學姊在我們肚子餓,給予我們點心讓我們可以放鬆 許多;感謝敬華學姊這一年來教導我帶領我很快的進入狀況,讓我事半功倍。另 外也要感謝我的同學阿梅、阿旗、阿元、邦又、敏睿、鳳媖不只是實驗上給予意 見,也在閒暇的時候一起聚餐、放鬆、談心讓心靈上有所慰藉。也感謝實驗室碩 一、碩二的學弟妹的鼓勵與實驗上的幫助。也要感謝父母的支持與關懷讓我可以 放心的在這個領域上學習。
在台大漁科所這兩年的日子裡我學習許多,也了解產業目前的所面臨的困境,
對此讓我有所使命感,希望在未來的日子裡可以貢獻所學,在鰻魚產業上能夠有 所貢獻。
陳健澤 謹誌 中華民國 102 年 8 月
i
中文摘要
日本鰻是日本、韓國、台灣及中國重要養殖魚種,目前養殖業者的鰻苗完全
仰賴漁民在河口捕撈。然而其資源量從 1970 年代以後急遽下降;且近年來因各
國都市及工業不斷擴張,而使鰻魚的自然棲地受到嚴重的破壞。本研究擬探討從
1970 至 2010 年代,東亞四國日本鰻棲地改變的情形,與鰻魚長期資源量相互比
較,觀察是否有所關聯性。
本研究實驗方法使用衛星遙測技術,將其應用在土地覆蓋之改變 (Land
Cover Change, LCC).衛星遙測技術是一項分析時間空間改變有效率的工具,它可
以大範圍紀錄古今的地理樣貌,以提高效率以及精準度以利實驗分析。而本研究
區域是從東亞四國中,各選定四條主要鰻苗捕撈河川,藉由 USGS 下載各河川衛
星照片後,再由 Arc GIS 分析其棲地改變之情形。結果顯示,日本在 1970 至 2010
年代當中,河川天然棲地長度減少 21%,天然面積減少 27%,棲地品質指數
(habitat quality index, HQI) 減少 6%;韓國,天然棲地長度減少 46%,天然
面積減少 57%,HQI 減少 29%;台灣,天然棲地長度減少 22%,天然面積減少 53%,
HQI 減少 50%;中國,天然棲地長度減少 76%,天然面積減少 81%, HQI 減少 25%。
在鰻苗長期資源量方面,日本官方平均年產量在 1970 年代為 80.6 噸,1990 年
代為 35.9 噸,而近 5 年來為 6.6 噸,資源量在 1970 年代至現今減少 92%;而根
據福隆當地漁民資料,1984~1995 年間,年平均總產量 334096 隻,而 2007~2013
年間,年平均總產量 14190 隻,資源量從 1970 年代至今減少達 96%。
ii
結論而言,東亞地區在 1970 到 2010 年代,天然棲地總長度減少 47%,天然
棲地總面積減少 81%,HQI 減少 25%。與鰻苗資源量官方統計減少 92%及福隆當地
漁民統計減少 96%相互比較,鰻苗資源量應受到棲地破壞而減少。
關鍵字:棲地破壞、日本鰻、衛星遙測技術、東亞四國、鰻魚資源量
iii
Abstract
The Japanese eel is an important aquaculture species in Japan, Korea, Taiwan and
China. At present the only source of glass eels needed by fish farmers comes solely
from the catches made by fishermen at river mouths. However eel stocks have been in
rapid decline since the 1970s. Furthermore with urbanization and constant expansion of
industrialization in various countries, the natural habitat of eels have been severely
damaged. The aim of this study is to discuss the relationship between habitat changes in
the four East Asian countries and the long-term eel stock size from the 1970s to the
early 2010s.
The method of this study is using satellite remote sensing on land cover change
(LCC). Satellite remote sensing is an efficient tool for analyzing temporal and spatial
changes as it could record geographical features on a large geographical scales over
times to enhance efficiency and accuracy to facilitate data analysis. Present study focus
on four major eel-catching rivers in each of the four East Asian countries. Then satellite
images of those rivers were downloaded from the USGS website and fed to ArcGIS to
analyze the condition of habitat change in each of them.
The result of this study shows that in the period of 1970s~2010s in Japan, the
length of natural habitats in the rivers decreased by 21%, loss of natural areas is 27%,
and the habitat quality index, (HQI) decreased by 6%. In Korea, the length of natural
habitats in the rivers decreased by 46%, the loss of natural areas is 57%, and the HQI
iv
decreased by 29%. In Taiwan, the length of natural habitats in the rivers decreased by
22%, the loss of natural areas is 53%, and the HQI decreased by 50%. In China, the
length of natural habitats in the rivers decreased by 76%, the loss of natural areas is
81%, and the HQI decreased by 25%.
In terms of long-term glass eel stock sizes, Japanese official data shows 80.6 tons
of annual production in the 1970s, 35.9 tons in the 1990s and in the recent 5 years it is
6.6 tons. The eel stock size decreases by 92% from the 1970s to the present day.
According to local fisherman in Fulung, eel stock data in the period of 1984~1995, the
mean annual catch of glass eels is 334096, however, in the period of 2007~2013, the
total number of glass eels is 14190 on average per year and the stock size decreases by
96% from the 1970s to the present day.
In summary, in East Asia from the 1970s to the 2010s, the total length of natural
habitats decreased by 47%, the loss of total natural habitats is 81%, and the HQI
decreased by 25%. Compared with the official eel stock decrease of 92% in Japan, and
local fisherman data of a decrease of 96% in Fulung, this shows eel stock size decline
should be related to habitat loss.
Key words: habitat destruction, Japanese eel, satellite remote sensing, East Asia four
countries, eel stock size
v
Contents
中文摘要 ... i
Abstract ... iii
Contents ... v
Figure legend ... viii
Table contents ... xi
Introduction ... 1
Materials and methods ... 6
Study area ... 6
Landscape image collection and processing ... 6
Remote sensing image classification ... 7
Eel resource data ... 8
Result ... 9
Remote sensing image ... 9
Japan ... 9
Ten-ryu River (天龍川) ... 9
Ohyodo River (大淀川) ... 10
vi
Ni-yodo River (仁淀川) ... 10
To-ne River (利根川) ... 11
Korea ... 12
Han River (漢江) ... 12
Geum River (錦江) ... 12
Yeongsan River (榮山江) ... 13
Nakdong River (洛東江) ... 14
Taiwan ... 14
Danshui River (淡水河) ... 14
Lanyang River (蘭陽溪) ... 15
Zhuoshuei River (濁水溪) ... 16
Kaoping River (高屏溪) ... 17
China ... 17
Minjiang River (閩江) ... 17
Pearl River (珠江) ... 18
Qiantang River (錢塘江) ... 19
Yangtze River (長江) ... 19
Eel resource data ... 20
Discussion... 22
vii
Eel catch data ... 22
Habitat quality index, HQI ... 23
The long term habitat change in East Asia ... 23
Habitat destruction ... 24
The other factors of eel resource decline ... 26
Conclusion ... 30
References ... 31
viii
Figure legend
Fig.1 The artificial buildings of habitat destruction dam (a), aquaculture zone (b),
harbor r(c), riverbank (d). ... 40
Fig.2 The four main rivers catching eel area in Japan; Ten-ryu River (天龍川), Ohyodo River (大淀川), Ni-yodo River (仁淀川), and To-ne River (利根川) ... 42
Fig.3 The four main rivers catching eel area in Korea; Han River (漢江), Geum River (錦江), Yeongsan River (榮山江) and Nakdong River (洛東江) ... 43
Fig.4 The four main rivers catching eel area in Taiwan; Danshui River (淡水河), Lanyang River (蘭陽溪), Zhuoshuei River (濁水溪) and Kaoping River (高屏溪) 44 Fig.5 The four main rivers catching eel area in China; Minjiang River (閩江), Pearl River (珠江), Qiantang River (錢塘江) and Yangtze River (長江) ... 45
Fig.6 The Ten-lyu River (天龍川) of Japan 1970s(A) 1990s(B) 2010s(C) ... 46
Fig.7 The Ohyodo River (大淀川) of Japan 1970s(A) 1990s(B) 2010s(C) ... 47
Fig.8 The Ni-yodo River (仁淀川) of Japan 1970s(A) 1990s(B) 2010s(C) ... 48
Fig.9 The To-ne River (利根川) of Japan 1970s(A) 1990s(B) 2010s(C) ... 49
Fig.10 The Han River (漢江) of Korea 1970s(A) 1990s(B) 2010s(C) ... 50
Fig.11 The Geum River (錦江) of Korea 1970s(A) 1990s(B) 2010s(C) ... 53
Fig.12 The Yeongsan River (榮山江) of Korea 1970s(A) 1990s(B) 2010s(C) ... 54
Fig.13 The Nakdong River (洛東江) of Korea 1970s(A) 1990s(B) 2010s(C) ... 55
ix
Fig.14 The Dansuie River (淡水河) of Taiwan 1970s(A) 1990s(B) 2010s(C)... 56
Fig.15 The Lanyang River (蘭陽溪) of Taiwan 1970s(A) 1990s(B) 2010s(C) ... 59
Fig.16 The Zhuoshuei River (濁水溪) of Taiwan 1970s(A) 1990s(B) 2010s(C) ... 62
Fig.17The Kaoping River (高屏溪) of Taiwan 1970s(A) 1990s(B) 2010s(C) ... 65
Fig.18 The Minjiang River (閩江) of China 1970s(A) 1990s(B) 2010s(C) ... 66
Fig.19 The Pearl River (珠江) of China 1970s(A) 1990s(B) 2010s(C)... 69
Fig.20 The Qiantang River (錢塘江) of China 1970s(A) 1990s(B) 2010s(C) ... 70
Fig.21 The Yangtze River (長江) of China 1970s(A) 1990s(B) 2010s(C) ... 71
Fig.22 The bar chart of four Japanese rivers nature length (A),area (B) and HQI (C) in 1970, 1990 and 2010; four Japanese rivers total HQI value in 1970, 1990 and 2010 (D) ... 72
Fig.23 The bar chart of four Korean rivers nature length (A),area (B) and HQI (C) in 1970, 1990 and 2010; four Japanese rivers total HQI value in 1970, 1990 and 2010 (D) ... 74
Fig.24 The bar chart of four Taiwan rivers nature length (A),area (B) and HQI (C) in 1970, 1990 and 2010; four Japanese rivers total HQI value in 1970, 1990 and 2010 (D) ... 76
Fig.25 The bar chart of four China rivers nature length (A),area (B) and HQI (C) in
1970, 1990 and 2010; four Japanese rivers total HQI value in 1970, 1990 and 2010 (D)
x
... 78
Fig.26 The bar chart of East Asia four countries HQI value in 1970, 1990 and 2010 . 80 Fig.27 The eel resource run chart of Japan ... 81
Fig.28 The eel resource run chart of Korea ... 82
Fig.29 The eel resource run chart of Taiwan ... 83
Fig.30 The eel resource run chart of China ... 84
Fig.31 the eel resource run chart of Fulung ... 85
xi
Table contents
Table 1 The historical Landsat data path/row of Taiwan. ... 86
Table 2 The historical Landsat data path/row of Japan. ... 87
Table 3 The historical Landsat data path/row of Korea. ... 89
Table 4 The historical Landsat data path/row of China. ... 90
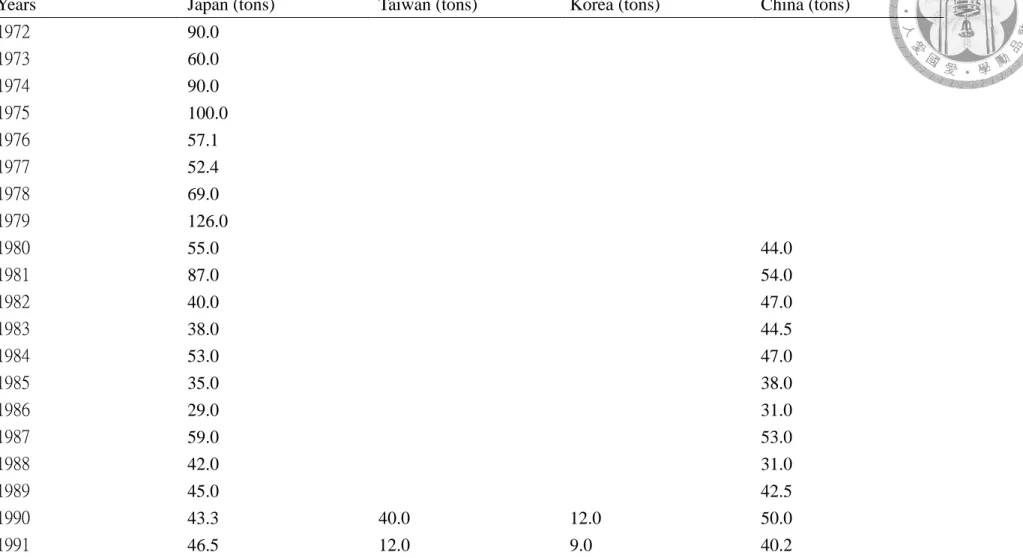
Table 5 the four countries eel resource official data during 1970s to 2010s ... 92
Table 6 the Fulung eel resource data during 1980s to 2010s ... 94
Table 7A The nature habitat and artificial building length and area of Ten-lyu River (天龍川) of Japan ... 96
Table 7B The percentage of HQI value of Ten-lyu River (天龍川) of Japan ... 96
Table 8A The nature habitat and artificial building length and area of Ohyodo River (大淀川) of Japan ... 97
Table 8B The percentage of HQI change value of Ohyodo River (大淀川) of Japan ... 97
Table 9A The nature habitat and artificial building length and area of Ni-yodo River (仁淀川) of Japan ... 98
Table 9B The percentage of the HQI change value of Ni-yodo River (仁淀川) of Japan ... 98
Table 10A The nature habitat and artificial building length and area of To-ne River (利
xii
根川) of Japan ... 99
Table 10B The percentage of the HQI change value of To-ne River (利根川) of Japan
... 99
Table 11A The nature habitat and artificial building length and area of Han River (漢
江) of Korea ... 100
Table 11B The percentage of the HQI change value of Han River (漢江) of Korea
... 100
Table 12A The nature habitat and artificial building length and area of Geum River
(錦江) of Korea ... 101
Table 12B The percentage of the HQI change value of Geum River (錦江) of Korea
... 101
Table 13A The nature habitat and artificial building length and area of Yeongsan River
(榮山江) of Korea ... 102
Table 13B The percentage of the HQI change value of Yeongsan River (榮山江) of
Korea ... 102
Table 14A The nature habitat and artificial building length and area of Nakdong River
(洛東江) of Korea ... 103
Table 14B The percentage of the HQI change value of Nakdong River (洛東江) of
Korea ... 103
xiii
Table 15A The nature habitat and artificial building length and area of Dansuie River
(淡水河) of Taiwan ... 104
Table 15B The percentage of the HQI change value of Dansuie River(淡水河) of
Taiwan ... 104
Table 16A The nature habitat and artificial building length and area of Lanyang River
(蘭陽溪) of Taiwan ... 105
Table 16B The percentage of the HQI change value of Lanyang River (蘭陽溪) of
Taiwan ... 105
Table 17A The nature habitat and artificial building length and area of Zhuoshuei
River (濁水溪) of Taiwan ... 106
Table 17B The percentage of the HQI change value of Zhuoshuei River (濁水溪) of
Taiwan ... 106
Table 18A The nature habitat and artificial building length and area of Kaoping River
(高屏溪) of Taiwan ... 107
Table 18B The percentage of the HQI change value of Kaoping River (高屏溪) of
Taiwan ... 107
Table 19A The nature habitat and artificial building length and area of Minjiang River
(閩江) of China ... 108
Table 19B The percentage of the HQI change value of Minjiang River (閩江) of
xiv
China ... 108
Table 20A The nature habitat and artificial building length and area of Pearl River (珠
江) of China ... 109
Table 20B The percentage of the HQI change value of Pearl River (珠江) of China
... 109
Table 21A The nature habitat and artificial building length and area of Qiantang River
(錢塘江) of China ... 110
Table 21B The percentage of the HQI change value of Qiantang River (錢塘江) of
China ... 110
Table 22A The nature habitat and artificial building length and area of Yangtze River
(長江) of China ... 111
Table 22B The percentage of the HQI change value of Yangtze River (長江)of China
... 111
Table 23 The eel resource in 1970s, 1990s and 2010s (A) and the percentage of the eel
resource change value (B) of Japan ... 112
Table 24 The eel resource in 1970s, 1990s and 2010s (A) and the percentage of the eel
resource change value (B) of Taiwan ... 113
Table 25 The eel resource in 1970s, 1990s and 2010s (A) and the percentage of the eel
resource change value (B) of Korea ... 114
xv
Table 26 The eel resource in 1970s, 1990s and 2010s (A) and the percentage of the eel
resource change value (B) of China ... 115
Table 27 The eel resource of year average in 1984~1995 and 2006~2013 (A) and the percentage of the eel resource change value (B) of Fulung ... 116
Table 28 The percentage of the HQI change value of Japan ... 117
Table 29 The percentage of the HQI change value of Korea ... 118
Table 30 The percentage of the HQI change value of Taiwan ... 119
Table 31 The percentage of the HQI change value of China ... 120
Table 32 The percentage of the HQI change value of East Asia ... 121
1
Introduction
The catadromous eel (genus Anguilla) is an important aquaculture species in the
East Asia. Due to the large-scale artificial production techniques of eel fry (glass eel)
are unavailable; the fry source for eel aquaculture must be captured by fisherman in
the estuaries. However, the natural stock of glass eel, especially the Japanese eel
Anguilla japonica, European eel A. Anguilla and American eel A. rostrata, has been
significantly decreasing for the last three decades owing to overfishing, habitat
destruction, global climate change and other unknown factors (Tatsukawa, 2003;
Dekker, 2003; Casselman, 2003). The decline of natural eel resources causes
considerable impact on eel aquaculture industry in East Asia.
Around the world, there are 19 species of anguillid distributed in the coastal
areas of North Atlantic Ocean, Indian Ocean and West Pacific Ocean (Aoyama, 2009).
All Anguilla larvae are spawned in the tropical or subtropical ocean. After eggs
hatching, the eel larvae with transparent and leaf-like body are called leptocephali,
and they are transported by oceanic currents for several months to their growth
habitats. When leptocephali grow to specific maximum size, they then metamorphose
into glass eels when they drift near continental shelf (Miller, 2009). After
metamorphosis, glass eel enter the estuaries, rivers or lakes and appear pigment on the
body. They grow for several years and then become silver eel ready for seawater
2
spawning migration. They migrate thousands of kilometers back to the birth place to
spawn and then die (Tsukamoto, 2006).
However, there are many artificial buildings near the estuarine due to
urbanization and industrialization during past few decades. Urban growth, particularly
the movement of residential and commercial land use to rural areas at the periphery of
metropolitan areas, has long been considered a sign of regional economic vitality. But,
its benefits are increasingly balanced against ecosystem impacts, including
degradation of air and water quality and loss of farmland and forests, and
socioeconomic effects of economic disparities, social fragmentation and infrastructure
costs (Squires, 2002; Fei, 2005).
For example, dams (Fig. 1a) may limit the upstream movement of eels such that
eel numbers often decrease above dams (Goodwin, 1999; Machut, 2007) and increase
immediately below dams (Wiley, 2004; Machutet, 2007). Consequently, barriers may
influence stream community composition and population dynamics in upstream and
downstream directions. Upstream of dams, decreased eel densities may influence
stream fish communities by removing a native piscivore which could otherwise
comprise over 25% of the total fish biomass in streams (Smith, 1955; Ogden, 1970).
Freshwater mussel distributions may also be limited through restrictions of the fish
host movements that are necessary for upstream dispersal of mussel glochidia
3
(Williams, 1993; Watters, 1996). Downstream of dams, increased eel densities may
increase intraspecific competition and decrease per capita growth rates (Machut,
2007). Reduced access to headwater streams may also influence eel stock–recruitment
dynamics by decreasing the production of female eels (Krueger, 1999).
The rapid expansion of coastal aquaculture (Fig. 1b) has serious environmental
and socioeconomic consequences, which include large-scale removal of valuable
coastal wetlands, land subsidence, acidification, salinization of groundwater and
agricultural land, and subsequent loss of goods and services generated by natural
resource systems (Chua, 1992).
Not only dam, aquaculture but also harbor (Fig. 1c), riverbank (Fig. 1d) which
replace the mangrove and wetland by land reclamation were creating the eel habitat
destruction. Land reclamation has been a common practice to produce valuable land
in coastal areas. The impact of land reclamation on coastal environment and marine
ecology is well recognized and widely studied. It has not been recognized yet that
reclamation may change the regional ground water regime, which may in turn modify
the coastal environment, flooding pattern, and stability of slopes and foundations (
Jiao,
2001)
.Land cover change (LCC) is caused by human disturbances and/or natural events
(Wen, 2011). Human activities now affect most of the terrestrial biosphere and are
4
increasing in intensity and extent (Jeremy, 2003). Ensuing habitat loss and
degradation impair ecosystem function (Defries, 1999) and reduce the value of
ecosystem services for humans (Daily, 1997), and natural events such as global
warming, flooding, rivers dry up etc. LCC at different scales from local to global,
especially quantitative analysis of LCC has been a main concern to scientists and
researchers in the past century, particularly the past few decades around the world
(Wen, 2011). However, traditional field ecological data do not translate readily to
regional or global extents, and models derived purely from such local data are
unlikely to predict the global consequences of human activities (Jeremy, 2003).
Monitoring land cover changes using multi-temporal remotely sensed data
provides an accurate evaluation of human impact on the environment (Abdullah,
2012). Importantly, remotely sensed imagery provides an efficient means of obtaining
information on temporal trends and spatial distribution of urban areas (Fei, 2005) near
the estuary and river. The long-term data record obtained from Landsat satellites are a
valuable resource for monitoring land use cover change (USGS, 2011). Accurate and
up-to-date land use information is essential for environmental planning, understanding
the impacts to terrestrial ecosystems (Wulder, 2007) and achieving sustainable
development (Alphan, 2003).
For example, the study of Abdullah, (2012) is to investigate the extent of ship
5
breaking activities in Bangladesh along the Sitakunda coast, various spatial and non-
spatial data were obtained by remote sensing imagery. The other study “River
pollution remediation monitored by optical and infrared high-resolution satellite
images (Paolo, 2013) “were to use high resolution satellite images combined with a
classical remote sensing methodology to monitor vegetation conditions along the
Bormida River.
The hypothesis of this study focus on whether the artificial buildings like dam,
harbor, aquaculture and riverbank cause the Japanese eel resource decline; thus this
study use the technology of satellite remote sensing to find the relationship between
Anguilla japonica resource and habitat destruction during the past 40 years.
6
Materials and methods
Study area
The main Anguilla japonica glass eel catching area is around East Asia
countries, including Japan, Korea, Taiwan and China. Choosing Ten-ryu River (天龍
川), Ohyodo River (大淀川), Ni-yodo River (仁淀川), and To-ne River (利根川) as
Japan study area (Fig. 2) is according to the "日本養殖新聞", due to the four rivers is
the main eel catching area in Japan. Choose Han River (漢江), Geum River (錦江),
Yeongsan River (榮山江) and Nakdong River (洛東江) as the Korea (Fig. 3) study
area due to Han River, Jin River Luo-Dung River are the top three rivers. Choosing
Rung-Shan River as the Korea study area by news from the Korean who working in
eels.
Take Danshui River (淡水河), Lanyang River (蘭陽溪), Zhuoshuei River (濁水
溪) and Kaoping River (高屏溪) as study areas because of they are the main Anguilla
japonica catching area of Taiwan (Fig.4).Take Minjiang River (閩江), Pearl River (珠
江), Qiantang River (錢塘江) and Yangtze River (長江) as study areas due to they are
the main Japanese eel catching area of China (Fig. 5).
Landscape image collection and processing
The main rivers of East Asia countries Taiwan, China, Korea and Japan are the
7
major Japanese eel catching area. Historical Landsat data covering the rivers and
estuaries of four countries were collected from USGS website (http://glovis.usgs.gov/)
and the path/row were recorded on Table 1~4. Each Landsat image contained three
color bands (R-red, G-green, B-blue) composited with ArcMap (ESRI, 2008) either
RGB231 for MSS data (Landsat 1, 3) or RGB742 for TM/ETM+ data (Landsat 5, 7)
to highlight the contrast between vegetative and urban landscape (Kerr, 2003; Merem,
2008; Castilla, 2009). All satellite images were first geo-referenced to clearly
identifiable landmarks with ArcMap 9.3 (ESRI, 2008; Huang, 2013). When the
images were processed, we calculate the habitat length, area and HQI by a tool called
“Measure”.
Remote sensing image classification
After processing the satellite images, this study classifies all river valleys under
study into two parts, artificial buildings and natural habitats, and then calculates their
percentage in length and area. Artificial buildings include 1. riverbanks 2. dams and
the upper dam areas 3. aquaculture zones 4. harbors. The remaining area is regarded
as a natural habitat. The boundary line of the river under study is restricted to the
plane because it is the main habitat of Japanese eels. After measuring the length and
area of the river, the area data was used to weight a value called HQI (habitat quality
8
index). According to the study Kimura, (2012) when the artificial revetment rate in
Japanese lakes is 100%, then the decreasing rate of fish catch is 25%; so this study
refers to the data and makes the natural habitat data multiplied by 1 and the artificial
building data multiplied by 0.75 based on the effect of riverbanks on eel stock
abundance (Kimura, 2012). Furthermore, the dam, will stop the eel migrating to the
upper stream, thus the upper dam valley by 0.
Eel resource data
The four countries official eel catch data was collected from 日本養殖新聞
during 1970s to 2010s and the original data was recorded on Table 5. We also
collected the eel catch data form Fulung fisherman during 1980s to 2010s and the
original data was recorded on Table 6.
9
Result
Remote sensing image
Japan:
1.Ten-ryu River (天龍川)
The length of the natural habitat of Ten-ryu River in the 1970s, the 1990s and the
early 2010s is 27km, 27km and 27km respectively with the corresponding area of 8
km2, 9 km2 and 6 km2; the HQI value in the 1970s, 1990s and 2010s is 8 km2, 9 km2
and 6 km2 (Table 7A); the percentage of HQI in the 1970s~1990s, the 1990s~2010s
and 1970s~2010s is 13%,-33% and -25% (Table 7B).
Although there were many artificial buildings near the river in the past 40 years,
in the 1970s, the 1990s and the early 2010s, there were many sandbanks in the middle
of the river (Fig. 6 yellow frame). Therefore the eel habitat area did not decrease
significantly and the data of this river shows no significance in the past 40 years.
However, the habitat area still changed as the sandbank area is changed by climate
factors like water quantity (Table 7).
Because the Scan Line Corrector (SLC) on Landsat-7 used to compensate the
forward motion of the whisk-broom sensor malfunctioned on May 31, 2003, there is a
problem with the images. As a result, the images acquired from Landsat-7 show data
gaps that occupy about 22% of the entire scene (楊, 2009). Fortunately, this study is
not affected by this problem and we can still calculate the habitat change values
10
accurately.
2. Ohyodo River (大淀川)
The nature habitat length of Ohyodo River in 1970s, 1990s and 2010s is 35km,
30km and 30km, and the area is 7 km2, 4 km2 and 4 km2; the HQI value in 1970s,
1990s and 2010s is 8 km2, 7 km2 and 7 km2 (Table 8A); the percentage of HQI in
1970s~1990s, 1990s~2010s and 1970s~ 2010s is -10%, 0% and -10% (Table 8B).
There was no harbor near the estuary in the 1970s in this river,, but in the 1990s
and the early 2010s, there was a harbor near the estuary (Fig. 7 yellow frame) – the
main factor on habitat change in this river. However in the 1970s, not many artificial
buildings were in the river. Yet in the 1990s and the early 2010s, more artificial
buildings began to appear. Even so, there were no significant habitat changes between
the 1990s and the early 2010s (Table 8).
3. Ni-yodo River (仁淀川)
The nature habitat length of Ni-yodo River in 1970s, 1990s and 2010s is 15km,
17km and 17km,and the area is 3 km2, 3 km2 and 3 km2; the HQI value in 1970s,
1990s and 2010s is 3 km2, 4 km2 and 4 km2 (Table 9A); the percentage of HQI in
1970s~1990s,1990s~2010s and 1970~ 2010 is 25%, 0% and 25% (Table 9B).
11
There is no obvious habitat change in the past 40 years in this river, but it is
worth mentioning that in the 1970s, there was no tributary flowing to the river, but in
the 1990s and the early 2010s, there was a tributary flowing to this river (Fig. 8). At
first, we thought there was no tributary because of the drought season in the 1970s, so
we checked the other same path/row remote sensing images of this area to make sure.
We found there was really no tributary near the river. Therefore the total length and
area in the 1990s and the early 2010s are higher and bigger than those of the 1970s
because of the tributary. Indeed more and more artificial buildings begin to appear
year by year (Table 9).
4. To-ne River (利根川)
The nature habitat length of To-ne River in 1970s, 1990s and 2010s is 240km,
225km and 175km, and the area is 227 km2, 179 km2 and 166 km2; the HQI value in
1970s, 1990s and 2010s is 248 km2, 237 km2 and 233 km2 (Table 10A); the
percentage of HQI in 1970s~1990s, 1990s~2010s and 1970s~2010s is -5%, -2% and -
6% (Table 10B).
More and more artificial buildings emerged year by year in this river in the past
40 years that caused the natural habitats to decrease year by year (Fig. 9). The data
also shows this trend (Table 10).
12
Korea:
1. Han River (漢江)
The nature habitat length of Han River in 1970s, 1990s and 2010s is 150km,
123km and 89km, and the area is 188 km2, 165 km2 and 105 km2; the HQI value in
1970s, 1990s and 2010s is 190km2, 182km2 and 166km2 (Table 11A); the percentage
of HQI in 1970s~1990s, 1990s~2010s and 1970s~2010s is -4%, -9% and -13% (Table
11B).
This study compares the two different parts of the river, the estuary and extended
city area. In the 1970s and the 1990s there were no artificial buildings like harbors
and aquaculture areas on the island near the river and the river estuary, but in the early
2010s there were many harbors and aquaculture areas on this island (Fig. 10 A-1, B-1
and C-1). The other part is the city extended significantly from the 1970s to the 2010s
as this area is Korea's capital, Seoul (Fig. 10 A-2, B-2 and C-2). This trend is recorded
in Table 11.
2. Geum River (錦江)
The nature habitat length of Geum River in 1970s, 1990s and 2010s is 55km,
46km and 23km, and the area is 54 km2, 37 km2 and 21 km2; the HQI value in 1970s,
1990s and 2010s is 71km2, 59km2 and 56km2 (Table 12A); the percentage of HQI in
13
1970s~1990s,1990s~2010s and 1970s~2010s is -18%, -6% and -22% (Table 12B).
There was no harbor near the estuary in the 1970s in this river (Fig. 11 A-1 black
frame), but there was a harbor near the estuary in the 1990s and the 2010s (Fig. 11 B-
1 and C-1 black frame). Besides, the harbor was built by land accretion due to the fact
that the harbor built connected the estuary land and the outside island. So we
calculated the total length of the river in the early 2010s and found that it is higher
than in the 1970s and the 1990s because of harbor extension by land accretion (Table
12).
3. Yeongsan River (榮山江)
The nature habitat length of Yeongsan River in 1970s, 1990s and 2010s is 159km,
63km and 58km, and the area is 120 km2, 28 km2 and 14 km2; the HQI value in 1970s,
1990s and 2010s is 120km2,51km2and 41km2 (Table 13A); the percentage of HQI in
1970s~1990s, 1990s~2010 and 1970s~2010s is -58%, -19% and -66% (Table 13B).
There were plenty of natural and territorial waters in the 1970s in this river ,
however in the 1990s and the early 2010s, parts of the territorial waters were replaced
by aquaculture areas, harbors and riverbanks (Fig.12 black frame), so the total area
declined significantly in the past 40 years. Especially for the period from the 1970s to
the 1990s, the HQI decreased by 66% (Table 13).
14
4. Nakdong River (洛東江)
The nature habitat length of Nakdong River in 1970s, 1990s and 2010s is 116km,
104km and 88km, and the area is 52 km2, 45 km2 and 38 km2; the HQI value in 1970s,
1990s and 2010s is 53 km2, 50 km2 and 48 km2 (Table 14A); the percentage of HQI in
1970s~1990s, 1990s~2010s and 1970s~ 2010s is -5%, -5% and -9% (Table 14B).
More and more artificial buildings emerged year by year in this river in the past
40 years that caused the natural habitats to decrease year by year as well (Fig. 13).
The data also shows this trend (Table 14).
Taiwan:
1. Danshui River (淡水河)
The nature habitat length of Danshui River in 1970s, 1990s and 2010s is 103km,
64km and 60km, and the area is 55 km2, 14 km2 and 12 km2; the HQI value in 1970s,
1990s and 2010s is 69km2, 22km2 and 22km2 (Table 15A); the percentage of HQI in
1970s~1990, 1990s~2010s and 1970s~ 2010s is -69%, 1% and -69% (Table 15B).
There is a lake flowing to Danshui River in the 1970s (Fig. 14 A-2 black frame).
But in the 1990s and the early 2010s (Fig. 14 B-2 and C-2 black frame), the lake
shrunk due to land accretion leading to loss of natural habitats. Furthermore, this was a “winding” tributary flowing to the river (Fig. 14 A-2 black cycle), but in the 1990s
and the early 2010s, the tributary became “straight” (Fig. 14 B-2 and C-2 black cycle)
15
and this factor caused habitat loss and destruction between the period of the 1970s,
the 1990s, and the 2010s.
We also discover a habitat change factor. In the 1970s there was no weir on this
river (Fig. 14 A-1), but in the 1990s there were two weirs on the river (Fig. 14 B-1). In
2004, typhoon Aere destroyed one of the weirs, making the remote sensing images of
the 2010s to show just one weir (Fig. 14 C-1) (台灣自來水公司). For this reason, the
natural length and area value increased from the 1990s to the early 2010s. In the past
40 years, urbanization caused a 69% (Table 15) habitat loss because the river is near
the capital of Taiwan (Fig. 14 A-2, B-2 and C-2).
2. Lanyang River (蘭陽溪)
The nature habitat length of Lanyang River in 1970s, 1990s and 2010s is 55km,
45km and 42km, and the area is 29 km2, 30 km2 and 15 km2; the HQI value in 1970s,
1990s and 2010s is 29km2, 31km2 and 16km2 (Table 16A); the percentage of HQI in
1970s~1990s,1990s~2010s and 1970s~2010s is 6%, -49% and -46% (Table 16B).
There were not many artificial buildings near or on the river in the 1970s, and the
watercourse was extensive (Fig. 15 A-1). But in the 1990s and the early 2010s, there
were more artificial buildings near or on the river, making the watercourse thinner
(Fig.15 B-1 and C-1).
According to the data in Table 16 and Figure 24, the habitats change significantly.
16
Because in the period from the 1990s to the early 2010s, there were more land
accretion on the river. For example, in the river estuary there was land accretion that
caused habitat loss (Fig. 15 B-1 black cycle and Fig. 15 C-1 black cycle). In the other
example, in one of the tributaries in the 1990s, there was more water quantity in this
area. But in the early 2010s, the tributary disappeared (Fig. 15 B-1 black frame and
Fig. 15 C-1 black frame).
3. Zhuoshuei River (濁水溪)
The nature habitat length of Zhuoshuei River in 1970s, 1990s and 2010s is 84km,
85km and 72km, and the area is 108 km2, 69 km2 and 52 km2; the HQI value in 1970s,
1990s and 2010s is 108km2, 69km2 and 52km2 (Table 17A); the percentage of HQI in
1970s~1990s,1990s~2010s and 1970s~2010s is -36%, -25% and -52% (Table 17B).
There were less natural and artificial structures near the estuarine area in the
1970s in this river (Fig. 16 A-1). But in the 1990s, there were many aquaculture zones
near the estuarine area that caused habitat loss (Fig. 16 B-1). Disastrously, there was
an industrial estate, The No. 6 Naphtha Cracker Complex (Mailiao) of Formosa
Petrochemical Corp (Fig. 16 C-1), near the coast and it not only caused habitat loss,
but also released industrial sewage to the water, leading to serious damage of the
estuarine area.
In addition, in the 1970s and the 1990s (Fig. 16 A-2 B-2), there was no dam on
17
the river. But in the early 2010s there was a weir, Chi-Chi (Yao, 2009) on the
upstream of Zhuoshuei River that made the river lose about 13km of habitat length
(Fig. 16 C-2 black frame) (Table 17).
4. Kaoping River (高屏溪)
The nature habitat length of Kaoping River in 1970s, 1990s and 2010s is 92km,
93km and 85km, and the area is 81 km2, 45 km2 and 50 km2; the HQI value in 1970s,
1990s and 2010s is 81km2, 46km2 and 54km2 (Table 18A); the percentage of HQI in
1970s~1990s,1990s~2010s and 1970s~ 2010s is -44%, 17% and -34% (Table 18B).
More and more artificial buildings emerged year by year in this river in the past
40 years. But from the 1990s to the early 2010s, the total habitat length decreased by
3km while the habitat area change is an increase of 9km (Fig. 17). The explanation for
this is that during the 20 years, there were many artificial buildings near the river that
caused the percentage of habitat length to decrease. However the sandbanks in the
river changed tremendously in this period and caused the percentage of habitat area to
increase (Table 18).
China:
1. Minjiang River (閩江)
The natural habitat length of Minjiang River in the 1970s, the 1990s and the
18
early 2010s is 92km, 79km and 31km, and the area is 86 km2, 83 km2 and 47 km2; the
HQI value in 1970s, 1990s and 2010s is 87km2, 91km2 and 94km2 (Table 19A); the
percentage of HQI in 1970s~1990s, 1990s~2010s and 1970s~2010s is 5%, 3% and
9% (Table 19B).
Urbanization and habitat loss increased year by year in the past 40 years in this
river (Table 19). But the data shows the total length of the river became shorter and
the total area became larger because there was a tributary in the 1970s and the 1990s
(Fig. 18 A-1 and B-1 black frame). It is a natural, winding tributary with many
sandbanks. But in the early 2010s, the tributary became straight with fewer sandbanks,
and there were many artificial structures near the riverside (Fig. 18 C-1 black frame).
For this reason, the total area increased from the 1990s to the early 2010s but the total
length decreased.
2. Pearl River (珠江)
The nature habitat length of Pearl River in 1970s, 1990s and 2010s is 242km,
218km and 108km, and the area is 1208 km2, 557 km2 and 86 km2; the HQI value in
1970s, 1990s and 2010s is 1209km2, 986km2 and 772km2 (Table 20A); the percentage
of HQI in1970s~1990s, 1990s~2010s and 1970s~2010s is -18%,-22% and -32%
(Table 20B).
In this river, there are two data changes worth discussing. One is the total length
19
became longer and the other one is the total area became smaller over the past 40
years. In the 1970s, the area faced less artificial destruction to the environment (Fig.
19A black frame), but in the 1990s (Fig. 19B black frame), land accretion area
increased. In the early 2010s, the situation had become more serious (Fig. 19C black
frame). So the total length became longer due to increased accretion area and the total
area became smaller because of the same factor (Table 20).
3. Qiantang River (錢塘江)
The nature habitat length of Qiantang River in 1970s, 1990s and 2010s is 224km,
170km and 8km, and the area is 7124 km2, 5129 km2 and 1727 km2; the HQI value in
1970s, 1990s and 2010s is 7124km2, 6336km2 and 5363km2 (Table 21A); the
percentage of HQI in 1970s~1990s, 1990s~2010s and 1970s~ 2010s is -11%, -15%
and -25% (Table 21B).
In this river, the habitats saw a loss year by year in the past 40 years. In the
1970s there were fewer damages to the environment (Fig. 20A); but until the 1990s
there were many artificial structures near the riverside (Fig. 20B) and until the early
2010s the situation has become more severe than the 1990s (Fig. 21 C) (Table 21).
4. Yangtze River (長江)
The nature habitat length of Yangtze River in 1970s, 1990s and 2010s is 523km,
20
286km and 113km, and the area is 3199 km2, 1637 km2 and 291 km2; the HQI value
in 1970s, 1990s and 2010s is 3798km2, 3399km2 and 2928km2 (Table 22A); the
percentage of HQI in 1970s~1990s, 1990s~2010s and 1970s~2010s is -11%, -14%
and -23% (Table 22B).
The habitat loss was also year by year in the past 40 years in this river. What is
worth mentioning is the total area (Table 22) from the 1990s to the early 2010s
decreased significantly due to the fact that in the 1970s and the 1990s there was not
much land accretion in the lake, Kao-Yu (Fig. 21 A and B yellow frame). But in the
early 2010s there were many artificial structures in the lake, making the area smaller
(Fig. 21 C yellow frame). Therefore the data shows the total area decreased
tremendously during the period of the 1990s to the early 2010s.
This study shows a bar chart of the four rivers of Japan, Korea, Taiwan and
China in the 1970s, the 1990s and the early 2010s in Figures 22~25. This study also
shows a bar chart of the four East Asian countries in the 1970s, the 1990s and the
early 2010s in Figure 26.
Eel resource data
According to the “日本養殖新聞” glass eel catch data of East Asian four
countries, Japan, the mean annual glass eel catch in 1970s,1990s and 2010s is 80.6
tons, 35.9 tons and 6.6 tons, respectively (Table 23A), and the percentage of the eel
21
catch value change in 1970s~1990s, 1990s~2010s and 1970s~2010s is -56%, -81%
and -92% (Table 23B).
Taiwan, the eel resource in 1990s and 2010s is 14.9 tons and 3.1 tons (Table
24A), and the percentage of the eel catch amount change in 1990s~2010s is -79%
(Table 24B).
Korea, the eel resource in 1990s and 2010s 8.7 tons and 3.4 tons (Table 25A),
and the percentage of the eel resource value change in 1990s~2010s is -60% (Table
25B).
China, the eel resource in 1980s, 1990s and 2010s is 43.2 tons, 36.7 tons and
38.6 tons (Table 26A), and the percentage of the eel resource value change in
1980s~1990s, 1990s~2010s and 1980s~2010s is -15%, 5% and -11% (Table 26B).
This study also made bar charts of each sites (Fig. 27~30).
As to local fisherman data in Fulung, this study lists data from 1984 to 1995, and
2007 to 2013 without data available from 1996 to 2006. The mean annual catch of
glass eels in the period from 1984 to 1995 is 334096 eels per year, and in the period
from 2007 to 2013 is 14190 per year (Table 27A). The percentage of eel catch change
value over this period, (1984~1995)~(2007~2013) is -96% (Table 27B). This study
makes a run chart in Figure 31.
22
Discussion
Eel catch data
This study uses eel stock data of the four countries of Japan, Korea, Taiwan and China from “日本養殖新聞”. All the eel stock data shows a decreasing trend (Fig.
27~30). However, it is worth mentioning that in 1978 China had a policy called “The
reform and opening-up policy” and the policy covered aquaculture (中投顧問 2010).
It meant the Chinese government wanted to develop the industry of aquaculture.
Therefore prior to 1978, there were not many cultured eels. But after the policy was
implemented, eel stock increased because many fishermen started to culture eels,
causing the requirement of glass eels to increase. Therefore the data of eel catch in
China shows no significant change.
This study refers to eel catch data in Japan as East Asian eel stock, because the
Japanese have been culturing eel for a long time, and their government demanded
strict records of the data, leading to complete data recording of the eel stocks in the
past 40 years, more importantly, according to Han, (2010), the population structures
of anguillid eels have long been considered panmictic. This is because sexually
mature stocks migrate and spawn in a single site, and their larvae are passively
transported back to their growth habitats by oceanic currents with a long larval
23
duration, making population genetic structuring quite impossible (Schmidt, 1925;
Tsukamoto, 1992; Avise, 1994; Tesch, 2003; Aoyama, 2009). Therefore, the Japanese
eel should be considered as a single management unit for conservation (Han, 2010).
Thus for this reason, Japanese catch data can reflect the whole East Asian eel stock
change. Generally speaking, eel stocks decreased heavily during the period according
to the official eel stock data.
Habitat quality index, HQI
There are many factors affecting the habitat, for example, riverbanks will cause
eel habitat destruction, dams will cut off the river and cause habitat loss, land
accretion will cause habitat loss too, thus, those factors appertain to water quantity.
Furthermore, the DO, PH, salinity, or other pollutions, and so on, appertain to the
water quality. In this study, we discuss the water “quantity” because the analytical
methods used in analyzing Landsat images in this study just show LCC and cannot
reflect the water quality.
The long term habitat change in East Asia
As a whole, in the past 40 years, Japanese natural habitats decreased not as
serious as those of the other East Asian countries. The percentage of HQI is -6%
24
(Table 28) (Fig. 22). As the Japanese government enacted a conscientious and careful
law about river management, and there are many professionals on environmental
conservation, furthermore, their people have a good concept of environmental
protection (曾). But the rate of habitat change in the other countries is higher because
their governments did not enact effective laws and instilled in their people the newest
concepts of environmental protection; For Korea, the percentage of HQI is -29%
(Table 29) (Fig. 23); For Taiwan, the percentage of HQI is -50% (Table 30) (Fig. 24);
For China, the percentage of HQI is -25% (Table 31) (Fig. 25) and the total HQI of
East Asia is -25% (Table 32) (Fig. 26)
Even though there were different decrease rates in the rivers of each country, as a
catadromous species Japanese eels would be transported to East Asian regions by
ocean currents after hatching (Miller, 2009). As such, the four countries of East Asia
is the mean habitat of the Japanese eel, because Japanese eel is a single panmictic
population of in East Asia thus (Han, 2010), if somewhere habitat loss or destruction
in East Asia, it will decrease the eel resource of whole East Asia.
Habitat destruction
The International Union for Conversation of Nature and Natural Resources
(IUCN) takes "habitat destruction" as the biggest reason for reducing biodiversity in
25
the last decade in the Red List of endangered species. The Red List shows 86% of
birds and mammals, 90% of freshwater fish as well as more than 30% of marine life
are directly affected by habitat destruction (NTNU). Therefore habitat destruction is
an important factor of organism resources.
In many tourist attractions like Jamaica, Dubai, Palau, etc (Chen, 2013), people
prefer to live the hotel witch near the coastline for ocean view and marine aqua
activities; and since time immemorial, the local resident live near the river for the
water or the other daily life. Human activities may cause dramatic changes to
landscapes, coastal line, and river habitat change (Wen, 2011).
Wetlands are the most productive natural environment, which gave birth to
countless species of aquatic, and is a very important link between terrestrial and
aquatic ecosystems, thus when people develop the wetlands by land accretion and
then it will cause the biodiversity decrease heavily (池), furthermore, people build
many riverbanks or revetments for flood defense, but it cause almost disappearance of
the supply of the detritus as food for the fish larvae and juveniles. These environment
changes are irreversible and permanently transform the native habitats and ecosystems
(Huang, 2013).
The other kind of habitat destruction, dam or weir, for example, the Atlantic
sturgeon depends on channel habitats for all life stages and on healthy freshwater
26
habitats for reproduction; such biological needs are in direct conflict with human
activities, such as dredging and dam construction, which alter habitats or reduce water
quality (Secor, 2000). And the other example, the anadromous members of shad,
herring, and menhaden are threatened by the addition of dams, which can prevent
them from reaching their spawning grounds. If positioned in key locations, water
withdrawal facilities—such as reservoir intakes—may pose a threat to freshwater
spawners in terms of egg and larval losses (Amanda, 2009).
The Japanese eel is a catadromous species, it will migrate into rivers for growth,
but when there are artificial buildings such as dams on the river, they will block the
river channel and the eel can-not migrate successfully (曾等, 2012). Furthermore,
many artificial buildings like harbors, aquaculture areas and riverbanks built by land
accretion or replacement of original natural habitats may cause eels to have less food
sources. For this we know habitat loss could cause eel stocks to decrease.
The other factors of eel resource decline
Except the habitat loss, there are other three main factors affecting the eel
resource, pollution, climate change and overfishing. Water quality changes associated
with increased levels of nutrients, sediments, and contaminants. For example, nutrient
loading leads to algal blooms, which can decrease the concentration of dissolved
27
oxygen (DO) in the water. Low DO can reduce the amount of suitable habitat for fish
and can impair fish growth and reproduction; and the factor, low DO, may effect eel
too (Amanda, 2009). Otherwise, the effects of persistent pollutants combined with the
eel's unusual life cycle may cause the decline in the eel population in northern Europe
in recent decades (Larsson, 1991); the other example, when the eel expose in the
contaminated environment, the strongly polluted eels detoxify less efficiently, have a
lower condition and might be less successful spawner (Feunteun, 2002).
About the climate change, global warming has affected the stability of the hence
produced shifts in plankton communities and food web structures. Two potential
sources of nutrition have been proposed for eel larvae; dissolved organic matter
(DOM) and particulate organic matter (POM) in the form of zooplankton fecal pellets
and larvacean houses (Otake, 1993; Mochioka, 1996; Pfeiler, 1999). Marine snow has
also been proposed as a potential source of nutrition (Knights, 2003); those primary
production has been considered to be a good proxy for leptocephali food (Bardonnet,
2005). Thus, recruitment declines in Japanese eel may also have been due to
starvation–advection problems (Karl, 2001; Knights, 2003).
There is also a factor about the climate change, the ENSO, Kimura (2001)
showed a certain synchrony between Anguilla japonica recruitment and salinity fronts
driven by ENSO in the Japanese eel spawning area; Kim (2007) also demonstrated
28
that the changing oceanic conditions associated with climate change have resulted in
decreased recruitment of Japanese eel.
The factor of eel resource decline worth to be discussed is overfishing. Tzeng
(1986) indicated that Japanese eel elvers have been overfishing for aquaculture in
Asian countries, thus the eel population is obviously decreased. Furthermore, Knight,
(2003) has also inferred that Japanese eel populations (and escapement of pre-
spawning silver eels) have been affected by overfishing.
The annual catch of glass eel in the 1970s in Japan about 80.6 tons and 334096
individual in Fulung in the period 1984~1995 on average; after that time, the catch
cleared showed a decrease although it was fluctuating. Annual catches in some local
fishing areas showed nearly synchronous fluctuations. This fluctuation may be caused
in part by oceanic current conditions (Kimura, 2001). On the other hand, the average
catch in Japan in the past 5 years were 6.6 tons and in Fulung in the period
2006~2013 is 14190 eels; this value was only 8% of the average catch in Japan in
1970s and was only 4% in Fulung in the period 2006~2013. It may be very difficult to
explain this rate of decline for about 30 years by only dynamic oceanic environmental
conditions (Tatsukawa, 2003). Because of some river fishermen have expressed
concern that the decline in catch might be caused by overfishing of glass eels year by
year. Furthermore, previous literature assumed that water pollution might have
29
affected the survival of glass eels too.
Although many factors affect eel stocks, unfortunately, it is difficult to separate
these potential factors. Thus we could not identify the main factor or the percentage of
each factors contributing to eel resource decline (Tzeng, 2004).
30
Conclusion
This study has demonstrated that the HQI of East Asia declines 25%. However,
the eel resource changes in Japan and Fulung of Taiwan are -92% and -96%,
respectively. Thus, although the habitat destruction should contribute to eel resource
decline to some extent, other factors such as water pollution, overfishing, and climate
change may also be important factors for the decreasing of the eel resource.
31
References
Abdullah, H. M., Mahboob, M. G., Banu, M. R., Seker, D. Z. (2012). Monitoring
the drastic growth of ship breaking yards in Sitakunda: a threat to the coastal
environment of Bangladesh.
Environmental Monitoring and Assessment. 185,
3839-3851.
Alphan, H. (2003). Land use change and urbanization in Adana, Turkey. Land
Degradation and Development. 14, 575-586.
Amanda, H., Julia, E., Fabrizio, M. C., (2009). Fisheries of the York River System.
Virginia Institute of Marine Science Gloucester Point. VA 23061 U.S.A.
Aoyama, J. (2009). Life history and evolution of migration in catadromous eels
(genus Anguilla). Aqua-bioscience monographs. 2, 1-42.
Avise, J. C., Helfman, G. S., Saunders, N. C., Hales, L. S. (1986). Mitochondrial
DNA differentiation in North Atlantic eels: population genetic consequences of
an unusual life history pattern. Proceedings of the National Academy of Sciences.
83, 4350-4353.
Bardonnet, A., Riera, P. (2005). Feeding of glass eels (Anguilla Anguilla) in the
course of their estuarine migration new insights from stable isotope analysis.
Estuar Coast Shelf Science. 63, 201-209.
Casselman, J. M. (2003). Dynamics of resources of the American eel, Anguilla
rostrata: Declinig abundance in the 1990s. Eel biology, Springer, Tokyo. 255-
32
274.
Castilla, G., Larkin, K., Linke, J., Hay, G. J. (2009). The impact of thematic
resolution on the patch-mosaic model of natural landscapes. Landscape Ecology
24, 15-23.
Chua, T. E. (1992). Coastal Aquaculture Development and the Environment The
Role of Coastal Area Management Marine. Pollution Bulhtin. 25, 1-4. pp. 98 103 Daily, G. C. (1997). Nature’s Services, Island Press.
Defries, R. S. (1999). Combining satellite data and biogeochemical models to
estimate global effects of human-induced land cover change on carbon emissions
and primary productivity. Global Biogeochem. 13, 803-815.
Dekker, W. (2003). Status of the European eel stock and fisheries. Eel biology,
Springer, Tokyo. 237-254.
ESRI, (2008). ArcMap 9.3. Environmental Systems Research Institute, Redlands,
California, USA.
Fei, Y. (2005). Land cover classification and change analysis of the Twin Cities
(Minnesota) Metropolitan Area by multitemporal Landsat remote sensing.
Remote Sensing of Environment. 98, 317-328.
Feunteun, E. (2002). Management and restoration of European eel population
(Anguilla anguilla): an impossible bargain. Ecological Engineering. 18, 575-591.
33
Goodwin, K. R., Angermeier, P. L., Orth, D. J. (1999). Assessing impacts of
hydropower dams on upstream migration of American eel. Final Report to the
Virginia Department of Game and Inland Fisheries, Richmond, Virginia.
Huang, S. L., Chang, M. Y., Wang, Y. T., Tzeng, W. N. (2013). Adverse impacts of
urbanization on the diversity integrity of fish larvae and juveniles in a Taiwan
river estuary. (Unpublished)
Jeremy. (2003). From space to species: ecological applications for remote sensing.
Ecology and Evolution. 18, 414-423.
Jiao, J. J., (2001). Analytical Studies on the Impact of Land Reclamation on Ground
Water Flow. Ground Water. 39, 912-920.
Karl, D. M., Bidigare, R. R. (2001). Letelier RM. Long-term changes in plankton
community structure and productivity in the North Pacific Subtropical Gyre: the
domain shift hypothesis. Deep Sea Res Part II, Topical Studies in Oceanography.
48, 1449-1470.
Kerr, J. T., Ostrovsky, M. (2003). From space to species: ecological applications for
remote sensing. Trends in Ecology and Evolution 18, 299-305.
Kim, H., Kimura, S., Shinoda, A. Kitagawa, T., Sasai, Y., Sasaki, H. (2007) Effect
of El Nino on migration and larval transport of the Japanese eel (Anguilla
japonica). Journal of Marine Science. 64, 1387-1395.
34
Kimura, S., Inoue, T., Sugimoto, T. (2001). Fluctuation in the distribution of low-
salinity water in the NEC and its effect on the larval transport of the Japanese eel.
Fish Oceanography 10, 51-60.
Kimura, S., Itakura, H. (2012). Environmental characteristics of the Japanese eel
migration from spawning grounds to nursery grounds. The 15th East Asia eel
resource consortium
Knights, B. (2003). A review of the possible impacts of long-term oceanic and
climate changes and fishing mortality on recruitment of anguillid eels of the
Northern Hemisphere. The Science of the Total Environment. 310, 237-244.
Krueger, W. H., Oliveira, K. (1999). Evidence for environmental sex determination
in the American eel, Anguilla rostrata. Environmental Biology of Fishes. 55,
381-398.
Larsson, P. (1991). Factors Determining the Uptake of Persistent Pollutantsin an Eel
Population (Anguilla anguilla). Environmental Pollution. 69, 39-50.
Machut, L. S., Limburg, K. E., Schmidt, R. E., Dittman, D. (2007). Anthropogenic
impacts on American eel demographics in Hudson River tributaries, New York.
American Fisheries Society. 136, 1699-1713.
Merem, E. C., Twumasi, Y. A. (2008). Using spatial information technologies as
monitoring devices in international watershed conservation along the Senegal
35
River basin of West Africa. International Journal of Environmental Science and
Public Health. 5, 464-476.
Miller, M. J. (2009) Ecology of Anguilliform leptocephali:Remarkable transparent
fish larvae of the ocean sruface layer. Aqua Bioscience Monographs. 2, 1-94.
Mochioka, N., Iwamizu, M. (1996). Diet of anguilloid larvae: Leptocephali feed
selectively on larvacean houses and fecal pellets. Marine Biology Research. 125,
447-452.
NTNU, Holistic Education Proiect. http://hep.ccic.ntnu.edu.tw/browse2.php?s=905
Smith, M. W., Saunders, J. W. (1955). TheAmerican eel in certain freshwaters of the
maritime provinces of Canada. Journal of the Fisheries Research Board of
Canada. 12, 238-269.
Ogden, J. C. (1970). Relative abundance, food habits, and age of the American eel,
Anguilla rostrata (LeSueur), in certain New Jersey streams. Transactions of the
American Fisheries Society. 99, 54-59.
Otake, T., Nogami, K., Maruyama, K. (1993). Dissolved and particulate organic
matter as possible food sources for eel leptocephali. Marine Ecology Progress
Series. 92, 27-34.
Paolo, T., Maria, B., Walter, B., Marco, C., Matias, C. R., Sofia, B. L. (2013). River
pollution remediation monitored by optical and infrared high-resolution satellite