國立臺灣大學公共衛生學院流行病學與預防醫學硏究所
碩士論文
Institute of Epidemiology and Preventive Medicine College of Public Health
National Taiwan University Master Thesis
應用核磁共振氫譜技術探討台灣女性代謝體特徵 與低骨質密度之關聯研究
Association of Metabolome with Low Bone Mineral Density in Taiwanese Women Revealed
by
1H NMR Spectroscopy
尤瀅淑 Ying-Shu You
指導教授:程蘊菁 博士 林靖愉 博士
Advisors: Yen-Ching Chen, Sc.D.
Ching-Yu Lin, Ph.D.
中華民國 101 年 7 月
July, 2012
i
ii
誌謝
本篇碩士論文能順利完成,背後最重要的推手莫過於指導教授程蘊菁博士。
在程老師不辭辛苦與悉心指導之下,才得已讓學生能完成此艱鉅的任務,在此相
當感謝老師辛勤的付出,很榮幸能擔任程老師的指導學生。另外亦感謝共同指導
教授林靖愉博士給予許多研究上的協助和建議,以及林老師的研究助理梁皓然學
長耐心地教導我操作代謝體學的分析方法,使學生獲益良多。同時也感謝台大北
護分院蔡克嵩院長、中研院統計所副所長丘政民教授,在百忙之中仍能撥冗前來
指教學生的論文研究,並給予中肯的建議。
在進行代謝體學實驗的期間裡,多虧了中研院生醫所核磁共振實驗室裡的研
究員和同仁們,總是熱心又親切地幫助我解決許多難題,才能使我順利收集實驗
資料供研究分析。再者,整個碩士班修業期間,也很感謝程老師研究團隊和同屆
的醫師同學們,大家能一起互助共進。
最後,感謝我親愛的家人和朋友們,不斷給予許多支持和鼓勵!感謝流預所
各位老師們諄諄教導!能建立此基石,皆歸功於所有在我身旁無限供給能量予我
的每一個人,謝謝您們。
尤瀅淑 謹誌 2012.8
iii
摘要
背景:近期已有研究指出骨質疏鬆症與體內不斷循環的特定代謝物具有相關;然
而,若單靠過去研究所探討的少數幾項代謝物,很難對此複雜的致病機轉做詳確
的解釋。如今,代謝體學方法可全面性的檢視人體中代謝情形和潛在的臨床意義。
截至目前為止,未有研究加以驗證人體中代謝體特徵和骨質密度之間的相關。
方法:本研究橫斷式研究設計,自 2009 到 2010 年間招募 610 位年齡介於 40 至
55 歲之間在台北美兆健康檢查中心參加健康檢查的台灣女性。使用雙能量放射線
儀測量隻腰椎骨質密度,以骨質密度值的高低排序後研究族群依人數均分為三等
份,定義骨質密度最高的第二和第三分群為「高骨質密度」組別,而最低的第一
群為「低骨質密度」組別。而血漿代謝體特徵資料是透過核磁共振氫譜實驗分析
所收集而成。運用無監督的主成分分析、監督的偏最小二乘法判別分析法及邏輯
斯迴歸模式,來分析代謝體特徵與骨質密度的相關。
結果:研究結果顯示,無監督的主成分分析的分數散佈圖無法完善地分離高低骨
質密度的組別;監督的偏最小二乘法判別分析法亦沒有能力區別高低骨質密度的
組別。根據停經狀態加以分層之後,可透過偏最小二乘法判別分析法於停經婦女
群體觀察到其代謝體特徵與高低骨質密度顯著的差異(R²= 0.12;Q²=0.04;
Ppermutation=0.03)。此外,在停經婦女身上,會隨著 glutamine 的濃度升高,使得低
骨質密度的風險增加;同時,低骨質密度也與 lactate、acetone、lipid 和 very low
density lipoprotein 濃度降低具有相關。
iv
結論: 這是第一篇研究透過核磁共振氫譜實驗所建立的代謝體學與骨質密度之
研究,我們成功地於停經婦女群體辨識出一群代謝物和低骨質密度具有關聯。其
中,特別是 glutamine 的濃度升高會增加低骨質密度發生的風險,可能會因此導
致骨骼流失。
關鍵詞:代謝體特徵、代謝體學、核磁共振氫譜、骨質疏鬆症、停經、女性
v
Abstract
Background. Osteoporosis has been related to the alteration of specific circulating
metabolites previously. However, studies with few metabolites may have difficulty to
explain the pathogenesis of this complex syndrome. Metabolome provide an overview
of the metabolism status in human body and potential clinical implication. Up to date,
no study has investigated the association between metabolome and bone mineral
density (BMD).
Methods. This is a cross-sectional study. A total of 610 healthy Taiwanese women
aged 40 to 55 were recruited from MJ Health Screening Center between 2009 and
2010. High and low bone mineral density (BMD) was defined as the 2nd plus 3rd
tertiles and the 1st tertile of BMD, respectively. The plasma metabolome were
evaluated by 1H-nuclear magnetic resonance spectroscopy. Principal components
analysis (PCA), partial least-squares discriminant analysis (PLS-DA), and logistic
regression model were used to assess the association between metabolome and BMD.
Results. The unsupervised PCA showed no visual separation between low and high
BMD levels; the supervised PLS-DA model was also unable to distinguish high and
low BMD groups. After stratification by menopausal status, high and low BMD
groups can be differentiated in post-menopausal women using PLS-DA (R²= 0.12;
vi
Q²=0.04; Ppermutation=0.03). In addition, elevated level of glutamine was associated with
the risk of low BMD among postmenopausal women; while low BMD is characterized
by decreased levels of lactate, acetone, lipid, and very low density lipoprotein in the
same sub-population.
Conclusion. This is the first study using ¹H NMR-based metabolomic approach and
successfully identified a group of metabolites representative for postmenopausal
women with low BMD. Especially, elevated level of glutamine may lead to bone loss
via increased risk of low BMD.
Keywords. Metabolome, metabolic profiles, metabolomics, metabonomics, nuclear magnetic resonance, NMR, bone mineral density, osteoporosis, menopause, women.
vii
目錄
審定書 ... i
誌謝 ... ii
摘要 ... iii
Abstract ...v
圖目錄 ... viii
表目錄 ... ix
Chapter 1. Introduction ...1
1.1 Importance of Osteoporosis ... 1
1.2 Bone-Related Proteins and Metabolites ... 2
1.3 NMR-based Metabolomics ... 2
1.4 Aims ... 3
Chapter 2. Materials and Methods ...5
2.1 Study Population ... 5
2.2 Measurement of Bone Mineral Density ... 6
2.2 Sample Collection and Preparation ... 6
2.3 1D 1H NMR Spectroscopy ... 6
2.4 NMR Spectral Pre-Processing ... 7
2.5 Statistical Analyses ... 8
Chapter 3. Results ... 11
3.1 Characteristics of the Study Population ... 11
3.2 Metabolome of the BMD Levels ... 11
3.3 Candidate Metabolites and the Risk of Low BMD ... 12
Chapter 4. Discussion ...15
4.1 Main findings ... 15
4.2 Evidences of Metabolites and Bone Metabolism ... 15
4.3 Strengths and limitations ... 17
4.4 Conclusions ... 19
References ...20
viii
圖目錄
Figure 1. Flowchart of participant recruitment ... 30 Figure 2. The tertiles of bone mineral density ... 31 Figure 3. PCA score plots from the analysis of CPMG NMR spectra using women
plasma samples ... 32 Figure 4. PLS-DA score plots from the analysis of CPMG NMR spectra using women
plasma samples ... 33 Figure 5. Receiver operating characteristic curves of comparing models for
classification of high and low BMD ... 34 Figure 6. Acetone distribution by fasting glucose level ... 35 Figure 7. Postulated mechanism relates important metabolites with bone mineral
density among postmenopausal women ... 36
ix
表目錄
Table 1. Characteristics of the study population ... 37 Table 2. The PLS-DA parameters and permutation test for differentiating high and low
BMD levels ... 38 Table 3. The change of plasma metabolites in postmenopausal women to distinguish
high and low BMD ... 39 Table 4. Association between plasma metabolites and bone mineral density (T1 vs.
T2+T3) ... 40 Table 5. Association between plasma metabolites and bone mineral density stratified
by menopausal status (T1 vs. T2+T3) ... 41 Table 6. Receiver operating characteristic contrast tests of pairwise comparison
between different models to classify high and low BMD ... 42 Table 7. Model comparisons for the association between plasma metabolites and bone
mineral density (T1 vs. T2+T3) ... 43
1
Chapter 1. Introduction
1.1 Importance of Osteoporosis
Osteoporotic fractures are a major cause of morbidity, disability, and the
subsequent premature death in the elderly.1According to World Health Organization
criteria, osteoporosis is defined as bone mineral density (BMD) is 2.5 standard
deviations (SD) below the mean. In the United States, spinal osteoporosis was more
prevalent among Mexican American (24.4% for women and 4.6% for men) than that
among either non-Hispanic blacks (5.3% for women) or non-Hispanic whites (10.9%
for women and 2.2% for men) aged 50 years or older in National Health and Nutrition
Examination Survey (NHANES) from 2005 to 2008.2 In the 2005 to 2008 Nutrition
and Health Survey in Taiwan (NAHSIT 2005-2008), the prevalence of osteoporosis at
lumbar spine is 12.6 % in women and 4.3% in men aged 50 years or older.3
Furthermore, BMD testing, impaired vision, and neuromuscular deficits before age 65
are recommended for predicting the risk of future fracture4, which has known to
associated with high mortality. As the population aging fast worldwide, osteoporosis
has become an important public health issue.
2
1.2 Bone-Related Proteins and Metabolites
Decreased bone mass occurs when bone resorption is excessive or bone
formation is decreased. Bone turnover markers (e.g., alkaline phosphatase, osteocalcin,
type I collagen cross-linked N-telopeptide, hydroxyproline and the pyridinium
crosslinks, etc.) have been used to monitor bone homeostasis and predict fracture
risk.5,6 However, 20% to 30% of women with high bone turnover rate may be
misclassified as osteoporosis patients in the future.7 On the other hand, some studies
found that elevated homocysteine, which interferes with the cross-linking of collagen
in bone, may predict osteoporotic fractures.8-10 However, the association between
homocysteine and BMD has been inconsistent.8,9,11,12 Moreover, in vitro and in vivo
studies showed that nuclear factor kappa-light-chain-enhancer of activated B cells
(NF-κB) essential modulator -binding domain (NBD) peptide13 and polyunsaturated
fatty acids14 inhibit osteoclastogenesis for bone loss. In summary, past studies only
explored few metabolites and thus may have difficulty on predicting the complex
syndrome, osteoporosis.
1.3 NMR-based Metabolomics
Metabolomics based on Nuclear Magnetic Resonance spectroscopy (NMR)
3
spectrometry allow the detection of a wide range of structurally diverse metabolites
simultaneously as well as metabolome for the discovery of novel biomarkers.15 The
NMR spectrum is made up of peaks from each chemically distinct hydrogen atom in
the molecule, and the peak position of a given hydrogen on the frequency axis is
known as a chemical shift [unit: parts per million (ppm), often termed a δ value] from
that of a reference substance.15-17 In addition, NMR is a robust and reliable technique
for metabolomic applications with high reproducibility.15,18,19 The NMR-based
spectroscopic method usually uses urine or blood plasma/serum as the primary sample
sources of metabolic fingerprint data.20,21 Generally, as compared with urine, blood
sample has less pH variations, dietary or drug effects.15,22 Therefore, NMR-based
metabolomics gradually become an important tool in predicting metabolites for
different research purpose, e.g., drugs, diet, lifestyle, environment, stimuli and genetic
modulations.15
1.4 Aims
Previous studies evaluated limited number of candidate metabolites, which is
hard to address the overview of the metabolism status in human body. Up to date, the
association between metabolome and BMD has only been explored in ovariectomized
4
rats.23,24 Therefore, this study adopted the high-throughput 1H NMR-based
‘metabonomic/metabolomic’ approach20,21 to assess the association between plasma
metabolome and BMD in healthy middle-aged women. In addition, because estrogen
deficiency-induced bone loss is observed in postmenopausal women, who are more
susceptible to fragility fractures than premenopausal women,25 this study further
accessed the effect modification by menopausal status.
5
Chapter 2. Materials and Methods
2.1 Study Population
This was a cross-sectional study. A total of 773 Taiwanese women aged 40 to 55
were recruited from MJ Health Screening Center, Taipei, Taiwan, between October
2009 and August 2010. Each participant filled out a self-reported questionnaire and
provided a blood sample. The outcome of this study was BMD (g/cm2) at lumbar spine.
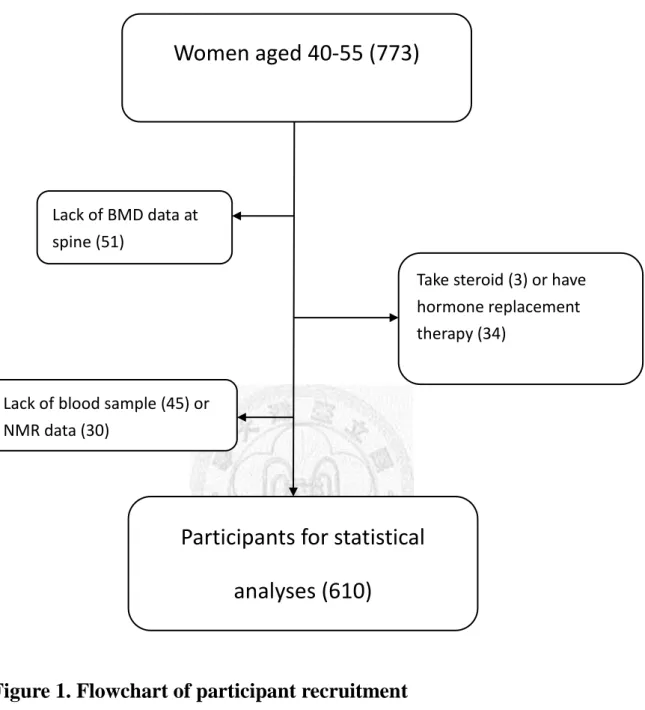
Participants with the following conditions or diseases were excluded (n=163): (1)
received hormone replacement therapy (n=34) or other medications (e.g., steroid, n=3)
that may affect BMD, (2) lack of BMD at lumbar spine (n = 51), (3) lack of blood
samples (n=45), (6) or lack of NMR data (n=30). A total of 610 women were included
for data analyses (Figure 1). Informed consent was obtained from each participant.
The study protocol has been approved by the institutional review boards of MJ Health
Screening Center and College of Public Health, National Taiwan University.
A self-report questionnaire was administered to collect information on
demography, life style (e.g., smoking, alcohol consumption, calcium supplement, and
regular exercise), menopausal status, disease history (e.g., hypertension and diabetes),
and medication history (e.g., steroid, anti-inflammatory drugs, Chinese herb, and
gastrointestinal drugs).
6
2.2 Measurement of Bone Mineral Density
BMD (g/cm2) was measured at the lumbar spine by using dual-energy X-ray
absorptiometry (DXA, GE Lunar Health Care, DPX-L, USA), which was calibrated by
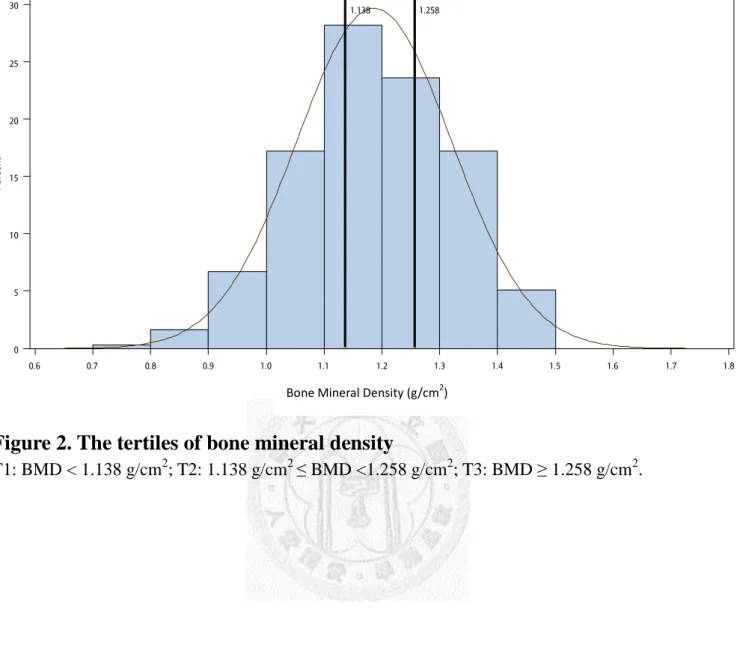
a standard automated test program provided by the manufacturer. BMD was tertiled
(T1, T2, and T3) based the whole population. High BMD was defined as T2 plus T3
(reference group) and low BMD was defined as T1 (comparison group, Figure 2).
2.2 Sample Collection and Preparation
Fasting blood samples were collected in tubes containing sodium ethylene
diamine tetraacetic acid (EDTA) from each participant. After centrifugation, plasma
samples were stored in a −80°C freezer. Before NMR procedures, 200 µl of plasma
was diluted with a ratio of 1:2 in physiological saline [0.9% (w/v) NaCl solution] with
10% D2O. Solution in Eppendorf tubes were then centrifuged at 15,000g for 5 min at
4°C, and 550 µl of supernatant was transferred into 5 mm NMR tubes.
2.3 1D
1H NMR Spectroscopy
All NMR spectra were acquired at 500.13 MHz using Avance-500 spectrometers
(Bruker, Fremont, CA) at a 1H frequency with 300 K internal probe temperature at
7
High Field Nuclear Magnetic Resonance Center in Academia Sinica, Taiwan.
For the plasma samples, Carr-Purcell-Meiboom-Gill (CPMG)-presat pulse
sequence (relaxation delay-90°-(t -180°-t)n -90°-acquired-free induction decay) was
acquired from 1D 1H NMR analysis. For each sample, 128 scans were collected into
64K computer data points using a spectral width of 10,000 Hz (20 ppm), with a total
echo time of 64 ms (t= 400 µs) during the relaxation delay (RD, 2.0 s) and an
acquisition time of 1.63 s.15 Additionally, all 1D spectra were applied for analysis
before Fourier transformation with zero-filled to exponential line-broadenings of
0.5 Hz. The acquired NMR spectra were phased, baseline-corrected, and then
calibrated by the methyl lactate doublet (δ 4.12 ppm) using TopSpin 2.0 (Bruker
Biospin Ltd.).
2.4 NMR Spectral Pre-Processing
After acquisition of the NMR data, each spectrum was then segmented into
1,880 chemical shift bins between δ 0.2 and δ 10.0, corresponding to a bin width of
0.005 ppm (2.5 Hz), using custom-written ProMetab software Version 3.3 in
MATLAB (Version 7.0.1, The MathWorks, Natick, MA).26 Following the removal of
the residual water (δ 4.50-6.00 ppm) and EDTA (δ 3.58-3.65 ppm and δ 3.17-3.23
ppm),27 the area within each spectral bin was integrated to yield a 1×1572 vectors
8
containing intensity-based descriptors of the original spectrum. The total spectral area
of the remaining bins was normalized to unity to facilitate comparison between the
spectra. The binned data was subject to the generalized log transformation
(λ = 8 × 10⁻⁹),28 and the columns were mean-centered by Pareto scaling29,30 before
multivariate analysis.
2.5 Statistical Analyses
The reduced and normalized NMR spectral binned data were uploaded to
Metaboanalyst 2.0
(
http://www.metaboanalyst.ca)
31 for principal components analysis(PCA), an unsupervised approach, and partial least-squares discriminant analysis
(PLS-DA), a supervised method, to identify which metabolites contributed to specific
clusters. PCA is used to reduce high-throughput metabolomic data into principal
components without referring to the BMD level, and then the low-dimensional PCA
score plots were visually inspected for natural separation of the two BMD levels (low
vs. high, Figure 2). In contrast, PLS-DA uses previous knowledge about the BMD
level during the classification process by multiple linear regression technique to find
the direction of maximum covariance between metabolome and the BMD level. The
PLS-DA score plots were used to assess if the metabolome can be separated based on
BMD levels. Furthermore, PLS-DA was determined by the number of latent variables
9
below to build the model. A default 10-fold internal cross validation was employed,
from which Q2 (expressing the cross-validated predictive capability), R2 (explained
variance) and variable importance in projection (VIP) score (coefficient reflects the
relative importance of each variable) were used to extract important plasma
metabolites (threshold>1.5) in the PLS-DA model.
Student’s t test (for normally-distributed continuous variables) and Pearson’sχ2
test (for categorical variables) were performed to compared the baseline distribution of
potential confounders by BMD level (T1 vs. T2 plus T3). Logistic regression model
was used to estimate odds ratios (ORs) and 95% confidence intervals (CIs) in women
with low BMD (T1) versus high BMD (T2 plus T3) for selective metabolites
(VIP>1.5). All models were adjusted for age, menopausal status (yes vs. no), body
weight (continuous), height (continuous), waist circumference (continuous), creatinine
(>79 mg/dL, yes vs. no), regular exercise (≥2 times/week for 30 minutes or more, yes
vs. no), and serum alkaline phosphatase (ALP≥ 60 IU, yes vs. no). These variables
were selected by either stepwise model selection (Slentry=0.15, Slstay=0.15) or
because of its biological importance to BMD level. Serum creatinine and ALP were
dichotomized by its median because quite few participants had abnormal level in this
healthy population.
Because menopausal status significantly affect BMD level, effect modification
10
by menopausal status (yes/no) was explored by comparing a model with terms for
main effects and interaction terms to the models for main effect only using the
likelihood ratio test. Stratified analysis was performed to assess the relationship
between metabolome and BMD by menopausal status. Areas under the receiver
operating characteristic (ROC) curve (AUC) were calculated to evaluate the
performance of the candidate metabolites. An AUC value of 1.0 represents a prediction
model with 100% sensitivity and 100% specificity, while an AUC value of 0.5
correspond to a poor predictive model. All analyses were performed by using SAS 9.2
(SAS Institute, Cary, NC). All statistical tests were two-sided and a P value less than
0.05 was considered statistically significant.
11
Chapter 3. Results
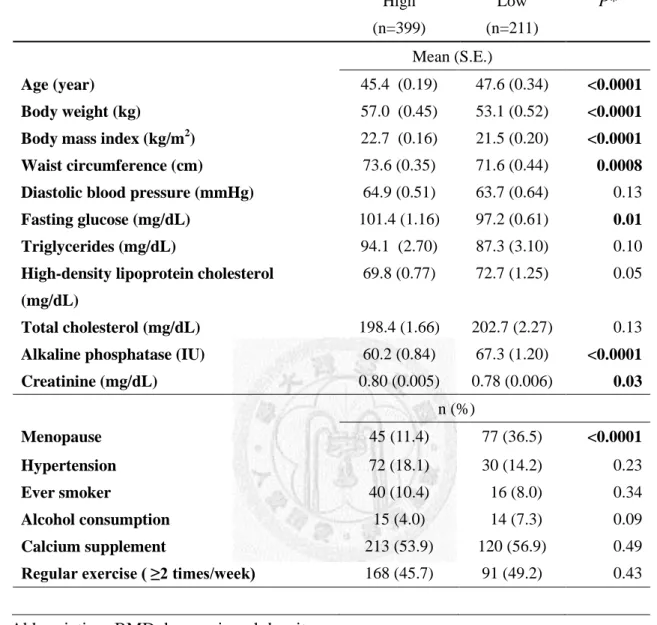
3.1 Characteristics of the Study Population
This cross-sectional study included 610 healthy women aged 40 to 55. As
compared to women with high BMD, women with low BMD were older (47.6 vs. 45.4
years old), had lower body weight (53.1 vs. 57.0 kg), body mass index (21.5 vs. 22.7
kg/m2), waist circumference (71.6 vs.73.6 cm), fasting glucose level (97.2 vs. 101.4
mg/dL), and creatinine level (0.78 vs. 0.80 mg/dL), and had higher alkaline
phosphatase level (67.3 vs. 60.2 IU), and more postmenopausal women (36.5% vs.
11.4%, Table 1). The distributions of diastolic blood pressure, triglyceride,
high-density lipoprotein cholesterol, total cholesterol, hypertension status, smoking
history, alcohol consumption, calcium supplement, and regular exercise were similar
between high and low BMD.
3.2 Metabolome of the BMD Levels
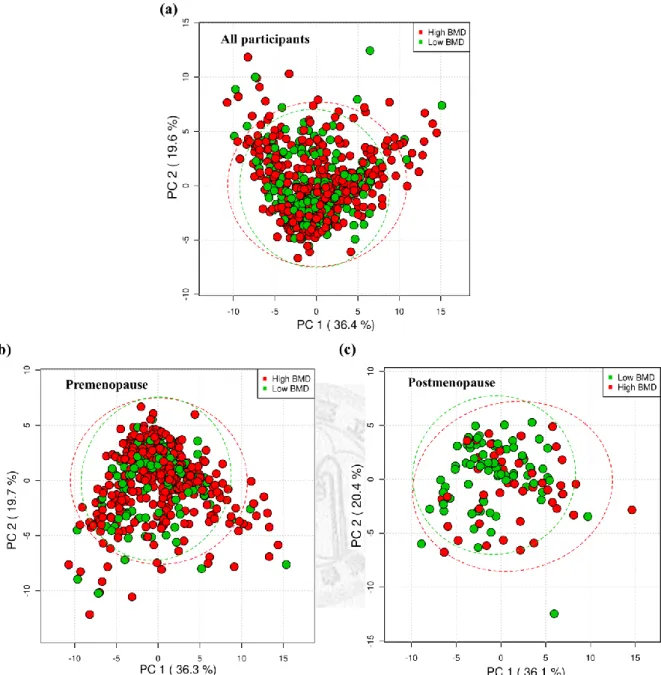
Metabolome obtained from unsupervised PCA showed no visual separation
between low and high BMD levels as well as after stratified by menopausal status
(Figure 3).
12
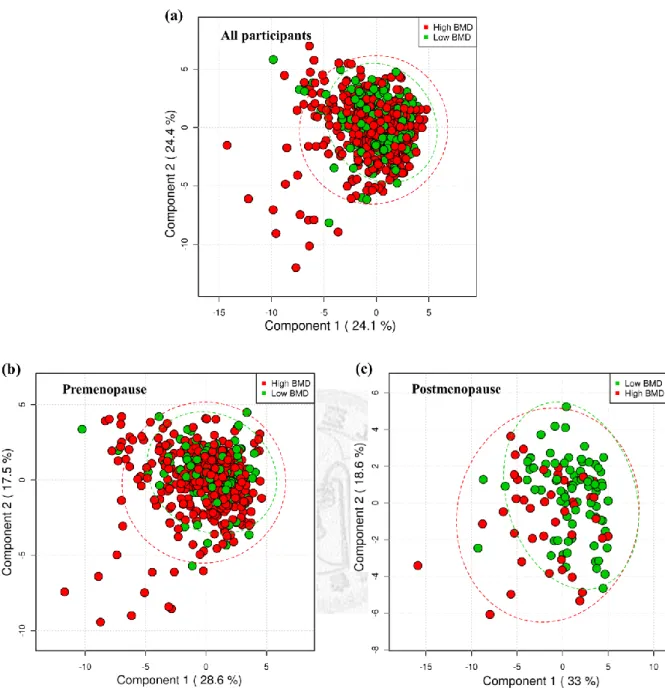
For supervised approach, PLS-DA score plots revealed little evidence of
separation between high and low BMD clusters (Figure 4a). Some parameters of
PLS-DA model were applied to compare high and low BMD and results using one
component again showed little evidence of classification (variation: R2=0.03,
predictive capability: Q2 of 10-fold cross validation=-0.002, 1000 random permutation
test: p=0.07, Table 2). After stratification by menopausal status, metabolome showed
better separation by high and low BMD levels in menopausal women (Figure 4b and
4c; R2=0.12, Q2=0.04, permutation test p=0.03) but not in premenopausal women
(R2=0.01, Q2=-0.02, permutation test p=0.76).
3.3 Candidate Metabolites and the Risk of Low BMD
Given the success of the PLS-DA model in classifying high and low BMD
among postmenopausal women (Table 2), a total of 7 significantly altered metabolites
(VIP > 1.5) were identified based on published data16,17 and Chenomx NMR suite
(Chenomx Inc., Alberta, Canada). As compared with high BMD, low BMD was
related to decreased levels of plasma lactate, acetone, lipid, very low lipoprotein
(VLDL), and glucose, and elevated acetate and glutamine (Table 3).
13
For multivariate logistic regression, women who had an elevated level of
glutamine was significantly associated with 1.6-fold increased risk of low BMD
(AOR=1.55, 95% CI=1.03-2.33, Table 4). In addition, no significant difference
between high and low BMD level was found for lactate, acetone, acetate, lipid, VLDL,
and glucose (Table 4). However, menopausal status significantly modified the
association between lactate (P interaction=0.004), acetone (P interaction=0.01),
acetatate (P interaction=0.02), lipid (P interaction=0.04), VLDL (P interaction=0.02),
glutamine (P interaction=0.04) and the risk of low BMD (Table 5). After stratification,
postmenopausal women with elevated level of lactate (AOR=0.55, 95% CI=
0.33-0.92), acetone (AOR=0.51, 95% CI= 0.31-0.85), lipid (AOR=0.04, 95%
CI=0.001-0.91), and VLDL (AOR=0.49, 95% CI=0.27-0.90) had a significantly
decreased risk of low BMD (Table 5). No significant association was observed for
premenopausal women. In contrast, postmenopausal women with elevated level of
glutamine had an increased risk of low BMD (AOR=6.04, 95% CI=1.57-23.21, Table
5). No significant association was observed for acetate and glucose in either pre- or
postmenopausal women.
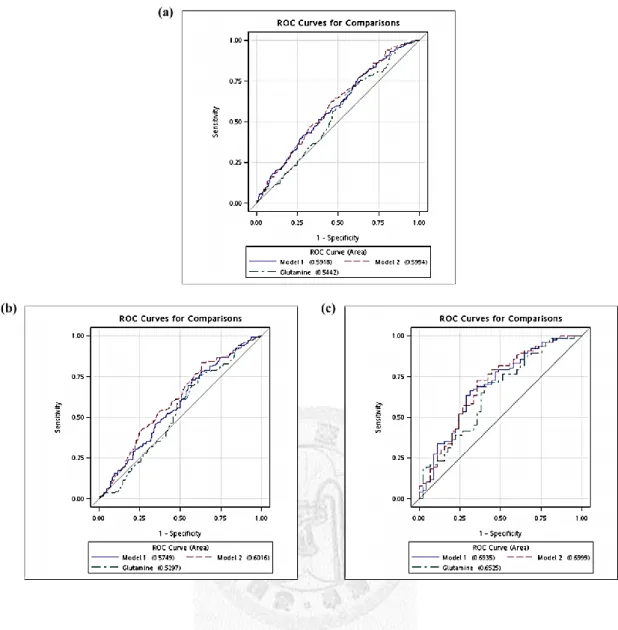
Comparing the ROC curves of model 1 (lactate, acetone, lipid, VLDL, and
glutamine), model 2 (variables in model 1 plus acetate and glucose), and glutamine
alone, the AUC was 0.59 for model 1 (95% CI=0.55-0.64, Figure 5a), 0.60 for model 2
14
(95% CI=0.55-0.65), and 0.54 for glutamine alone (95% CI=0.50-0.59) with limited
ability to classify high and low BMD. After stratification by menopausal status, the
AUC became 0.57 for model 1 (95% CI=0.52-0.63, Figure 5b), 0.60 for model 2 (95%
CI=0.55-0.66), and 0.53 (95% CI=0.48-0.58) for glutamine alone for premenopausal
women; AUC was 0.69 for model 1 (95% CI= 0.67-0.72, Figure 5c), 0.70 for model 2
(95% CI= 0.67-0.73), and 0.65 (95% CI= 0.63-0.68) for glutamine alone in
postmenopausal women. For pairwise comparisons between models using ROC
contrast tests, ROC curves were different between model 2 and glutamine alone in all
participants (p=0.03), premenopausal women (p=0.02), and postmenopausal women
(p=0.01, Table 6), respectively. In addition, ROC curve of glutamine alone was
significant different to ROC curve of model 1 in postmenopausal women (p=0.03,
Table 6).
15
Chapter 4. Discussion
4.1 Main findings
This is the first epidemiologic study used 1H NMR-based metabolomic approach
to investigate the association between plasma metabolome and the risk of low BMD.
Before stratification by menopausal status, metabolome were not associated with the
risk of low BMD; significant association was observed in postmenopausal women
only. Reactive oxygen species has been related to age-related and estrogen-dependent
bone loss.32 Therefore, estrogen plays an important role in maintaining bone strength
by diminish oxidative stress in bone and bone marrow in women. As estrogen level
decreases significantly after menopause, this may explain menopausal status affect the
association of metabolome with BMD level.
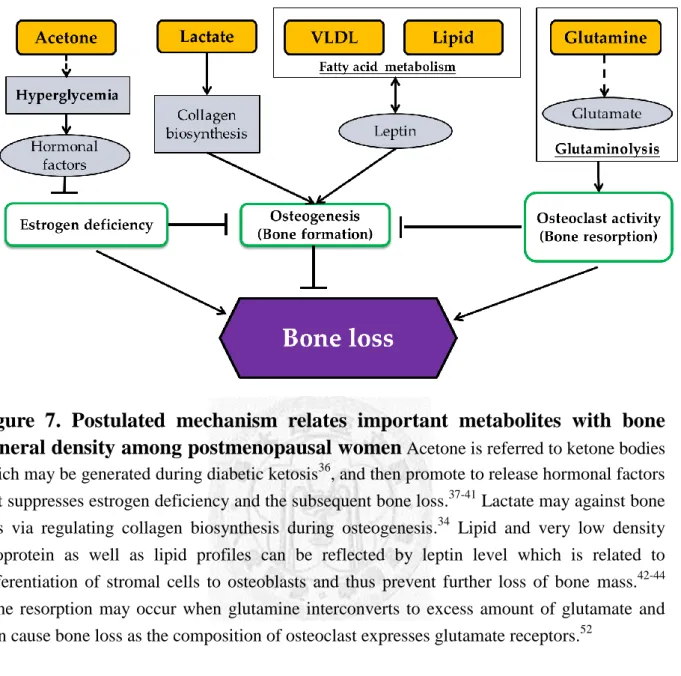
4.2 Evidences of Metabolites and Bone Metabolism
Among the top 7 metabolites identified by PLS-DA model (VIP>1.5), elevated
levels of lactate, acetone, lipid, and VLDL were significantly associated with
decreased risk of low BMD; instead, glutamine showed significant increased risk of
low BMD and acetate and glucose showed no association. Below details the postulated
16
mechanism of each metabolite with BMD (Figure 7).
Lactate. Lactate is the end product of glycolysis derived from glucose under low
oxygen conditions.33 Lactate is also a crucial intermediate for regulating collagen
biosynthesis during osteogenesis.34 This may explain that increased level of lactate
was associated with decreased risk of low BMD via increased bone formation.
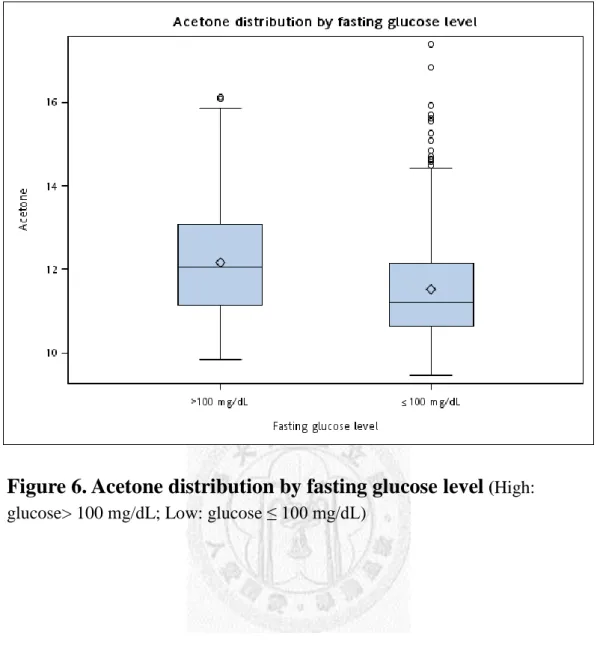
Acetone. Acetone is spontaneous produced in the body by the decarboxylation of
acetoacetate, which refers to ketone bodies.35 In human plasma, concentration of
acetone was (generally higher than acetoacetate) correlated with fasting and diabetic
ketosis.36 However, recent studies suggested that BMD was increased in patient with
Type 2 diabetes37-39 via increased mechanical loading and release of hormonal factors
(oestrogen, leptin and adiponectin).40,41 This is also observed in our study, that is,
women with the symptom of diabetes mellitus (i.e., fasting glucose > 100 mg/dL) had
higher acetone (Figure 6) and lower risk of low BMD after menopause than those
without elevated level of fasting glucose.
Lipid & VLDL. Some evidence showed that the amount of body lipid across a broad
range of body fat can be reflected by leptin levels,42 which related to differentiation of
stromal cells to osteoblasts and thus prevent further loss of bone.43,44 This may explain
our finding that lipid and VLDL were associated with decreased risk of low BMD,
which was consistent with other studies.45,46 However, our findings do not support the
17
previous lipid hypothesis of osteoporosis, which suggests that LDL oxidation and
atherogenic lipid profiles promote bone loss,47-49 probably because the characteristics
of this study population was differ from previous studies and adjusted different
confounding factors in models.
Glutamine. Glutamine may regulate bone metabolism via osteoclast and can
interconvert to glutamate (Glu), a major neuromediator of the central and peripheral
nervous systems.50,51 In addition, Glu may lead to bone resorption via bone cells
express Glu receptors, especially on osteoclast,52 this supports our finding that
elevated glutamine was associated with elevated risk of low BMD. Moreover, some
studies have reported that estrogen facilitates the neuroprotection against oxidative
stress and reduces glutamatergic excitotoxicity.53,54 This further explains our finding
that elevated glutamine was associated with increased risk of low BMD among
postmenopausal women. However, this finding showed different metabolome as
compared with those from ovariectomized rats.23,24,55,56
It is possible that
epidemiologic and experimental studies differ in many ways, e.g., controlling for
confounding effect, sample size, and biological mechanism, etc.
4.3 Strengths and limitations
This study had several strengths. First, this study had relatively large sample
18
size, especially for metabolomic study on human participants. Second, previous
studies mainly focused on the association of limited metabolites with BMD in
postmenopausal women.57,58 This study used high-throughput and unbiased approach
to evaluate the metabolome and includes both pre- and postmenopausal women, which
opens a broad view on research in similar topics. In addition, this study additionally
adjusted for numerous important confounders (age, body weight, menopausal status,
creatinine, waist circumference, serum alkaline phosphatase), which provides more
reliable results.
This study had some limitations. First, the cross-sectional design does not allow
us to assess causal inference. Second, this population is relatively healthy and thus it is
not easy to differentiate the metabolome between high and low BMD groups. This is
also why this study did not use clinical cutoff points for BMD level (Figure 2) and
some biochemical values, e.g., serum alkaline phosphatase and creatinine. Third, this
study only assessed metabolome from plasma but not other biomarkers, e.g., urine.
This is because plasma can provide data on lipid-soluble compounds,22 which has
known with extensive association with osteoporosis.45-49 However, lipid profile is not
available in urine sample as it is hydrophilic. Last, the use of sodium EDTA tubes for
collecting blood samples prevented us from obtaining the information on some
metabolites, e.g., glycerol, choline, and valine, etc.16,27 However, a recent study
19
showed that even though some endogenous metabolites might be obscured by the
anticoagulant peaks, the information of these anticoagulants binding metabolites can
be identified by other signals [e.g., glycerol (δ 3.87), choline (δ 3.50), valine (δ 2.28)],
which are available in our NMR spectra.27 After removal of anticoagulants, the
inter-sample variation in these lipoprotein signals would allow us to perform the
statistical analyses.
4.4 Conclusions
This study, for the first time, identified metabolome for predicting the risk of
low BMD in postmenopausal women. Metabolomics can quantify a large-scale of
metabolites to characterize response to drugs, diet, lifestyle, environmental stimuli and
genetic modulations.15 Future studies exploring gene-metabolite interactions using
liquid chromatograph/mass spectrometry for low abundant metabolites and animal
studies are warranted to shed light on the association between metabolome and BMD
in human.
20
References
1. Prentice A. Diet, nutrition and the prevention of osteoporosis. Public Health Nutr
2004;7:227-43.
2. Dawson-Hughes B, Looker AC, Tosteson AN, Johansson H, Kanis JA, Melton
LJ, 3rd. The potential impact of the National Osteoporosis Foundation guidance
on treatment eligibility in the USA: an update in NHANES 2005-2008.
Osteoporosis international : a journal established as result of cooperation
between the European Foundation for Osteoporosis and the National
Osteoporosis Foundation of the USA 2012;23:811-20.
3. Lin YC, Pan WH. Bone mineral density in adults in Taiwan: results of the
Nutrition and Health Survey in Taiwan 2005-2008 (NAHSIT 2005-2008). Asia
Pac J Clin Nutr 2011;20:283-91.
4. Raisz LG. Clinical practice. Screening for osteoporosis. N Engl J Med
2005;353:164-71.
5. Kanis JA. Diagnosis of osteoporosis and assessment of fracture risk. Lancet
2002;359:1929-36.
6. Garnero P, Hausherr E, Chapuy MC, Marcelli C, Grandjean H, Muller C,
Cormier C, Breart G, Meunier PJ, Delmas PD. Markers of bone resorption
predict hip fracture in elderly women: the EPIDOS Prospective Study. J Bone
21
Miner Res 1996;11:1531-8.
7. Garnero P, Mulleman D, Munoz F, Sornay-Rendu E, Delmas PD. Long-term
variability of markers of bone turnover in postmenopausal women and
implications for their clinical use: the OFELY study. J Bone Miner Res
2003;18:1789-94.
8. McLean RR, Jacques PF, Selhub J, Tucker KL, Samelson EJ, Broe KE, Hannan
MT, Cupples LA, Kiel DP. Homocysteine as a predictive factor for hip fracture
in older persons. N Engl J Med 2004;350:2042-9.
9. van Meurs JB, Dhonukshe-Rutten RA, Pluijm SM, van der Klift M, de Jonge R,
Lindemans J, de Groot LC, Hofman A, Witteman JC, van Leeuwen JP, Breteler
MM, Lips P, Pols HA, Uitterlinden AG. Homocysteine levels and the risk of
osteoporotic fracture. N Engl J Med 2004;350:2033-41.
10. Leboff MS, Narweker R, LaCroix A, Wu L, Jackson R, Lee J, Bauer DC, Cauley
J, Kooperberg C, Lewis C, Thomas AM, Cummings S. Homocysteine levels and
risk of hip fracture in postmenopausal women. J Clin Endocrinol Metab
2009;94:1207-13.
11. Enneman AW, van der Velde N, de Jonge R, Heil SG, Stolk L, Hofman A,
Rivadeneira F, Zillikens MC, Uitterlinden AG, van Meurs JB. The association
between plasma homocysteine levels, methylation capacity and incident
22
osteoporotic fractures. Bone 2012.
12. Gjesdal CG, Vollset SE, Ueland PM, Refsum H, Drevon CA, Gjessing HK, Tell
GS. Plasma total homocysteine level and bone mineral density: the Hordaland
Homocysteine Study. Arch Intern Med 2006;166:88-94.
13. Jimi E, Aoki K, Saito H, D'Acquisto F, May MJ, Nakamura I, Sudo T, Kojima T,
Okamoto F, Fukushima H, Okabe K, Ohya K, Ghosh S. Selective inhibition of
NF-kappa B blocks osteoclastogenesis and prevents inflammatory bone
destruction in vivo. Nat Med 2004;10:617-24.
14. Yuan J, Akiyama M, Nakahama K, Sato T, Uematsu H, Morita I. The effects of
polyunsaturated fatty acids and their metabolites on osteoclastogenesis in vitro.
Prostaglandins Other Lipid Mediat 2010;92:85-90.
15. Beckonert O, Keun HC, Ebbels TM, Bundy J, Holmes E, Lindon JC, Nicholson
JK. Metabolic profiling, metabolomic and metabonomic procedures for NMR
spectroscopy of urine, plasma, serum and tissue extracts. Nat Protoc
2007;2:2692-703.
16. Nicholson JK, Foxall PJ, Spraul M, Farrant RD, Lindon JC. 750 MHz 1H and
1H-13C NMR spectroscopy of human blood plasma. Anal Chem
1995;67:793-811.
17. Nicholson G, Rantalainen M, Maher AD, Li JV, Malmodin D, Ahmadi KR,
23
Faber JH, Hallgrimsdottir IB, Barrett A, Toft H, Krestyaninova M, Viksna J,
Neogi SG, Dumas ME, Sarkans U, The Molpage C, Silverman BW, Donnelly P,
Nicholson JK, Allen M, Zondervan KT, Lindon JC, Spector TD, McCarthy MI,
Holmes E, Baunsgaard D, Holmes CC. Human metabolic profiles are stably
controlled by genetic and environmental variation. Mol Syst Biol 2011;7:525.
18. Keun HC, Ebbels TM, Antti H, Bollard ME, Beckonert O, Schlotterbeck G,
Senn H, Niederhauser U, Holmes E, Lindon JC, Nicholson JK. Analytical
reproducibility in 1H NMR-based metabonomic urinalysis. Chem Res Toxicol
2002;15:1380-6.
19. Dumas ME, Maibaum EC, Teague C, Ueshima H, Zhou B, Lindon JC,
Nicholson JK, Stamler J, Elliott P, Chan Q, Holmes E. Assessment of analytical
reproducibility of 1H NMR spectroscopy based metabonomics for large-scale
epidemiological research: the INTERMAP Study. Analytical chemistry
2006;78:2199-208.
20. Nicholson JK, Lindon JC, Holmes E. 'Metabonomics': understanding the
metabolic responses of living systems to pathophysiological stimuli via
multivariate statistical analysis of biological NMR spectroscopic data.
Xenobiotica 1999;29:1181-9.
21. Fiehn O. Metabolomics--the link between genotypes and phenotypes. Plant Mol
24
Biol 2002;48:155-71.
22. Gibney MJ, Walsh M, Brennan L, Roche HM, German B, van Ommen B.
Metabolomics in human nutrition: opportunities and challenges. Am J Clin Nutr
2005;82:497-503.
23. Long WF, Li L, Chen HQ, Tang Y, He XL, Jing RZ. 1H-NMR-based
metabonomics analysis of plasma from osteoporotic rats induced by ovariectomy.
Sichuan Da Xue Xue Bao Yi Xue Ban 2009;40:843-7.
24. Xue L, Wang Y, Liu L, Zhao L, Han T, Zhang Q, Qin L. A 1HNMR-Based
Metabonomics Study of Postmenopausal Osteoporosis and Intervention Effects
of Er-Xian Decoction in Ovariectomized Rats. Int J Mol Sci 2011;12:7635-51.
25. Lerner UH. Bone remodeling in post-menopausal osteoporosis. J Dent Res
2006;85:584-95.
26. Viant MR. Improved methods for the acquisition and interpretation of NMR
metabolomic data. Biochem Biophys Res Commun 2003;310:943-8.
27. Barton RH, Waterman D, Bonner FW, Holmes E, Clarke R, Nicholson JK,
Lindon JC. The influence of EDTA and citrate anticoagulant addition to human
plasma on information recovery from NMR-based metabolic profiling studies.
Mol Biosyst 2010;6:215-24.
28. Purohit PV, Rocke DM, Viant MR, Woodruff DL. Discrimination models using
25
variance-stabilizing transformation of metabolomic NMR data. OMICS
2004;8:118-30.
29. Eriksson L, Johansson E, Kettaneh-Wold N, Wold S. Introduction to multi-
andmegavariate dta analysis using projection methods (PCA & PLS): Umetrics;
1999.
30. van den Berg RA, Hoefsloot HC, Westerhuis JA, Smilde AK, van der Werf MJ.
Centering, scaling, and transformations: improving the biological information
content of metabolomics data. BMC Genomics 2006;7:142.
31. Xia J, Psychogios N, Young N, Wishart DS. MetaboAnalyst: a web server for
metabolomic data analysis and interpretation. Nucleic Acids Res
2009;37:W652-60.
32. Manolagas SC. From estrogen-centric to aging and oxidative stress: a revised
perspective of the pathogenesis of osteoporosis. Endocr Rev 2010;31:266-300.
33. Cohen SA. Amino acid analysis using precolumn derivatization with
6-aminoquinolyl-N-hydroxysuccinimidyl carbamate. Methods Mol Biol
2000;159:39-47.
34. Sengupta S, Park SH, Patel A, Carn J, Lee K, Kaplan DL. Hypoxia and amino
acid supplementation synergistically promote the osteogenesis of human
mesenchymal stem cells on silk protein scaffolds. Tissue Eng Part A
26
2010;16:3623-34.
35. Frayn KN. Calculation of substrate oxidation rates in vivo from gaseous
exchange. J Appl Physiol 1983;55:628-34.
36. Owen OE, Trapp VE, Skutches CL, Mozzoli MA, Hoeldtke RD, Boden G,
Reichard GA, Jr. Acetone metabolism during diabetic ketoacidosis. Diabetes
1982;31:242-8.
37. Vestergaard P. Discrepancies in bone mineral density and fracture risk in patients
with type 1 and type 2 diabetes--a meta-analysis. Osteoporos Int
2007;18:427-44.
38. Shan PF, Wu XP, Zhang H, Cao XZ, Gu W, Deng XG, Gu C, Liao EY. Bone
mineral density and its relationship with body mass index in postmenopausal
women with type 2 diabetes mellitus in mainland China. J Bone Miner Metab
2009;27:190-7.
39. Ma L, Oei L, Jiang L, Estrada K, Chen H, Wang Z, Yu Q, Zillikens MC, Gao X,
Rivadeneira F. Association between bone mineral density and type 2 diabetes
mellitus: a meta-analysis of observational studies. Eur J Epidemiol
2012;27:319-32.
40. Adami S. Bone health in diabetes: considerations for clinical management. Curr
Med Res Opin 2009;25:1057-72.
27
41. Felson DT, Zhang Y, Hannan MT, Anderson JJ. Effects of weight and body mass
index on bone mineral density in men and women: the Framingham study. J
Bone Miner Res 1993;8:567-73.
42. Frederich RC, Hamann A, Anderson S, Lollmann B, Lowell BB, Flier JS. Leptin
levels reflect body lipid content in mice: evidence for diet-induced resistance to
leptin action. Nat Med 1995;1:1311-4.
43. Thomas T, Gori F, Khosla S, Jensen MD, Burguera B, Riggs BL. Leptin acts on
human marrow stromal cells to enhance differentiation to osteoblasts and to
inhibit differentiation to adipocytes. Endocrinology 1999;140:1630-8.
44. Martin A, de Vittoris R, David V, Moraes R, Begeot M, Lafage-Proust MH,
Alexandre C, Vico L, Thomas T. Leptin modulates both resorption and formation
while preventing disuse-induced bone loss in tail-suspended female rats.
Endocrinology 2005;146:3652-9.
45. Adami S, Braga V, Zamboni M, Gatti D, Rossini M, Bakri J, Battaglia E.
Relationship between lipids and bone mass in 2 cohorts of healthy women and
men. Calcif Tissue Int 2004;74:136-42.
46. Brownbill RA, Ilich JZ. Lipid profile and bone paradox: higher serum lipids are
associated with higher bone mineral density in postmenopausal women. J
Womens Health (Larchmt) 2006;15:261-70.
28
47. Yamaguchi T, Sugimoto T, Yano S, Yamauchi M, Sowa H, Chen Q, Chihara K.
Plasma lipids and osteoporosis in postmenopausal women. Endocr J
2002;49:211-7.
48. Cui LH, Shin MH, Chung EK, Lee YH, Kweon SS, Park KS, Choi JS.
Association between bone mineral densities and serum lipid profiles of pre- and
post-menopausal rural women in South Korea. Osteoporos Int 2005;16:1975-81.
49. Orozco P. Atherogenic lipid profile and elevated lipoprotein (a) are associated
with lower bone mineral density in early postmenopausal overweight women.
Eur J Epidemiol 2004;19:1105-12.
50. Serre CM, Farlay D, Delmas PD, Chenu C. Evidence for a dense and intimate
innervation of the bone tissue, including glutamate-containing fibers. Bone
1999;25:623-9.
51. Skerry TM, Genever PG. Glutamate signalling in non-neuronal tissues. Trends
Pharmacol Sci 2001;22:174-81.
52. Chenu C, Serre CM, Raynal C, Burt-Pichat B, Delmas PD. Glutamate receptors
are expressed by bone cells and are involved in bone resorption. Bone
1998;22:295-9.
53. Behl C, Skutella T, Lezoualc'h F, Post A, Widmann M, Newton CJ, Holsboer F.
Neuroprotection against oxidative stress by estrogens: structure-activity
29
relationship. Mol Pharmacol 1997;51:535-41.
54. Singer CA, Figueroa-Masot XA, Batchelor RH, Dorsa DM. The
mitogen-activated protein kinase pathway mediates estrogen neuroprotection
after glutamate toxicity in primary cortical neurons. J Neurosci
1999;19:2455-63.
55. Zhu X, Liu X, He P, Cao B, Lv Y, Zhang W, Ni X. Metabolomics in serum of
ovariectomised rats and those exposed to 17beta-oestradiol and genistein.
Gynecol Endocrinol 2010;26:760-7.
56. Ma B, Zhang Q, Wang GJ, A JY, Wu D, Liu Y, Cao B, Liu LS, Hu YY, Wang YL,
Zheng YY. GC-TOF/MS-based metabolomic profiling of estrogen
deficiency-induced obesity in ovariectomized rats. Acta Pharmacol Sin
2011;32:270-8.
57. Rapuri PB, Kinyamu HK, Gallagher JC, Haynatzka V. Seasonal changes in
calciotropic hormones, bone markers, and bone mineral density in elderly
women. J Clin Endocrinol Metab 2002;87:2024-32.
58. Frankenfeld CL, McTiernan A, Thomas WK, LaCroix K, McVarish L, Holt VL,
Schwartz SM, Lampe JW. Postmenopausal bone mineral density in relation to
soy isoflavone-metabolizing phenotypes. Maturitas 2006;53:315-24.
30
Figure 1. Flowchart of participant recruitment Participants for statistical
analyses (610)
Lack of blood sample (45) or NMR data (30)
or NMR (30)
Lack of BMD data at spine (51)
Take steroid (3) or have hormone replacement therapy (34)
Women aged 40-55 (773)
31
s o.138
Figure 2. The tertiles of bone mineral density
T1: BMD < 1.138 g/cm2; T2: 1.138 g/cm2 ≤ BMD <1.258 g/cm2; T3: BMD ≥ 1.258 g/cm2.
1.138 1.258
0.6 0.7 0.8 0.9 1.0 1.1 1.2 1.3 1.4 1.5 1.6 1.7 1.8
0 5 10 15 20 25 30
Percent
Bone mineral density
Bone Mineral Density (g/cm2)
32
Figure 3. PCA score plots from the analysis of CPMG NMR spectra using women plasma samples
(a) High BMD group: n=399; low BMD group: n=211
(b) Premenopausal women. High BMD group: n=349; low BMD group: n=134 (c) Postmenopausal women. High BMD group: n=45; low BMD group: n=77
High BMD indicates the 2nd and 3rd tertiles of BMD; low BMD indicates the 1st tertile of BMD.
Abbreviations: PCA, principle components analysis; CPMG, Carr-Purcell-Meiboom-Gill;
BMD, bone mineral density.
33
Figure 4. PLS-DA score plots from the analysis of CPMG NMR spectra using women plasma samples
(a) High BMD group: n=399; low BMD group: n=211
(b) Premenopausal women. High BMD group: n=349; low BMD group: n=134 (c) Postmenopausal women. High BMD group: n=45; low BMD group: n=77
High BMD indicates the 2nd and 3rd tertiles of BMD; low BMD indicates the 1st tertile of BMD.
Abbreviations: PCA, principle components analysis; CPMG, Carr-Purcell-Meiboom-Gill;
BMD, bone mineral density.
34
Figure 5. Receiver operating characteristic curves of comparing models for classification of high and low BMD
(a) All participants. Model 1: AUC= 0.59 (95% CI=0.55-0.64), Model 2: AUC=0.60 (95%
CI=0.55-0.65). Glutamine alone: AUC=0.54 (95% CI=0.50-0.59).
(b) Premenopausal women. Model 1: AUC=0.57 (95% CI= 0.52-0.63), Model 2: AUC=0.60 (95% CI=0.55-0.66). Glutamine alone: AUC=0.53 (95% CI: 0.48-0.58).
(c) Postmenopausal women. Model 1: AUC=0.69 (95% CI: 0.67-0.72), Model 2: AUC=0.70 (95% CI: 0.67-0.73). Glutamine alone: AUC=0.65 (95% CI: 0.63-0.68).
Model 1: lactate, acetone, lipid, VLDL, and glutamine.
Model 2: Model 1 plus acetate and glucose.
High BMD indicates the 2nd and 3rd tertiles of BMD; low BMD indicates the 1st tertile of BMD.
Abbreviations: AUC, area under the curve; BMD, bone mineral density; CI, confidence interval;
VLDL, very low density lipoprotein.
35
Figure 6. Acetone distribution by fasting glucose level
(High:glucose> 100 mg/dL; Low: glucose ≤ 100 mg/dL)
≤
≤
36
Figure 7. Postulated mechanism relates important metabolites with bone
mineral density among postmenopausal women
Acetone is referred to ketone bodies which may be generated during diabetic ketosis36, and then promote to release hormonal factors that suppresses estrogen deficiency and the subsequent bone loss.37-41 Lactate may against bone loss via regulating collagen biosynthesis during osteogenesis.34 Lipid and very low density lipoprotein as well as lipid profiles can be reflected by leptin level which is related to differentiation of stromal cells to osteoblasts and thus prevent further loss of bone mass.42-44 Bone resorption may occur when glutamine interconverts to excess amount of glutamate and then cause bone loss as the composition of osteoclast expresses glutamate receptors.5237
Table 1. Characteristics of the study population
Variables BMD
High (n=399)
Low (n=211)
P*
Mean (S.E.)
Age (year) 45.4 (0.19) 47.6 (0.34) <0.0001
Body weight (kg) 57.0 (0.45) 53.1 (0.52) <0.0001
Body mass index (kg/m2) 22.7 (0.16) 21.5 (0.20) <0.0001 Waist circumference (cm) 73.6 (0.35) 71.6 (0.44) 0.0008 Diastolic blood pressure (mmHg) 64.9 (0.51) 63.7 (0.64) 0.13
Fasting glucose (mg/dL) 101.4 (1.16) 97.2 (0.61) 0.01
Triglycerides (mg/dL) 94.1 (2.70) 87.3 (3.10) 0.10
High-density lipoprotein cholesterol (mg/dL)
69.8 (0.77) 72.7 (1.25) 0.05
Total cholesterol (mg/dL) 198.4 (1.66) 202.7 (2.27) 0.13 Alkaline phosphatase (IU) 60.2 (0.84) 67.3 (1.20) <0.0001
Creatinine (mg/dL) 0.80 (0.005) 0.78 (0.006) 0.03
n (%)
Menopause 45 (11.4) 77 (36.5) <0.0001
Hypertension 72 (18.1) 30 (14.2) 0.23
Ever smoker 40 (10.4) 16 (8.0) 0.34
Alcohol consumption 15 (4.0) 14 (7.3) 0.09
Calcium supplement 213 (53.9) 120 (56.9) 0.49
Regular exercise ( ≥2 times/week) 168 (45.7) 91 (49.2) 0.43
Abbreviation: BMD, bone mineral density.
*P-values were obtained from Student’s t tests (normally distributed continuous variables) and Chi-square tests (categorical variables) by comparing participants with high and low BMD.
Number in bold indicates statistically significant finding.
38
Table 2. The PLS-DA parameters and permutation test for differentiating high and low BMD levels
Comparison Groups
PLS-DA parameters Ppermutation testc
No.b R2 Q2†
High BMD-Low BMDa 2 0.03 -0.002 0.07
Premenopause
High BMD-Low BMD 1 0.01 -0.02 0.76
Postmenopause
High BMD-Low BMD 1 0.12 0.04 0.03
Abbreviations: PLS-DA, partial least squares-discriminant analysis; BMD, bone mineral density.
a High BMD indicates the 2nd and 3rd tertiles of BMD; low BMD indicates the 1st tertile of BMD.
b The number of components based on Q2 indicates the best classifier of PLS-DA using 10-fold cross-validation method.
c Distribute 1000 permutations.
†Predictive capability.
Number in bold indicates statistically significant finding.
39
Table 3. The change of plasma metabolites in postmenopausal women to distinguish high and low BMD
Metabolites Multiplicitya Signal assignmentb δH (ppm)
VIPc High BMDd Low
BMDc Pathways*
Lactate d CH3 1.33 1.74-3.31 ↑ ↓ Glycolysis/Gluconeogenesis
Acetone s CH3 2.22 1.84-3.16 ↑ ↓ Synthesis and degradation of
ketone bodies
Acetate s CH3 1.91 1.56-1.82 ↓ ↑ Pyruvate metabolism
Lipid m CH3CH2CH2, (CH2)n
CH3CH2(CH2)n,
1.20-1.26 2.59 ↑ ↓
Fatty acid metabolism
VLDL m CH2CH2CO 1.53-1.6 1.63-2.49 ↑ ↓
Glucose ddd Histone H2, H3, H4, H5 3.37-3.57 2.75 ↑ ↓ Carbohydrate metabolism
Glutamine m half γ-CH2 2.42-2.48 1.55-2.09 ↓ ↑ D-Glutamine and D-glutamate
metabolism Abbreviations: BMD, bone mineral density; VLDL, very low density lipoprotein; δH, chemical shift; ppm, parts per million.
a s,singlet; d, doublet; t, triplet; m, complex multiplet; ddd, doublet of doublets of doublets.
b Signal assignment provides precise bioanalytical and dynamic information.
c All metabolites with variable importance in projection (VIP) score >1.5.
d High BMD indicates the 2nd and 3rd tertiles of BMD; low BMD indicates the 1st tertile of BMD.
*Pathway information was obtained from KEGG PATHWAY Database (http://www.genome.jp/kegg/).
40
Table 4. Association between plasma metabolites and bone mineral density (T1 vs. T2 + T3)
Abbreviations: AOR, adjusted odds ratio; BMD, bone mineral density; VLDL, very low density lipoprotein; CI, confidence intervals.
a All metabolites with variable importance in projection (VIP) score >1.5.
b High BMD indicates the 2nd and 3rd tertiles of BMD; low BMD indicates the 1st tertile of BMD.
c All models were adjusted for age (continuous), body weight (continuous), height (continuous), waist circumference (continuous), menopausal status (yes/no), creatinine (> median, 79 mg/dL, yes/no), regular exercise (≥2 times/week, yes/no), serum alkaline phosphatase (≥ median, 60 IU, yes/no).
Number in bold indicates statistically significant finding.
Metabolitesa
High BMDb (n=399)
Low BMDb (n=211)
OR OR (95% CI) P value AOR(95%CI)c P value
Lactate 1.00 0.92 (0.81-1.04) 0.16 0.90 (0.76-1.05) 0.18
Acetone 1.00 0.90 (0.79-1.02) 0.09 0.87 (0.74-1.03) 0.11
Acetate 1.00 1.40 (0.97-2.03) 0.07 1.32 (0.83-2.10) 0.24
Lipid 1.00 1.08 (0.44-2.66) 0.87 0.72 (0.24-2.18) 0.56
VLDL 1.00 0.88 (0.75-1.04) 0.13 0.85 (0.69-1.04) 0.11
Glutamine 1.00 1.47 (1.07-2.03) 0.02 1.55 (1.03-2.33) 0.04
Glucose 1.00 0.96 (0.91-1.02) 0.18 0.99 (0.93-1.06) 0.83
41
Table 5. Association between plasma metabolites and bone mineral density stratified by menopausal status (T1 vs. T2+T3)
Abbreviations: AOR, adjusted odds ratio; BMD, bone mineral density; VLDL, very low density lipoprotein; CI, confidence intervals.
a All metabolites with variable importance in projection (VIP) score >1.5.
b High BMD indicates the 2nd and 3rd tertiles of BMD; low BMD indicates the 1st tertile of BMD.
c All models were adjusted for age (continuous), body weight (continuous), height (continuous), waist circumference (continuous), menopausal status (yes/no), creatinine (> median, 79 mg/dL, yes/no), regular exercise ≥2 times/week (yes/no), serum alkaline phosphatase (≥ median, 60 UI, yes/no).
Number in bold indicates statistically significant finding.
Metabolitesa
Premenopause Postmenopause p interaction
Low BMD/High BMDb (134/349)
Low BMD/ High BMD (77/45)
OR (95% CI) AOR(95%CI)b OR (95% CI) AOR(95%CI)b
Lactate 0.96 (0.83-1.11) 1.01 (0.85-1.21) 0.65 (0.49-0.86) 0.55 (0.33-0.92) 0.004 Acetone 0.90 (0.77-1.06) 0.97 (0.81-1.17) 0.64 (0.48-0.86) 0.51 (0.31-0.85) 0.01 Acetate 1.13 (0.72-1.75) 1.01 (0.60-1.68) 4.02 (1.67-9.67) 3.31 (0.83-13.19) 0.02 Lipid 0.97 (0.33-2.89) 1.32 (0.38-4.56) 0.12 (0.02-0.98) 0.04 (0.001-0.91) 0.04 VLDL 0.89 (0.73-1.08) 0.95 (0.76-1.18) 0.62 (0.43-0.88) 0.49 (0.27-0.90) 0.02 Glutamine 1.32 (0.90-1.95) 1.24 (0.78-1.96) 2.88 (1.45-5.72) 6.04 (1.57-23.21) 0.04 Glucose 0.96 (0.90-1.03) 0.97 (0.90-1.04) 0.95 (0.85-1.06) 1.14 (0.92-1.40) 0.38
42
Table 6. Receiver operating characteristic contrast tests of pairwise comparison between different models to classify high and low BMD
a Model 1 included lactate, acetone, lipid, VLDL, and glutamine; model 2 included variables in model 1 plus acetate and glucose.
*P-values were obtained from Chi-square tests.
Number in bold indicates statistically significant finding.
Contrast models All participants Premenopause Postmenopause P value*
Model 2 vs. Mode 1a 0.38 0.16 0.74
Glutamine alone vs. Model 1 0.05 0.12 0.03
Glutamine alone vs. Model 2 0.03 0.02 0.01
43
Table 7. Model comparisons for the association between plasma metabolites and bone mineral density (T1 vs. T2+T3)
Lactate Acetone Acetate Lipid VLDL Glutamine Glucose
Low BMDa (399) / High BMDa (211) AOR (95% CI)
Model 1b 0.92 (0.81-1.04) 0.90 (0.79-1.02) 0.42 (0.97-1.03) 1.08 (0.44-2.66) 0.88 (0.75-1.04) 1.47 (1.07-2.03) 0.96 (0.91-1.02) Model 2c 0.86 (0.76-0.99) 0.82 (0.71-0.95) 1.55 (1.05-2.30) 0.56 (0.21-1.48) 0.80 (0.67-0.95) 1.67 (1.19-2.35) 0.96 (0.91-1.02) Model 3d 0.99 (0.86-1.15) 0.95 (0.82-1.10) 1.07 (0.70-1.63) 1.04 (0.37-2.90) 0.93 (0.77-1.11) 1.22 (0.84-1.76) 0.99 (0.93-1.06) Model 4e 0.94 (0.80-1.09) 0.92 (0.78-1.08) 1.17 (0.74-1.83) 0.85 (0.29-2.51) 0.89 (0.74-1.09) 1.40 (0.94-2.09) 1.00 (0.93-1.07) Model 5f 0.90 (0.76-1.05) 0.87 (0.74-1.03) 1.32 (0.82-2.10) 0.72 (0.24-2.12) 0.85 (0.69-1.04) 1.55 (1.03-2.33) 0.99 (0.93-1.06) Abbreviations: AOR, adjusted odds ratio; BMD, bone mineral density; VLDL, very low density lipoprotein; CI, confidence intervals.
a High BMD indicates the 2nd and 3rd tertiles of BMD; low BMD indicates the 1st tertile of BMD.
b Model 1: Unadjusted model.
c Model 2: Adjusted for age (continuous), menopausal status (yes/no).
d Model 3: Adjusted variables in model 2 plus body weight (continuous) and height (continuous)
e Model 4: Adjusted variables in model 3 plus serum alkaline phosphatase (≥ median, 60 IU, yes/no) and regular exercise (≥2 times/week, yes/no)
f Model 5: Adjusted variables in model 4 plus waist circumference (continuous) and creatinine (> median, 79 mg/dL, yes/no).