零售商價格促銷下影響快速流通商品品牌替代性與互補性商品購買之研究
56
0
0
全文
(2) !. થᆊॾܳዚ˭ᇆᜩԣి߹఼થݡݡൕആّᄃّ̢ྃ થݡᔉ෴̝ࡁտ!. The Effect of Retailer Price Promotion on FMCG Brand Substitution and Use Complementary Purchase. 研 究 生:王郁玫. Student:Yu-Mei, Wang. 指導教授:唐瓔璋. Advisor:Dr. Edwin Tang. 國 立 交 通 大 學 經 營 管 理 研 究 所 碩 士 論 文. A Thesis Submitted to Institute of Business and Management College of Management National Chiao Tung University in Partial Fulfillment of the Requirements for the Degree of Master of. Business Administration. June 2006 Taipei, Taiwan, Republic of China. 中華民國九十五年六月.
(3) 零售商價格促銷下影響快速流通商品品牌替代性與 互補性商品購買之研究 研究生:王郁玫. 指導教授:唐瓔璋. 國立交通大學經營管理研究所碩士班. 摘. 要. 以前的文獻研究零售商價格促銷大多限制在食品類別,而且對於消費者價格敏感 度高低對品牌替代性以及互補性商品購買結果並無探討。本研究延伸研究產品類別屬快 速流通商品的牙刷以及牙膏,更重要的是,研究對於不同價格敏感度的消費者,對於價 格促銷在購買互補性商品以及品牌替代性的研究,希望能彌補以往研究的不足,以及未 來零售商價格促銷時可以針對不同消費族群作適當的策略制訂。 研究資料來源為 Dominick’s Database,包含美國芝加哥地區 85 家商店、29 個產品 類別的商品掃瞄資料。因為資料庫太過龐大,以及符合研究主題考量,本研究選取其中 的牙刷牙膏類別作分析,並篩選出 277~328 週(為期一年)的資料,依價格高低以及品 類分別作出 12 條複迴歸式。研究結果發現價格促銷對於高價牙刷牙膏,在互補性商品 購買以及品牌替代性並無太大影響,但是價格促銷對於低價牙刷牙膏卻是提高銷售額很 有用的工具。 成功的零售商價格促銷決定於某些因素,就像促銷品項的利潤(或虧損)、顧客 轉換購買促銷品項,以及非促銷品項的銷售額增加。如果零售商能運用掃描資料以及雇 用專業行銷人員,使用科學方法制定行銷策略及規劃來因應環境變遷及消費者特性,這 對於零售商追求利潤成長以及目標市場增加是有幫助的。. 關鍵字:互補,替代,價格促銷,價格敏感度。. i.
(4) The Effect of Retailer Price Promotion on FMCG Brand Substitution and Use Complementary Purchase Student:Yu-Mei, Wang. Advisors:Dr. Edwin, Tang. Institute of Business and Management National Chiao Tung University ABSTRACT The past studies are limited in foods and do not prove whether price sensitive buyers purchase complementary or not. We will extend the study of promotional effects to FMCG category and, more importantly, to be empirical work on different price level of substitution and complementary products to advance promotional and merchandising practice. The data is collected by Dominick’s Database, which contains canner data of 85 stores, 29 categories in the US. Because the database is so huge and based on the topic which is about brand substitution and complementary, we only choose toothbrush and tooth paste for our sample in this study from 277 to 328 week. Our finding shows that price promotion appears to be an effective tool for brand substitute and full-margin complementary purchase of low unit price but do not useful for brand substitution of high unit price. There are a few possible of high price brand in tooth brush category may have complementary purchase. Most retailers do not consider the effect of promotion on sales of non promoted product. As a consequence, retailers may draw misleading conclusions about promotional effectiveness. The success of retail price promotions depends on such factors as the ability of the promoted items to draw customers to the store, the profit (or loss) on the promoted item, the cannibalization that occurs when consumers switch away from regular-priced items to promoted items, and the boost in sales volumes of non-promoted items. If retailers can use scanner data and have professional marketing employee to suit consumer characteristics and environment changes with scientific method to make a market strategy and planning, it is expected to meet strong sales and growth targets, achieved through strategies for retailers.. Key words: price promotion, substitution, complementary. ii.
(5) 誌 謝 感謝我的家人,在求學期間給我所有的支持,不論是精神或物質上,讓我能專心做研究。 感謝我的指導教授唐瓔璋老師,在碩士班兩年的指導以及照顧,實在是獲益良多。 感謝交大經管所的同學們,珮芳、孟婷、毓婷等等、唐門的大家:家瑜、玉萱、宜婷、 彥汝、聖耀、博班慧玲學姐、在職專班的啟文學長、畢業的思凱學長、志成學長,這兩 年的相處也多虧有你們,讓枯燥的研究生活充實很多。 感謝交大其他系所的同學,在這篇論文進行時能順利進行。 感謝智祥的支持,不論是過程中的苦悶以及抱怨還有督促,才能讓我順利在兩年畢業。 謝謝其他尚未列名的同學、朋友,謝謝你們。. iii.
(6) Contents List of tables…………………………………………………v List of figures………………………………………………..vi I. Introduction…………………..……………..………......1 II. Literature review……………………………………….4 III.. Method. A. Data……………………………………….................11 B. Modeling procedure…………………………………14 C. Hypotheses.………………………………………….20 IV.. Results………………………………………………22. V. Conclusion………………….…………………………..28 Reference……..……………………………………………31 Appendix A…………..…………..………………………...33 Appendix B…………..…………..………………………...35 Appendix C…………..…………..………………………...39 Appendix D…………..…………..………………………...44 Appendix E…………..…………..………………………...45 iv.
(7) List of tables Table 1. Summary of empirical research on price promotion effects………….10 Table 2. Summary for each category in Dominick’s database………………....11 Table 3. High unit price brand of tooth brush……………………………….....12 Table 4. High unit price brand of tooth paste………………………………….12 Table 5. Low unit price brand of tooth brush………………………………….13 Table 6. Low unit price brand of tooth paste……………………………….….13 Table 7. Summary the method and sample of substitute and complement literature……………………………………………………………….15 Table 8. A brief summary of the literature estimating price elasticity……...….19 Table 9. Un-standarized regression coefficients pertaining to brand substitution and complementary effects: high price brand…..………………….....22 Table 10. cross elasticity: high price brand…..…………………………..……22 Table 11. Correlation matrix: high price brand……………………….………23 Table 12. Un-standarized regression coefficients pertaining to brand substitution and complementary effects: low price brand…….…………………...23 Table 13. cross elasticity: low price brand……………………….……………24 Table 14. Correlation matrix: low price brand…………………………….…..24. v.
(8) List of figures Figure 1. Flow chart………………………………………………………..3. vi.
(9) I. Introduction FMCGs, common abbreviation for “Fast moving consumer goods”, are products that have a quick shelf, at relatively low cost and do not require a lot of thought, time and financial investment to purchase. Fast Moving Consumer Goods is also a classification that refers to wide range of frequently purchased consumer products including: safety matches, food items, bathing soaps, cosmetics, teeth cleaning products, hand-wash detergent powder, tinned food, food paste, towels, table salt, edible oil, tomato paste, monosodium glutamate, food seasonings, butter, margarine, breakfast beverages. Three of the largest and best known examples of Fast Moving Consumer Goods companies are Nestlé, Unilever and Procter & Gamble. Examples of FMCG brands are Coca-Cola, Kleenex, Pepsi and Mars. According to the study of Ministry of Economic Affairs (MOEA) and Institute for Information Industry, the FMCG sale is approximately 20,000million US dollars every year. In the retailer grocery industry, category management is the process of managing category of products for greater profitability and customer value. The concept of efficient store assortments addresses the critical interface between distributors and consumers, and attempts to improve sales, shelf-space utilization and customer value. It is based on category management, ie managing categories (groups of closely related complementary products) for greater profitability and customer value, rather than managing individual brands or the vendor’s gross margin by purchase (Gruen and Shah, 2000). This process consists of category definition, establishing product hierarchies (taxonomies); category execution, applying strategies for assorting, pricing and promotion products; and category performance measurement. Category management is a data-driven process and, as a result, can benefit from point-of-sale (POS) scanner data. (Peter et al. 2004) The recent availability of scanner data to retail chains has resulted in a shift in power from manufacturers to retailers (Kumar & Leone, 1988). Research on UPC scanner data has been actively pursued by marketing academics since the mid-1980s and many papers have been published in the major marketing journals since then. One reason is that scanner data is easy to acquire and can give practitioners better tools for understanding their markets (e.g., approaches to analyze consumer response and market segmentation) and for making marketing mix decisions (e.g., setting prices and determining promotion spending). 1.
(10) Several academic studies address particular aspects of category management, including partner relationships for category management and category performance (Gruen and Shah, 2000); key determinants (eg assortment breadth) of effective category management (Dhar et al. 2001); and profitability of category management under an everyday low price (EDLP) strategy (Hoch et al. 2001). But little is known about the breadth and depth of brand substitution and complementary across product categories (Walter, 1991). The study will focus on the breadth and depth of retail price promotions on FMCG brand substitution and use complementary purchase using scanner data. For instance, when buying toothbrushes which are on price promotion, we will also consider if a tooth paste is needed. Shampoo and bath soap is another example. It is because one who is used to soap will not use bath soap to take a bath and the other more complex factors that we will not consider product substitution. The present study which is different from the past stands on product pricing and investigates the effect of retailer price promotion on FMCG brand substitution and use complementary. It is expected to meet strong sales and growth targets, achieved through strategies for retailers. The study is organized as follows. First, we briefly introduce the background that included what FMCG is, research motive and objective. The next section presents the theoretical and summary of empirical research on price promotion effects. The research method—data estimate procedure and methodological aspects of price promotion in substitution and complementary purchase—is in the third section, followed by the research hypotheses. The forth section presents the results of this study that is the most important section. The final section is a discussion of the results, an analysis of the study’s limitations, and suggestions for directions of future research.. 2.
(11) Research motive and objective. Literature review. Hypotheses. Data calibration and analysis. Results. Conclusion. FIGURE 1 Flow chart. 3.
(12) II. Literature review A. Buying behavior Consumer decision making varies with the type of buying decision. The decision to buy toothpaste, a tennis racket, a personal computer, and a new car are all very different. Blackwell, Miniard, and Engel (2001) mention that individual characteristics and purchase characteristics are the evaluative criteria in purchase decision process. These determinants of purchase characteristics are type of product, timing variables, price/quality, and situation. And there are many events showing consumer’s involvement is not high among frequently purchasing product. In this study, FMCGs are products that have a quick shelf, at relatively low cost, and do not require a lot of thought, time and financial investment to purchase. FMCG also refers to wide range of frequently purchased consumer products. Generally speaking, customers are most price-sensitive to products that cost a lot or are bought frequently. They are less price-sensitive to low-cost items or items they buy infrequently. They are also less price-sensitive when price is only a small part of the total cost of obtaining, operating, and servicing the product over its lifetime. Companies, of course, prefer to work with customers who are less price-sensitive. Tom Nagle offers a list of factors associated with lower price sensitivity, for instance, buyers are less aware of substitutes and the product is assumed to have more quality, prestige, or exclusiveness. We assume that price/quality is the important purchase variable among FMCG in this study. We group buyers into price sensitivity, low price sensitivity and others. In this study, we are interesting in price sensitivity and low price sensitive buyers. For price sensitive buyers, the price is only what they care. For example, they would like to buy the cheapest product or pay a lot of attention to what is on promoted. They scrimp on purchasing. But for low price sensitive buyers, they are loyalty to specific brand or pay attention to high quality products that always associate with high price. However, the past studies do not take notice of product pricing. Companies need to understand the price sensitivity of their customers and prospect and the trade-offs people are willing to make between price and product characteristics. As we know, the complementary purchase of technical products is common. For example, while buying a digital camera, we will purchase a memory card which is use complementary as well. Also, the past studies are also limited in foods (eg. spaghetti and 4.
(13) spaghetti sauce) and do not prove whether price sensitive buyers purchase complementary or not. We will extend the study of promotional effects to FMCG category and, more importantly, to be empirical work on different price level of substitution and complementary products to advance promotional and merchandising practice. In this article, we did not use questionnaire but scanner data. The reasons is that scanner data is easy to acquire, can give practitioners better tools for understanding their markets, and purchase intension is still different from purchase behavior which accords with actual situation.. 5.
(14) B. Price promotion The retail price promotions affect sales of non-promoted products and competitor performance is critical to retailers as they attempt to increase the effectiveness of promotion and improve their competitive position in the marketplace (Progressive Grocer 1989). Kumar & Leone (1988) mention for manufacturers and retailers, they all expect to increase their sales. The manufacturer’s primary objective in promoting a brand is to increase sales. In contrast, the retailer’s primary objective is to maximize store profit. A retailer’s promotional strategy could affect sales by causing category switching, increased consumption, stockpiling, brand substation, and/or store substitution. Retail promotion enables both retailer and manufacturer to meet objectives when brand substitution occurs within the store and customers from other stores switch, or cross-shop, to take advantage of the promotion. Gupta’s (1988) finding that the increasing sales on the promotion period are resulted from brand switching, purchase time acceleration and stockpiling. The important of brand choice is that brand switching accounts for 84% of the overall sales increase due to promotions in the coffee category. Bell et al.(1999) work on Gupta’s study and generalize two effects that are secondary demand effect( brand switching effect) and primary demand expansion. Their finding is also support that secondary demand effect accounts for 75% of the overall sales increase due to promotions. The success of retail price promotions depends on such factors as the ability of the promoted items to draw customers to the store, the profit (or loss) on the promoted item, the cannibalization that occurs when consumers switch away from regular-priced items to promoted items, and the boost in sales volumes of non-promoted items.. 6.
(15) C. Brand substitute Treating brands within a product category as substitutes is also consistent with the economic definition of substitutes proposed by Henderson and Quandt (1958): “…two commodities are substitutes if both can satisfy the same need.” From economist perspective, the relationship between substitution and complementary is about the change of relative price. Classic examples of substitute goods include margarine and butter, or petroleum and natural gas (used for heating or electricity). The fact that one good is substitutable for another has immediate economic consequences: insofar as one good can be substituted for another, the demand for the two kinds of good will be bound together by the fact that customers can trade off one good for the other if it becomes advantageous to do so. Thus, an increase in price for one kind of good (ceteris paribus) will result in an increase in demand for its substitute goods, and a decrease in price (ceteris paribus, again) will result in a decrease in demand for its substitutes. Thus, economists can predict that a spike in the cost of wood will likely mean increased business for bricklayers, or that falling cellular phone rates will mean a fall-off in business for public pay phones. In other words, good substitution is an economic concept where two goods are of comparable value. Car brands are an example. While someone could argue that Ford trucks are much different from Toyota trucks, If the price of Ford trucks goes up enough, some people will buy Toyota trucks instead. In brand substitution area of researches, it is starting with Frank and Massy’s (1967) work. And Moriarty (1985) examined the brand substitution effects of retail promotions and found some evidence that promotions enhance substitution. Kumar and Leone (1988) use store-level scanner data and investigate the effect of retail store price promotion, featuring, and displays on sales of brands of disposable diapers within a city. Featuring refers to the retailer advertising the brand at a specific price in a weekly store circular. Displayed refers to the retailer providing a specific in-store presentation of the product, either through in-aisle or end-of-aisle displays. Price-cut refers to the retailer reducing the price of the product in comparison to its regular everyday price. Within a store, 7.
(16) price promotion produced the largest amount of brand substitution, followed by featuring and displays. They all indicate that price promotion is positively associated with one brand’s sales. But little empirical research has been done on complementary effects of promotions. Walters (1991) indicates the presence of substitution effects within a product category and supports conventional wisdom (Davidson, Sweeney, and Stampfl). His study showing that substitution effects are asymmetrical and the brands with high market shares often gain sales at the expense of their low share competitors.. 8.
(17) D. Complement Balderson (1956) describes two types of complementary relationship. Products are use complements if they are consumed together; products are purchase complements if they are purchased together. From a retail perspective, the purchase complementary of all items included in a consumer’s shopping basket. Product complements are products that are used in conjunction with one another to satisfy some particular need (Henderson and Quandt 1958). Complement or complementary good is defined in economics as a good that should be consumed with another good; its cross elasticity of demand is negative. This means that, if goods A and B were complements, more of good A being bought would result in more of good B also being bought. An example of complement goods is hamburgers and hamburger buns. If the price of hamburgers falls, more hamburger buns would be sold because the two are usually used together. In marketing, complementary goods give additional market power to the company. It allows vendor lock-in as it increases the switching cost. A few types of pricing strategy exist for complementary good and its base good: Pricing the base good at a relatively low price to the complementary good - this approach allows easy entry by consumers (e.g. consumer printer vs ink jet cartridge). Pricing the base good at a relatively high price to the complementary good - this approach creates a barrier to entry and exit (e.g. golf club membership vs green fees) A basic notion in retailing is that promotions also affect consumer purchasing patterns by stimulating purchases of non-promoted complements to the promoted products (Berman and Evans 1989; Walters 1988). Promotions also can cause consumers to substitute a reduced-margin brand for a full-margin brand. Complementary effects created by promotions are of special interest to retailers because significant increase in sales of full-margin complementary products can offset decreases in sales of full-margin substitute brands (Walters 1991). McAlister and Totten (1985) indicates that the level of interaction often is substantial and the promoted brand can influence significantly both competitive brands (decrease their sales) and complementary products (increase their sales). Mulhern (1989) and Walters (1991) also show the promotion of one product can stimulate sales of complement. 9.
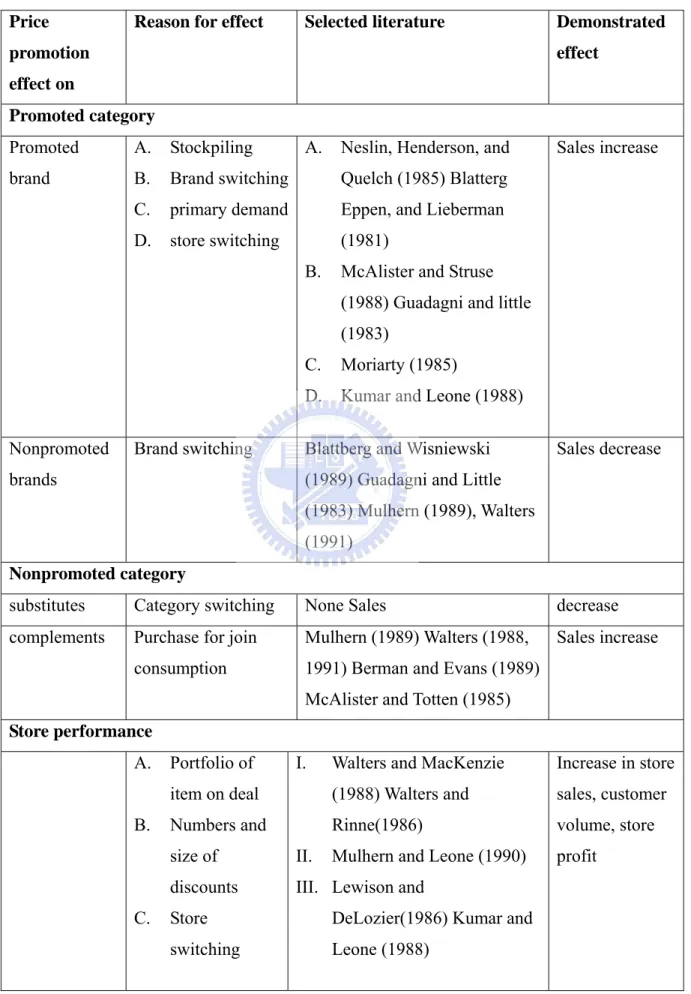
(18) TABLE 1 Summary of Empirical Research on Price Promotion Effects Price. Reason for effect. Selected literature. promotion. Demonstrated effect. effect on Promoted category Promoted. A.. Stockpiling. brand. B.. Brand switching. Quelch (1985) Blatterg. C.. primary demand. Eppen, and Lieberman. D.. store switching. (1981). A.. B.. Neslin, Henderson, and. Sales increase. McAlister and Struse (1988) Guadagni and little (1983). Nonpromoted. Brand switching. brands. C.. Moriarty (1985). D.. Kumar and Leone (1988). Blattberg and Wisniewski. Sales decrease. (1989) Guadagni and Little (1983) Mulhern (1989), Walters (1991). Nonpromoted category substitutes. Category switching. None Sales. decrease. complements. Purchase for join. Mulhern (1989) Walters (1988,. Sales increase. consumption. 1991) Berman and Evans (1989) McAlister and Totten (1985). Store performance A. B.. C.. Portfolio of. I.. Walters and MacKenzie. Increase in store. item on deal. (1988) Walters and. sales, customer. Numbers and. Rinne(1986). volume, store. Mulhern and Leone (1990). profit. size of. II.. discounts. III. Lewison and. Store. DeLozier(1986) Kumar and. switching. Leone (1988). 10.
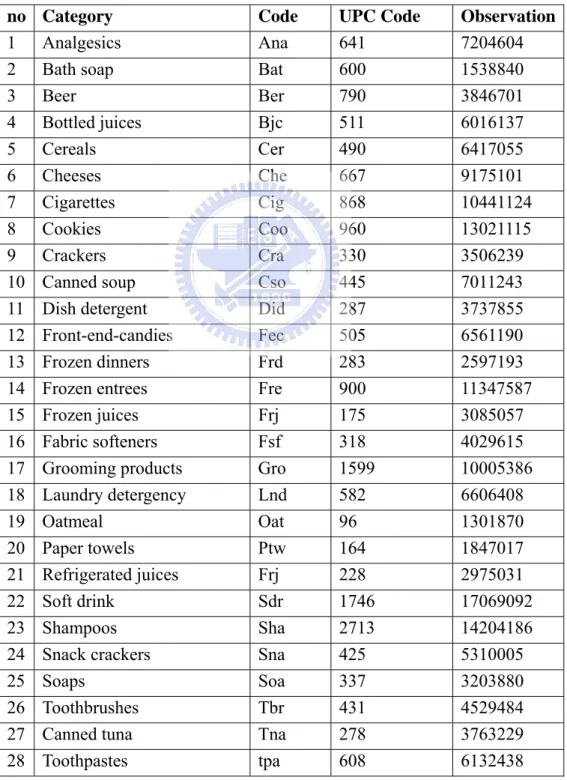
(19) III. Method A. Data The data is collected by Dominick’s Database, which contains canner data of 85 stores, 29 categories in the US. The Dominick's database covers store-level scanner data collected at Dominick's Finer Foods over a period of more than seven years. TABLE 2 summary for each category in Dominick’s database no 1 2 3 4 5 6 7 8 9 10 11 12 13 14 15 16 17 18 19 20 21 22 23 24 25 26 27 28. Category Analgesics Bath soap Beer Bottled juices Cereals Cheeses Cigarettes Cookies Crackers Canned soup Dish detergent Front-end-candies Frozen dinners Frozen entrees Frozen juices Fabric softeners Grooming products Laundry detergency Oatmeal Paper towels Refrigerated juices Soft drink Shampoos Snack crackers Soaps Toothbrushes Canned tuna Toothpastes. Code Ana Bat Ber Bjc Cer Che Cig Coo Cra Cso Did Fec Frd Fre Frj Fsf Gro Lnd Oat Ptw Frj Sdr Sha Sna Soa Tbr Tna tpa 11. UPC Code 641 600 790 511 490 667 868 960 330 445 287 505 283 900 175 318 1599 582 96 164 228 1746 2713 425 337 431 278 608. Observation 7204604 1538840 3846701 6016137 6417055 9175101 10441124 13021115 3506239 7011243 3737855 6561190 2597193 11347587 3085057 4029615 10005386 6606408 1301870 1847017 2975031 17069092 14204186 5310005 3203880 4529484 3763229 6132438.
(20) 29 Bathroom tissues. tti. 128. 1571901. Because the database is so huge and based on the topic which is about brand substitution and complementary, we only choose toothbrush and tooth paste for our sample in this study. The reason is sales of toothbrush and tooth paste will not change a lot by season. And for many categories, the identification of product complements is difficult. Toothbrush and tooth paste are simple and suitable in this study. Although the data in Dominick’s Database covered a period of 399 weeks, we only selected 52 weeks to investigate the two categories. First, we calculate total sales of each brand from 277 to 328 week (we show the calendar in appendix A). Second, we calculate unit price of each brand. In this study, the prices of toothpaste are per ounce and the prices of toothbrush are one unit. Third, we choose the high unit price with high market share in the categories and the low unit price is in the same process. Table 3 and Table 4 show the three toothbrush and toothpaste brands with high unit price. Table 5 and Table 6 show the three toothbrush and toothpaste brands with low unit price. The information of stores was included in our study (appendix D & E).. TABLE 3 the high unit price brand of toothbrush UPC 3500055300 30041085562 3700000869. BRAND COLGATE(CO) ORAL B(OB) CREST (CR). SALE 30167.92 21700.94 20805.15. UNIT PRICE 2.99 2.99 2.69. TABLE 4 the high unit price brand of tooth-paste UPC 3834109379. BRAND COLGATE (KCO). Sale 6849.29. unit price 2.363333. 34167041720 30041037017. TOPOL (KTO) ORAL-B (KOB). 6233.36 6401.94. 1.497059 1.023333. 12.
(21) TABLE 5 the low unit price brand of toothbrush UPC 7094240409. BRAND BUTLER(BU). SALE UNIT PRICE 10279.07 1.245. 30041083518 ORAL-B (OB) 7869.09 1111383159 PEPSODENT(PE) 10765.28. 1.245 0.99. TABLE 6 the low unit price brand of tooth-paste UPC 3700000391 3500050900 3500057100. BRAND CREST (KCR) CLGT(KCL) COLGATE (KCO). 13. sale 103585.08 79939.88 67609.78. unit price 0.389063 0.373438 0.373438.
(22) B. Modeling procedure To measure the effect of retail price promotion on sales of substitutes and complements, retail price promotional activities on the brand and its substitutes and complements within a store are in the model. In this study, dependent variable is sales of one brand and independent variables are the retail prices of competing or substitute brands and complement brands in tooth brush and toothpaste category.. (1). Salesi =Σχiβi. whereβi = retail price of high-priced brand 1 to 6. It is specified here for high price level brand CO.. SalesCO=X1βCO+X2βOB+X3βCR+X4βKCO+X5βKOB+X6βKTO Where. βCO = retail price of toothbrush Brand CO βOB =retail price of toothbrush Brand OB βCR =retail price of toothbrush Brand CR βKCO =retail price of toothpaste Brand KCO βKOB =retail price of toothpaste Brand KOB βKTO = retail price of toothpaste Brand KTO. (2). Salesj =Σγjαj. whereαj = retail price of low-priced brand 1 to 6. For example, SalesPE=γ0+γ1αPE +γ2αBU +γ3αOB +γ4αKCR +γ5αKCL +γ7αKCO The equation contains variables pertaining to the brand itself (α1), the brand’s substitutes in the product category (α2 and α3), and the brand’s complements (α4, α5 and α6).. 14.
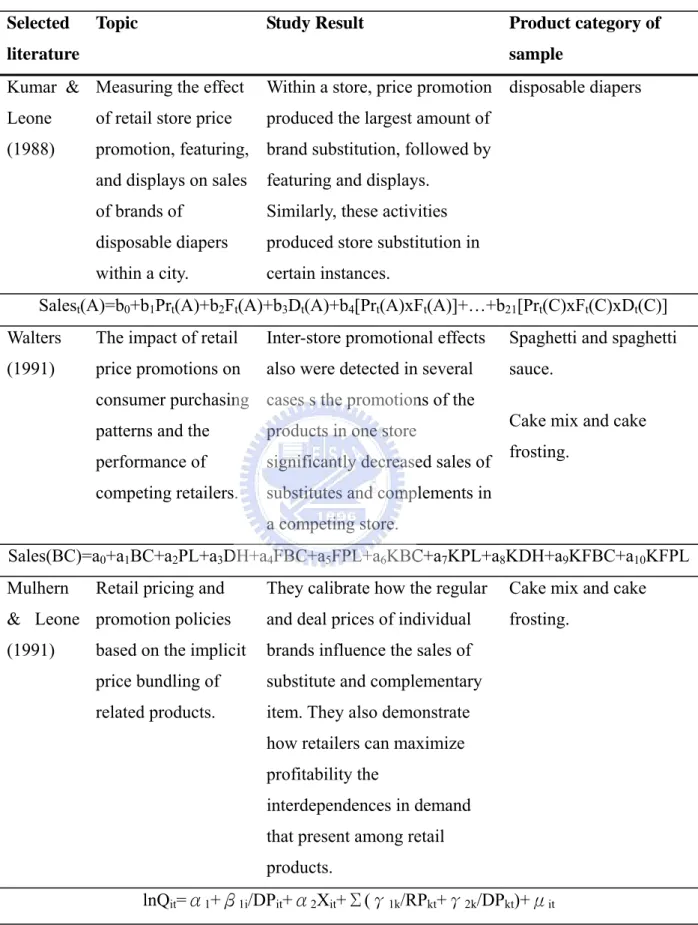
(23) TABLE 7 Summary the method and sample of substitute and complement literature. Selected. Topic. Study Result. Product category of sample. literature Kumar & Measuring the effect. Within a store, price promotion disposable diapers. Leone. of retail store price. produced the largest amount of. (1988). promotion, featuring, brand substitution, followed by and displays on sales. featuring and displays.. of brands of. Similarly, these activities. disposable diapers. produced store substitution in. within a city.. certain instances.. Salest(A)=b0+b1Prt(A)+b2Ft(A)+b3Dt(A)+b4[Prt(A)xFt(A)]+…+b21[Prt(C)xFt(C)xDt(C)] Walters. The impact of retail. Inter-store promotional effects. Spaghetti and spaghetti. (1991). price promotions on. also were detected in several. sauce.. consumer purchasing cases s the promotions of the patterns and the. products in one store. performance of. significantly decreased sales of. competing retailers.. substitutes and complements in. Cake mix and cake frosting.. a competing store. Sales(BC)=a0+a1BC+a2PL+a3DH+a4FBC+a5FPL+a6KBC+a7KPL+a8KDH+a9KFBC+a10KFPL Mulhern. Retail pricing and. They calibrate how the regular. Cake mix and cake. & Leone promotion policies. and deal prices of individual. frosting.. (1991). based on the implicit. brands influence the sales of. price bundling of. substitute and complementary. related products.. item. They also demonstrate how retailers can maximize profitability the interdependences in demand that present among retail products.. lnQit=α1+β1i/DPit+α2Xit+Σ(γ1k/RPkt+γ2k/DPkt)+μit. 15.
(24) In economics, elasticity is the proportional change in one variable relative to the proportion change in another variable. The concept of elasticity can be used whenever there is a cause and effect relationship. In economics, the price elasticity of demand (PED) is an elasticity that measures the nature and degree of the relationship between changes in quantity demanded of a good and changes in its price. Price elasticity of demand is measured as the percentage change in quantity demanded that occurs in response to a percentage change in price. For example, if, in response to a 10% fall in the price of a good, the quantity demanded increases by 20%, the price elasticity of demand would be 20%/(− 10%) = −2. (Case & Fair, 1999). In general, a fall in the price of a good is expected to increase the quantity demanded, so the price elasticity of demand is negative as above. Note that in economics literature the minus sign is often omitted and the elasticity is given as an absolute value. (Case & Fair, 1999). Because both the denominator and numerator of the fraction are percent changes, price elasticities of demand are dimensionless numbers and can be compared even if the original calculations were performed using different currencies or goods. An example of a good with a highly inelastic demand curve is salt: people need salt, so for even relatively large changes in the price of salt, the amount demanded will not be significantly altered. Similarly, a product with a highly elastic demand curve is red cars: if the price of red cars went up even a small amount, demand is likely to go down since substitutes are readily available for purchase (cars of other colors). It may be possible that quantity demanded for a good rises as its price rises, even under conventional economic assumptions of consumer rationality. Two such classes of goods are known as Giffen goods or Veblen goods. Another case is the price inflation during an economic bubble. The unicist approach to price elasticity solved the problem integrating the demanded quantity, its subjective value and the price. The formula used to calculate the coefficient of price elasticity of demand is. 16.
(25) Using all the differential calculus:. where: P = price, Q = quantity When the price elasticity of demand for a good is elastic (Ed > 1), the percentage change in quantity is greater than that in price. Hence, when the price is raised, the total revenue of producers falls, and vice versa. When the price elasticity of demand for a good is inelastic (Ed < 1), the percentage change in quantity is smaller than that in price. Hence, when the price is raised, the total revenue of producers rises, and vice versa. When the price elasticity of demand for a good is unit elastic (or unitary elastic) (Ed = 1), the percentage change in quantity is equal to that in price. Hence, when the price is raised, the total revenue remains unchanged. The demand curve is a rectangular hyperbola. When the price elasticity of demand for a good is perfectly elastic (Ed = ∞), any increase in the price, no matter how small, will cause demand for the good to drop to zero. Hence, when the price is raised, the total revenue of producers falls to zero. The demand curve is a horizontal straght line. A ten-dollar banknote is an example of a perfectly elastic good; nobody would pay $10.01, yet everyone will pay $9.99 for it. When the price elasticity of demand for a good is perfectly inelastic (Ed = 0), changes in the price do not affect the quantity demanded for the good. The demand curve is a vertical straight line; this violates the law of demand. Elasticity is an important concept in understanding the different types of goods as they relate to the theory of consumer choice. In economics, the cross elasticity of demand or cross price elasticity of demand measures the responsiveness of the quantity demanded of a good to a change in the price of another good. It is measured as the percentage change in demand for the first good that occurs in response to a percentage change in price of the second good. For example, if, in response to a. 17.
(26) 10% increase in the price of fuel, the quantity of new cars that are fuel inefficient demanded decreased by 20%, the cross elasticity of demand would be -20%/10% = -2. In the example above, the two goods, fuel and cars, are complements - that is, one is used with the other. In these cases the cross elasticity of demand will be negative. In the case of perfect complements, the cross elasticity of demand is negative infinity. Where the two goods are substitutes the cross elasticity of demand will be positive, so that as the price of one goes up the quantity demanded of the other will increase. For example, in response to an increase in the price of fuel, the demand for new cars that are fuel efficient (hybrids for example) will also rise. In the case of perfect substitutes, the cross elasticity of demand is positive infinity. Where the two goods are independent the cross elasticity demand will be zero, as the price increase the quantity demanded will be zero, an increase in price 'zero quantity demanded'. In case of perfect independence, the cross elasticity of demand is zero.. (3) Cross-Price Elasticity = (percentage change in amount of A bought) divided by (percentage change in price of B). Take low price brands for example,. SalesTP=γ0+γ1αPE +γ2αBU +γ3αOB +γ4αKCR +γ5αKCL +γ7αKCO SalesTB=γ0+γ1αPE +γ2αBU +γ3αOB +γ4αKCR +γ5αKCL +γ7αKCO SalesTOTAL=γ0+γ1αPE +γ2αBU +γ3αOB +γ4αKCR +γ5αKCL +γ7α KCO. It is measured as the percentage change in demand for the toothpaste that occurs in response to a percentage change in price of the toothpaste and tooth brush. Where the two goods are substitutes the cross elasticity of demand will be positive, so that as the price of one goes up the quantity demanded of the other will increase.. 18.
(27) TABLE8 A brief summary of the literature estimating price elasticity Study Guadagni & Little. Product category Ground coffee. Price elasticity -1.9 to -3.4. (1983). Type of. Functional. data. specification. Household. Logit models. data. Krishnamurthi & Raj NA. -1.0 to -1.9. (1988). Household. Logit models. data. Wittink & colleagues Tuna. -1.3 to -4.3. Store data. Log-log. Disposable diapers. NA. Store data. Linear. NA. -2.2 to -4.6. Household. Logit models. (1988) Kumar & Leone (1988) Kamakura & Russell (1989) Bolton (1989). Blatterg &. data Frozen waffles,. -0.5 to -2, -2.3. liquid bleach, toulet. to -3.9, -1.9 to. multip;icative. tissue, catsup. -4.9, -0.8 to -5.4. exponential. Semi-log. -5.0 to -6.5. Store data. Several. Margarine. -1.8 to -5.9. Household. Logit models. Store data. Linear. Wisnitewski (1989) Allenby & Rossi (1991a) Gonul & Srinivasan. data Disposable diapers. -1.7 to -3.9. (1993) Zenor & Srivastava. Household. Logit models. data NA. NA. Store data. (1993). Latent segment logit. Jain, Vilcassim &. Saltine crackers,. -0.7 to -3.0, -1.5 Household. Chintagunta (1994). Catsup, Yogurt. to -3.8, -1.0 to. Logit models. data. -2.1 Hoch & colleagues. 18 categories. -0.8 to -2.6. Store data. Log-log. Christen &. Peanut butter,. -2 to -2.4,-1.7. Store data. Log-log. colleagues (1995). powdered. (1994). detergents 19.
(28) C. Hypotheses 1. Promotional effects For manufacturers and retailers, they all expect to increase their sales. The manufacturer’s primary objective in promoting a brand is to increase sales. In contrast, the retailer’s primary objective is to maximize store profit (Kumar & Leone, 1988). Most of studies support by conventional wisdom and past empirical research (Neslin, Henderson, and Quelch ,1985;. Blatterg Eppen, and Lieberman ,1981; McAlister and Struse ,1988; Guadagni. and little, 1983; Moriarty ,1985). The first hypothesis is that retail promotional activity stimulates significant increases in sales of the promoted product—no matter the product pricing is high or low. Therefore, H1: retail price promotional activities conducted on a brand of high price level have a significant positive impact on sales of the promoted brand.(+) H2: retail price promotional activities conducted on a brand of low price level have a significant positive impact on sales of the promoted brand. (+). 2. Brand substitution effects Numerous studies with diary panel data (Dodson, Tybout, and Sternthal, 1978) and aggregate sales data (Kumar and Leone, 1988) indicate that price promotions enhance brand substitution effects (Chevalier, 1975; Moriarty, 1985). We assume that: H3: retail price promotional activities conducted on a brand of high price level have a significant positive impact on sales of brand substitutes in the product category. (+) H4: retail price promotional activities conducted on a brand of low price level have a significant positive impact on sales of brand substitutes in the product category. (+). 20.
(29) 3. Use complementary effects A basic notion in retailing is that promotions also affect consumer purchasing patterns by stimulating purchases of non-promoted complements to the promoted products (Berman and Evans 1989; Walters 1988). Complementary effects created by promotions are of special interest to retailers because significant increase in sales of full-margin complementary products can offset decreases in sales of full-margin substitute brands (Walters 1991). McAlister and Totten (1985) indicates that the level of interaction often is substantial and the promoted brand can influence significantly both competitive brands (decrease their sales) and complementary products (increase their sales). Mulhern (1989) and Walters (1991) also show the promotion of one product can stimulate sales of complement. H5: retail price promotional activities conducted on a brand of high price level have a significant positive impact on sales of brand complements.(+) H6: retail price promotional activities conducted on a brand of low price level have a significant positive impact on sales of brand complements. (+). At the first, we have the tooth brush and tooth paste scanner data from 277 to 328 week and save as two EXCEL that one is the dataset of high price brands and the other is low price brands. We use SAS program to analysis data. The equation 1 (Salesi =Σχiβi) is for hypothesis 1,3, and5. The equation 2 (Salesj =Σγjαj) is for hypothesis 2,4, and 6. The equation 3, Cross-Price Elasticity = (percentage change in amount of A bought) divided by (percentage change in price of B), can measured as the percentage change in demand for the item that occurs in response to a percentage change in price of the toothpaste and tooth brush.. 21.
(30) IV. Results TABLE 9 un-standardized regression coefficients pertaining to brand substitution and complementary effects: high price brand Independent variables affect sales of Tooth-brush. I.V. CO. OB. Tooth-paste CR. KCO. KOB. KTO. -0.69059. -0.69855. 0.72392**. -1.13796. 0.73054. 0.41935. 2.28050*. CO. -4.01265*** -0.74387. OB. -1.87465. -12.28643*** 0.13324. CR. 1.95698*. -1.48930*. -4.79020*** -0.22362. 0.22077. -1.04523. KCO. 11.24828. -18.87500**. 1.96878. 4.49549. -2.00635. -15.08916. KTO. 0.37944. 1.33600. -3.06794**. 1.04178. 0.12853. 0.70934***. KOB. 4.06715. 4.94271*. 1.35682. 4.49549. -3.73944*** 0.70934**. F. 3.62***. 15.69***. 12.55***. 0.26. 2.46**. 3.18***. R^. 0.04. 0.15. 0.12. 0.003. 0.03. 0.03. * p<0.10. ** p<0.05. *** p<0.01. TABLE 10 cross elasticity: high price brand Independent variables affect sales of I.V.. Tooth-brush. CO. -5.44710***. OB. -14.02784*** 3.43038. -10.59746**. CR. -4.32253***. -1.04807. -5.37059**. -12.60002. -18.25796. -4.31080. -5.66329. 0.35900. 10.72568. KCO -5.65794 KTO. -1.35249. KOB 10.36668*. Tooth-paste -1.11260. Total -6.55970***. F. 6.51***. 0.79. 3.08***. R^. 0.07. 0.01. 0.03. * p<0.10. ** p<0.05. *** p<0.01.. 22.
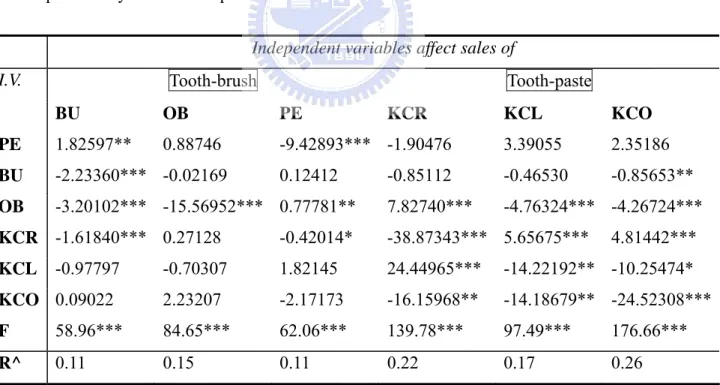
(31) TABLE 11 correlation matrix: high price brand CO. OB. CR. KCO. CO. 1. OB. 0.11152***. CR. -0.19423*** -0.01573. 1. KCO. -0.27334*** 0.05646. -0.22230*** 1. KTO. 0.20533***. -0.05469**. 0.14519***. KOB. 0.06102***. 0.11671*** -0.10651*** 0.15344***. KTO. KOB. 1. -0.50990*** 1 -0.23934*** 1. * p<0.10. ** p<0.05. *** p<0.01.. TABLE 12 un-standardized regression coefficients pertaining to brand substitution and complementary effects: low price brand Independent variables affect sales of Tooth-brush. I.V.. Tooth-paste. BU. OB. PE. PE. 1.82597**. 0.88746. BU. -2.23360*** -0.02169. OB. -3.20102*** -15.56952*** 0.77781**. KCR -1.61840*** 0.27128 KCL. -0.97797. KCO 0.09022. KCR. KCL. KCO. -9.42893*** -1.90476. 3.39055. 2.35186. 0.12412. -0.85112. -0.46530. -0.85653**. 7.82740***. -4.76324*** -4.26724***. -0.42014*. -38.87343*** 5.65675***. 4.81442***. -0.70307. 1.82145. 24.44965***. -14.22192** -10.25474*. 2.23207. -2.17173. -16.15968**. -14.18679** -24.52308***. F. 58.96***. 84.65***. 62.06***. 139.78***. 97.49***. 176.66***. R^. 0.11. 0.15. 0.11. 0.22. 0.17. 0.26. p<0.10. ** p<0.05. *** p<0.01.. 23.
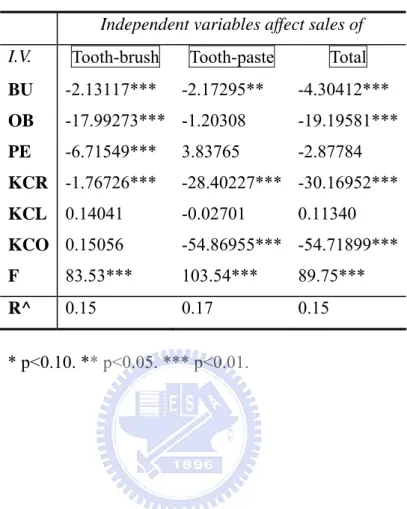
(32) TABLE 13 cross elasticity: low price brand Independent variables affect sales of I.V.. Tooth-brush. BU. -2.13117***. OB. -17.99273*** -1.20308. -19.19581***. PE. -6.71549***. -2.87784. -2.17295**. Total -4.30412***. 3.83765. KCR -1.76726***. -28.40227*** -30.16952***. 0.14041. KCL. Tooth-paste. -0.02701. KCO 0.15056. 0.11340. -54.86955*** -54.71899***. F. 83.53***. 103.54***. 89.75***. R^. 0.15. 0.17. 0.15. * p<0.10. ** p<0.05. *** p<0.01.. TABLE 14 correlation matrix: low price brand BU. OB. PE. KCR. KCL. BU. 1. OB. 0.24219*** 1. PE. 0.01553. KCR. 0.06122*** -0.22968*** -0.10195*** 1. KCL. 0.12730*** -0.19588*** -0.12627*** -0.19553*** 1. KCO. 0.12728*** -0.19553*** -0.12553*** 0.34968***. -0.00423. KCO. 1. * p<0.10. ** p<0.05. *** p<0.01.. 24. 0.98453*** 1.
(33) A. Promotional effects H1 and H2 state that price promotions on a brand stimulate brand sales. The hypothesized sign associated with the relationship is negative – that is, as prices decrease (increase), sales increase (decrease). The results indicate that price promotions had a significant impact on brand sales for all promoted brands. In this type of research, collinearity may exits to reduce our explanation. TABLE 10 and TABLE 13 show cross elasticity. TABLE 11 is the correlation matrix for high price level brands, and TABLE 14 is for low price level brands. The finding shows that the data support H1 and H2, that is, retail price promotional activities conducted on a brand of high and low price level have a significant positive impact on sales of the promoted brand, expect for high price brands (KCO and KTO) in the toothpaste category. Over all speaking, in the tooth brush and toothpaste category, as prices decrease (increase), sales increase (decrease).. B. Brand substitution effects H3 states that price promotions on one brand of high price level have a positive impact on sales on substitute brands in the category, and H4 states that price promotions on one brand of low price level have a negative impact on sales on substitute brands. The hypothesized sign associated with this relationship is positive – that is, high (low) prices on one brand mean high (low) sales of substitute brands. In low price level of the tooth brush category, for example, PE gained sales at the expense of OB (TABLE 12 and TABLE 13). In particular, we find a strong correlation between KCL price and KCO price (TABLE 14). Therefore, it must be careful to explain the brand substitution effect of KCL and KCO. The results show that the number of substitution effects varied among product category and among brands of high (low) price level. For example, for low price level brands, significant substitution effects were found in 67% of possible cases when price promotions were conducted in tooth brush category, whereas significant substitution effects were found in 100% of the cases in toothpaste. For high price level brands, only price promotions on CR toothbrush resulted in significant decreases in sales of CO tooth brush in high price level, whereas there is no significant evidence to indicate that price promotions impact on sales of brand substitutes in toothpaste category. The overall pattern of results provides modest rejects 25.
(34) H3 but supports H4, that is, price promotions on one brand of high price level have a negative impact on sales on substitute brands in the category, and price promotions on one brand of low price level have a positive impact on sales on substitute brands. So far as we have seen that there are several interesting substitution patterns. First, most of the substitution effects were asymmetrical, as one brand built sales at the expense of another brand but did not lose sales as a result of that brand’s price promotion activities. For example, for low price level brands, price promotion on PE tooth brush significantly reduced sales of BU tooth brush, yet price promotion on BU did not significantly reduce sales of PE tooth brush. Only in toothpaste of low price level, price promotion on KCR toothpaste significantly reduced sales of KCL toothpaste, and price promotion on KCL toothpaste significantly reduced sales of KCR toothpaste as well. Second, price promotions appear to be effective in enhancing substitution of low unit price brands in the toothpaste category. That is very different from Walters’s study. In 1991, Walter’s study indicates that in no instance did a low market share brand gain sales at the expense of a brand with higher market share. But in our study, KCR toothpaste is the popular brand with high market share in toothpaste category, and price promotions enabled KCL toothpaste, a brand with lower market share and lower unit price, to gain sales at the expense of KCR toothpaste. And PE toothpaste is at the same situation. Hence, price promotion appears to be an effective tool for brands of low unit price in their categories. The overall pattern of results provides modest rejects H3 but supports H4.. C. Use complementary effects The hypothesized sign associated with this relationship is negative (i.e., low prices on a brand mean high sales of complementary products). H5 posits that price promotions on a high price level brand have a significant positive impact on sales of brand complements to the promoted brand. And H6 posits that price promotions on a low price level brand have a significant positive impact on sales of brand complements to the promoted brand. As brand substitution effects, the results show that the number of substitution effects varied among product category and among brands of high (low) price level. For example, for low price level brands, significant substitution effects were found in 67% of possible cases when price promotions were conducted in tooth brush and toothpaste category. For high price 26.
(35) level brands, significant substitution effects were found in 67% of possible cases when price promotions were conducted in tooth brush category, whereas there is no significant evidence to indicate that price promotions impact on sales of brand substitutes in toothpaste category. The patterns of results pertain to complementary effects provides some interesting insights into price promotional effects. First, like substitution effects, substitution effects were not symmetrical. That is, in toothpaste of low price level, price promotion on KCR toothpaste significantly increased sales of BU tooth brush, and price promotion on BU toothpaste do not increase sales of KCR toothpaste as well. Second, price promotions did not appear to enhance complementary purchase of high unit price brands. Hence, price promotion appears to be an effective tool for complementary purchase of low unit price in their categories but do not useful for complementary purchase of high unit price. The overall pattern of results provides modest reject H5 but support H6.. 27.
(36) V. Conclusion The study focus on the breadth and depth of retail price promotions on FMCG brand substitution and use complementary purchase using scanner data. For instance, when buying toothbrushes which are on price promotion, we will also consider if a tooth paste is needed. Shampoo and bath soap is another example. The present study is different from the past and stands on product pricing and investigates the effect of retailer price promotion on FMCG brand substitution and use complementary. The finding shows that the data support H1 and H2, that is, retail price promotional activities conducted on a brand of high and low price level have a significant positive impact on sales of the promoted brand, expect for high price brands (KCO and KTO) in the toothpaste category. Over all speaking, in the tooth brush and toothpaste category, as prices decrease (increase), sales increase (decrease).And the study provides modest rejects H3 but supports H4, that is, price promotions on one brand of high price level have a negative impact on sales on substitute brands in the category, and price promotions on one brand of low price level have a positive impact on sales on substitute brands. Third, price promotion appears to be an effective tool for complementary purchase of low unit price in their categories but do not useful for complementary purchase of high unit price. The overall pattern of results provides modest reject H5 but support H6. The finding shows that price promotions on a brand stimulate brand sales. The results indicate that price promotions had a significant impact on brand sales for all promoted brands in tooth brush and toothpaste categories. In other words, as prices decrease (increase), sales increase (decrease). The result also shows price promotions on one brand of low price level have a positive impact on sales on substitute brands in the category, but price promotions on one brand of high price level have a negative impact on sales on substitute brands. And, it shows most of the substitution effects were asymmetrical, as one brand built sales at the expense of another brand but did not lose sales as a result of that brand’s price promotion activities. The most interesting is that the result is very different from Walters’s study. In 1991, Walter’s study indicates that in no instance did a low market share brand gain sales at the expense of a brand with higher market share. Complementary effects of promotions were called by one retail executive in the study “the essence of merchandising,” yet complementary effects rarely have been explored 28.
(37) by researchers and probably are not exploited enough by retailers. We find that price promotion appears to be an effective tool for complementary purchase of low unit price in their categories but do not useful for complementary purchase of high unit price, especially for toothpaste of high price. The study results have some interesting implication for retailers and manufactures. For manufacturers and retailers, they all expect to increase their sales. The manufacturer’s primary objective in promoting a brand is to increase sales. In contrast, the retailer’s primary objective is to maximize store profit (Kumar & Leone, 1988). Jack Trout, author of positioning, cautions that some product categories tend to self-destruct by always being on sale. They must do carefully or find that their profits are much less than planned. The success of retail price promotions depends on such factors as the ability of the promoted items to draw customers to the store, the profit (or loss) on the promoted item, the cannibalization that occurs when consumers switch away from regular-priced items to promoted items, and the boost in sales volumes of non-promoted items. In this article, FMCGs are having a quick shelf, at relatively low cost and do not require a lot of thought, time and financial investment to purchase. Because of FMCG product characteristics, most of retailers will set a low price or promotions frequently and think it is useful. In the words of marketing consultant Kevin Clancy, those who target only the price-sensitive are “leaving money on the table.” Our finding shows that price promotion appears to be an effective tool for brand substitute and full-margin complementary purchase of low unit price but do not useful for brand substitution of high unit price. There are a few possible of high price brand in tooth brush category may have complementary purchase. Most retailers do not consider the effect of promotion on sales of non promoted product. As a consequence, retailers may draw misleading conclusions about promotional effectiveness. Scanner data is easy to acquire and can give practitioners better tools for understanding their markets (e.g., approaches to analyze consumer response and market segmentation) and for making marketing mix decisions (e.g., setting prices and determining promotion spending). If retailers can use scanner data and have professional marketing employee to suit consumer characteristics and environment changes with scientific method to make a market strategy and planning, it is expected to meet strong sales and growth targets, achieved through strategies for retailers.. 29.
(38) Certain limitations of our work and database provide opportunities for future research. First, the price promotional effects investigated may be particular to the product categories examined. Second, all of these factors ,for example, retailing advertising , promotional frequency, the degrees of discount and channel power may enhance or inhibit substitution and complementary effects, and future research should include these variables in studies of promotional effects. Third, thought we examine two types of buyer that all are associated with price. It would be interesting to understand how category characteristics influence purchase characteristics. Future research can make a questionnaire to evaluate attribute and combine scanner data to analyze. Therefore, the promotions we analyze reflect the real world .. 30.
(39) Reference Blackwell, Roger D., Miniard, Paul W., and Engel, James F. (2001), “consumer behavior” 9th ed. Case, Karl E. & Fair, Ray C. (1999). Principles of Economics (5th ed.). Prentice-Hall Dhar, S. K., Hoch, S. J. and Kumar, N. (2001), “Effective category management depends on the role of the category,” Journal of Retailing, 77(2), 165-184. Duchessi, Peter, Schaninger, Charles M, and Nowak, Thomas (2004), “Creating Cluster-specific purchase profiles from point-of-sale scanner data and geodemographic clusters: improving category management at a major US grocery chain,” Journal of Consumer Behavior, Dec, Vol. 4, 2, 97-117. Gruen, T. W. and Shah, R. H. (2000), “Determinants and outcomes of plan objectivity and implementation in category management relationships,” Journal of Retailing, 76(4), 483-510. Gupta, Sunil (1988), “Impact of Sales Promotions on When, What, and How Much to Buy,” Journal of Marketing Research, 25 (November), 342-55. Hoch, S. J., Dreze, X. and Purk, M. E. (1994), “EDLP, hi-lo and margin arithmetic”, Journal of Marketing, 58, October, 16-27. Kotler, Philip (2003), “Marketing management,” 11th ed. Kumar, V. and Leone, Robert (1988), “Measuring the Effects of Retail Store Promotions on Brand and Store Substitution,” Journal of Marketing Research, 25 (May), 178-85. Mulhern, Francis J. & Leone, Robert P. (1991), “Implicit price bundling of retail products: a multiproduct approach to maximizing store profitability,” Journal of Marketing, Vol. 55,October, 63-76. Rossi, Peter, Robert E. McCulloch, and Greg Allenby (1995), “The Value of Purchase History Data in Target Marketing,” technical Report No. 134, Graduate School of Business, University of Chicago.. 31.
(40) Tellis, Gerard J. and Fred S. Zufryden (1995), “A Dynamic Model for Optimizing the Timing and Depth of Retail Discounts,” Marketing Science, 14 (3, Part 1), 271-99. Walters, Rockney G. (1991), “Assessing the Impact of Retail Price Promotions on Product Substitution, Complementary Purchase, and Interstore Sales Displacement,” Journal of Marketing, Vol. 55 (April), 17-28.. 32.
(41) Appendix A Week# start. end. Special events. 280. 01/19/95 01/25/95. 281. 01/26/95 02/01/95. 282. 02/02/95 02/08/95. 283. 02/09/95 02/15/95. 284. 02/16/95 02/22/95 Presidents Day. 285. 02/23/95 03/01/95. 286. 03/02/95 03/08/95. 287. 03/09/95 03/15/95. 288. 03/16/95 03/22/95. 289. 03/23/95 03/29/95 Easter. 290. 03/30/95 04/05/95. 291. 04/06/95 04/12/95. 292. 04/13/95 04/19/95. 293. 04/20/95 04/26/95. 294. 04/27/95 05/03/95. 295. 05/04/95 05/10/95. 296. 05/11/95 05/17/95. 297. 05/18/95 05/24/95. 298. 05/25/95 05/31/95 Memorial Day. 299. 06/01/95 06/07/95. 300. 06/08/95 06/14/95. 301. 06/15/95 06/21/95. 302. 06/22/95 06/28/95. 303. 06/29/95 07/05/95 4th of July. 304. 07/06/95 07/12/95. 305. 07/13/95 07/19/95. 33.
(42) 306. 07/20/95 07/26/95. 307. 07/27/95 08/02/95. 308. 08/03/95 08/09/95. 309. 08/10/95 08/16/95. 310. 08/17/95 08/23/95. 311. 08/24/95 08/30/95. 312. 08/31/95 09/06/95 Labor Day. 313. 09/07/95 09/13/95. 314. 09/14/95 09/20/95. 315. 09/21/95 09/27/95. 316. 09/28/95 10/04/95. 317. 10/05/95 10/11/95. 318. 10/12/95 10/18/95. 319. 10/19/95 10/25/95. 320. 10/26/95 11/01/95 Halloween. 321. 11/02/95 11/08/95. 322. 11/09/95 11/15/95. 323. 11/16/95 11/22/95. 324. 11/23/95 11/29/95 Thanksgiving. 325. 11/30/95 12/06/95. 326. 12/07/95 12/13/95. 327. 12/14/95 12/20/95. 328. 12/21/95 12/27/95 Christmas. 34.
(43) Appendix B UPC. DESCRIP. SIZE. sale. unit price. 3500055300 CLGATE PLUS #2 FULL. EA. 30167.92. 2.99. 3500055800 CLGT PLUS #1 FULL ME. EA. 26917.62. 2.69. 1 CT. 21700.94. 2.99. 3700000869 CREST T.B. #4 MED AN. 1 CT. 20805.15. 2.69. 3500056210 ALADDIN TOOTHBRUSH F. EA. 20043.79. 2.49. 3500056000 CLGT PLUS CHARACTER. EA. 19603.67. 2.69. 30041085561 ORAL B ADVANTAGE C/G. 1 CT. 19444.93. 2.89. 30041085120 ORAL-B ADVANTAGE 40. EA. 19213.38. 2.99. 38137007202 REACH ADVANCED FULL. 1 CT. 19035.82. 2.59. 3700000290 CREST CMPLT CHILD SS. 1 CT. 18594.19. 2.59. 3700000885 CREST T.B. #6 SOFT S. 1 CT. 18505.07. 2.59. 3500068400 COLGATE PRECISION ME. 1 CT. 18417.32. 2.87. 3700000867 CREST T.B. #8 SOFT A. 1 CT. 17844.67. 2.59. 30041080200 ORAL B REGULAR #40 T. EACH. 17373.01. 2.39. 30041084100 ORAL B ANGLE REGULAR. EACH. 17353.33. 2.69. 3500068500 COLGATE PRECISION SO. 1 CT. 16710.17. 2.87. 38137007201 REACH ADVANCED FULL. 1 CT. 16497.2. 2.59. 38137007206 REACH TOOTHBRUSH WON. 1 CT. 16453. 2.59. 30041080140 ORAL B REG MEDIUM #4. EACH. 16120.11. 2.39. 30041080160 ORAL B LARGE MEDIUM. EACH. 15738.25. 2.39. 30041085115 ORAL-B ADVANTAGE 60. EA. 15670.42. 2.99. 30041084300 ORAL B ANGLE 40 REG. 1 CT. 15464.17. 2.39. 30041080100 ORALB LARGE #60 TOOT. EACH. 15422.41. 2.39. 30041081465 ~ORAL B SESAME ST T/. EA. 15388.99. 2.39. 3700000889 CREST T.B. #2 MED ST. 1 CT. 14692.92. 2.59. 3700000879 CREST T.B. #3 MED AN. 1 CT. 14675.65. 2.59. 30041085112 ORAL-B ADVANTAGE 40. EA. 14235.54. 2.99. 3500057900 COLGATE PLUS #5 SOFT. EA. 13759.79. 2.69. 30041085121 ORAL-B ADVANTAGE 40. EA. 13729.46. 2.99. 2 CT. 13535.22. 2.29. EACH. 13245.04. 2.69. 5310000121 AQUA FRESH FLEX T/B. 1 CT. 12894.95. 2.79. 3500065800 COLGATE TB RIPPLED B. EA. 12692.01. 2.69. 3700000912 CREST TB IMAGES MAL. 1 CT. 12594.28. 2.59. 5310000120 AQUA FRESH FLEX T/B. 1 CT. 12437.44. 2.79. 3500057800 COLGATE PLUS #4 CMPC. EA. 12151.76. 2.69. EA. 11972.21. 2.29. 30041085562 ORAL B ADVANTAGE C/G. 7094240411 BUTLER ADULT REG BOG 30041084000 ORAL B ANGLE COMPACT. 38137007122 REACH FULL MED 35.
(44) 5310000160 AQUAFRESH FLX DIR SO. 1 CT. 11774.26. 2.99. 1 CT. 11650.84. 2.29. 3500068600 COLGATE PRECISION X-. 1 CT. 11535.78. 2.87. 3500061500 CLGT PLUS #17 T/B WL. 1 CT. 11303.84. 2.69. 3500065900 COLGATE TB RIPPLED B. 1 CT. 11284.1. 2.69. EA. 11266.17. 2.29. 7094240111 BUTLER JR CRITTERS B. EA. 11244.11. 2.29. 1111383259 PEPSODENT T/B MEDIUM. 1 CT. 11234.68. 0.99. 3500053900 CLGT PLUS #14 ANGL T. 1 CT. 11117.89. 2.69. 5310000170 AQUAFRESH FLEX DIREC. 1 CT. 10774.95. 2.99. 1111383159 PEPSODENT T/B SOFT P. 1 CT. 10765.28. 0.99. 5310000126 AQUA FRESH FLEX KIDS. 1 CT. 10572.94. 2.79. EA. 10432.23. 2.29. 2 CT. 10279.07. 2.29. EA. 9963.83. 2.99. 1111383359 PEPSODENT T/B HARD P. 1 CT. 9960.26. 0.99. 3500054000 CLGT PLUS #15 ANGL T. 1 CT. 9907.76. 2.69. 3828160057 DOMINICKS GEM HEAD-M. 1 CT. 9899.97. 1.79. 9898.9. 2.99. 38137007222 REACH BETWEEN MEDIUM. 38137007126 REACH FULL FIRM. 38137007120 REACH FULL SOFT 7094240409 BUTLER COMPACT SOFT 30041085118 ORAL-B ADVANTAGE 35. 30041085114 ORAL-B ADVANTAGE 60. EA. 3500068800 COLGATE PRECISION CO. 1 CT. 9594.61. 2.87. 3700000895 CREST T.B. #5 SOFT S. 1 CT. 9582.8. 2.59. 3500055332 CLGT PLUS GRIP FULL. EA. 9553.5. 2.59. 30041081200 ORAL B NOVELTY 20 SO. 1 CT. 9191.27. 2.39. 38137007130 REACH CMPCT SOFT. EA. 8782.79. 2.29. 3828160049 DOM ORAL ANGLE FIRM. EACH. 8738.08. 1.59. 7094240311 BUTLER SLENDER SOFT. 2 CT. 8729.3. 2.29. 38137007134 REACH GLOW AGE 1-5 T. 1 CT. 8645.67. 2.17. 38137007203 REACH ADVANCED FULL. 1 CT. 8596.04. 2.59. 3828160045 DOM ORAL ANGLE MEDIU. EACH. 8576.43. 1.59. 3828160041 DOM ORAL ANGLE SOFT. EACH. 8522.49. 1.59. 5310000122 AQUA FRESH FLEX T/B. 1 CT. 8496.82. 2.79. 3828160073 DOM COMPLETE PERF/ST. 1 CT. 8335.48. 1.59. 3828160053 DOMINICKS GEM HEAD-S. 1 CT. 8063.8. 1.79. 3500055322 CLGT PLUS GRIP FULL. EA. 8062.18. 2.59. 3828160077 DOM COMPLETE PERF/AN. 1 CT. 7933.39. 1.59. 30041083518 ORAL-B P-SERIES B1G1. 2 CT. 7869.09. 2.59. 30041083519 ORAL-B P-SERIES B1G1. 2 CT. 7506.14. 2.79. 30041080400 ORAL B COMPACT #35 T. EACH. 7438.71. 2.39. 38137007220 REACH BETWEEN SOFT. 1 CT. 7304.92. 2.29. 36.
(45) 3500068700 COLGATE PRECISION CO. 1 CT. 7291.22. 2.87. 3828160069 DOM SOFT CLASSIC TB. 1 CT. 7230.91. 0.69. 3828160065 DOM MED CLASSIC TB. 1 CT. 6976.31. 0.69. EA. 6848.15. 2.99. 3500056200 CLGT JR #9 T/B X/SOF. EA. 6734.1. 2.19. 3500068506 CLGT PRCSN E/G TB FU. EA. 6701.03. 2.79. 3828160061 DOM FIRM CLASSIC TB. 1 CT. 6356.85. 0.69. 30041085117 ORAL-B ADVANTAGE 35. EA. 6118.45. 2.99. 38137007140 REACH CMPCT MED. EA. 6071.32. 2.29. EA. 5894.67. 0.99. 5741.2. 2.17. EA. 5663.55. 1.19. 30041084200 ORAL B ANGLE COMPACT. EACH. 5598.74. 2.69. 38137007136 REACH YOUTH 6-12 T/B. 1 CT. 5496.61. 2.17. 3700000874 CREST T.B. #7 SOFT A. 1 CT. 5422.36. 2.59. 38137007245 REACH ADV DSGN CMPCT. EA. 5382.55. 2.59. 30041085107 ORAL-B ADVANTAGE 35. EA. 5281.81. 2.99. 3500055599 COLGATE T/B SOFT PP.. EA. 5152.35. 0.99. 3700000916 CREST T.B. #10 XSFT. 1 CT. 5139.52. 2.59. EA. 5011.59. 2.59. 3700000285 CREST COMPLETE YOUTH. 1 CT. 4933.47. 2.59. 3700000896 CREST CMPLT TB IMAGE. 1 CT. 4889.65. 2.59. 5310000140 AQUAFRESH FLX DIRCT. 1 CT. 4860.69. 2.99. 38137007218 REACH BETWEEN SENSIT. 1 CT. 4841.13. 2.29. 3700000280 CREST CMPLT IMAGES S. 1 CT. 4735.05. 2.59. 5310000150 AQUAFRESH FLEX DIREC. 1 CT. 4713.22. 2.99. 30041081539 F/S ORAL B ANGLE B1G. 1 CT. 4605.9. 2.59. 30041080135 ORAL BCOMPACT #35 ME. EACH. 4440.12. 2.39. 3700000275 CREST CMPLT TB IMAGE. 1 CT. 4320.48. 2.59. 30041085539 CONTURA REGULAR ANGL. 1 CT. 4299.91. 1.99. 38137007247 REACH ADVANCE DSGN C. EA. 4154.65. 2.59. 3500068805 CLGT PRCSN E/G TB CO. EA. 4145.63. 2.87. 7094200153 BUTLER NYLON TRAVEL. EA. 3808.05. 2.29. 3700000898 CREST T.B. #1 MED ST. 1 CT. 3721.99. 2.59. 38137007133 REACH CHILDS. EA. 3617.69. 2.17. 30041085108 ADVANTAGE 35 MEDIUM. EA. 3551.59. 2.99. 3544.7. 2.79. 30041085113 ORAL-B ADVANTAGE 40. 3500055199 COLGATE CLASSIC MED 38137007137 REACH GLOW AGE 6-12. 1 CT. 3500055200 COLGATE CLASSIC T-BR. 38137007246 REACH ADVANCE DSGN C. 5310000123 AQUA FRESH FLEX T/B. 1 CT. 38137007142 REACH CMPCT FIRM. EA. 3226.05. 2.29. 30041085540 CONTURA REGULAR ANGL. 1 CT. 2983.17. 1.99. 37.
(46) 3500068900 COLGATE PRECISION CO. 1 CT. 2972.46. 2.87. 7094200432 BUTLER ANGLE TB FULL. 1 CT. 2751.95. 2.19. EA. 2334.87. 2.99. 7094261612 BUTLER PROXBRSH TRVL. EA. 2218.48. 1.93. 3500055299 COLGATE T/B FIRM PP.. EA. 2121.3. 0.99. EA. 2062.69. 2.99. 7094200430 BUTLER ANGLE TB FULL. EA. 2015.44. 2.19. 7094200433 BUTLER ANGLE TB COMP. EA. 1883.22. 2.19. 7094200431 BUTLER ANGLE TB COMP. 1 CT. 1714.3. 2.19. 3500053800 COLG PLS ANGL T/B CM. 1 CT. 1638.98. 2.69. 7094200434 BUTLER ANGLE TB FULL. 1 CT. 1623.09. 2.19. 5310000127 AQUA FRESH FLEX COMP. 1 CT. 1238.06. 2.79. 4167067200 JORDAN ADULT V MAGIC. 1 CT. 1187.73. 2.49. 4167000000 F/S JORDAN MAGIC T/B. 1 CT. 1108.05. 2.49. 3828178049 DOM BRICK ORAL ANGLE. 6 PK. 934.44. 5.99. 38137137200 ADVNCE DSGN REACH TB. 2-1 CT. 906.29. 2.49. 7094200612 BUTLER PROXABRUSH #6. EACH. 786.17. 1.99. 4167067000 JORDAN MAGIC CHILD T. 1 CT. 684.75. 2.49. 7094261614 BUTLER PROXBRSH TRVL. EA. 606.29. 1.93. 4167067050 JORDAN MAGIC CHILD V. 1 CT. 580.17. 2.49. 4167067350 JORDAN ADULT MGC T/B. 1 CT. 557.76. 2.49. 5310012023 F/S AQUAFRESH FLEX B. 1 CT. 521.73. 2.79. 5310012022 F/S AQUAFRESH FLEX B. 1 CT. 456.76. 2.79. 5310012026 F/S AQUAFRESH FLEX B. 1 CT. 354.14. 2.79. 3500055500 COLGATE CLASSIC T-BR. EA. 330.64. 1.19. 7094200111 GUM JR. CRITTERS. EA. 323.34. 2.29. 3500055100 COLGATE CLASSIC T-BR. EA. 317.52. 1.19. 7094200123 BUTLER 123 ORTHODONI. EA. 313.55. 1.99. 5310012027 ~AQUA FRESH FLEX COM. 1 CT. 312.03. 2.79. 3500055610 CLGT+ TB W/FREE CASE. EA. 277.36. 2.69. 4167067300 JORDAN MAGIC TODDLER. 1 CT. 249. 2.49. 3834106588 ORABASE-B W/BENZOCAI. 1/2 OZ. 243.65. 5.89. 7094200411 GUM ADULT REG 4 ROW. EA. 224.52. 2.29. 3500055611 CLGT+ TB W/FREE CASE. EA. 212.9. 2.69. 5310000128 ~AQUA FRESH FLEX COM. 1 CT. 120.78. 2.79. 7094200311 GUM ADULT 3 ROW. 2 CT. 107.26. 2.29. 7094200409 GUM COMPCT 4 ROW. 2 CT. 105.1. 2.29. 2-1 CT. 72.21. 2.49. 1 CT. 53.73. 1.99. 30041085109 ADVANTAGE 40 XSFT TB. 30041085104 ADVANTAGE 35 XSFT. 38137117200 ADVNCE DSGN REACH TB 7094200614 BUTLER PROXABRUSH 38.
(47) Appendix C UPC. DESCRIP. sale. 4933603600 REMBRANDT PEROXIDE B. unit price 105930.7. 3.526667. 103585.08. 0.389063. 1111363961 MENTADENT TARTER CON. 90325.55. 0.690385. 3500050900 *CLGT REG. 79939.88. 0.373438. 1111363761 MENTADENT REFILL-FRE. 76679.89. 0.690385. 69555. 0.389063. 3500057100 *COLGATE TARTAR REG. 67609.78. 0.373438. 3700000321 *CREST REG. 66420.88. 0.389063. 1111363861 MENTADENT REFILL-COO. 63017.57. 0.690385. 1111363901 MENTADENT TARTER CON. 61525.42. 1.025714. 3500051300 CLGT REG. 56732.06. 0.337805. 53982.7. 0.345122. 4933600111 REMBRANDT WHITENING. 49549.51. 2.83. 1111363701 MENTADENT TOOTHPASTE. 48960.91. 1.025714. 3500056685 ULTRA BRITE. 48923.44. 0.365. 1111374102 CLSUP RED. 48280.12. 0.417188. 3320018840 ARM&HAMMER PEROXICAR. 45995.16. 0.797778. 3500075903 CLGT BS&PEROX X-FRES. 45750.78. 0.373438. 3500057200 COLGATE TARTAR REG. 44689.31. 0.341975. 3700072823 CREST TAT SMOOTH MIN. 43089.55. 0.389063. 5310032210 *AQUA FRESH TOOTHPAS. 41647.26. 0.417188. 3500076003 CLGT B.SODA&PEROXIDE. 39936.84. 0.373438. 3700000306 CREST TARTAR GEL. 39125.34. 0.345122. 5310032420 AQUAFRESH SENSITIVE. 37778.18. 0.644186. 3700072941 ~CREST STND UP KIDS. 37200.68. 0.415. 1111363801 MENTADENT TOOTHPASTE. 36377.75. 1.025714. 33636.8. 0.389063. 3700000328 CREST NEAT SQUEEZE T. 33277.27. 0.471667. 3700000337 CREST TARTER GEL NEA. 33230.74. 0.471667. 3500059600 *COLGATE TARTAR GEL. 31825.76. 0.373438. 1111341101 PEPSODENT W/FLORIDE. 31357.19. 0.248438. 3500078800 COLGATE B SODA TARTA. 30991.73. 0.538095. 3700000310 CREST REG. 30974.31. 0.345122. 3700072862 CREST SENSITIVITY PR. 30970.66. 0.546774. 3700072939 ~CREST STND UP TAR G. 30910.72. 0.415. 4933600125 REMBRANDT MINT WHITE. 30796.33. 2.996667. 3700072979 CREST TARTAR CNTRL B. 30610.38. 0.389063. 3700072940 ~CREST STND UP TAR S. 30579.23. 0.415. 3700000391 *CREST TRT REG. 3700000309 *CREST TRT GEL. 3700000392 CREST TARTAR REG. 3700000345 *CREST MINT. 39.
(48) 3700072938 ~CREST STND UP TARTA. 30252.44. 0.415. 3700072825 CREST NEAT SQUEEZE S. 29762.86. 0.471667. 3320018650 A&H DENTL-CARE TARTA. 28790.96. 0.558. 3700072830 CREST TARTAR CNTRL B. 28474.11. 0.389063. 1111363951 MENTADENT TARTER CON. 27931.07. 0.805769. 3500072600 COLGATE STAND-UP REG. 27789.63. 0.398333. 3320018860 ARM&HAMMER PEROXICAR. 27427.02. 0.665079. 3500072800 COLGATE STAND-UP TAR. 27065.4. 0.398333. 1111379161 CLOSE-UP TARTAR CONT. 26658.95. 0.417188. 3500075904 COLGATE BS& PEROX X-. 26629.85. 0.337805. 26404.9. 0.217188. 1111363751 MENTADENT TOOTHPASTE. 25771.35. 0.805769. 5310032500 AQUAFRESH TOOTHPASTE. 24933.21. 0.364634. 3700072828 CREST TAR SMOOTH MIN. 24898.95. 0.345122. 3700072829 CREST TARTAR CNTRL B. 24558.35. 0.35. 3320018290 A&H TARTAR CNTRL GEL. 23901.62. 0.467901. 5310033300 *AQUA FRESH TARTAR T. 23538.38. 0.445. 3320018390 ~A&H DNTL CARE REG P. 23529.8. 0.41. 1111320202 AIM REGULAR GEL. 23443.81. 0.217188. 5310000318 AQUA FRSH TPLPRTCTN. 23304.23. 0.417188. 3700072935 ~CREST STD UP REG. 23272.71. 0.415. 3320018690 A&H TARTAT CNTRL PAS. 23153.29. 0.41. 3828160017 DOM BAKING SODA TOOT. 22914.04. 0.378. 1111319120 PEPSODENT TP W/BAKIN. 22840.78. 0.265. 3500058700 *CLGT GEL. 22300.63. 0.373438. 3500076001 COLGATE BS&PEROX TS. 22195.63. 0.398333. 3700000312 CREST GEL. 22108.69. 0.389063. 3700073091 CREST TARTR W/FREE 2. 22080.3. 0.345122. 3700000338 CREST NEAT SQUEEZE K. 21851.21. 0.471667. 21837.5. 0.415. 3500072900 COLGATE STAND-UP TAR. 21789.07. 0.398333. 3500075901 COLGATE BS&PEROX ST. 21615.34. 0.398333. 3700072924 F/S CREST BAKING SOD. 21554.8. 0.389063. 1111363851 MENTADENT TOOTHPASTE. 21192.96. 0.805769. 5310032920 AQUAFRESH BAKING SOD. 20639.93. 0.417188. 3320018350 A/H DENTAL CARE TOOT. 20296.81. 0.558. 3500059700 COLGATE TARTAR GEL. 19925.27. 0.324691. 1111329780 AIM GEL BAKING SODA. 19658.93. 0.231667. 3500078100 COLGATE STAND-UP JUN. 19444.45. 0.454348. 3700072917 F/S CREST BAKING SOD. 18906.33. 0.389063. 3828160025 DOM TARTAR GEL. 18589.65. 0.295313. 1111323101 AIM X/S GEL. 3700072936 ~CREST STND UP MINT. 40.
(49) 1111367051 CLOSE UP BAKING SODA. 18317.02. 0.417188. 3700000311 CREST GEL. 17943.75. 0.345122. 3500000603 COLGATE BAKING SODA. 17823.26. 0.538095. 17342.38. 0.521429. 3700072978 CREST TARTAR CNTRL B. 17125.42. 0.35. 3500078900 COLGATE B SODA T/C G. 16952.69. 0.538095. 3700000390 *CREST TRT REG. 15533.44. 0.493478. 3500072700 COLGATE STAND-UP GEL. 15448.72. 0.398333. 3700073092 CREST TRTR GEL W/2 T. 14593.42. 0.345122. 14164.9. 0.345122. 3320018490 A&H REG GEL 15% FREE. 13906.36. 0.519178. 3320018370 ARM & HAMMER DENTAL. 13735.71. 0.541429. 3700072937 ~CRST STND UP GEL. 13641.06. 0.415. 3828160021 DOM TARTAR CONTROL T. 13637.35. 0.295313. 5310033400 AQUA FRESH TARTAR TU. 12904.95. 0.393421. 3700073089 CREST REGULAR W/FREE. 12482.83. 0.345122. 1111325381 AIM TARTER GEL #. 12399.75. 0.217188. 3700072923 CREST BAKING SODA GE. 11578.03. 0.345122. 11558.7. 0.337805. 3700000325 CREST NEAT SQUEEZE R. 11403.64. 0.471667. 3700073093 CREST TC SMTH GEL W/. 11304.72. 0.345122. 1851527612 ~#PLUS+WHITE ONE STE. 11144.85. 1.996667. 11024.3. 0.426563. 3320018270 ARM&HAMMER TARTAR CO. 10915.79. 0.601587. 3700000315 *CREST TRT GEL. 10847.73. 0.493478. 3500051400 *CLGT REG. 10770.08. 0.454348. 3700000322 *CREST REG. 10507.58. 0.493478. 5310000430 AQUA FRESH TARTAR PU. 10236.71. 0.378333. 5310000311 AQFR PUMP ADULT. 10226.96. 0.493478. 3500056687 ULTRA BRITE BS & PER. 9773.68. 0.365. 3500051377 CLGT REG. 9680.13. 0.337805. 3500057277 COLGATE SUPER W/PLUS. 9445.18. 0.341975. 3700073090 ~CREST ICY MINT W/FR. 9065.61. 0.345122. 3320018670 A&H DENTAL CARE TAR. 9048.27. 0.541429. 3700000326 CREST NEAT SQUEEZE M. 8914.04. 0.471667. 3500056700 ULTRA BRITE GEL TUBE. 8911.35. 0.365. 3700073095 CREST TC BKS W/2.5 G. 8820.71. 0.35. 3700072926 CREST B SODA GEL NEA. 8717.23. 0.471667. 3500057000 *COLGATE TARTAR REG. 8659.03. 0.454348. 5310000303 AQUA FRESH KIDS PUMP. 8450.81. 0.493478. 3500077200 COLGATE BAKING SODA. 8391.97. 0.538095. 30041086143 SESAME ST FRUITY STA. 3700000334 CREST MINT. 3500058800 CLGT GEL. 3700000278 GLEEM GOLD TOOTHPAST. 41.
數據
+2
相關文件
相關研究成效,開發能源屋作為節能之教具並商品化推廣,藉以達到產品的有用
定義: 供應商按貨品定價提供的 折扣2. 供應商按貨品的淨發票價所提
略,親切的服務態度、完善的商品、有效率的宅急便等便利服務,以及方便的電子商 務與多樣的促銷手法而產生。例如: 在 2005 年,甲超商配合歡慶卡通人物Hello Kitty
本研究考量 Wal-mart 於 2005 年方嘗試要求百大供應商需應用 RFID 技術 於商品上(最終消費商品且非全面應用此技術,另 Wal-mart
無印良品在 1980 年創立時,原本的理念是將生產或流通過程中浪 費、或是包裝的多餘部份去掉,製造出較低廉的商品,以生產價格 合理的商品為定位。但到
契約 商品期貨 商品選擇權 商品 交換...
張杰、劉小明、賀育龍與陳永勝 (2007) 以 1970 年至 1992 年中國交通事故之十萬 人口死亡率數據,利用 ARIMA 模型預測 1993 年至 1997 年交通事故之死亡率的。.
補充二: 補充二: 學堂
