網路購物行為 — 行動原因理論暨科技接受模式之研究 - 政大學術集成
86
0
0
全文
(2) 網路購物行為 行動原因理論暨科技接受模式之研究 A Study on Online Shopping Behavior – Based on two Models: TRA and TAM. 學生「羅玉婷. Student: Justyna Roguska. 指導教授「賴建都. Advisor: Jeff Lai. Ᏸ. 國立政治大學. 國際傳播英語碩士學位學程. Nat. 碩士論文. n. al. er. io. sit. y. •. • 國. 立. 政 治 大. Ch. i Un. v. e n g c h i Master’s Program A Thesis Submitted to International In International Communication Studies National Chengchi University In partial fulfillment of the Requirements for The Degree of Master of Arts in International Communication Studies. 中華民國100 年7 月 July 2011.
(3) A STUDY ON ONLINE SHOPPING BEHAVIOR – BASED ON TWO MODELS: TRA AND TAM. A Master Thesis National Chengchi University. 立. 政 治 大. •. • 國. Ᏸ. n. er. io. sit. y. Nat. al. i Un. v. In Partial Fulfillment of the Requirements for the Degree Master of Art. Ch. engchi. by Justyna Roguska July 2011.
(4) ACKNOWLEDGEMENTS I would like to express my sincere appreciation to Prof. Jeff Lai, my advisor, for his suggestions and comments. I would also like to thank evaluation committee members, Prof. Zhu Feng-Gang and Prof. Tsai Nian-Chung. I would like to express my gratitude to all the professors who have taught me during my studies, IMICS office stuff and university friends for making my experience in Taiwan unforgettable.. 立. 政 治 大. I would like to thank my parents for their unconditional love, encouragement,. • 國. Ᏸ. patience and support.. •. Last but not least, to my love – Ryszard, thank you for the inspiration and the support during my hard work.. n. er. io. sit. y. Nat al. Ch. engchi. I. i Un. v. Justyna Roguska.
(5) ABSTRACT Predicting customers’ intention to purchase products online is an important issue. This thesis aims to understand how online shopping decision is determined by individual’s intention to buy via Internet and his/her attitude toward e-purchase. This study by integrating the Theory of Reasoned Action (TRA) with the Technology Acceptance Model (TAM), attempts to understand how website usefulness and ease. 政 治 大. of use, as well as customers’ attitude toward online shopping, influence purchase. 立. intention influence the online purchase. Those two models adopted in an online. • 國. Ᏸ. environment were used to analyze the outcome of the survey among Polish e-. •. shoppers. By adopting the idea of regular and heavy Internet users, this study tries to differentiate the online shopping behavior in those two groups. The findings of the. y. Nat. io. sit. thesis have been found to be partially consistent with both models. However the. n. al. er. difference between heavy and regular Internet users in frequency of buying online has not been confirmed.. Ch. engchi. i Un. v. Keywords: online shopping behavior, regular Internet users, heavy Internet users, Theory of Reasoned Action, Technology Acceptance Model.. II.
(6) TABLE OF CONTENTS ACKNOWLEDGEMENTS........................................................................................... I ABSTRACT.................................................................................................................. II TABLE OF CONTENTS.............................................................................................III LIST OF TABLES.......................................................................................................VI LIST OF FIGURES ................................................................................................... VII CHAPTER ONE INTRODUCTION.............................................................................1 . 政 治 大. 1.1. Research Background and Motivations ..........................................................1 . 立. 1.2. Online Consumer Behavior as a Research Phenomenon ................................2 . • 國. Ᏸ. 1.3. Purpose of the Study .......................................................................................3 CHAPTER TWO LITERATURE REVIEW .................................................................4 . •. 2.1 Conditions of Internet Usage in Poland ...........................................................4 . y. Nat. io. sit. 2.2. Theory of Reasoned Action (TRA)...............................................................10 . n. al. er. 2.2.1. Three Components of the Theory.......................................................12 . Ch. i Un. v. 2.2.2. The Application of TRA in Various Studies ......................................13 . engchi. 2.2.3. Summary ............................................................................................14 2.3. Technology Acceptance Model ....................................................................15 2.3.1. Technology Acceptance Model Applied for Website ........................18 2.4. Internet Experience and Internet Heavy Users .............................................18 CHAPTER THREE METHODOLOGY .....................................................................21 3.1. Research Design and Variables ....................................................................21 3.1.1. Online Purchase Ease of Use..............................................................22 3.1.2. Online Purchase Usefulness ...............................................................22 . III.
(7) 3.1.3. Attitude towards Online Purchasing...................................................23 3.1.4. Subjective Norm.................................................................................23 3.1.5. Online Purchase Intention ..................................................................23 3.1.6. Internet Experience and Heavy Internet Users...................................24 3.2. Research Framework and Hypotheses ..........................................................24 3.3. Development of the Measurement ................................................................25 3.3.1. Operationalization of Variables..........................................................26 3.3.2. Dependent Variables and Independent Variables ..............................28 3.3.3. Questionnaire......................................................................................28 . 政 治 大. 3.3.4. Validity and Reliability ......................................................................30 . 立. 3.4. Data Collection and Sampling Population ....................................................31 . • 國. Ᏸ. 3.5. Data Analysis Techniques.............................................................................31 . •. CHAPTER FOUR DATA ANALYSIS AND FINDINGS .........................................32 4.1. Sample Structure ...........................................................................................32 . y. Nat. er. io. sit. 4.2. Measurement Model .....................................................................................37 4.3. Hypotheses Testing .......................................................................................39 . al. n. iv n C 4.4 Summary ........................................................................................................45 hengchi U 4.5 Discussion ......................................................................................................46 CHAPTER FIVE CONCLUSION AND RECOMENDATIONS...............................49 5.1 Conclusion .....................................................................................................49 5.1 Limitations .....................................................................................................50 5.2 Recommendations for Future Research .........................................................50 REFERENCES ............................................................................................................52 APPENDICES .............................................................................................................67 Appendix 1 Questionnaire – original Polish version .........................................67 . IV.
(8) Appendix 2 Questionnaire – English translation ...............................................72 . 立. 政 治 大. •. • 國. Ᏸ. n. er. io. sit. y. Nat al. Ch. engchi. V. i Un. v.
(9) LIST OF TABLES Table 3.3.1. Operationalization of variables and their sources ..................................26 Table 4.1 Characteristics of respondents (total = 226)...............................................35 Table 4.2 Heavy and Regular Internet users (total = 226) .........................................37 Table 4.3 Factor loadings and reliabilities of measurement scale..............................39 Table 4.3.1 Online purchase ease of use and online purchase usefulness: Correlation. 政 治 大. and Descriptive Statistics (N = 226)........................................................40 . 立. Table 4.3.2 Online purchase ease of use and attitude toward online purchasing:. • 國. Ᏸ. Correlation and Descriptive Statistics (N = 226)....................................41 . •. Table 4.3.3 Online purchase usefulness and attitude toward online purchasing: Correlation and Descriptive Statistics (N = 226)....................................42 . y. Nat. io. sit. Table 4.3.4 Online purchase usefulness and online purchase intention: Correlation. n. al. er. and Descriptive Statistics (N = 226)........................................................42 . Ch. i Un. v. Table 4.3.5 Attitude toward online purchasing and online purchase intention:. engchi. Correlation and Descriptive Statistics (N = 226)....................................43 Table 4.3.6 Online purchase intention and online purchase: Correlation and Descriptive Statistics (N = 226)...............................................................44 Table 4.3.7 Internet user experience and online purchase: Correlation and Descriptive Statistics (N = 226)...............................................................44 Table 4.3.8 Frequency of online buying: Descriptive Statistics .................................45 Table 4.4 Overall Results of Hypothesis Testing .........................................................46 . VI.
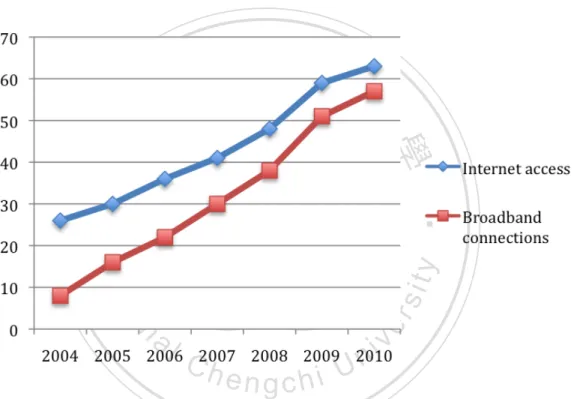
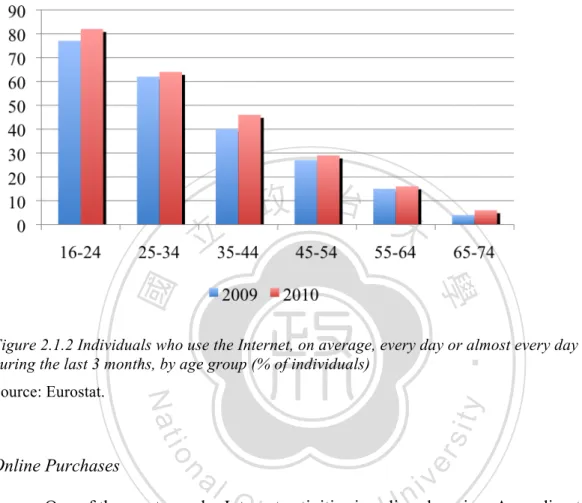
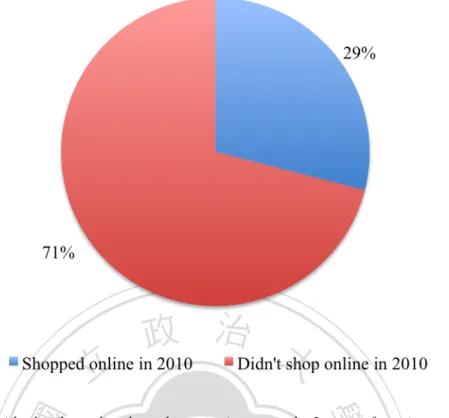
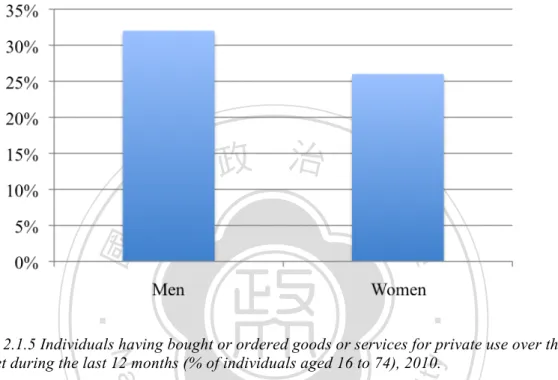
(10) LIST OF FIGURES Figure 2.1.1 Internet access and broadband connections by households, 2006 – 2010 (% of individuals aged 16 to 74)................................................................5 Figure 2.1.2 Individuals who use the Internet, on average, every day or almost every day during the last 3 months, by age group (% of individuals) .................6 Figure 2.1.3. Individuals who ordered goods or services over the Internet for private. 政 治 大. use during the 12 months (% of individuals aged 16 to 74) ......................7 . 立. Figure 2.1.4. Individuals who ordered goods or services over the Internet for private. • 國. Ᏸ. use from 2004 to 2010. (% of individuals aged 16 to 74)..........................7 . •. Figure 2.1.5 Individuals having bought or ordered goods or services for private use over the Internet during the last 12 months (% of individuals aged 16 to. y. Nat. io. sit. 74), 2010. ...................................................................................................8 . n. al. er. Figure 2.1.6 Individuals having bought or ordered goods or services for private use. Ch. i Un. v. over the Internet during the last 12 months, by age group (% of. engchi. individuals), 2010. .....................................................................................9 Figure 2.1.4. Internet users who bought or ordered goods or services for private use over the Internet during the last 12 months, 2010 (% of Internet users). ..9 Figure 2.2.1. Reasoned Action Model by Azjen & Fishbein (1975). ..........................11 Figure 2.3.1. Technology Acceptance Model by Davis et al. (1989) ..........................16 Figure 2.3.1.1. Technology Acceptance Model applied for Website by Chau et al. (2000).......................................................................................................18 Figure 3.1.2. Research Framework with Hypotheses. .................................................25 . VII.
(11) CHAPTER ONE INTRODUCTION. 1.1. Research Background and Motivations Recently, the Internet has become one of the most powerful medium of. 政 治 大. information, services and products trade. Rapid development of information and. 立. communication technologies caused a growth in the value of information and. • 國. Ᏸ. popularity of the Internet, the World Wide Web and finally e-commerce. The introduction of the Internet has rapidly transformed the society very in unprecedented. •. ways. Nowadays, the Internet exerts a strong influence on people’s everyday life, and. y. Nat. sit. is used for many different purposes. With access to the Internet, it is possible to do. n. al. er. io. almost everything, while staying in one place. Many activities such as playing,. i n U. v. learning, communicating, buying or selling as well as banking, can be done online.. Ch. engchi. Using search engines it is easy to collect information about product or services and compare the prices. Online shopping became one of the most popular Internet activity. Many vendors and customers from all over the world are attracted by this new technological medium to invest, sell and purchase online. The advantages of online shopping as compared to traditional shopping are that clients can buy goods or services at home, regardless of the location of the shop and time. E-commerce is fascinating for practitioners as well as for researchers. Steinfield and Whitten suggest in their study (1999), that it is better to run a combination of both online and physical presence on the market than just an e1.
(12) business. According to their study, such a combination can provide better prepurchase and post sales services, which would reduce consumer transaction cost and build trust in online stores. Others (Hoffman, Novak et al. 1999; Jarvenpaa and Tractinsky 1999; Brynjolfsson and Smith 2000) argued about the negative influence of online purchases on trust, because the seller and the buyer do not have a direct personal contact. Brynjolfsson and Smith (Brynjolfsson and Smith 2000) also mention the importance of trust and branding, especially for Internet retailers.. 1.2. Online Consumer Behavior as a Research Phenomenon. 政 治 大. The reason, why many people have not shopped online yet is that there is a. 立. fundamental lack of faith between consumers and businesses (Hoffman, Novak et al.. • 國. Ᏸ. 1999). For Johnson there are three barriers to online shopping: purchase failures,. •. security fears and service frustrations (Johnson 1999). Stigler (1961) considered, that buyers can look for the lowest price of the product in many different places, until they. y. Nat. er. io. sit. find the most favorable price. Also Strader and Shaw (1999) mentioned the importance of price. They pointed out, that prices in electronic markets are lower than. al. n. iv n C other researchers that h e n g cconsidered hi U. traditional markets. Some. consumer’s intent to. perform Internet transactions is conditioned by their personal traits and characteristics (Sheth and A. 1995; Jarvenpaa and Traxtinsky 1999). The Internet has many applications and is not only a new channel for marketing but it is used mostly as an information source (Curtis 2000). Most of the online users find it difficult to enjoy Web shopping (Jones 2000).. 2.
(13) 1.3. Purpose of the Study The goal of this study is to investigate and analyze customer’s online purchase behavior and make the typology of Internet use. The research adopts the existing conceptualizations and theoretical models, built on the basis of the Theory of Reasoned Action (TRA). Moreover, the research makes use of the concept of Internet “heavy user”. The research focuses on the World Wide Web, as the purchase environment. Many online shops want to improve the quantity and quality of their online customer base. A deeper analysis of online customers’ behavior can be very helpful for. 政 治 大. marketing strategists and is essential for e-commerce.. 立. In order to accomplish this aim, the study focuses on solving the following. What determines the consumer online purchase behavior?. •. • 國. Ᏸ. research problem:. The solution to the described research problem is generated through finding. y. Nat. er. io. sit. answers to the following, more focused research questions:. What determines the consumer online purchase intention?. al. n. iv n C What determines the consumer h attitude towards buying e n g c h i U online? In the information age online purchase behavior is also very fascinating for researchers. Many researchers discussed consumers’ behavior, some of them even very deeply. This will be discussed in the next chapter. This paper is going to be an introduction to the further studies elucidating online customer behavior and online purchase intention for Business to Consumer (B2C) websites.. 3.
(14) CHAPTER TWO LITERATURE REVIEW This study examines the factors that influence people’s adoption and use of online shopping and tests the applicability of the Theory of Reasoned Action (TRA) introduced by Azjen and Fishbein (1980) and Technology Acceptance Model (TAM). 政 治 大 Many studies have shown that theories of behavioral intention have predicted 立. introduced by Davis (1986) in the context of heavy Internet usage in Poland.. • 國. Ᏸ. technology usage and consumer behavior (Chau & Hu, 2001, 2002; Chung & Kim, 2002; Gentry & Calantone, 2002; Chung, Shearman & Lee, 2003; Chung, 2004 and. •. other).. Nat. sit. y. The following chapter constitutes the introduction of the conditions of Internet. n. al. er. io. usage in Poland and summarizes the previous literature about the theory of reasoned. i n U. v. action, technology acceptance model and heavy Internet users, and also explains main constructs of the research.. Ch. engchi. 2.1 Conditions of Internet Usage in Poland Rates of regular and frequent Internet use in Poland have been increasing steadily over the past few years, reflecting both the adoption of Internet shopping as well as the growing number of households with Internet access.. 4.
(15) Internet Access in Poland According to the data published online by Eurostat, the Statistical Office of the European Communities, during the first quarter of 2010, 63% of households in Poland with members aged between 16 and 74 had access to the Internet at home, compared to 59% during the first quarter of 2009, and 57% had a broadband Internet connection in 2010, compared to 51% in 2009 (Eurostat, 2010). These figures grew rapidly between 2004 and 2009 as shown in Figure 2.1.1.. 立立. 政政 治治 大 大. • 國 • 國. • Ᏸ • Ᏸ er er sity sit y. n io N a ti o n Nat. al a iv iv n Cl hC ehnegncghci hUi U n. Figure 2.1.1 Internet access and broadband connections by households, 2006 – 2010 (% of individuals aged 16 to 74) Source: Eurostat.. Frequency of Internet Use According to “Internet usage in 2010 – Households and Individuals” published by Eurostat, in the first quarter of 2010, 42% of all individuals aged 16-74 used the Internet on average every day or almost every day, compared to 39% in the first quarter of 2009. The highest percentages were found in the age group of 16-24,. 5.
(16) respectively 82% in 2010 and 77% in 2009 (Figure 2.1.2). The next age group of 2534 was also high and above the average, namely 64% in 2010 and 62% in 2009 (Eurostat, 2009; 2010).. 立. 政 治 大. • 國. Ᏸ y. sit. er. io. Online Purchases. Nat. Source: Eurostat.. •. Figure 2.1.2 Individuals who use the Internet, on average, every day or almost every day during the last 3 months, by age group (% of individuals). al. n. iv n C One of the most popular Internet is online shopping. According to the h eactivities ngchi U. data published online by Eurostat, in 2010, 29% of individuals in Poland shopped online (Figure 2.1.3). As shown in Figure 2.1.4, the percentage of these individuals has been steadily increasing over time, from 5% in 2004 to 29% in 2010.. 6.
(17) 立. 政 治 大. • 國. Ᏸ. Figure 2.1.3. Individuals who ordered goods or services over the Internet for private use during the 12 months (% of individuals aged 16 to 74). •. Source: Eurostat.. n. er. io. sit. y. Nat. al. Ch. engchi. i n U. v. Figure 2.1.4. Individuals who ordered goods or services over the Internet for private use from 2004 to 2010. (% of individuals aged 16 to 74). Source: Eurostat. 7.
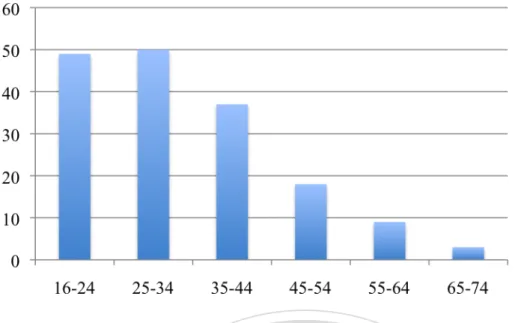
(18) In 2010, the percentage of male e-shoppers was slightly higher than that of female e-shoppers, namely in 2010, 32% of men ordered goods or services over the Internet during the last 12 months, compared to 26% of women (Figure 2.1.5).. 立. 政 治 大. •. • 國. Ᏸ y. sit. io. er. Source: Eurostat.. Nat. Figure 2.1.5 Individuals having bought or ordered goods or services for private use over the Internet during the last 12 months (% of individuals aged 16 to 74), 2010.. al. n. iv n C As shown in Figure 2.1.6, thehnumber of onlineUbuyers varied correspondingly engchi. between age groups, ranging from 49% in the age group of 16-24, 50% in the age. group of 25-34, 37% in the age group of 35-44, 18% in the age group of 45-54, 9% in the age group of 55-64 and 3% in the age group of 65-74 in 2010 (Eurostat, 2009; 2010).. 8.
(19) Figure 2.1.6 Individuals having bought or ordered goods or services for private use over the Internet during the last 12 months, by age group (% of individuals), 2010. Source: Eurostat.. 立. 政 治 大. • 國. Ᏸ. Taking only the group of Internet users into consideration, the report shows. Nat. n. al. er. io. sit. y. •. 46% of them shopped online within the past year (Figure 2.1.4).. Ch. engchi. i n U. v. Figure 2.1.4. Internet users who bought or ordered goods or services for private use over the Internet during the last 12 months, 2010 (% of Internet users). Source: Eurostat.. 9.
(20) 2.2. Theory of Reasoned Action (TRA) The Theory of Reasoned Action (TRA) predicts and understands motivational influences on the behavior that is not under the individual's volitional control. According to TRA, human beings are rational and make systematic use of information available to them. Moreover, people consider the implications of their actions before they decide to engage or not engage in certain behaviors. The Theory of Reasoned Action “proposes that behavioral intention is a function of both attitudes toward a behavior and subjective norms toward that. 政 治 大. behavior” (Miller 2005). And a person’s behavioral intention is a predictor of actual. 立. behavior. The theory suggests that a person’s behavior is determined by his/her. • 國. Ᏸ. intention to perform the behavior and that this intention is, in turn, a function of. 1980).. •. his/her attitude toward the behavior and his/her subjective norm (Azjen and Fishbein. y. Nat. er. io. sit. According to Ajzen and Fishbein, in order to gain deeper understanding of the factors influencing behavior, it is required to look for the determinants of the. al. n. iv n C components. explained, those h e nAsgthey chi U. attitudinal and normative. determinants are. beliefs individuals hold about themselves and their environment, in other words, the information individuals have about themselves and the world in which they live. Therefore, beliefs are viewed as underlying person's attitudes toward the specific behavior and subjective norms, and they ultimately determine intentions and behavior (Azjen and Fishbein 1980). In addition to measuring attitudes toward the behavior, there is also a need to measure people’s subjective norms – their beliefs about how people they care about will view the behavior in question. To predict. 10.
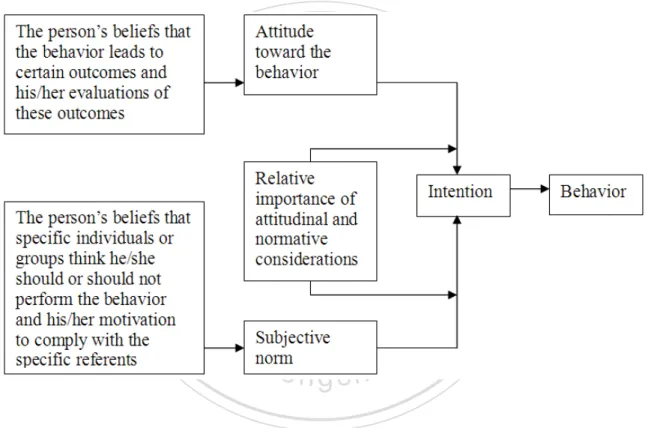
(21) someone’s intentions, knowing these beliefs can be as important as knowing the person’s attitudes. Finally, perceived behavioral control influences intentions. Perceived behavioral control refers to people's perceptions of their ability to perform a given behavior. These predictors lead to intention. As a general rule, the more favorable the attitude and the subjective norm, and the greater the perceived control, the stronger the person’s intention to perform the behavior in question.. 立. 政 治 大. •. • 國. Ᏸ. n. er. io. sit. y. Nat. al. Ch. engchi. i n U. v. Figure 2.2.1. Reasoned Action Model by Azjen & Fishbein (1975).. Generally speaking, the Theory of Reasoned Action says that a person’s behavior is determined by their attitude towards the outcome of that behavior and by the opinions of the person's social environment. Ajzen and Fishbein (1980) proposed that a person's behavior is determined by his/her intention to perform the behavior and that this intention is, in turn, a function of his/her attitude towards the behavior and 11.
(22) his/her subjective norm. A person's volitional behavior is predicted by his/her attitude towards that behavior and how he/she thinks other people would view them if they performed the behavior. A person’s attitude, combined with subjective norms, forms his/her behavioral intention. According to Ajzen attitudes and norms are not weighted equally in predicting behavior. “Indeed, depending on the individual and the situation, these factors might be very differently affecting the behavioral intention; thus a weight is associated with each of these factors in the predictive formula of the theory. For example, you might be the kind of person who cares little for what others think. If this is the case, the subjective norms would carry little weight in predicting your behavior” (Miller 2005).. Ᏸ. • 國. 立. 政 治 大. 2.2.1. Three Components of the Theory. •. Attitude. y. Nat. io. sit. Attitude is the first determinant of behavioral intention. It is the degree to. n. al. er. which the person has a favorable or unfavorable evaluation of the behavior in. Ch. i n U. v. question. Attitudes are person’s beliefs of the person. Some beliefs are formed from. engchi. direct experience, some are from outside information and others are inferred or self generated. However, only a few of these beliefs actually work to influence attitude. These beliefs are called salient beliefs and they are said to be the "immediate determinants of a person's attitude" (Azjen and Fishbein 1980). An attitude, in that case, is a person's salient belief about whether the outcome of his/her action will be positive or negative. If the person has positive salient beliefs about the outcome of his/her behavior then he/she is said to have a positive attitude about the behavior and vice-versa. If the person has negative salient beliefs about the outcome of his/her. 12.
(23) behavior he/she is said to have a negative attitude. The beliefs are rated for the probability that engaging in the behavior will produce the believed outcome.. Subjective Norm Subjective norm is regarded as the second predictor of behavioral intention. This is the influence of social pressure that is perceived by the individual (normative beliefs) to perform or not perform a certain behavior. Subjective Norms are beliefs about what others will think about our behavior. They are perceptions about how family and friends will perceive the outcome of our behavior and the degree to which. 政 治 大. this influences whether the behavior is carried out (motivation to comply). These two. 立. factors are multiplied to give the subjective norm. It is important to note that. • 國. Ᏸ. subjective norms are formed only in relation to the opinions of people considered to be significant or important.. •. io. sit. y. Nat. Behavioral Intention. n. al. er. Behavioral intention is an indication of how hard people are willing to try and. Ch. i n U. v. how much of an effort they are planning to exert, in order to perform the behavior. It. engchi. is influenced by three components: person’s attitude towards performing the behavior, the perceived social pressure, called subjective norm and perceived behavioral control. Fishbein (1967) proposed that variables not included in the model could affect intention and consequently behavior. Also, behavior is the transmission of intention into action.. 2.2.2. The Application of TRA in Various Studies The TRA was adapted to various types of research dealing with adoption of technology use. For instance, TRA has been applied to explain unethical behavior 13.
(24) (Randall, 1989), user participation and system use (Mykytyn & Harrison, 1993; Hartwick & Barki, 1994; Liker & Sindi, 1997), condom use (Sneed & Morisky, 1998), pre-adoption and post-adoption beliefs and attitudes (Karahanna, Straub & Chervany, 1999), problem solving agents in dynamic worlds (Au & Parameswaran, 2003), Internet information management (Celuch, Taylor & Goodwin, 2004) and behavior on the Internet in general (Bobbitt & Dabholkar, 2001; Leonard, Cronan & Kreie, 2004). The TRA was also adapted to predict job application decisions (Hooft, Born, Taris & Van der Flier, 2006), customer intention to adopt online banking (GrabnerKräuter & Faullant, 2008; Shih & Fang, 2004), user adaption of instant messenger use (Chung & Nam, 2007).. 立. 政 治 大. It was also applied in many studies on consumer buying behavior. There is a. • 國. Ᏸ. lot of research about traditional customers, for example, explaining milk purchasing habits and consumption behavior (Brewer, Blake, Rankin & Douglass, 1999), or. •. attitude toward intention, habit and food choice (Petrovici, Ritson & Ness, 2004) and. y. Nat. io. sit. young consumer purchase intention (Belleau, Summers, Xu & Pinel, 2007). Recently,. n. al. er. research of online customer behavior has beeb systematically increasing. Studies on. Ch. i n U. v. consumer adoption of the Internet for shopping (Yoh, Sapp & Laczniak, 2003) or. engchi. attitude toward online shopping and online shopping intention (Hansen, Jensen & Solgaard, 2004; Delafrooz, Paim & Khatibi, 2009) are just a few examples.. 2.2.3. Summary In summary, according to the Theory of Reasoned Action, an individual's behavioral intention is the most immediate factor influencing people’s behavior. This intention is a function of the individual's attitude and subjective norm. The individual's attitude and subjective norm are both considered a function of the weighted sum of the appropriate beliefs (Azjen and Fishbein 1980; Severin and Tankard 2001). 14.
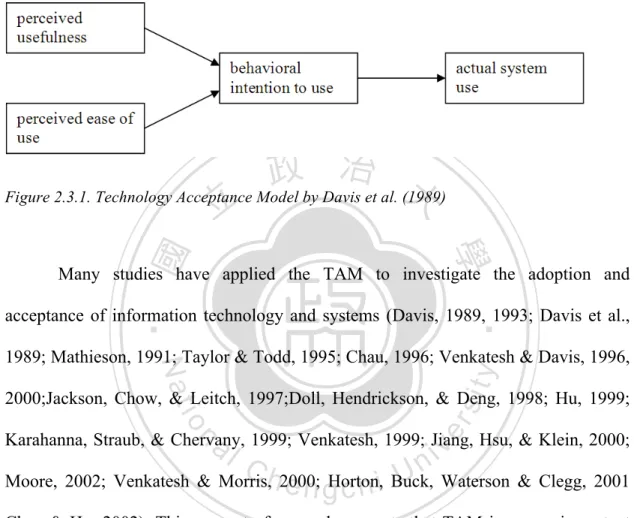
(25) The Theory of Reasoned Action has “received considerable and, for the most part, justifiable attention within the field of consumer behavior (…) not only does the model appear to predict consumer intentions and behavior quite well, it also provides a relatively simple basis for identifying where and how to target consumers’ behavioral change attempts” (Sheppard, Hartwick et al. 1988).. 2.3. Technology Acceptance Model The Technology Acceptance Model (TAM) is the information systems theory that was founded by Davis (1986) as the adaptation of the Theory of Reasoned Action (TRA).. 立. 政 治 大. The concept of the model is that, when the user has an intention to act, he/she. • 國. Ᏸ. will be free to act without limits. In practice, constraints such as limited ability, time,. •. environmental or organizational limits and unconscious habits will limit the freedom to act (Bagozzi, Davis et al. 1992). y. Nat. er. io. sit. According to Bagozzi, Davis and Warshaw: “Because new technologies such as personal computers are complex and an element of uncertainty exists in the minds. al. n. iv n C of decision makers with respect tohthe successful adoption of them, people form engchi U attitudes and intentions toward trying to learn to use the new technology prior to initiating efforts directed at using. Attitudes towards usage and intentions to use may be ill-formed or lacking in conviction or else may occur only after preliminary strivings to learn to use the technology evolve. Thus, actual usage may not be a direct or immediate consequence of such attitudes and intentions.” (Bagozzi, Davis et al. 1992) TAM suggests that perceived usefulness and perceived ease of use determine an individual's intention to use a system with intention to use serving as a mediator of. 15.
(26) actual system use. Perceived usefulness is also seen as being directly affected by perceived ease of use (Venkatesh, Morris et al. 2003). Davis et al. (1989) found that subjective norm did not significantly affect intentions and therefore omitted it from the original TAM.. 政 治 大 Figure 2.3.1. Technology Acceptance Model by Davis et al. (1989) 立 • 國. Ᏸ. Many studies have applied the TAM to investigate the adoption and. •. acceptance of information technology and systems (Davis, 1989, 1993; Davis et al.,. sit. y. Nat. 1989; Mathieson, 1991; Taylor & Todd, 1995; Chau, 1996; Venkatesh & Davis, 1996,. io. er. 2000;Jackson, Chow, & Leitch, 1997;Doll, Hendrickson, & Deng, 1998; Hu, 1999;. al. Karahanna, Straub, & Chervany, 1999; Venkatesh, 1999; Jiang, Hsu, & Klein, 2000;. n. iv n C U Waterson & Clegg, 2001 Moore, 2002; Venkatesh & Morris,h2000; e n gHorton, c h i Buck,. Chau & Hu, 2002). This amount of research suggests that TAM is a very important and influential model in this field of study. Moreover, with increasing popularity of the Internet a lot of research on useroriented interactive computer systems also applied the TAM. In this field, the TAM has been used in studies on e.g. wireless Internet via mobile devices (Lu, Yu, Liu & Yao, 2003), online banking (Suh & Han, 2002; Wang, Wang, Lin, & Tang, 2003; Pikkarainen, Pikkarainen, Karjaluoto & Pahnila, 2004), online games usage (Hsu & Lu, 2004), consumers’ use and purchase of avatar-related products (Chung, 2005a,. 16.
(27) 2005b), the use of online feedback channels (Loh, Hua, Tan & Detenber, 2006), consumers’ adoption and use of a digital library system (Hong, Thong, Wong, & Tam, 2002; Thong, Hong, & Tam, 2002; Park, Lee, Chung & Roman, 2007), consumers’ adoption of e-service system (Lin, Shih & Sher, 2007), the use of social network sites (Shin & Kim, 2008), the use of instant messaging in social network community (Theng, Chong & See, 2008), instructors’ adoption and use of an Internet-based course management systems (Martins & Kellermanns, 2004; Park, Lee & Cheong, 2008), consumers’ adoption and use of computer-based VoIP phone service (Park, 2008), consumers’ behavior in online auctions (Stern, Royne, Stafford & Bienstock,. 政 治 大. 2008) and other (Gefen & Straub, 1997; Page-Thomas, 2006; Kulviwat, Bruner II,. 立. Kumar, Nasco & Clark, 2007). A lot of research has also been conducted into. • 國. Ᏸ. customer online shopping behavior (Gefen, 2003; Gefen, Karahanna,& Straub, 2003; Pavlou, 2003; Zhou, Dai & Zhang, 2007).. •. There have also been studies which tested and confirmed the relationship. y. Nat. io. sit. between perceived usefulness, perceived ease of use and actual use (Adams, Nelson,. n. al. er. & Todd, 1992; Hendrickson, Massey & Cronan, 1993; Subramanian, 1994; Szajna,. Ch. i n U. v. 1994; Chin &Todd, 1995; Teo, Lim & Laia, 1999; Agarwal & Karahanna, 2000;. engchi. Moon & Kim, 2001; Heijden, 2003; Yi & Hwang, 2003; Hsu & Lu, 2004; Lee, Cheung, & Chen, 2005; Saade, & Bahli, 2005; Saade, Nebebe & Tan, 2007). Nevertheless, findings of the studies that investigate these two cognitive beliefs are considered relatively insufficient and inconsistent (Karahanna & Straub, 1999; Legris, Ingham & Collorette, 2003). That is why many studies have extended the theoretical framework of TAM, adding several external variables to the key determinants of user behavior intention, which are perceived usefulness and perceived ease of use. There is a number of studies that modify the traditional technology acceptance model and combine it with the theory of reasoned action (Lewis, Malhotra 17.
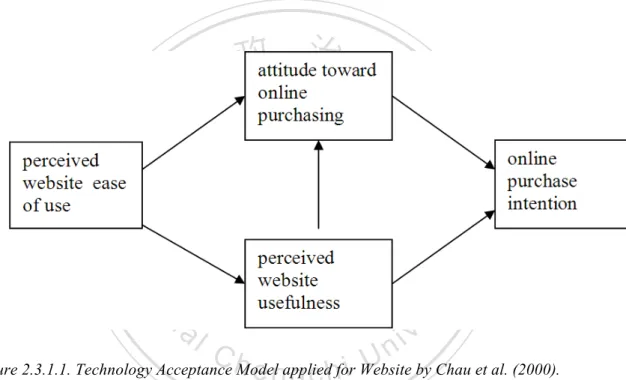
(28) & Galletta, 1999; Bhattacherjee, 2001; Agarwal & Sambamurthy, 2003; Chung, 2005a; Chung, 2005b; Cavusgil, 2007; Elliott & Fu, 2008).. 2.3.1. Technology Acceptance Model Applied for Website Based on Davis’ Technology Acceptance Model (TAM), Chau et al. (2000) constructed a model applied for the e-commerce context. Adapting TAM to the Website environment implies that the more useful a website is, the more positive the attitude about purchasing at the website (Chau et al., 2000).. 立. 政 治 大. •. • 國. Ᏸ. n. er. io. sit. y. Nat. al. Ch. engchi. i n U. v. Figure 2.3.1.1. Technology Acceptance Model applied for Website by Chau et al. (2000).. 2.4. Internet Experience and Internet Heavy Users This research is going to utilize Technology Acceptance Model applied for Website (Chau et al., 2000) with some elements of Theory of Reasoned Action (Azjen and Fishbein 1980) and examine the online shopping behavior of Internet heavy users. According to Assael (2005), heavy Internet users are those surfing the web for 20 hours a week or more. Heavy Internet users go online for many purposes and on that basis researchers as well as marketers make a classification of heavy users. For example, Assael distinguishes six types of heavy Internet users: Web Generalists 18.
(29) (those who frequently use emails, seek information and purchase online), Downloaders (those who download software and music), Self-Improvers those who search for jobs, collect information and read news), Entertainment Seekers (those who play online games), Traders (those who make stock transactions) and Socializers (those who participate in chat forums). Other studies make different typology of Internet heavy users. According to PEW Internet and American Life Project (2005), there are four types of online users: Newcomers (those who are online for less than a year and usually play games and sent instant messages), Experimentals (those who are online for one or two years and. 政 治 大. usually getting product information and news), Utilitarians (those who are online for. 立. three or more years and tend to use the web as a tool for work-related research) and. • 國. Ᏸ. Netizines (those who are the earliest Internet adopters who go online daily for work and play).. •. According to the Burson-Marsteller, there is a very influential group of. y. Nat. io. sit. Internet users called E-fluentials. They tend to be very socially active online. They. n. al. er. usually give recommendations, make friends online, send emails, make business. Ch. i n U. v. contacts online, express negative opinions, participate in chat rooms, seek information. engchi. from many sources and post information online (Burson-Marsteller). Usually researchers describe profiles of Internet users by age, gender, lifestyle and Internet usage. Some studies also report the association between web user characteristics and online shopping. For example, studies by Bhatnagar et al. (2000) and also Alreck and Settle (2002) investigate the effects of gender on online buying behavior. The key component of this study is the Internet experience. While browsing the Web, users gain experience in Internet use. Moreover, their opportunities to shop online are expected to increase (Shiu & Dawson, 2002). According to Citrin, Sprott, 19.
(30) Silverman, and Stem (2000), consumers who are frequently using the Internet for means other than shopping (such as for communication, education, or entertainment), are more likely to adopt the Internet for shopping. In their study, they used the number of weekly hours of Internet use as a predictor of online buying behavior. The more hours that a consumer spends browsing the Internet lead to a higher probability of being exposed to online advertisements. Also, more exposure means more online buying. Advertisement studies already documented the effect of exposure (Cacioppo & Petty, 1979), so it should function similarly in the online environment (Merrilees, 2001).. 政 治 大. While web browsing frequency is a relevant factor of consumer’s online. 立. shopping behavior, the overall Internet usage in terms of years is also important.. • 國. Ᏸ. Kuhlmeier and Knight (2005) found that Internet surfing hours per week as well as years of usage are positively related to the likelihood of purchasing online. Finally,. •. Swinyard and Smith (2003) reported that online shoppers compared with non-. y. Nat. io. sit. shoppers spend more time on their computer and spend more time on the Internet. In. n. al. er. this research the two groups of heavy Internet users and regular Internet users have been analyzed and compared.. Ch. engchi. 20. i n U. v.
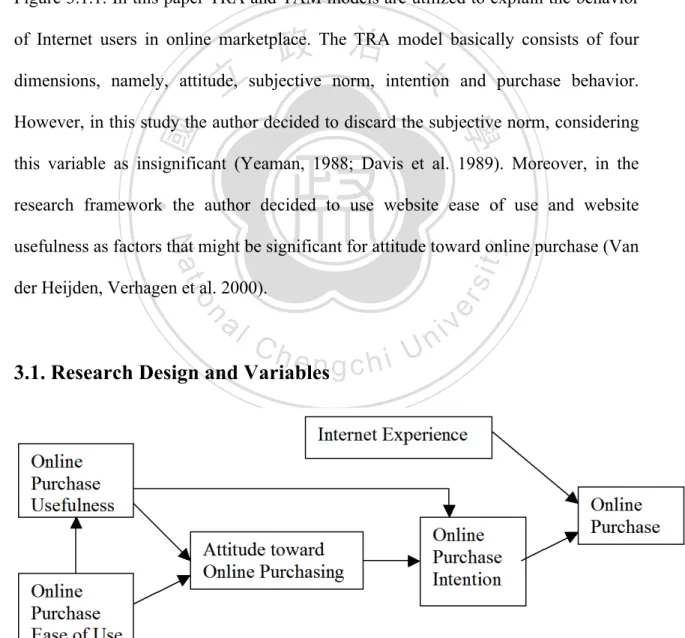
(31) CHAPTER THREE METHODOLOGY Based on the theoretical components of the TRA and TAM for Websites with regard to users Internet experience, this study develops a research model as shown in Figure 3.1.1. In this paper TRA and TAM models are utilized to explain the behavior. 政 治 大 dimensions, namely, attitude, subjective norm, intention and purchase behavior. 立 of Internet users in online marketplace. The TRA model basically consists of four. • 國. Ᏸ. However, in this study the author decided to discard the subjective norm, considering this variable as insignificant (Yeaman, 1988; Davis et al. 1989). Moreover, in the. •. research framework the author decided to use website ease of use and website. Nat. sit. y. usefulness as factors that might be significant for attitude toward online purchase (Van. n. al. er. io. der Heijden, Verhagen et al. 2000).. Ch. e. ngch 3.1. Research Design and Variables. Figure 3.1.1. Research framework.. 21. i. i n U. v.
(32) 3.1.1. Online Purchase Ease of Use Developed by Davis (1989) and extended by Venkatesh and Davis (2000) Technology Acceptance Model suggests a relation of two factors: usefulness of an information system and ease of use of the system. More useful systems and those that are easier to use are associated with higher acceptance of the information system. According to the Technology Acceptance Model for Websites (Chau et al., 2000), there is a positive relationship between perceived ease of use and perceived usefulness as well as between ease of use and attitude toward online purchasing. Adapting TAM to an e-commerce context implies that the more easy the process of online purchasing. 政 治 大. is, the more it is useful and the more positive the attitude about purchasing online.. 立. Therefore, it leads to the first set of hypotheses:. • 國. usefulness.. Ᏸ. H1a:. Online purchase ease of use is positively related to online purchase. •. H1b: Online purchase ease of use is positively related to attitude toward online. n. al. er. io. sit. y. Nat. purchasing.. Ch. 3.1.2. Online Purchase Usefulness. engchi. i n U. v. In general, websites that offer greater purchasing speed and convenience are more useful than those that are not (Van der Heijden, Verhagen et al. 2001). Also according to TAM, there is a positive relationship between perceived usefulness and attitude toward using IT. Therefore, the more online shopping is useful, the more positive the online purchase intention and the attitude toward online purchasing. Thus, it leads to the next set of hypotheses: H2a: Online purchase usefulness is positively related to online purchase intention.. 22.
(33) H2b: Online purchase usefulness is positively related to attitude towards online purchasing.. 3.1.3. Attitude towards Online Purchasing In this research framework, the relation between attitude towards online purchasing and online purchase intention come from the idea of TRA model. This conforms the general relation between attitudes and intentions that the Theory of Reasoned Action predicts, and is consistent with prior online purchase models (Jarvenpaa, Tractinsky et al. 2000). Therefore, Hypothesis 3 is raised:. 政 治 大. H3: Attitude towards online purchasing is positively related to online purchase. 立. intention.. • 國. Ᏸ. 3.1.4. Subjective Norm. •. According to the Theory of Reasoned Action, consumers will intend to. y. Nat. io. sit. perform a behavior when they evaluate it positively and when they believe that others. n. al. er. think they should perform it (Ajzen & Fishbein, 1980). However, studies (Davis et al.. Ch. i n U. v. 1989; Yeaman, 1988) reported that in the IT environment there is a lack of. engchi. significance of subjective norms. Therefore, considering those studies, the author omitted the subjective norm from the research framework.. 3.1.5. Online Purchase Intention Similarly to attitude towards online purchasing, online purchase intention comes down from TRA theory applied in e-commerce. This theory predicts the general relation between online purchase intention and online customer behavior, which is the actual purchase online. As a result, Hypothesis 4 is thus developed: H4: Online purchase intention is positively related to online purchase. 23.
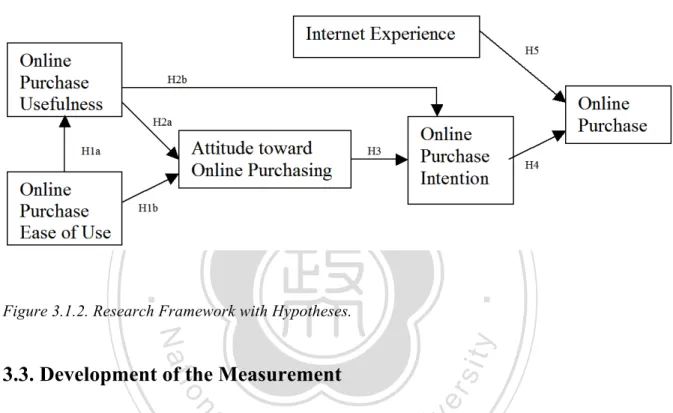
(34) 3.1.6. Internet Experience and Heavy Internet Users In general, the more people use the Internet, the more experienced they are. Correspondingly, the more experienced and knowledgeable consumers are, the more they tend to buy online (Kuhlmeier & Knight, 2005). Therefore, it is conjectured that Internet experience in hours per week should be positively associated with the likelihood of an Internet purchase. Thus, hypothesis 5 is proposed: H5: Internet user experience is positively related to online purchase. And as a result, hypothesis 6 is developed:. 政 治 大. H6: Heavy Internet users buy online more often than regular Internet users.. 3.2. Research Framework and Hypotheses. Ᏸ. • 國. 立. hypotheses:. •. Summarizing, based on the literature review, this study proposes following. y. Nat. er. io. usefulness.. sit. H1a: Online purchase ease of use is positively related to online purchase. al. n. iv n C H1b: Online purchase ease ofhuse is positively related e n g c h i U to attitude toward online purchasing.. H2a: Online purchase usefulness is positively related to online purchase intention. H2b: Online purchase usefulness is positively related to attitude towards online purchasing. H3: Attitude towards online purchasing is positively related to online purchase intention. H4: Online purchase intention is positively related to online purchase.. 24.
(35) H5: Internet user experience is positively related to online purchase. H6: Heavy Internet users buy online more often than regular Internet users.. Overall, Figure 3.2.1 shows the relationship among variables and the stated hypothesis.. 立. 政 治 大. •. • 國. Ᏸ. Figure 3.1.2. Research Framework with Hypotheses.. sit. y. Nat. n. al. er. io. 3.3. Development of the Measurement. i n U. v. To examine the model it is needed to check the relationships between each. Ch. engchi. related factors and to confirm or deny hypotheses. All the hypotheses contained in this paper are supported by theories or references. To measure the relationship between variables the various data about the consumer online behavior was collected. An online survey questionnaire was developed to obtain the responses from online users about their opinion on Internet-based purchasing. The questionnaire was anonymous.. 25.
(36) 3.3.1. Operationalization of Variables Most of the questions in the questionnaire were adopted and adapted from previous studies. Table 3.3.1 below shows the references of measures used for each variable.. Table 3.3.1. Operationalization of variables and their sources Construct. Item. Source. Internet. 1. How long have you been going online?. Goldfarb & Prince. experience. Less than 6 months 6 months to less than 1 year 1 year to less than 2 years 2 years to less than 3 years 3 years to less than 4 years 4 years to less than 5 years 5 years or more. 政 治 大 Ᏸ. • 國. 立. (2008). 2. How many hours each week do you spend. •. online?. sit. n. er. io. al. y. Nat. Less than 5 hours 5-10 hours 10-15 hours 15-20 hours 20-25 hours 25-30 hours More than 30 hours. Ch. engchi. i n U. v. Online. 1. Have you ever shopped online?. purchase. 2. On average, how often do you buy online?. frequency. Never/almost never Less than once a month About once a month, A few times a month, A few times a week, About once a day, Several times a day.. 26. Teo, Lim, Lai (1997).
(37) Construct. Item. Source. Online. E1. Using the Internet to purchase would be. Davis (1989);. Purchase. easy to learn for me.. Crespo et al. (2009);. Ease of use. E2. Using the Internet to purchase would be easy to do for me. E3. Using the Internet to purchase would require a lot of mental effort. E4. Using the Internet to purchase would be easy following the instructions provided in virtual shops.. Online Purchase Usefulness. 治 政 U1. Using the Internet to purchase 大 would 立 make shopping easier Using the Internet to purchase…. Davis (1989); Crespo et al. (2009);. useful to get better purchases. Nat. al. er. io. enhance my shopping effectiveness. sit. U4. Using the Internet to purchase would. y. U3. Using the Internet to purchase would be. •. • 國. enable me to shop more quickly. Ᏸ. U2. Using the Internet to purchase would. v ni. A1. Using the Internet to buy a product or. towards. service would be a good idea.. Online. A2 . The idea of using the Internet to buy a. Limayem,. Purchasing. product of service is appealing.. (2002);. n. Attitude. Ch. engchi U. Heijden et al. (2001; 2003); et. al.. A3 . I like the idea of buying a product or service on the Internet. Online. I1. I would use online shop rather than. Heijden. et. Purchase. traditional shop to purchase goods.. (2003);. Intention. I2. In the next 3 months I plan to use the. Mathieson (1991);. Internet to buy things.. Crespo et al. (2009);. I3. In the next 3 months I will not use the. Taylor. Internet to purchase.. (1995); Limayem, et. and. al. (2002);. 27. al.. Todd.
(38) 3.3.2. Dependent Variables and Independent Variables The research involves four dependent variables: usefulness, attitude toward online purchasing, online purchase intention and online customer behavior, which is the actual purchase on the Internet. There are two independent variables in the research model: ease of use and Internet experience. The research also reports the influence of consumer’s demographics and consumer’s Internet experience on online behavior (independent variables).. 3.3.3. Questionnaire. 立. 政 治 大. The content of the questionnaire, including the ranging or the scale, is shown. • 國. Ᏸ. in Appendix1. All questions in the survey were required in order to avoid missing variables. If the respondent did not answer one of the questions, he/she was not able to. •. finish the survey. During the survey, only those respondents who checked a positive. y. Nat. io. sit. answer regarding the question “Have you ever shopped online?” could proceed to the. n. al. er. next questions about online purchase experience. Those respondents who have never. Ch. i n U. v. purchased any goods or services online were moved to the next section of the. engchi. questionnaire, namely personal data. Only those respondents who have bought products or services on the Internet were studied. The questionnaire consisted of six constructs (composed in total of 16 items): 1. Internet experience – composed of two questions about Internet usage experience in years and the user’s frequency of Internet use in hours per week; 2. Online purchase frequency – composed of two questions about the previous buying experience and frequency;. 28.
(39) 3. Online Purchase Ease of use – composed of four questions about the easiness of Internet shopping. Items were validated by Davis (1989) and Crespo et al. (2009); 4. Online Purchase Usefulness – composed of four questions about the usefulness of Internet shopping. Items were validated by Davis (1989) and Crespo et al. (2009); 5. Attitude towards Online Purchasing– composed of three questions about the idea of buying online. Items were validated by Heijden et al. (2001; 2003) and Limayem et al. (2002). Seven point Likert scale ranging from. 政 治 大. “strongly agree” to “strongly disagree” is used to measure the items.. 立. 6. Online Purchase Intention – composed of three questions about the. • 國. Ᏸ. Internet-based purchase intention in the next 3 months. Items were validated by Mathieson (1991), Taylor and Todd (1995), Limayem, et al.. •. (2002), Heijden et al. (2003) and Crespo et al. (2009). Seven point Likert. y. Nat. io. sit. scale ranging from “strongly agree” to “strongly disagree” is used to. n. al. er. measure the items.. Ch. i n U. v. The author found it relevant to also include personal data to the questionnaire. engchi. in order to make sure that our sample contained respondents from different groups. Demographical variables, such as: age, gender, education, occupation and household income, were collected to evaluate average online user and to check if they influenced purchasing behavior on the Internet. A single item that asked the respondent his/her age range measured age: “less than 18”, “18 – 24”, “25 – 34”, “35 – 44”, “45 – 54”, “55 – 64” and “65 or more”. Respondents reported their gender on a single-item dichotomous variable that asked them whether they were male or female. Education was measured by a single item that asked about education level of respondent: “elementary”, “secondary” and “higher 29.
(40) education”. A single item measured occupation: “student”, “unemployed”, “IT related” and “non IT related”. Household income was measured by a single item that asked the respondent his monthly income in PLN. The scale ranged from “no income”, “below 1500 PLN (500 USD)”, “1500 PLN - 3000 PLN (500 USD - 1000 USD)“, „3000 PLN - 5000 PLN (1000 USD - 1750 USD)”, “5000 PLN - 10 000 PLN (1750 UDS - 3500 USD)” and “above 10 000 PLN (3500 USD)”. For the purpose of the study the author decided to utilize average exchange rate to present the data in USD.. 政 治 大. 3.3.4. Validity and Reliability. 立. Validity means the correctness of the instrument. It maybe considered as the. • 國. Ᏸ. degree that the scale can really testify the variable quality, which is, the efficiency of the questionnaire. Content validity requires the researcher to use the correct measures. •. for the concepts being studied. In the present study, the variables and the scales are. y. Nat. io. sit. derived from related theories and existing literature so the level of validity can be. n. al. er. assumed. Thus, content validity of the research can be ensured.. Ch. i n U. v. Reliability represents the extent to which other researchers would have the. engchi. same findings if they were to analyze the same data and methods (Yin, 2003). All questionnaire items were tested using Cronbach’s alpha coefficient, which is the most frequently used estimate of internal consistency. Thus, items demonstrate internal consistency reliability Cronbach’s alpha, and also internal and external validity, according the previous researches.. 30.
(41) 3.4. Data Collection and Sampling Population Participants of this study were Internet users in Poland. Primary data were obtained through online survey, which was posted on an online shop website for two weeks from 4th until 15th of July 2011. The respondents were customers or just browsers of the online shop, and they could participate in the survey by clicking the link redirecting to the web-based survey platform. The present study employed convenience (non-probability) sample.. 3.5. Data Analysis Techniques. 治 政 In order to achieve the goals of this research大 and test the hypotheses, the 立 statistical software SPSS 15.0 has been employed to analyze the collected data. • 國. Ᏸ. Several statistical tests were applied to analyze the data. Descriptive statistic analyses,. •. particularly frequency and percentage have been used to illustrate the means, and. sit. y. Nat. standard deviation of each research variable in order to understand their characteristic.. io. er. To assess the degree of internal consistency among questionnaire items, Cronbach's. al. alpha coefficient is reported. Confirmatory factor analysis was performed to identify. n. iv n C U correlation coefficient has instrument validity and refinement.hThe e nSpearman's g c h i rank been applied to analyze the relationship between the variables were also applied.. 31.
(42) CHAPTER FOUR DATA ANALYSIS AND FINDINGS This chapter describes the analysis of data followed by a discussion of the research findings. The findings relate to the research questions that guided the study. Data were analyzed to identify, describe and explore the relationship between Internet. 政 治 大 shopping and online purchase intention. Furthermore, some additional tests to cover 立. experience, online shopping ease of use and usefulness, attitude towards Internet. • 國. Ᏸ. other parts of the theoretical framework were performed o find other factors that may be of influence to the results and to check consistency in the answers.. •. Nat. sit. y. 4.1. Sample Structure. n. al. er. io. A total of 236 responses were received, however, 226 responses are usable for. i n U. v. this study and meet the requirements. Remaining 10 responses are invalid, because. Ch. engchi. respondents have never bought goods or services online. Below is the analysis according to gender, age, educational background, occupation, monthly income, and average weekly Internet usage of the 226 e-shoppers. Next, there is a summarizing table with the characteristics of the respondents (Table 4.1). Gender Out of 226 respondents, 127 are women (56,2%) and 99 are men (43,8%).. 32.
(43) Age The 226 participants are clustered into seven age groups, namely: “less than 18”, “18 to 24”, “25 to 34”, “35 to 44”, “45 to 54”, “55 to 64” and “65 or more”. There is only one respondent under 18 years, which accounts for 0,4%. In the age group “18 to 24” there are 46 respondents, which accounts for 20,4%. The majority of respondents falls into the age group of 25 to 34 years. In this group there are 119 respondents, which is more then half of the sample size and accounts for 52,7%. In the group age of 35 to 44 there are 33 respondents, which accounts for 14,6%. There are 15 respondents in the group age of 45 to 54, which accounts for 6,6%. In the last two. 政 治 大. groups, “55 to 64” and “65 or more”, there are 9 and 3 respondents respectively,. 立. which accounts for 5,3% in total.. •. • 國. Ᏸ. Education. The level of education was divided into three groups: “elementary”,. y. Nat. io. sit. “secondary” and “higher education”. Among 226 respondents, only one falls into the. n. al. er. “elementary education” group (0.4%). There are 47 respondents in the group of. Ch. i n U. v. “secondary education”, which accounts for 20,8%. The majority, which is 178 of. engchi. respondents, are found in the “higher education” group – 78,8% of the sample.. Occupation Occupation is identified by 4 items: “student”, “unemployed”, “IT related” and “non IT related”. Among the respondents, there were 45 students, which accounts for 19,9%. 6 of the respondent reported to be unemployed (2,7%). There are 15 respondents working in the IT field (6,6%). And the majority of respondents indicated to have non-IT related work. This group consists 160 respondents, which accounts for 70,8% of the sample. 33.
(44) Monthly Income Monthly income was divided into six groups: “no income”, “below 500 USD”, “500 - 1000 USD”, “1000 - 1750 USD”, “1750 - 3500 USD” and “above 3500 USD”. There are 38 of respondents who reported to have no income, which accounts for 16,8%. The majority of respondents fall into the range between 500 and 1000 USD. In this group there are 75 respondents, which accounts for 33,2%. The next group consists of 57 respondents, whose monthly income ranges between 1000 and 1750 USD (25,2%). Among the respondents, there are 28 reporting 1750 to 3500 USD of. 政 治 大. monthly income, which accounts for 12,4%. There are only 7 respondents earning. 立. monthly above 3500 USD – 3,1% of the sample.. • 國. Ᏸ. Average Weekly Internet Usage. •. Participants reporting hours spent on the Internet per week, where clustered. y. Nat. io. sit. into seven groups: “less than 5 hours”, “5 to 10 hours”, “10 to 15 hours”, “15 to 20. n. al. er. hours”, “20 to 25 hours”, “25 to 30 hours” and “more than 30 hours per week”. Only. Ch. i n U. v. 19 respondents use the Internet less than 5 hours per week (8,4%). There are 35. engchi. respondents who indicated the weekly internet usage in range between 5 and 10 hours, which accounts for 15,5%. Into the next group “10 to 15 hours” fall 23 participants (10,2%). The next group “15 to 20 hours” consists of 29 respondents (12,8%). Following are the groups of heavy internet user. There are 26 respondents, who use the Internet for 20 to 25 hours per week, and 27 respondents who use the Internet for 25 up to 30 hours per week, which accounts for 23,4% in total. The last group, but not the least, is the group of 67 participants, who weekly spend more than 30 hours surfing the web (29,6% of the sample).. 34.
(45) Online Buying Frequency Online buying frequency were ranged from “Never/almost never”, “Less than once a month”, “About once a month”, “A few times a month”, “A few times a week”, “About once a day” to “Several times a day”. 10 respondents reported that they never or almost never buy online (4,4%). There are 75 respondents, who buy on the Internet less than once a month, which accounts for 33,2%. 60 respondents shop online about once a month, which is 26,5%. 65 respondents purchase products or services via Internet a few times a month, which is 28,8%. There are 12 respondents who shop. 政 治 大. online a few times a week (5,3%). There are 2 e-shoppers who buy online about once. 立. a day and 2 e-shoppers who buy online several times a day, which accounts for 1,8%. •. • 國. Ᏸ. in total.. Table 4.1 Characteristics of respondents (total = 226). sit. Percentage (%). er. al. n. Male. io. Female. y. Nat Gender. Number of respondents. Ch. 99. e n g c127h i. i n U. v. 43.8 56.2. Age Less than 18. 1. 0.4. 18 - 24. 46. 20.4. 25 - 34. 119. 52.7. 35 - 44. 33. 14.6. 45 - 54. 15. 6.6. 55 - 64. 9. 4.0. 65 or more. 3. 1.3. 35.
(46) Number of respondents. Percentage (%). Education Elementary. 1. 0.4. Secondary. 47. 20.8. Higher education. 178. 78.8. Student. 45. 19.9. Unemployed. 6. 2.7. IT related. 15. 6.6. Non IT related. 160. 70.8. Occupation. Income No income Below 500 USD. 立. 政3821 治 大. 9.3. 75. 33.2. 1000 USD - 1750 USD. 57. 1750 UDS - 3500 USD. 28. Above 3500 USD. 7. •. Less than 5 hours. 19. y. Ᏸ. • 國. 500 USD - 1000 USD. 16.8. 5 - 10 hours. 35. n. 20 - 25 hours. Ch. e 29 ngchi U. sit. io. 15 - 20 hours. 23. 8.4. er. Nat. al. 12.4 3.1. Hours online per week. 10 - 15 hours. 25.2. v ni. 15.5 10.2 12.8. 26. 11.5. 25 - 30 hours. 27. 11.9. More than 30 hours. 67. 29.6. Never/almost never. 10. 4.4. Less than once a month. 75. 33.2. About once a month. 60. 26.5. A few times a month. 65. 28.8. A few times a week. 12. 5,3. About once a day. 2. 0.9. Several times a day. 2. 0.9. Online buying frequency. 36.
(47) Heavy Internet users and Regular Internet users As a result of the analysis of the online buying frequency, there are two key groups within the sample: 106 (46,9%) of regular Internet users, those who use the Internet less than 20 hours per week and heavy Internet users 120 (53,1%), those who use the Internet more than 20 hours per week (Table 4.2).. Table 4.2 Heavy and Regular Internet users (total = 226) Number of respondents Percentage (%). Heavy Internet users Regular Internet users. 立. 政120 治 大 106. 53.1% 46.9%. • 國. Ᏸ •. 4.2. Measurement Model. sit. y. Nat. Measures of all constructs were developed following standard research. n. al. er. io. procedures. Multi-item scales were developed based on previous measure and a. i n U. v. review of existing literature. After an initial data screening, one item was dropped.. Ch. engchi. The answer for the question about the Internet usage experience in years was the same. All respondents has been using the Internet for more than 5 years, so this item was dropped by the author. In the questionnaire respondents replied to the items using a 7-point Likert scale rating from 1 – “Strongly Agree” to 7 – Strongly Disagree”. Most of the items in the questionnaire’s constructs were generated, so that strong agreement means favorable disposition to the construct. However, three of the items were phrased in the reverse. In order to make the items (“On average, how often do you buy online?”, “In the next 3 months I will not use the Internet to purchase.” and “Using the Internet 37.
(48) to purchase would require a lot of mental effort.”) comparable to the other items, the author had to perform the reverse-scoring. All items measuring the five constructs of online shopping behavior were submitted to factor analysis, in order to assess the internal consistency of the scales. The results of the analysis are provided in Table 4.2. Factor loadings estimate the validity of observed variables and they show whether the measure items represent their underlying constructs. The results showed that 12 items out of 14 items for the five constructs conformed to the accepted minimum factor loading of 0.60 (Nummally, 1978). All 12 factor loadings were significant and ranged from 0.638 to. 政 治 大. 0.897. Two items (both in the Online Purchase Usefulness scale) scored 0.549 and. 立. 0.584, which is above Nunnally and Bernstein’s (1994) suggested cutoff of 0.4.. • 國. Ᏸ. Moreover, item I1 (I would use online shop rather than traditional shop to purchase goods) was weakly correlated with other items in the Online Purchase Intention factor. •. and was removed from subsequent analyses.. y. Nat. io. sit. In addition to construct validity, the internal consistency and dependency of. n. al. er. the measurement model was performed by computing Cronbach’s alpha – the. Ch. i n U. v. reliability coefficient. Internal consistency reliability is the degree to which multiple. engchi. measures of the same thing agree with one another. It determines how consistently the selected items measure the construct. In the present study, Cronbach’s alpha value scored between 0.752 and 0.890, which is above 0.700 – an acceptable value for a research instrument (Sekaran, 2000; Leech, Barrett, Morgan; 2005).. 38.
(49) Table 4.3 Factor loadings and reliabilities of measurement scale Measurement Items. Item Crobach’s Alpha. Online Purchase Ease of Use. E1. Online Purchase Usefulness. Attitude. towards. Purchasing. 0.771 0.781. E3. 0.638. E4. 0.697 0.817. 0.584. U2. 0.549. U3. 0.793. U4. 0.811. 政 A1 治 0.890 大. 0.833. A2. 0.813. Ᏸ. • 國. 立. 0.725. E2. U1. Online. A3. Online Purchase Intention. I2. 0.710. 0.745 0.733. •. I3. 0.897. n. er. io. sit. y. Nat 4.3. Hypotheses Testinga l. Factor Loadings. Ch. engchi. i n U. v. To begin with relationship between the variables connected to the main hypotheses (H1-H5) the Spearman's rank correlation coefficient was tested, because the variables were not normally distributed. The demographic data was explored with descriptive analysis, as were the mean values of online purchase ease of use, usefulness, attitude and intention. Significance in differences of Internet heavy users and regular users (H6) was tested using the Mann Whitney U test.. 39.
(50) Hypotheses 1a Online purchase ease of use and online purchase usefulness were measured using a four-item constructs, with all items measured on a 7 point Likert scale. The Spearman's rank correlation coefficient was run to determine the relationship between those two variables. There was a strong, positive correlation between ease of use and usefulness, which was statistically significant (ρ = .438, n = 226, P < .000). That means the more individuals think the online purchase is easy to use, the more they think it is useful. Thus, the Hypotheses 1a is supported. The Table 4.3.1 shows the results of the correlation.. 政 治 大. 立. Table 4.3.1 Online purchase ease of use and online purchase usefulness: Correlation. 1. Online Purchase Ease of Use. –. Nat. Mean. 1.87. er. al. n. SD. sit. 0.438**. io. 2. Online Purchase Usefulness. y. • 國. 1. •. Variables. Ᏸ. and Descriptive Statistics (N = 226). Ch. i n U 0.90. engchi. ** Correlation is significant at the 0.01 level (1-tailed).. v. 2. – 2.42 1.09. Hypotheses 1b Attitude toward online purchasing was tested using a three-item construct, with all items within the measure using a 7 point Likert scale. To test the correlation between online purchase ease of use and attitude towards online purchasing the Spearman's rank correlation coefficient was performed. The results show that there is a moderate, positive correlation (ρ = .386, n = 226, P < .000) between the online purchasing ease of use and the individual’s attitude toward online purchasing. That. 40.
(51) means, E-shoppers who think online shopping is easy, have positive attitude towards online purchase. Therefore, Hypotheses 2a and 2b are accepted. The table 4.3.2 shows the results of the correlation.. Table 4.3.2 Online purchase ease of use and attitude toward online purchasing: Correlation and Descriptive Statistics (N = 226) Variables. 1. 1. Online Purchase Ease of Use. –. 2. Attitude toward online purchasing. 0.532**. Mean. 立. SD. 2. –. 1.87 政 治 大 0.90. • 國. •. Hypothesis 2a and 2b. 0.95. Ᏸ. ** Correlation is significant at the 0.01 level (1-tailed).. 1.77. sit. y. Nat. The correlation between online purchase usefulness and attitude toward online. io. er. purchase, as well as, online purchase usefulness and online purchase intention (two-. al. item construct) were tested with the Spearman's rank correlation. There was strong,. n. iv n C h eand positive correlation between usefulness n gattitude c h i (ρU= .645, n = 226, P < .000), as well as, between usefulness and online purchase intention (ρ = .574, n = 226, P < .000). That infers the more individuals perceive online purchase useful, the more they intend to buy and they have positive attitude toward online purchasing. Thus, Hypotheses 2a and 2b are supported. Table 4.3.3 and Table 4.3.4 show the results of the correlation.. 41.
(52) Table 4.3.3 Online purchase usefulness and attitude toward online purchasing: Correlation and Descriptive Statistics (N = 226) Variables. 1. 2. 1. Online Purchase Usefulness. –. 2. Attitude toward online purchasing. 0.645**. –. Mean. 2.42. 1.77. SD. 1.09. 0.95. ** Correlation is significant at the 0.01 level (1-tailed).. 政 治 大. 立. Table 4.3.4 Online purchase usefulness and online purchase intention: Correlation. 1. 1. Online Purchase Usefulness. •. Variables. –. Nat. Mean. 2.42. er. al. n. SD. sit. 0.574**. io. 2. Online purchase intention. y. • 國. Ᏸ. and Descriptive Statistics (N = 226). Ch. i n U 1.09. engchi. ** Correlation is significant at the 0.01 level (1-tailed).. v. 2. – 2.69 1.37. Hypothesis 3 Hypothesis 3 proposed that attitude towards online purchasing is positively related to online purchase intention. According to the Spearman's rank correlation, there was strong, positive correlation (ρ = .532, n = 226, P < .000). This implies that the more positive attitude toward online purchasing have the individuals, the more they intend to purchase online. Therefore, the Hypothesis 3 is sustained. The table 4.3.5 shows the results of the correlation.. 42.
(53) Table 4.3.5 Attitude toward online purchasing and online purchase intention: Correlation and Descriptive Statistics (N = 226) Variables. 1. 2. 1. Attitude toward online purchasing. –. 2. Online Purchase Intention. 0. 532**. –. Mean. 1.77. 2.69. SD. 0.95. 1.37. ** Correlation is significant at the 0.01 level (1-tailed).. 立. Hypothesis 4. 政 治 大. • 國. Ᏸ. Hypothesis 4 tests the relationship between online purchase intention and the actual online purchase. Online purchase was measured on a 7 point Likert scale,. •. starting with “Never/almost never”, “Less than once a month”, “About once a month”,. y. Nat. sit. “A few times a month”, “A few times a week”, “About once a day” to “Several times. n. al. er. io. a day”. The Spearman's rank correlation coefficient was performed to determine the. i n U. v. relationship. There was strong, negative correlation (ρ = -.592, n = 226, P < .000). Ch. engchi. between online purchase intention and the online purchase. The negative correlation resulted from the design of the construct, which was not reverse scored. After the transformation of the variable’s score the correlation became positive. The results show that individuals, who intend to buy online, buy frequently. Thus, the Hypothesis 4 is accepted. The table 4.3.6 shows the results of the correlation.. 43.
(54) Table 4.3.6 Online purchase intention and online purchase: Correlation and Descriptive Statistics (N = 226) Variables. 1. 2. 1. Online Purchase Intention. –. 2. Online Purchase. 0.592**. –. Mean. 2.69. 4.96. SD. 1.37. 1.11. ** Correlation is significant at the 0.01 level (1-tailed).. Hypothesis 5. 政 治 大 Internet user experience was measured in number of hours on the Internet per 立 • 國. Ᏸ. week. The Hypothesis 5 suggests there is a positive relationship between the internet user experience and online purchase behavior. According to the Spearman's rank. •. correlation (ρ = -.211, n = 226, P < .000), there is weak correlation. Therefore, the. al. er. io. sit. y. Nat. Hypothesis 5 is not supported. The table 4.3.7 shows the results of the correlation.. n. Table 4.3.7 Internet user experience and online purchase: Correlation and Descriptive Statistics (N = 226). Ch. engchi. i n U. v. Variables. 1. 1. Internet user experience. –. 2. Online Purchase. - 0.211**. –. Mean. 4,58. 4.96. SD. 2,10. 1.11. ** Correlation is significant at the 0.01 level (1-tailed).. 44. 2.
數據
+7
相關文件
The study was based on the ECSI model by Martensen et al., (2000), combined with customer inertia as a mediator in the hope of establishing a customer satisfaction model so as
The usage of computer and Internet has provided a passageway to satisfy the needs.The purpose of this study is to probe into the Internet usage/online behavior and Internet
To understand the Internet addiction behaviors, this study inquires the personal and family related factors, online experience related factors, interpersonal interactions
In this study, Technology Acceptance Model (TAM 2) is employed to explore the relationships among the constructs of the model and website usage behaviors to investigate
Y., (1999), “Examining the technology acceptance model using physician acceptance of telemedicine technology,” Journal of Management Information Systems, Vol. and Baroudi,
As the number of Internet users rapidly grows, it has become increasingly important that online auction need to provide rich and diverse information and service for
The purpose of this research is using the UET to combine the GIS(Geographic Information Systems)and utilize the resources characteristic and land of understanding, to look for
早在二戰前就出現在歐洲,但其潛力目前尚未 受到社會科學的重視。 2000左右介紹進美國之 後,已經應用在 語言學 的研究中,成為該學門 中的重要研究方法( Glynn, et al.,
