工作滿意與工作績效關係之影響︰以工作投入為變項
60
0
0
全文
(2) Linking Job Satisfaction to Job performance: The Mediator of Work Engagement. Abstract. This study adds to understanding of how job satisfaction affects job performance. Prior studies indicated the direct effect that job satisfaction has on job performance. This study suggests the mediating effect of work engagement on the relationship between job satisfaction and job performance. Results of this experimental study support a mediating effect where enhanced job satisfaction leads to increase in work engagement, and therefore enhances job performance. Implications for increasing and maintaining job performance are discussed.. Key Words: job satisfaction, work engagement, job performance.. i.
(3) 工作滿意與工作績效關係之影響︰ 以工作投入為中介變項. 摘要. 過去研究發現工作滿意對工作績效有直接正向的影響,然而,工作滿意如何影響 工作績效仍是模糊的,因此本研究將試圖探索工作滿意如何去影響工作績效的過 程。最近十年來,新議題-工作投入已經逐漸有研究開始討論。本研究想了解員 工心理享受及快樂程度品質的工作狀態是否會引導更深一層專注力及快樂投入 於工作中。更進一步來說,員工有高度工作投入會傾向專注於工作中,並且會有 較好的產出,因此,這些員工通常會有較佳的工作績效。因此,本研究建議工作 投入可能是工作滿意與工作績效之間的中介變項。研究結果可以發現,正向的工 作滿意透過高度的工作投入可以使得工作績效正向增加,因此管理者透過正向工 作滿意並運用工具去培養出對工作投入的員工,進而達到好的績效表現。. 關鍵字:工作滿意、工作投入、工作績效. ii.
(4) 誌謝 本論文得以順利完成,首先要感謝的是我的恩師-吳毓麒博士,老師廣博豐 富的學養與謙沖親和的個性以及在整個研究所生涯的諸多關懷與包容,經畢生永 銘於心。此外,還要感謝所上的教授們-李揚所長與鄭育仁博士,為我奠定了從 事學術研究的基礎,您們無私的傳授知識與經驗,讓我收穫良多。感謝口試委員 蔡博士鞭辟入裡的建議,使本論文得以呈現更完整。 經營管理研究所兩年學涯中,可說是紮紮實實且過程完整的訓練,並且感謝 經管所上同學亭廷、畊宇、孟熙、智傑、美怡、柏齊熱心的幫忙與照顧,研究室 真的不能少了你們這群好朋友;謝謝課業上互相討論的冠豪、湘旻、逸涵、怡嬛、 雅婷;謝謝耕園學弟妹們華順、遠揚、瑞欣姐的平時關心、支持及論文問卷的發 放;謝謝所辦的冠婷姐對我的關愛;還要謝謝男友對我加倍的耐心,讓我得以順 利完成論文。 最後,心中最最感謝是我的爸爸媽媽,沒有他們無條件供應我讀書,無悔 的努力付出,也沒有今天的我。爸媽的支持與關懷,讓我無後顧之憂,得以專心 完成學業,真的很謝謝爸爸媽媽。. 謹誌于高雄大學經管所 九十八年六月. iii.
(5) Table of Contents Abstract .................................................................................................................... i Abstract in Chinese Version.................................................................................. ii Acknowledgements ................................................................................................. iii Table of Contents ................................................................................................... iv List of Tables .......................................................................................................... vi List of Figures........................................................................................................ vii Chapter 1 Introduction ........................................................................................... 1 1.1 Research Background and Motivation...................................................... 1 1.2 Purpose of the Study .................................................................................. 2 1.3 Procedure of the Study............................................................................... 3 Chapter 2 Literature Review .................................................................................. 4 2.1 Job Satisfaction .......................................................................................... 4 2.1.1 The Concept of Job Satisfaction ..................................................... 4 2.1.2 Theoretical Classifications of Job Satisfaction ............................... 5 2.1.3 Theories of Job Satisfaction ............................................................ 6 2.1.4 Measurement of Job Satisfaction.................................................... 7 2.2 Work Engagement...................................................................................... 8 2.2.1 Theoretical Foundation of Engagement ......................................... 8 2.2.2 Operationalization of Work Engagement....................................... 9 2.2.3 Measurement of Work Engagement ............................................. 10 2.3 Job Performance .......................................................................................11 2.3.1 The Concept of Job Performance ..................................................11 2.3.2 Classifications of Job Performance............................................... 12 Chapter 3 Methodology......................................................................................... 13 3.1 Research Model........................................................................................ 13 3.2 Research Hypotheses ............................................................................... 13 3.2.1 Relationship between job satisfaction and job performance ....... 13 3.2.2 Relationship between job satisfaction and work engagement ..... 14 3.2.3 Work engagement as a mediator of the relationship between job satisfaction and job performance.................................................. 15 3.3 Variable Definition and Questionnaire Design........................................ 15 3.3.1 Job Satisfaction.............................................................................. 16 iv.
(6) 3.3.2 Work Engagement ......................................................................... 16 3.3.3 Job Performance ........................................................................... 17 3.4 Sampling Design and Sample Data Analyses .......................................... 17 3.5 Data Analysis Methods ............................................................................ 20 3.6 Reliability Analyses .................................................................................. 21 Chapter 4 Analysis ................................................................................................ 22 4.1 Descriptive Statistics ................................................................................ 22 4.1.1 Descriptive Statistics of Job Satisfaction ...................................... 22 4.1.2 Descriptive Statistics of Work Engagement.................................. 24 4.1.3 Descriptive Statistics of Job Performance .................................... 24 4.2 Pearson Correlation Analysis .................................................................. 25 4.3 Respondent Demographics ...................................................................... 26 4.4 Regression Analyses ................................................................................. 31 4.4.1 Regression Analyses Based on Job Satisfaction and Job performance................................................................................... 31 4.3.2 Regression Analyses Based on Job Satisfaction and Work Engagement ................................................................................... 32 4.3.3 Mediation Analyses........................................................................ 34 Chapter 5 Conclusion ............................................................................................ 36 5.1 Discussion......................................................................................................... 36 5.2 Recommendation for Practical Application ................................................... 37 5.3 Future Research and Limitation..................................................................... 38 References.............................................................................................................. 40 Appendix A : Questionnaire in Chinese ............................................................... 46 Appendix B : Questionnaire in English ................................................................ 49. v.
(7) List of Tables Table 3.1: Summary of Response Rate…………………………………………...18 Table 3.2 Demographical Statistics of Sample…………………………………....19 Table 3.3 Reliability Analysis……………………………………………………...21 Table 4.1 Descriptive Statistics of Job Satisfaction……………………………....23 Table 4.2 Descriptive Statistics of Work Engagement…………………………....24 Table 4.3 Descriptive Statistics of Job Performance……………………………..25 Table 4.4 Correlation Matrix……………………………………………………....26 Table 4.5 T-test Analysis in Gender and Each Variable………………………….27 Table 4.6 T-test Analysis in Marriage and Each Variable………………………..28 Table 4.8 One-Way ANOVA in Education and Each Variable…………………..29 Table 4.9 One-Way ANOVA in Tenure and Each Variable………………………30 Table 4.10 Regression analyses for job satisfaction and job performance……...32 Table 4.11 Regression Analyses for Job Satisfaction and Work Engagement…..33 Table 4.12 Mediation analyses……………………………………………………..35. vi.
(8) List of Figures Figure 1-1: Procedure of the Study………………………………………………….3 Figure 3-1: Conceptual Framework……………………………………………….13. vii.
(9) Chapter 1 Introduction. 1.1 Research Background and Motivation Over the past ten years, positive sates are not popular in traditional psychology. Based on Myers (2000) calculated that negative emotions more than positive emotions by a ratio of 14 to 1 (Schaufeli & Bakker, 2004). Instead of looking exclusively to the negative state, researchers recently extended their interest to the positive psychology-work engagement. However, Galt (2005) reported findings from a Towers Perrin study conducted in Canada showing that seventeen per cent of employees surveyed were engaged in their jobs (Koyuncu, Burke & Fiksenbaum, 2006). Hence, work engagement has received increasing research attention in recently years. However, the relationship between work engagement and job satisfaction is unclear and lack of study. Prior studies indicated the direct effect that job satisfaction has on job performance. However, how job satisfaction affects job performance still unknown. This study tries to explore the process how job satisfaction might affect job performance. Judge, Thoresen, Bono & Patton (2001) has suggested that mood in the form of positive affect is related to both satisfaction and performance. Thus, one reason why job satisfaction might lead to job performance is because individuals who like their jobs are more likely to be in good moods at work, which in turn facilitates job performance in various ways, including creative problem solving, motivation, and other processes ( Isen & Baron, 1991). Hence, this study suggests that work engagement is the essential process to link the relationship between job satisfaction and job performance. Schaufeli & Bakker (2004) defined engagement as a positive, fulfilling 1.
(10) work-related state of mind that is characterized by vigor, dedication and absorption. The primary thrust of this study is that the enjoyment and happiness of the quality of employees’ working life (job satisfaction) will lead to deeply concentrate and happily engross in one’s work (work engagement). Moreover, people who have high work engagement tend to concentrate their attention and effort on what they are doing. Thus, those people usually have good job performance. The objective of this article is to investigate the mediating effect of work engagement on the relationship between job satisfaction and job performance.. 1.2 Purpose of the Study Based on a review of the literature concerning job satisfaction, work engagement, and job performance, this study investigates the reciprocal relationship between job satisfaction and job performance through work engagement of manufacturing employees. With respect to the main purpose of the study, we focus on three general research questions: (1) What is the relationship between job satisfaction and job performance? (2) What is the relationship between job satisfaction and work engagement? (3) Does work engagement mediate the relationship between job satisfaction and job performance?. 2.
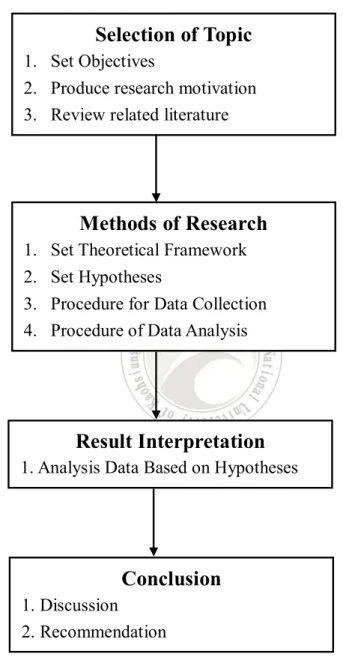
(11) 1.3 Procedure of the Study. Selection of Topic 1. Set Objectives 2. Produce research motivation 3. Review related literature. Methods of Research 1. 2. 3. 4.. Set Theoretical Framework Set Hypotheses Procedure for Data Collection Procedure of Data Analysis. Result Interpretation 1. Analysis Data Based on Hypotheses. Conclusion 1. Discussion 2. Recommendation. Figure 1-1: Procedure of the Study. 3.
(12) Chapter 2 Literature Review This study adds to understanding of how job satisfaction affects job performance. Prior studies indicated the direct effect that job satisfaction has on job performance. This study suggests the mediating effect of work engagement on the relationship between job satisfaction and job performance.. 2.1 Job Satisfaction Balzer et al. (1997) defined job satisfaction as “the feelings a worker has about his or her job experiences in relation to previous experiences, current expectation, or available alternatives”. Hence, employees’ feelings and reactions which to their job experiences are satisfaction level. Job satisfaction has been an area of popular for employers for many years since it’s important to evaluate satisfaction level for employees. Hundreds of studies have examined the various dimensions of the job satisfaction and the relationships between job satisfaction and other variables. In 1935, Hoppock was the first one to publish topic of job satisfaction who found that job satisfaction was related to gender, age, and occupational level. Naumann (1993) noted that the amount of energy spent studying job satisfaction is based upon the idea that satisfied workers, at all organizational levels, are important contributors to an organization’s effectiveness and ultimately to long-term success.. 2.1.1 The Concept of Job Satisfaction Job satisfaction is an emotional, affective response. Affect refers to feelings of like or dislike. Therefore, job satisfaction is the extent to which a person derives pleasure from a job. Locke (1976) defines it as “a pleasurable or positive emotional state 4.
(13) resulting from the appraisal of one’s job or job experience. Job satisfaction is strictly an individual response. It was initially thought that people could have an overall feeling or liking for a job, ranging from very low to very high. Later, it was learned that many factors contribute to how a person feels about a job. People can have different feelings about their co-workers, their pay, their promotion, their supervision, and present job to oveall feelings about their jobs.. 2.1.2 Theoretical Classifications of Job Satisfaction Campbell et al., (1976) have divided job satisfaction theories into two distinct categories, content theories and process theories. Content theories are based on various factors which influence job satisfaction. These theories also consider an individual’s needs and values. They indicate what content motivates an individual to engage in a specific behavior (Chelladurai, 1999). The main content related theories include Maslow’s Hierachy of Needs Theory, Herzberg’s Motivation-Hygience Theory etc. Process theories take into account the process by which variables such as expectations, needs and values, and reference groups interact with the job to produce job satisfaction. The major concern of process theories is to consider not only the nature of the job and its context, but to analyze individual needs, values, and expectations. Chelladurai (1999) also classified theses studies as Discrepancy Theories, where a psychological comparison takes place between what one receives and a standard of comparison. In essence, process theories take the next logical step and analyze various reasons that might determine job satisfaction. The main process theories include Equity Theory, Need Fulfillment Theory, and Expectancy Theory. According to Gruneberg (1979), it is likely that no one single theory of job 5.
(14) satisfaction accounts for all the phenomena all the time. Each theory of job satisfaction has added to the base of knowledge and is intertwined in the developing construct. Because of this, a review of both content and process theories will be given.. 2.1.3 Theories of Job Satisfaction Several theories have been proposed to explain why people are satisfied with their jobs. This research has introduced several significant and most popular theories of job satisfaction. These theories are given as under:. 1. Maslow’s Hierachy of Needs Theory Maslow (1954) emphasized that human behavior resulted from “need”, and human needs have five levels form low to high as physiological needs, safety needs, social needs, esteem needs, and self-actualization. When lower level needs become satisfied, it will pursue the next higher need. Hence, the need is step by step not cross function on the pyramid. But it’s still existence that the lower level need decrease when it move into the next higher need. Lower level needs could use salary or employee welfare to gain satisfied and higher level needs choose the other way to gain satisfied such as delegation, respect, or promotion.. 2. Herzberg’s Motivation-Hygience Theory Herzberg (1959) found this was necessary that general employees thought corporate polices, administrate management, interpersonal relation, and salary, it was not felt satisfied when these conditions existence, but if one was not existence that will feel dissatisfied called hygiene factors. On the contrary, he found these conditions such a sense of achievement, responsibility, or promotion that it was felt satisfied when it was existence, but if one was not existence that will not feel dissatisfied called 6.
(15) motivation factors.. 3. Expectancy Theory Vroom (1964) emphasized that motivation relied on three constructs like expectancy, instrumentality, and valence. Expectancy is the probability that effort will be followed by personal accomplishment. Instrumentality is the probability that performance will lead to outcomes. And valence is associated with value of an individual to an outcome. For example, when an individual is faced with a choice being promoted to a new position with more responsibility and authority, it is expected that increased compensation will follow. The behavior of the individual is affected by his belief that there is a probable outcome. However, the research on consequences of job satisfaction has shown its relationship with positive outcomes such as organizational commitment, job performance, and organizational citizenship behavior. Numerous studies have also analyzed the relationship between job satisfaction and turnover. In general , more dissatisfied employees are likely to leave the working environment and likely to be absent form work more than satisfied employees (Dittrch & Carrell, 1979). Some studies have found that turnover is more predictable than absenteeism when related to job satisfaction (Hulin, 1966;Ilgen & Hollenbach, 1977).. 2.1.4 Measurement of Job Satisfaction There are several popular measure scales for job satisfaction as follows: The Minnesota Satisfaction Questionnaire (MSQ) has short form (20 items) and long form (100 items) developed by Weiss et al., (1964, 1967). The MSQ was developed as part of a work began in 1957 in a study know as the Work Adjustment Project (WAP). The objective of the WAP was to assess worker personality and the 7.
(16) work environment for specific outcomes, namely satisfaction ( Weiss et al., 1967). The Job Descriptive Index (JDI) was used to measure with employee’s satisfaction with their jobs. After 40 years of studies and application it remains one of the most widely used measures of job satisfaction (DeMeuse, 1985). The five specific dimensions of JDI are work on present job, present pay, opportunities for promotion, supervision, and coworkers. The Job in General (JIG) scale was designed to evaluate overall, global satisfaction with the job (Ironson et al.,1989).. 2.2 Work Engagement The recent development in work engagement research is the shift toward its opposite. This is to be seen as part of a more general emerging trend toward a positive psychology that focuses on human strengths and optimal functioning. Rather than a momentary and specific state, work engagement refers to a more persistent and pervasive affective-cognitive state that is not focused on any particular object, event, individual, or behavior.. 2.2.1 Theoretical Foundation of Engagement The first author discussed engagement is Kahn (1990), and he proposed “Personal Engagement” concept. Engagement has been defined by Kahn (1990) as “the simultaneous employment and expression of a person’s ‘preferred self’ in task behaviors that promote connections to work and to others, personal presence (physical, cognitive, and emotional) and active, full performances”. Additionally, Kahn (1990) outlined three psychological antecedents to engagement that are influenced by individual differences as well as the work context. First, individuals must sense meaningfulness in their work role. Second, individuals must feel safe to express. 8.
(17) themselves without fear of negative consequences. Psychological safety may be experienced when interpersonal relationships are supportive and trusting, when managers are supportive and clear, or when organizational norms are clearly delineated. Third, Kahn proposed that employees must also feel that they have the personal resources necessary to engage. Psychological availability is the sense of having physical energy, emotional energy, and psychologically security about one’s work and one’s status. And These three psychological conditions (meaningfulness, safety, and availability) are precursors to employees’ abilities to engage themselves in their work roles.. 2.2.2 Operationalization of Work Engagement Drawing in part on Kahn’s (1990) theory, Schaufeli & Bakker (2004) defined engagement as a positive, fulfilling work-related state of mind that is characterized by vigor,. dedication. and. absorption.. It. means. a. persistent. and. pervasive. affective-cognitive state that is not focused on any particular object, event, individual, or behavior. Shimazu et al. (2008) viewed work engagement which engaged employees have a sense of energetic and effective connection with their work activities. Koyuncu et al. (2006) viewed Vigor is characterized by high levels of energy and mental resilience while working, the willingness to invest energy in one’s work, and persistence also in the face of difficulties;Dedication is characterized by high levels of work involvement and feelings or pride and challenge in one’s work; Absorption is characterized by being deeply concentrated and happily en engrossed in one’s work the sense that time passes quickly. Recent researches using confirmatory factor analysis have demonstrated a three-factor model of work engagement (Schaufeli & Bakker, 2004; Salanova & Bakker, 2002; Schaufeli et al., 2002a). However, although research on consequences 9.
(18) of work engagement has shown its relationship with positive outcomes as low turnover, high organizational commitment and performance (Schaufeli & Bakker, 2004; Salanova & Jose´ Marı´a Peiro, 2005). When employees are highly engaged in their company, it is expected that they will perform very well and report favorable job performance.. 2.2.3 Measurement of Work Engagement Work engagement assessed by a self – report questionnaire called the Utrecht Work Engagement Scale (UWES) has been developed that includes the three subscales: vigor, dedication, and absorption. Originally, the UWES included 24 self-constructed items that were formulated in Spanish and English, but after careful psychometric evaluation in two different Spanish samples of employees and students (Schaufeli et al., 2002a), seven items were determined to unsound and were eliminated so that 17 items remained; vigor has six items, dedication has five items, and absorption has six items, respectively. The most commonly used measure of work engagement was UWES three subscales, but Christian & Slaughter (2007) research the work engagement construct show that the three subscales of engagement were strongly correlated with each other. Because of the high mean corrected inter-correlations of the three subscales of work engagement. They suggested researchers that score the UWES as a unidimensional composite rather than as three separate subscales. The other one is Shimazu et al. (2008) who research to validate the Japanese version of the UWES (UWES-J) has nine items. They report found that three aspects of work engagement should be treated as a unitary construct. On the basis of theses previous studies, we concur with the one dimension of work engagement instead of three dimensions.. 10.
(19) 2.3 Job Performance Individual performance becomes highly important for an organization as a whole and for the individuals working in it. It is a core concept within work and organizational psychology (Sonnentag & Frese, 2002). Organizations need individuals’ high performance to meet their goals. Performance is the extent to which someone can successfully accomplish a task or achieve a goal. Job performance evaluation provides employees or employers with a message to correct errors. Various authors have commented on the apparent large development of a job performance theory (Austin & Villanova, 1992;Campbell et al., 1993;Viswesvaran et al., 2002). Job performance must be clearly defined and fully understood by the employees who are expected to perform well at work. Motowidlo et al. (1997) define job performance as the“ aggregated value to the organization of the discrete behavioral episodes that an individual performs over a standard interval of time”.. 2.3.1 The Concept of Job Performance Job performance refers to the overall evaluation of how well an individual is meeting the organization’s expectations in terms of job performance (Allen & Griffeth, 1999). Performance can be generally conceptualized at different levels of analysis such as individual, group, organization, and so forth. Job performance appraisal has long been recognized as an important personnel function with the potential to greatly improve employee motivation and hence performance, and to provide management with the control needed to achieve organizational objectives (Orpen, 1995). To attain a closer understanding of the Western view on performance appraisal, two broad perspectives on job performance appraisal were discussed (Hempel, 2001). The first of these perspectives discusses performance appraisal as a tool of organizational. 11.
(20) control in order to measure the achievement of individual, group, and organizational objectives. As to the second perspective, based upon cognitive models, it discusses the mental process by which managers evaluate employee performance.. 2.3.2 Classifications of Job Performance Singh et al. (1996) proposed job performance as one aspect including six items. In this measure was asked to evaluate himself or herself in comparison with their coworkers. Motowidlo & Van Scotter (1994) proposed two dimensions of job performance, which are task performance and contextual performance. Task performance (or technical job performance) is the behavior associated with maintaining and servicing an organization’s technical core. By contrast, contextual performance (or interpersonal job performance) is a function of one’s interpersonal skill knowledge that supports the broader social environment in which the technical core must function. Contextual performance tends to promote desirable organizational behavior. A study conducted by McHenry et al., (1990) illustrated the five performance dimensions including core technical proficiency, general soldering proficiency, effort and leadership, personal discipline, and fitness and military. There is already considerable evidence that job performance may be a valuable addition to performance criteria used in personnel selection. These studies have focused on individual differences that predict the extent to which employees engage in these behaviors. Results support the job performance made by Singh (1996). Moreover, this study has explored the relationship between work engagement and job performance using self-reports filled in by employees themselves.. 12.
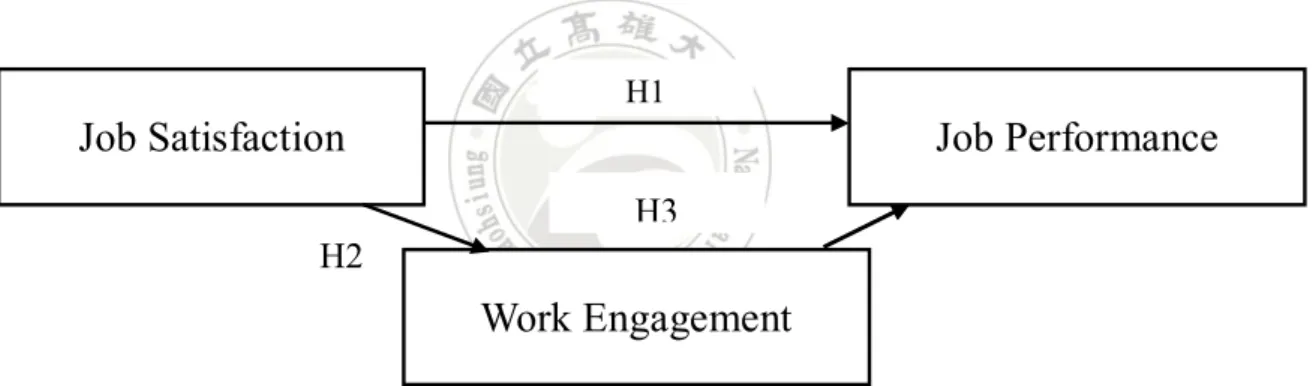
(21) Chapter 3 Methodology Based on previous literature review, the research methodology includes research model, research hypotheses, variable definition and questionnaire design, sample description, and data analysis methods. Details are as follows.. 3.1 Research Model Based on the literature review in Chapter 2, the research model is illustrated in Figure 3-1. The independent variable is job satisfaction. The dependent variable is job performance. Work engagement is a mediating variable.. H1. Job Satisfaction. Job Performance H3. H2. Work Engagement. Figure 3-1: Conceptual Framework. 3.2 Research Hypotheses This study formulated several hypotheses to test the relationships as shown in the conceptual framework given above. The hypotheses are as follows:. 3.2.1 Relationship between job satisfaction and job performance The relationship between job satisfaction and job performance has been the focus of many researches Since the Brayfield & Crockett (1955) review. Although the 13.
(22) literature has not reached any definitive conclusions regarding the causal direction of the satisfaction–performance relationship, in a review of 221 primary studies, Harrison et al., (2006) revealed that the evidence supporting the satisfaction to performance relationship was stronger than the evidence supporting the performance to satisfaction relationship in terms of temporal sequencing. Edwards et al. (2008) indicated that overall job satisfaction was positively related to job performance. Vroom (1964) show that it was typically assumed by most people associated with the human relations movement that job satisfaction was positively associated with job performance. Namely, job satisfaction is important for employee well-being and happy, and it could result in increased effectiveness to job performance. Thus, this study generates the following hypothesis. H1: Job satisfaction will be positively related to job performance.. 3.2.2 Relationship between job satisfaction and work engagement Balzer et al. (1997) defined job satisfaction as “the feelings a worker has about his or her job experiences in relation to previous experiences, current expectation, or available alternatives”. Schaufeli & Bakker(2004) defined work engagement as a positive, fulfilling work-related state of mind. The primary thrust of this study is that the enjoyment and happiness of the quality of employees’ working life (job satisfaction) will lead to deeply concentrate and happily engross in one’s work (work engagement). Therefore, this study generates the following hypothesis. H2: Job satisfaction will be positively related to work engagement.. 14.
(23) 3.2.3 Work engagement as a mediator of the relationship between job satisfaction and job performance To date, we are not aware of any studies of job satisfaction and job performance that have examined work engagement as a mediator. Based on the above discussions, job satisfaction will be positively related to work engagement, and work engagement will be positively related to job performance. This study expects that job satisfaction will exert indirect effects on job performance. Namely, job satisfaction will indirectly influence job performance by means of work engagement. This study generates the following mediating hypothesis. H3: Work engagement will mediate the relationship between job satisfaction and job performance.. 3.3 Variable Definition and Questionnaire Design The questionnaire of this study is divided into three parts, including job satisfaction, work engagement, and job performance. There were 35 items in total to measure three variables (job satisfaction, work engagement, and job performance) and the responses to all items on a five-point Likert scale that 1 to 5 means “strongly disagree” to “strongly agree”. Variable definition and measurement scale were described as follows:. 15.
(24) 3.3.1 Job Satisfaction This study was adapted by Balzer et al. (1997) defined job satisfaction as “the feelings a worker has about his or her job experiences in relation to previous experiences, current expectation, or available alternatives”. Overall Job Satisfaction was measured using the Minnesota Satisfaction Questionnaire (MSQ) (Weiss et al, 1967). Respondents indicated their satisfaction with 20 aspects of their jobs using a 5-point scale ranging from 1 = very dissatisfied to 5 = very satisfied. Representative items in this measure included 'Being able to keep busy at all times' and 'My pay and the amount of work I do' etc. The coefficient alpha reliability computed for the MSQ was 0.90 (Scandura & Lankau, 1997).. 3.3.2 Work Engagement Shimazu et al. (2008) viewed work engagement which engaged employees have a sense of energetic and effective connection with their work activities. Work engagement was measured using scales developed by Schaufeli et al.(2002a). The most commonly used measure of work engagement was UWES three subscales with 17 items, but Shimazu et al. (2008) who research to validate the Japanese version of the UWES (UWES-J). They report found that three aspects of work engagement should be treated as a unitary construct. On the basis of theses previous studies, we concur with the one dimension of work engagement instead of three dimensions. One-factor model of the 9 items fit the data,so the one-factor model was adapted for this study analyses. Respondents indicated their work engagement with 9 items of their jobs using a Likert-point scale ranging from 1 = very disagree to 5 = very agree. This scale achieved acceptable reliability was 0.90 (Shimazu et al., 2008).. 16.
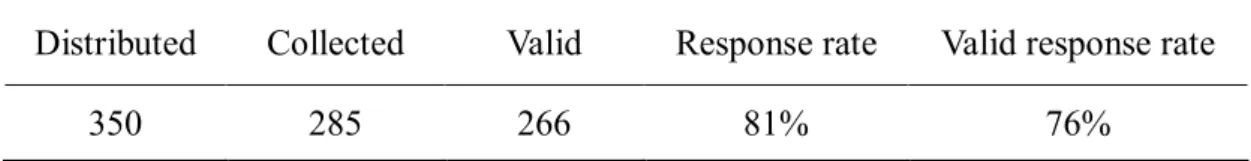
(25) 3.3.3 Job Performance This study was adapted by Allen & Griffeth (1999) defined Job performance, the authors indicate the overall evaluation of how well an individual is meeting the organization’s expectations in terms of job performance. Job performance was used a self-rating, including six items which was adapted by Singh et al. (1996) from Dubinsky & Mattson(1979) original scale and widely used in the literature (Kalbers & Cenker, 2008;Fogarty et al., 2000). In this measure was asked to evaluate himself or herself in comparison with their coworkers on a five-point scale (1=poor, 2= bad, 3=so so, 4=good, 5=excellent) on six different items. This scale achieved acceptable reliability was 0.80 (Singh et al., 1996).. 3.4 Sampling Design and Sample Data Analyses Convenience sampling was applied in this study. Two Nanzih Export Processing Zone’s manufacturing companies were the targets in this study. Table 3.1 shows the number of collected and valid data as well as the response rate. As shown in the table, 350 questionnaires were distributed and 285 of those were answered. The overall response rate for this survey was 81 percent. And the valid response rate for this survey was 76 percent. 19 cases of the 285 answered questionnaires were dropped due to incomplete answers or because it was obviously found that they were not seriously filled out. For instance, some of them chose the same answer (score) for every question.. 17.
(26) Table 3.1: Summary of Response Rate Distributed. Collected. Valid. Response rate. Valid response rate. 350. 285. 266. 81%. 76%. Source: this study. The 81% overall response rate was higher than expected. This high response rate may have been because this study was implemented using a convenience sample instead of randomly selecting subjects. Specifically, the subjects were selected by the contact persons at the institutions.. Thus, the researchers had little control over who. was selected, but those that were selected were probably likely to respond favorably to being asked to participate by the contact person if they were friends. It is possible that the contact persons distributed the questionnaires to friends or people they thought would be willing to complete the questionnaires.. This survey methodology. improved the response rate, but may introduce biases in the respondents. Table 3.2 show demographical statistics of sample in this study.. 18.
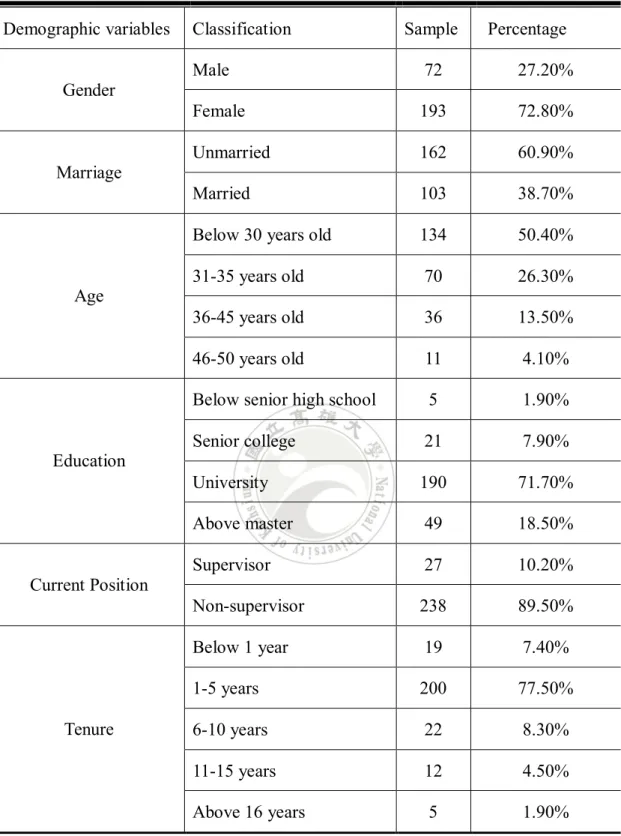
(27) Table 3.2 Demographical Statistics of Sample Demographic variables. Classification. Sample. Percentage. Male. 72. 27.20%. Female. 193. 72.80%. Unmarried. 162. 60.90%. Married. 103. 38.70%. Below 30 years old. 134. 50.40%. 31-35 years old. 70. 26.30%. 36-45 years old. 36. 13.50%. 46-50 years old. 11. 4.10%. Below senior high school. 5. 1.90%. Senior college. 21. 7.90%. University. 190. 71.70%. Above master. 49. 18.50%. Supervisor. 27. 10.20%. Non-supervisor. 238. 89.50%. Below 1 year. 19. 7.40%. 1-5 years. 200. 77.50%. 6-10 years. 22. 8.30%. 11-15 years. 12. 4.50%. Above 16 years. 5. 1.90%. Gender. Marriage. Age. Education. Current Position. Tenure. Source: this study. 19.
(28) Within 266 effective samples (obtaining an overall response rate of 81%), 72 were male and 193 were female. The age of 31-35 years old is more than other ages. Only 38.70% of samples were married. About 71.70% of samples have a degree at the university level. The most period of staying in the present companies are 1-5 years of Tenure.. 3.5 Data Analysis Methods SPSS 12.0 (Statistical Package of the Social Science) was used to process the data acquired. This data will be used to investigate each of the four hypotheses. The following is a detailed description of the analysis of this data for each of these hypotheses. First, descriptive statistics analyses were presented by means and standard divisions to see the scattered condition of each independent variable. Second, reliability analyses (Cronbach’s Alpha) were conducted to test internal consistence. Finally, this study expects that work engagement will mediate the relationship between job satisfaction and job performance. Baron & Kenny (1986) stated that mediation can be demonstrated by three hierarchical multiple regression tests. First, the independent variable (job satisfaction) must be related to the dependent variable (job performance). Second, the independent variable (job satisfaction) must be related to the mediator (work engagement). Third, when both independent variable (job satisfaction) and the mediator (work engagement) are simultaneously included in a regression equation, then the relationship between the independent variable (job satisfaction) and the dependent variable (job performance) must be appreciably smaller than it is when job satisfaction is the sole predicator.. All the significance level of .05 will be used to. determine statistical significance throughout the analysis.. 20.
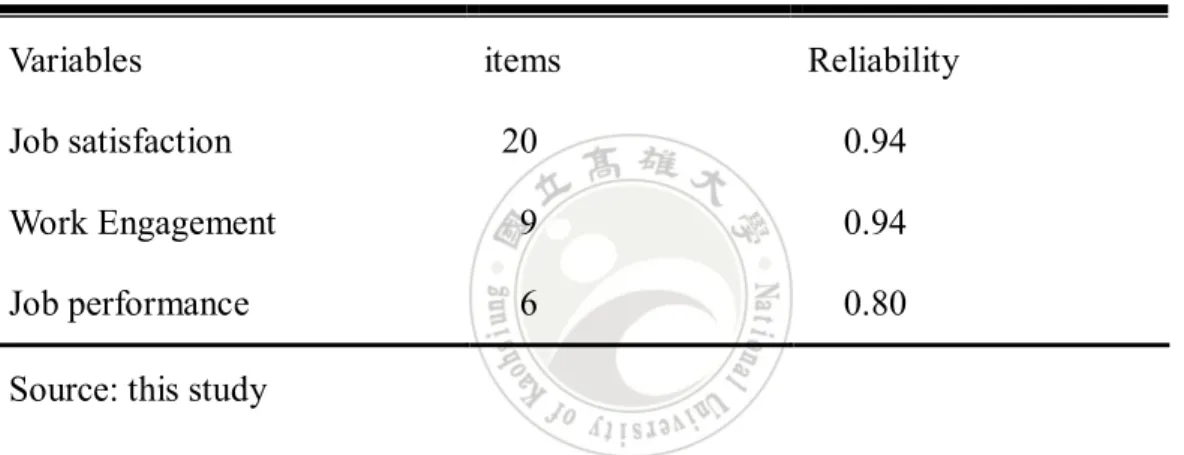
(29) 3.6 Reliability Analyses After the data were gathered, all the items were from 1 to 5. “1” is the lowest and “5” as the highest. Test of reliability using Internal Consistency method was also used to get the Cronbach Alpha of each variable using SPSS 12.0 for Windows. According to Nunnally (1978), the reliability coefficients should meet the acceptance criteria of 0.70. The reliability coefficients are displayed in Table 3.2. As the reader will observe, all of the measures have acceptable levels of reliability (α> .70).. Table 3.3 Reliability Analysis Variables. items. Reliability. 20. 0.94. Work Engagement. 9. 0.94. Job performance. 6. 0.80. Job satisfaction. Source: this study. 21.
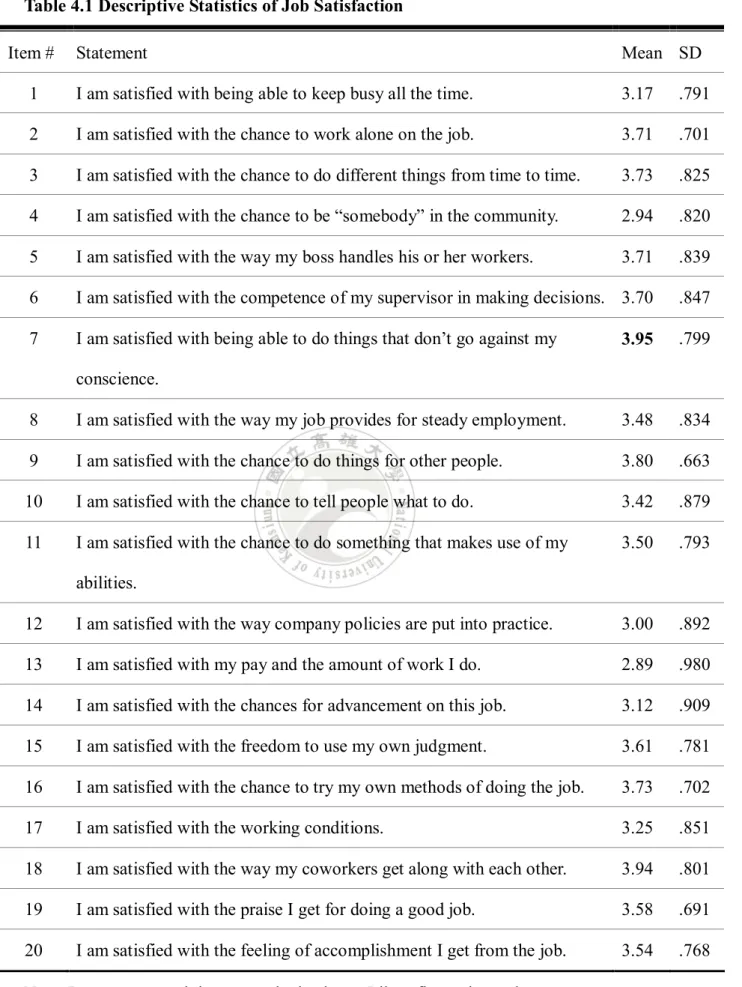
(30) Chapter 4 Analysis. 4.1 Descriptive Statistics 4.1.1 Descriptive Statistics of Job Satisfaction Table 4.1 shows that Nanzih Export Processing Zone’s manufacturing firms of the administrative staff agrees that the most important item of job satisfaction is “I am satisfied with being able to do things that don’t go against my conscience. (mean=3.95)” Specifically, employees satisfied who have the chance to work alone on the job (mean=3.71) and to do different things (mean=3.73). They find they satisfied with the way their boss handles workers (mean=3.71) and the competence of making decisions (mean=3.70). They also satisfied that the chance to do things for other people (mean=3.80), try my own methods of doing the job (mean=3.73), and the way my coworkers get along with each other (mean=3.94).. 22.
(31) Table 4.1 Descriptive Statistics of Job Satisfaction Item #. Statement. Mean SD. 1. I am satisfied with being able to keep busy all the time.. 3.17. .791. 2. I am satisfied with the chance to work alone on the job.. 3.71. .701. 3. I am satisfied with the chance to do different things from time to time.. 3.73. .825. 4. I am satisfied with the chance to be “somebody” in the community.. 2.94. .820. 5. I am satisfied with the way my boss handles his or her workers.. 3.71. .839. 6. I am satisfied with the competence of my supervisor in making decisions. 3.70. .847. 7. I am satisfied with being able to do things that don’t go against my. 3.95. .799. conscience. 8. I am satisfied with the way my job provides for steady employment.. 3.48. .834. 9. I am satisfied with the chance to do things for other people.. 3.80. .663. 10. I am satisfied with the chance to tell people what to do.. 3.42. .879. 11. I am satisfied with the chance to do something that makes use of my. 3.50. .793. abilities. 12. I am satisfied with the way company policies are put into practice.. 3.00. .892. 13. I am satisfied with my pay and the amount of work I do.. 2.89. .980. 14. I am satisfied with the chances for advancement on this job.. 3.12. .909. 15. I am satisfied with the freedom to use my own judgment.. 3.61. .781. 16. I am satisfied with the chance to try my own methods of doing the job.. 3.73. .702. 17. I am satisfied with the working conditions.. 3.25. .851. 18. I am satisfied with the way my coworkers get along with each other.. 3.94. .801. 19. I am satisfied with the praise I get for doing a good job.. 3.58. .691. 20. I am satisfied with the feeling of accomplishment I get from the job.. 3.54. .768. Note. Response to each item was obtained on a Likert five-point scale.. 23.
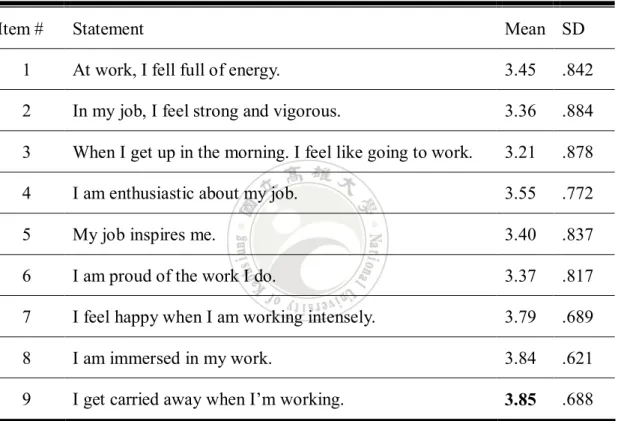
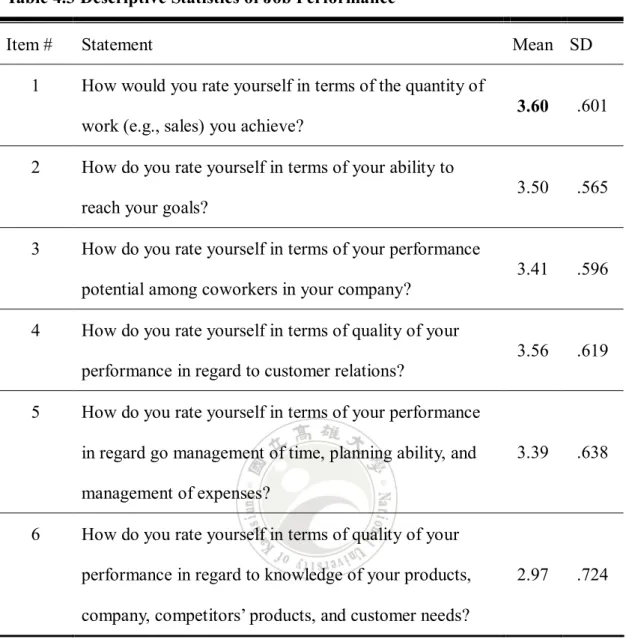
(32) 4.1.2 Descriptive Statistics of Work Engagement Table 4.2 shows that Nanzih Export Processing Zone’s manufacturing firms of the administrative staff agrees that the most important item of work engagement is “I get carried away when I’m working (mean=3.85).” Specifically, employees feel happy when they engrossing (mean=3.84) and immersing (mean=3.85) in work.. Table 4.2 Descriptive Statistics of Work Engagement Item #. Statement. Mean SD. 1. At work, I fell full of energy.. 3.45. .842. 2. In my job, I feel strong and vigorous.. 3.36. .884. 3. When I get up in the morning. I feel like going to work.. 3.21. .878. 4. I am enthusiastic about my job.. 3.55. .772. 5. My job inspires me.. 3.40. .837. 6. I am proud of the work I do.. 3.37. .817. 7. I feel happy when I am working intensely.. 3.79. .689. 8. I am immersed in my work.. 3.84. .621. 9. I get carried away when I’m working.. 3.85. .688. Note. Response to each item was obtained on a Likert five-point scale.. 4.1.3 Descriptive Statistics of Job Performance Table 4.3 shows that Nanzih Export Processing Zone’s manufacturing firms of the administrative staff agrees that the most important item of job performance is “How would you rate yourself in terms of the quantity of work(e.g., sales) you achieve (mean=3.60)?” Specifically, employees have ability to achieve their company goals (mean=3.50).. 24.
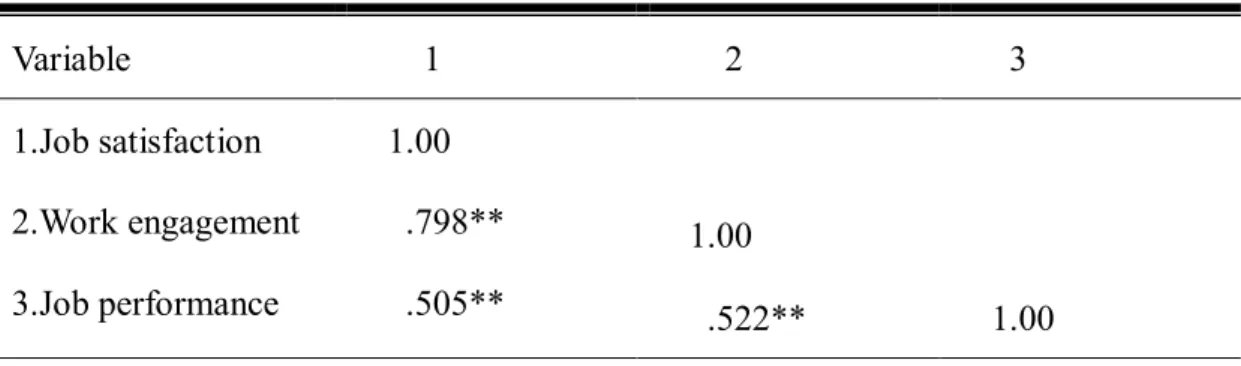
(33) Table 4.3 Descriptive Statistics of Job Performance Item # 1. Statement. Mean SD. How would you rate yourself in terms of the quantity of 3.60. .601. 3.50. .565. 3.41. .596. 3.56. .619. 3.39. .638. 2.97. .724. work (e.g., sales) you achieve? 2. How do you rate yourself in terms of your ability to reach your goals?. 3. How do you rate yourself in terms of your performance potential among coworkers in your company?. 4. How do you rate yourself in terms of quality of your performance in regard to customer relations?. 5. How do you rate yourself in terms of your performance in regard go management of time, planning ability, and management of expenses?. 6. How do you rate yourself in terms of quality of your performance in regard to knowledge of your products, company, competitors’ products, and customer needs?. Note. Response to each item was obtained on a Likert five-point scale.. 4.2 Pearson Correlation Analysis After conducting Person correlation analysis, this study found that all the variables are significant positive correlations. The correlation analysis are displayed in Table 4.4. First, this study found that job satisfaction was positively related to work engagement at the significant level (γ= .79). Second, this study found that job satisfaction was positively related to job performance (γ= .50). Third, this study found that work engagement was positively related to job performance (γ= .52). 25.
(34) Table 4.4 Correlation Matrix Variable 1.Job satisfaction. 1. 2. 3. 1.00. 2.Work engagement. .798**. 3.Job performance. .505**. 1.00 .522**. 1.00. Source: this study. 4.3 Respondent Demographics One-ANONA and t-test are employed to determine whether or not there are any effects of demographic variables on job satisfaction, work engagement, and job performance in the Nanzih Export Processing Zone’s manufacturing firms of the administrative staff. According to the one-way ANOVA, significant differences were found (P-value< .05), indicating the sample is reasonably representative of job satisfaction, work engagement and job performance in terms of the demographic variables tested. The results are shown in Table 4.5 to Table 4.9. From the result of Table 4.5, we acquire gender which having significant differences related to three variables (p-value< .05). It represents that female employees have higher degree of job satisfaction, work engagement and job performance than male employees.. 26.
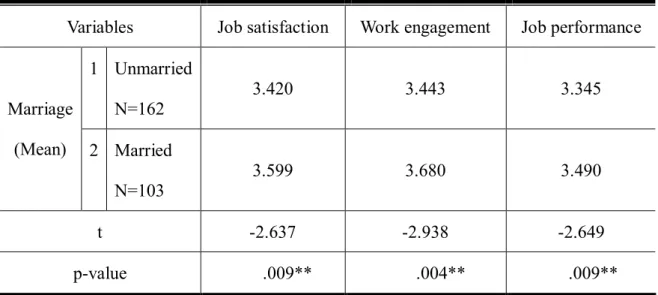
(35) Table 4.5 T-test Analysis in Gender and Each Variable Variables. Job satisfaction. Work engagement. Job performance. 3.620. 3.702. 3.548. 3.441. 3.473. 3.347. t. 2.406. 2.574. 3.396. p-value. .017*. 1 Male Gender. N=72. (Mean) 2 Female N=193. .011*. .001**. Note. ***p<.001 **p<.01 *p<.05;Source: This study.. From the result of Table 4.6, we acquire marriage status which having significant differences related to three variables (p-value< .05). It represents that married employees have higher degree of job satisfaction, work engagement and job performance than unmarried employees.. Table 4.6 T-test Analysis in Marriage and Each Variable Variables. Job satisfaction. Work engagement. Job performance. 3.420. 3.443. 3.345. 3.599. 3.680. 3.490. -2.637. -2.938. -2.649. 1 Unmarried Marriage (Mean). N=162 2 Married N=103 t p-value. .009**. Note. ***p<.001 **p<.01 *p<.05;Source: This study.. 27. .004**. .009**.
(36) From the result of Table 4.7, we acquire age which having significant differences related to three variables (p-value< .05). After conduction Scheffe comparison, we found 41-50 years old employees have higher degree of job satisfaction than 31-35 years old. And we found that 36-40 years old employees have higher degree of job satisfaction and work engagement than below 30 years old and 31-35 years old. We also found that 36-40 years old employees have higher degree of job performance than below 30 years old.. Table 4.7 One-Way ANOVA Analysis in Age and Each Variable Variables. Job satisfaction. Work engagement. Job performance. 3.441. 3.427. 3.312. 3.355. 3.460. 3.411. 3.844. 3.867. 3.648. 3.882. 3.959. 3.575. 9.357. 6.359. 6.504. 1 Below 30 years old N=134 2 31-35 years old Age. N=70. (Mean) 3 36-40 years old N=36 4 41-50 years old N=11 F P-value Scheffe. .000*** 3>1,3>2,4>2. Note. ***p<.001 **p<.01 *p<.05;Source: This study.. 28. .000*** 3>1,3>2. .000*** 3>1.
(37) From the result of Table 4.8, we acquire age which having significant differences related to work engagement and job performance (p-value< .05). After conduction Scheffe comparison, We found who having university degree of employees have higher degree of work engagement than above master degree. We also found who having below senior high school degree of employees have higher degree of job performance than below 30 years old.. Table 4.8 One-Way ANOVA in Education and Each Variable Variables. Job satisfaction. Work engagement. Job performance. 3.600. 3.688. 3.833. 3.471. 3.529. 3.174. 3.517. 3.605. 3.422. 3.379. 3.249. 3.374. F. .916. 4.130. 3.830. P-value. .434. 1 Below Senior high school N=49 2 Junior college Education N=21 (Mean) 3 University N=190 4 Above Master N=49. Scheffe Note. ***p<.001 **p<.01 *p<.05;Source: This study.. 29. .007**. .010*. 3>4. 1>2.
(38) From the result of Table 4.9, we acquire tenure which having significant differences related to three variables (p-value< .05). After conduction Scheffe comparison, employees have 11-15 years tenure whose has higher degree of job satisfaction and work engagement than 1-5 years and 6-10 years tenure. We also found that employees have 11-15 years tenure whose has higher degree of job performance than below 1 year and 1-5 years tenure.. Table 4.9 One-Way ANOVA in Tenure and Each Variable Variables 1. Job satisfaction. Work engagement. Job performance. 3.605. 3.701. 3.263. 3.445. 3.480. 3.373. 3.393. 3.419. 3.515. 4.108. 4.240. 3.847. 3.660. 3.888. 3.366. 4.940. 4.928. 4.329. Below 1 year N=19. 2. 1-5 year N=200. Tenure. 3. (Mean). 6-10 year N=22. 4. 11-15 year N=12. 5. Above 16 year N=5 F. P-value. .001**. .001**. .002**. Scheffe. 4>2,4>3. 4>2,4>3. 4>1,4>2. Note. ***p<.001 **p<.01 *p<.05;Source: This study.. 30.
(39) 4.4 Regression Analyses Regression analyses were conducted to determine the relationships between each dependent variable (job satisfaction and work engagement) and independent variable (job performance). The results of the regression as follows:. 4.4.1 Regression Analyses Based on Job Satisfaction and Job performance Hypothesis 1 predicted that job satisfaction would be positively related to job performance. Results of regression analyses provide support for the positive relationship between job satisfaction and job performance. Table 4.10 shows that after entering gender, marriage, age, education, job function, current position, tenure as demographic control variable, job satisfaction explains an additional 18.80% of the variance in job performance (F=18.753, p< .001) and produces a significant final beta weight (β= .457, p< .001). Likewise, significant correlations are found between job satisfaction and job performance, and the results of regression analyses provide further support for the relationship. Thus, hypothesis 1 is supported.. 31.
(40) Table 4.10 Regression analyses for job satisfaction and job performance Dependent variable Independent variable. Job performance Model 1. Model 2. β. β. Demographic control variable. Gender. -.297***. -.215***. Marriage. .127. .080. Age. .108. .036. Education. .054. .070. Current position. .079. .141*. Tenure. .259**. .272** .457***. Job satisfaction R2. .144. △R2. .332 .188. F value. 7.985***. 18.753***. Note. ***p<.001 **p<.01 *p<.05. 4.3.2 Regression Analyses Based on Job Satisfaction and Work Engagement Hypothesis 2 predicted that job satisfaction would be positively related to work engagement. Results of regression analyses provide support for the positive relationship between job satisfaction and work engagement. Table 4.11 shows that after entering control variable, job satisfaction explains an additional 55.7% of the. 32.
(41) variance in work engagement (F=76.017, p< .001) and produces a significant final beta weight (β= .780, p< .001). Likewise, significant correlations are found between job satisfaction and work engagement, and the results of regression analyses provide further support for the relationship. Thus, hypothesis 2 is supported.. Table 4.11 Regression Analyses for Job Satisfaction and Work Engagement Dependent variable Independent variable. Work engagement Model 1. Model 2. β. β. Demographic control variable Gender. -.232***. -.093*. Marriage. .089. .009. Age. .124. .002. Education. -.119. -.091*. Current position. -.162*. -.055. Tenure. .003. .780***. Job satisfaction R2. .120. △R2 F value. .025. .677 .557. 6.724***. Note. ***p<.001 **p<.01 *p<.05. 33. 76.017***.
(42) 4.3.3 Mediation Analyses This study expects that work engagement will mediate the relationship between job satisfaction and job performance. Baron & Kenny (1986) stated that mediation can be demonstrated by three regression tests. First, the independent variable (job satisfaction) must be related to the dependent variable (job performance). Second, the independent variable (job satisfaction) must be related to the mediator (work engagement). Third, when both independent variable (job satisfaction) and the mediator (work engagement) are simultaneously included in a regression equation, then the relationship between the independent variable (job satisfaction) and the dependent variable (job performance) must be appreciably smaller than it is when job satisfaction is the sole predicator. Findings from these tests are reported below. According to Baron & Kenny’s (1986) suggestions, table 4.12 illustrates the results of these analyses. We duplicate Model 1 and 2 from Table 4.10 and 4.11. Job satisfaction and work engagement are entered in Model 3. The regression coefficient for job satisfaction was smaller in size than it was when work engagement was excluded (β= .475 β= .193). Therefore, Hypothesis 3 is supported.. 34.
(43) Table 4.12 Mediation analyses Dependent variable. Job performance. Work engagement. Job performance. Independent variable. Model 1. Model 2. Model 3. β. β. β. Demographic control variable Gender. -.215***. -.093*. -.184***. Marriage. .080. .009. .077. Age. .036. .002. .036. Education. .070. -.091*. .101. Current position. .141*. -.055. .160**. Tenure. .272**. .025. .263***. .457***. .780***. .193*. Job satisfaction. .338***. Work engagement R2 F value. .332 18.753***. Note. ***p<.001 **p<.01 *p<.05. 35. .676 76.017***. .366 19.064***.
(44) Chapter 5 Conclusion There are several new and important findings of this study. First, job satisfaction is positively related to work engagement, which means that people who has more job satisfaction, they will also behave stronger work engagement. Second, job satisfaction is positively related to job performance, which means that people who have more job satisfaction, their job performance will become higher. Third, work engagement mediate the relationship between job satisfaction and job performance, which means that people enhance job satisfaction leads to increase in work engagement, and therefore enhances job performance.. 5.1 Discussion This research tried to explore the process how job satisfaction may affect job performance. The researchers suggested that work engagement may be a mediator between the relationship of job satisfaction and job performance. The result of hypothesis 1 indicated that overall job satisfaction was generally positive related to job performance. This result confirmed prior research findings (e.g., Harrison, et al., 2006; Edwards et al., 2008) that Job satisfaction is important for employee well-being and happy, and it could result in increasing effectiveness to job performance. The result of hypothesis 2 indicated that job satisfaction was generally positive related to work engagement. This result supported our suggestion that the enjoyment and happiness of the quality of employees’ working life will lead to deeply concentrate and happily engross in one’s work. The result of hypothesis 3 indicated that work engagement had mediating effect on the relationship between job satisfaction and job performance. Therefore, the result of this experimental study 36.
(45) supported our suggestion that the enjoyment and happiness of the quality of employees’ working life (job satisfaction) will lead to deeply concentrate and happily engross in one’s work (work engagement). Moreover, people who have high work engagement tend to concentrate their attention and effort on what they are doing. Hence, those people usually have good job performance.. 5.2 Recommendation for Practical Application Based on the results of this study, top managers or human resource managers may further develop programs, systems, and policies to make their employees increase job satisfaction and work engagement. Based on the research finding, job satisfaction is important for employee well-being and happy, and it could result in increasing effectiveness to job performance. The results suggest that organization should raise the level job satisfaction. Top managers or employers may give employees the chance to work alone, do different things, and try their own methods on the job. In addition, don’t go against employees’ conscience at their work. That might make employees have higher degree of job satisfaction. Individual consistent with coworker’s value was positive related to individual’s job satisfaction (Leiter, 1988). Hence, company should arrange have the same values coworkers to work together, it can enhance job satisfaction and reduce conflict to each other. And they are satisfied with the way their coworkers get along with each other. But it may be sacrifice some brainstorming. The immediate supervisor should be monitored regularly, along with the key values, attitudes of the employees that will positively enhance employee’s job satisfaction (Dittrich & Carrell, 1979). Supervisors should consider select consistent with employees who have the same goal or value when human resource has recruited new. 37.
(46) staff. Company should consider that employee can get along with their supervisor when job rotation. And that maybe make employees are satisfied with the way their supervisor handles his or her. The salary for employees means they have to work hardly to gain it, and it maintains and improves their family life. Moreover, salary pay employee back for performance’s feedback system. Hence, organization should construct maturity compensation system. An organization’s policies can be a great source of frustration for employees if the policies are unclear or unnecessary or if not every one is required to follow them. Although employees will never feel a great sense of job satisfaction due to its policies, it can decrease dissatisfaction in this area by making sure that the policies are fair and apply equally to all. Continuous updating, with staff input and comparing policies to those similar practices and asking oneself whether the policies are unreasonable strict or whether some penalties are too harsh. Organization should create a circumstance that make employees adore and engage into their jobs. And it will lead to higher job performance. When employee’s job satisfaction was leading to full feeling vigor and enthusiasm (work engagement), they were lovely to go to work. Thus, those people usually have good job performance.. 5.3 Future Research and Limitation Our findings suggest that work engagement as mediator is associated with job satisfaction and job performance. Because work engagement is a new issue which is rarely investigated thoroughly, future research could investigate more about work engagement between attitude variables and behavior variables relationship. For example, engagement is likely to have a positive relation with organizational 38.
(47) citizenship behavior and organizational commitment. In order to be certain that work engagement is an important construct, further efforts should be made to establish the relationship. And this study’s work engagement scale was revised by Shimazu et al. (2008), and it was focus on the Japanese version of the UWES. Although, Taiwan and Japan are both belong to Asia Countries, but it still has different culture. We suggest that work engagement scale should development and revise Taiwan view, maybe more suited for Taiwan’s sample. This study has some limitations. First, all variables were collected from single source which may raise the problem of a common method variance. Second, the extent to which these findings generalize to respondents in other countries is not clear, especially not in Asian area. Because different countries have different social culture, this study presents that Asian employee’s work engagement as mediator is associated with job satisfaction and job performance. This might not fit Western countries. We hope that our study has made a contribution to a better understanding of work engagement issue.. 39.
(48) References Allen, D. G. & Griffeth, R. W. (1999). Job performance and turnover: A review and integrative. multi-route. model.. Human. Resource. Management. Review,. 9(4),525-549. Austin, J. T. & Villanova, P. (1992). The criterion problem: 1917-1992. Journal of Applied Psychology, 77, 836-874. Balzer, W. K., Kihm, J. A., Smith, P. C., Irwin, J. L., Bachiochi, P. D., Robie, C., et al. (1997). Users’ manual for the Job Descriptive Index (JDI; 1997 Revision) and the Job in General scales. Bowling Green, OH: Bowling Green State University. Baron, R. M. & Kenny, D. A. (1986). The moderator-mediator variable distinction in social psychological research: Conceptual, strategic, and statistical consideration. Journal of Personality and Social Psychology, 51, 1173-1182. Brayfield, A. H. & Crockett, W. H. (1955). Employee attitudes and employee performance. Psychological Bulletin, 52, 396-424. Campbell, J. P. & Printchard, R. D. (1976). Motivation theory in industrial and organization psychology, In M.D.Dunnett (eds.), Handbooks of Industial organization Psychology: 84-85. Chicago: Rand Mcnally. Campbell, J. P., McCloy, R. A., Oppler, S. H. & Sager, C. E. (1993). A theory of performance. In N. Schmitt &W. C. Borman (Eds.), Personnel selection in organizations, San Francisco: Jossey-Bass, 35–70. Chelladurai, P. (1999). Human Resource Management in Sport and Recreation. Champaign, IL: Human Kinetic Christian, M. S. & Slaughter, J. E. (2007). Work engagement: A meta-analytic review and directions for research in an emerging area. Academy of Management Prceedings, 1-6.. 40.
(49) DeMeuse, K. P. (1985). A compendium of frequently used measures in industrial/organization psychology. The Industrial-Organizational Psychologist, 23, 53-59. Dittrich, J. E. & Carrell, M. R. (1979). Organizational equity perceptions, employee job satisfaction, and departmental absence and turnover rates. Organizational Behavior and Human Decision Processes, 24(1), 29-40. Dubinsky, A. & Mattson B. (1979). Consequences of role conflict and ambiguity experienced by retail salespeople. Journal of Retailing, 55, 70-86. Edwards, B. D., Bell, S. T., Winfred Arthur, Jr. & Decuir, A. D. (2008) Relationships between facets of job satisfaction and task and contextual performance. Applied Psychology: An international review, 57(3), 441-465. Farrell, S. & Hakstian, A. (2001). Improving salesforce performance: A meta-analytic investigation of the effectiveness and utility of personnel selection procedures and training interventions. Psychology and Marketing, 18, 281-316. Fogarty, T. J., Singh, J., Rhoads, G. K. & Moore, R. K. (2000). Antecedents and Consequences of burnout in accounting: Beyond the role stress model. Behavioral Research in Accounting, 12, 31-67. Galt, T. (2005), Falling in love (with work) all over again. Globe and Mail, 25 November, pp. C1-8. Gruneberg, M. M. (1979). Understanding job satisfaction, (1st ed.). New York: Wiley & Sons, Inc. Hallberg, U. & Schaufeli, W.B. (2006). “Same same” but different: Can work engagement. be discriminated from job. involvement. and organizational. commitment? European Journal of Psychology, 11, 119–127. Harrison, D. A., Newman, D. A., & Roth, P. L. (2006). How important are job attitudes? Meta-analytic comparisons of integrative behavioral outcomes and time 41.
(50) sequences. Academy of Management Journal, 49, 305–325. Hempel, Paul S. (2001). Differences between Chinese and Western managerial views of performance. Personnel Review, 309(2), 203-226. Herzberg, F., Mausner, B. & Snyderman, B. (1959). The motivation to work. New York: Wiley. Hulin, C. L. (1966). Job satisfaction and turnover in female clerical population. Journal of Applied Psychology, 50, 280–185. Ilgen, D. R. & Hollenback, J. H. (1977). The role of satisfaction in absence behavior. Organizational Behavior & Human Decision Processes, 19(1), 148-161. Ironson, G.H., Smith, P.C., Brannick, M.T., Gibson, W.M. & Paul, K.B.. (1989). Construction of a Job in General Scale: A comparison of global, composite, and specific measures. Journal of Applied Psychology. 74, 193-200. Isen. A. M. & Baron, R. A. (1991). Positive affect as a factor in organizational behavior. Research in Organizational Behavior, 13, 1-53. Judge, T.A., Thoresen, C.J., Bono, J.E., & Patton.G.K. (2001). The job satisfaction-job performance relationship: A qualitative and quantitative review. Psychological Bulletin, 127, 376-407. Kahn, W. A. (1990). Psychological conditions of personal engagement and disengagement at work. Academy of Management Journal, 33, 692–724. Kalbers, L. P., & Cenker, W. J. (2008). The impact of exercised responsibility, experience, autonomy, and role ambiguity on job performance in public accounting. Journal of Managerial Issues, 3, 327-347. Koyuncu, M., Burke, R.J., & Fiksenbaum, L. (2006). Work engagement among women managers and professionals in a Trukish bank. Equal Opportunities International, 25 , 299-310. Laurie K. Diamond (2005). Antecedents and Consequences of Emotional Dissonance: 42.
(51) Understanding the Relationships Among Personality, Emotional Dissonance, Job Satisfaction, Intention to Quit and Job Performance. University of South Florida. Leiter, M. P. (1988). Burnout as a Function of Communication Patterns. Group and Organization Studies, 13, 111-128. Locke, E. A. (1976). The nature and causes of job satisfaction. In M. D. Dunnette (Ed.), Handbook of industrial and organizational psychology(pp. 1297–1347). Chicago: Rand McNally. Maslow, A. H. (1954). Motivation and personality. New York: Harper & Row. McHenry, J. J., Hough, L. M., Toguam, J. L., Hanson, M. A,& Ash-worth, S. (1990). Project a validity results: The relationship between predictor and criterion domains. Personnel Psychol-ogy, (43), 335-354. Motowidlo, S. J., Borman, W. C., & Schmitt, M. J. (1997). A theory of individual differences in task and contextual performance. Human Performance, 10(2), 71–83. Motowidlo, S. J., & Van Scotter, J. R. (1994). Evidence that task performance should be distinguished from contextual performance. Journal of Applied Psychology, 79, 475–480. Myers. D. G. (2000). The funds, friends, and faith of happy people. American Psychologist, 55, 56-67. Naumann, E. (1993). Organizational predictors of expatriate job satisfaction. Journal of International Business Studies, 24, 61-80. Orpen, Christopher (1995). Employee Job Performance and Relations with Superior as moderators of the effect of appraisal goal setting on employee work attitudes. International Journal of Career Management, 7(2), 3-6. Salanova, M., Bakker, A.B., & Llorens, S. (2006). Flow at work: Evidence for an upward spiral of personal and organizational resources. Journal of Happiness 43.
(52) Studies, 7, 1-22. Salanova, M., Agut, S., & Peiro´, J. M. (2005). Linking organizational resources and work engagement to employee performance and customer loyalty: The mediation of service climate. Journal of Applied Psychology, 90, 1217–1227. Scandura, T. A., & Lnkau, M. J. (1997). Relationships of gender, family responsibility and flexible work hours to organizational commitment and job satisfaction. Journal of Organizational Behavior, 18, 377-391. Schaufeli, W. B., & Bakker, A. B. (2004). Job demands, job resources, and their relationship with burnout and engagement: A multi-sample study. Journal of Organizational behavior, 25, 239-315. Schaufeli, W.B., Bakker, A.B., & Salanova, M. (2006). The measurement of work engagement with a short questionnaire: A cross-national study. Educational and Psychological Measurement, 66, 701–716. Schaufeli, W.B., Martinez, I., Marques-Pinto, A., Salanova, M., & Bakker, A.B. (2002b). Burnout and engagement in university students: A cross national study. Journal of Cross-Cultural Psychology, 33, 464–481. Schaufeli, W.B., Salanova, M., Gonzalez-Roma, V., & Bakker, A.B. (2002a). The measurement of engagement and burnout: A confirmative analytic approach. Journal of Happiness Studies, 3, 71–92. Shimazu, A., Schaufeli, W.B., Kosugi, S., Suzuki, A., Nashiwa, H., Kato, et al. (2008). Work engagement in Japan: Validation of the Japanese version of the Utrecht work engagement scale. Applied Psychology: An International Review, 57, 510-523. Singh, J., Verbeke, W., & Rhoads, G. K. (1996). Do organizational practices matter in role stress processes? A study of direct. and moderating effects for. marketing-oriented boundary spanners. Journal of Marketing, 60, 69-86. Sonnentag, S., & Frese, M. (2002). Performance concepts and Performance Theory. 44.
(53) In S. Snnentag (Ed), Psychological Management of Individual Performance (pp. 3-25): John Wiley & Sons, Ltd.,. Viswesvaran, C., Ones, D. S. and Schmidt, F. L. (2002). The moderating influence of job performance dimensions on convergence of supervisory and peer ratings of job performance: Unconfounding construct-level congruence and rating difficulty. Journal of Applied Psychology, 87, 345-354. Vroom, V. H. (1964). Work and motivation. New York: Wiley. Weiss, D. J., Dawis, R. V., England, G. W., & Lofquist, L. H. (1964). Construct validation studies of the Minnesota importance questionnaire. Minneapolis, MN: Industrial Relation Center, University of Minnesota. Weiss, D. J., Dawis, R. V., England, G. W., & Lofquist, L. H. (1967). Manual for the Minnesota satisfaction questionnaire. Minneapolis, MN: Industrial Relation Center, University of Minnesota.. 45.
(54) Appendix A : Questionnaire in Chinese 各位先進您好: 這是一份學術性的問卷,目的在探討員工在組織行為方面的議題,懇請您撥空填寫 此問卷,您的回答對本研究有重大幫助。本問卷採不記名方式填答,資料絕對保密。本 問卷答案並無所謂對錯,請依照您個人真實的感受填答,請不要忘記每一題都必須作 答。謝謝您抽空填寫此問卷,感謝您的參與,謹此獻上最高敬意。 敬祝 身體健康,萬事如意 國立高雄大學經營管理研究所 指導教授:吳毓麒 博士 研 究 生:盧淑娟 謹致 第一部分: 本部分希望了解您對目前工作的心理感受。依照您的實際感受勾選一個答案以代 表您目前感受到的狀況。請務必回答每一題。 非 不 普 常 不 滿 滿 意 意 通. 滿. 非 常. 意. 滿 意. 1.. 我對目前工作的忙碌程度感到滿意。…………………………. □. □. □. □. □. 2.. 這個工作能賦予我單獨發揮能力的機會。……………………. □. □. □. □. □. 3.. 這個工作讓我有機會做不同事情而有助於未來發展。………. □. □. □. □. □. 4.. 我的工作能讓我在公司裡享有特別的地位。…………………. □. □. □. □. □. 5.. 我對主管對待下屬的方式感到滿意。…………………………. □. □. □. □. □. 6.. 我對主管做決定的能力感到滿意。……………………………. □. □. □. □. □. 7.. 我目前的工作能讓我不違背良心做事。………………………. □. □. □. □. □. 8.. 我覺得這個工作能提供我工作穩定性。………………………. □. □. □. □. □. 9.. 我覺得在工作中有為別人做事的機會。………………………. □. □. □. □. □. 10.. 我對於在工作中有指導別人工作的機會感到滿意。…………. □. □. □. □. □. 11.. 我覺得我的能力和技術能與目前工作相符合。………………. □. □. □. □. □. 12.. 我對公司執行政策的方法感到滿意。…………………………. □. □. □. □. □. 13.. 與我的工作量相比,我對於我的薪水感到滿意。……………. □. □. □. □. □. 14.. 我覺得這工作能給我升遷的機會。……………………………. □. □. □. □. □. 46.
數據
+7
相關文件
prevocational) 、轉銜的工作訓練(transitional work training/vocational adjustment)、半 技術性的工作訓練(semi-skilled work training)、技術性的工作訓練(skilled
檢核表中的相關項度包含:主動工作、準時上下 班、不任意請假、工作專注、遵循操作程序、承 受壓力、接受工作變異等 7 項。對照職重系統來 看,主動工作可由表
• One technique for determining empirical formulas in the laboratory is combustion analysis, commonly used for compounds containing principally carbon and
Success in establishing, and then comprehending, Dal Ferro’s formula for the solution of the general cubic equation, and success in discovering a similar equation – the solution
專案執 行團隊
The present study explores the relationship between organizational reward system, job satisfaction, organizational citizenship behavior (OCB) and organizational performance to
The regression analysis results indicated that after the corporate image, service quality, satisfaction, perceived value and loyalty between each dimension and is
This is why both enterprises and job-finding people need a more efficient human resource allocation channels, and human resources websites are becoming a new media between the
